Article

Effect of Alkali Cation on Performance of Alkali-Activated Slag Mortar in Cold Environments

1
School of Materials Science and Engineering, Jiamusi University, Jiamusi 154007, China
2
School of Architectural and Civil Engineering, Jiamusi University, Jiamusi 154007, China
3
School of Science, Jiamusi University, Jiamusi 154007, China
4
School of Civil Engineering, Harbin Institute of Technology, Harbin 150090, China
*
Authors to whom correspondence should be addressed.
Separations 2022, 9(12), 450; https://doi.org/10.3390/separations9120450
Submission received: 11 November 2022 / Revised: 14 December 2022 / Accepted: 15 December 2022 / Published: 19 December 2022
(This article belongs to the Section Environmental Separations)

Abstract

:
Alkali-activated slag (AAS) is a promising cementing material for winter construction due to its continuous hydration at sub-zero temperature. In order to obtain a higher mechanical strength of AAS mortar in winter construction, the most efficient alkali activator should be selected. Potassium silicate and sodium silicate as alkaline activators of AAS mortar possess a high strength and hydration rate at ordinary temperature. Potassium silicate and sodium silicate as alkali activators showed different properties because of different alkali cations, so the effect of alkali cation on the performance of AAS mortar was studied at sub-zero temperature. The mechanical properties of potassium-silicate-activated AAS (K-AAS) mortar and sodium-silicate-activated AAS (N-AAS) mortar were thoroughly compared at the ambient temperatures of −10 °C, 0 °C, and 20 °C. The compressive and flexural strength of K-AAS mortar was increased by 130.4% and 72.3% at the age of 1 day and increased by 49% and 33.7% at the age of 28 days at the ambient temperature of −10 °C compared with N-AAS mortar. In order to reveal the mechanism behind the influence of different alkali cations on the mechanical properties of AAS mortar, the hydration heat, hydration products, and pore structures of AAS were characterized. The hydration heat exhibited that the rate of heat release and the cumulative heat release of K-AAS are higher than N-AAS, indicating the higher reaction degree of K-AAS. DTG/TG and ATR-FTIR spectra showed that K-AAS generated more gel product C(-A)-S-H compared with N-AAS at the same curing temperature. The MIP results exhibited that the porosity of K-AAS was lower than N-AAS. Finally, the mechanism explanation of the effect of alkali cation on the performance of AAS mortar was proposed. To sum up, potassium silicate should be selected as an alkali activator of AAS in winter construction.

1. Introduction

More than half of the regions in the world have to go through winter, and cold weather construction aims to speed up the progress of the project against sub-zero temperature. Cold weather construction is one of the toughest engineering practices because it is a balancing act of preventing frost damage to concrete and ensuring the required strength development. Ordinary Portland cement obviously cannot meet the winter construction requirements because the hydration of ordinary Portland cement is severely suppressed when the temperature drops to below 0 °C [1]. In addition, ordinary Portland cement has a large risk of frost damage in a negative temperature environment because the volume of water in concrete will expand 9% to break the microstructure of concrete when it turns into ice [2]. Taking protections such as building a warm shed, covering thermal storage, and insulation material are effective and safe methods to guarantee the normal hydration and avoid frost damage [3,4,5]. However, these complex operations will greatly increase the project cost. Therefore, a novel cementing material system with rapid strength development and convenient construction operations at sub-zero temperature is eagerly needed.
Geopolymer is a potential binder used in winter construction because of the lower freezing point of the alkali activator solution compared with water. AAS is one of the geopolymers; its composition materials include ground-granulated blast furnace slag (GGBS) and alkaline activator [6,7,8]. Using industrial waste GGBS to make AAS instead of Portland cement can reduce CO2 emissions, which is of great significance to environmental protection [9,10]. Potassium silicate or sodium silicate as alkaline activators of AAS possesses high strength by providing [SiO4]4− form with more gel product of C-(A)-S-H and accelerating the polymerization. Therefore, potassium silicate or sodium silicate as alkaline activators are appropriate for AAS used for cold weather construction. In addition, the freezing point of potassium silicate and sodium silicate solutions is significantly reduced to below 0 °C because of their abundant alkali components [11], providing favorable conditions for the polymerization of AAS at sub-zero temperature.
In recent years, some research has worked on the mechanical properties of AAS at negative temperature. Zhang et al. [12] studied the strength development of AAS mortar at −20~20 °C, and improved the strength by incorporating OPC. The results showed that OPC could effectively promote the hydration and hardening of AAS mortar. Ju et al. [13] used CaO to enhance the mechanical properties of AAS mortar at sub-zero temperature, and revealed the strengthening mechanism. Xiao et al. [14] investigated the influence of alkali equivalent, ambient temperature, Portland cement clinker, and fly ash on the strength of AAS cement concrete at 0~20 °C, and found that clinker could improve the early strength of AAS mortar, but it had a negative effect on the later strength. Wang [15] studied the influence of water content and ambient temperature in alkaline activators on the strength and setting time of AAS mortar, and pointed out that water content played a role in the polymerization reaction by affecting the depolymerization and polycondensation reaction rate. Ye et al. [11] investigated the strength development of alkali-activated tailings mortar at negative temperature, and carried out a freeze–thaw cycle test at −13~17 °C. It was found that the strength of AAS mortar could increase as long as the water was still in liquid form.
The hydration rate of AAS could be sharply reduced as the temperature dropped; in order to obtain higher mechanical strength of AAS mortar in winter construction, the most efficient alkali activator should be selected at sub-zero temperature. Potassium silicate and sodium silicate as alkaline activators of AAS mortar possess a high strength and hydration rate at ordinary temperature. The main factors affecting the excitation efficiency of potassium silicate and sodium silicate are the molarity of the hydroxides, modulus (Ms = SiO2/R2O), and type of alkali cation [16]. At present, there are still different conclusions about the influence of alkali cation type on the performance of alkali-activated materials. Some researchers believed that K+ is more advantageous than Na+ in the formation of geopolymer, due to the fact that geopolymer is more disordered and stronger when K+ participates in the polymerization process [17,18]. The other scholars hold different views; they believed that Na+ is more conducive to the formation of geopolymer. Na+ is more favorable for the dissolution of minerals compared to K+, and Na+ has better migration ability to generate polymerization products due to its smaller ionic radius [19,20]. However, the influence of K+ and Na+ on the properties of AAS mortar has not been studied at sub-zero temperature. In order to obtain higher mechanical strength of AAS mortar in winter construction, the most efficient alkali activator between potassium silicate and sodium silicate needs to be investigated and selected, and the mechanism behind the effect of potassium silicate and sodium silicate on the performance of AAS mortar at the ambient temperatures should be presented to better guide the performance-optimizing design of the AAS material system. This research is of great significance to promote the application of AAS in winter construction.
In this study, the influences of potassium silicate and sodium silicate on the setting time and mechanical properties of AAS mortar at the ambient temperatures of −10 °C, 0 °C, and 20 °C were studied to select the alkali activator with stronger excitation ability at sub-zero temperature. To reveal the mechanisms of activation ability difference between potassium silicate and sodium silicate at different temperatures, polymerization products, pore structures, and microstructure were characterized by applying thermogravimetic analysis (TGA), attenuated total reflection fourier transform infrared spectroscopy (ATR-FTIR), as well as mercury intrusion porosimetry (MIP) analyses.

2. Materials and Methods

2.1. Raw Materials and Mixing Propottion

GGBS was purchased from Benxi Iron and Steel Co., Ltd.; the chemical composition of GGBS is presented in Table 1 and the particle size distribution of GGBS is shown in Figure 1. The fine aggregate is sand, and its fineness modulus is 2.74. Potassium silicate and sodium silicate solution were provided by Guangzhou Suixin Chemical Industrial Company. The modulus (Ms = SiO2/K2O) of potassium silicate is 2.72, and its water content is 51.3%. The modulus (Ms = SiO2/Na2O) of sodium silicate is 3.3, and its water content is 66%. KOH (purity ≥ 85%) and NaOH (purity ≥ 96%) provided by Tianjin Dalu Chemical Reagent Company were used to tune the modulus of potassium silicate and sodium silicate.
Potassium silicate solution and KOH were completely dissolved in water to form the alkaline activator solution of potassium silicate, and then cooled down to room temperature for 1 day. The preparation method of the sodium silicate activator solution was the same as potassium silicate. The moduli of both the potassium silicate activator solution and sodium silicate activator solution were 1.5, and their alkali metal cation concentrations were 4 M/L. In terms of the mix proportions of the AAS mortar, the water-to-GGBS ratio used for all the mixtures in this study was 0.45. The mass ratio of GGBS to sand was 0.5.

2.2. Methods

Solid components (GGBS and sand) were mixed in cement mortar mixer for 4 min, and then the solid components and the alkaline activator solution were re-mixed for 4 min to form AAS mortar. Subsequently, the mixtures were cast into a 40 mm × 40 mm × 160 mm plastic mold and placed into a curing box at temperatures of −10 °C, 0 °C, and 20 °C. During the curing process, the specimens were demolded after 24 h, and then wrapped with plastic bags and put back in the curing box for the remaining curing ages. The AAS with potassium silicate and sodium silicate as alkaline activators were named K-AAS and N-AAS, respectively. The mix proportion the of K-AAS and N-AAS mortar are shown in Table 2.
According to the JGJ/T 70-2009 standard, the setting time was tested by a penetration resistance meter [21]. The time when the penetration resistance reached 15 N was the setting time. For compressive and flexural strength tests, the specimens were conducted by a microcomputer automatic cement compressive and flexural testing machine after curing for 1 day, 3 days, 7 days, 14 days, and 28 days, respectively. The hydration heat flow was obtained by isothermal calorimetry (TAM Air) during the 72 h after mixing. Thermogravimetic analysis (TGA) was tested by Netzsch STA 409 PC DSC-TGA equipment; the heating temperature range was 20~1000 °C, and the heating speed was 10 °C/min. ATR-FTIR analysis was tested by Thermo-NICOLET-iS10; the resolution and scanning range were 4 cm−1 and 400–3000 cm−1. To compare the test results of different groups, 40 wt% potassium sulfocyanate of the sample was added as the internal standard substance [22]. Pore size distribution was accomplished by Auto Pore IV 9510 MIP, and the pressure range was from 0 to 60,000 psi.

3. Results and Discussion

3.1. Setting Time

Figure 2 shows the setting time of K-AAS mortar and N-AAS mortar cured at −10 °C, −5 °C, 0 °C, 5 °C, and 20 °C, respectively. As can be seen from Figure 2, the setting time of K-AAS mortar is shortened from 65 min to 30 min with the decreasing temperature from −10 °C to 20 °C, whereas the setting time of N-AAS mortar is shortened from 98 min to 38 min with the decreasing temperature from −10 °C to 20 °C.
The setting time of K-AAS mortar is shorter than that of N-AAS mortar at −10 °C, −5 °C, 0 °C, 5 °C, and 20 °C, respectively. The conclusion is consistent with the result reported by the literature [23], and the gap of setting time between K-AAS and N-AAS decreases as the temperature increases. When the curing temperature is −10 °C, the setting time of K-AAS is 65 min, whereas that of N-AAS is 98 min, and the gap of setting time is 33 min. The setting times of K-AAS and N-AAS are, respectively, 52 min and 65 min, and the gap of setting time is 13 min at 0 °C. At the temperature of 20 °C, the gap of the setting time between K-AAS and N-AAS is significantly diminished. To be specific, the setting time of K-AAS is 30 min, whereas that of N-AAS is 38 min, and the gap of setting time is only 8 min at 20 °C.

3.2. Mechanical Properties

Figure 3 shows the compressive and flexural strength development of K-AAS mortar and N-AAS mortar at −10 °C, 0 °C, and 20 °C. Figure 3 shows that the compressive and flexural strengths of K-AAS mortar are higher than that of N-AAS mortar in all curing ages within 28 days at −10 °C, 0 °C, and 20 °C. Figure 3e and f show that the compressive strengths of K-AAS mortar at 1 day, 7 days, and 28 days are 21%, 11.1%, and 20.7% higher than those of N-AAS at a temperature of 20 °C, respectively. Additionally, the flexural strengths of K-AAS mortar are, respectively, increased by 31.8%, 15.6%, and 21.6% compared with N-AAS at the same curing age. Figure 3a,b show that at a temperature of −10 °C, the 1-day compressive and flexural strengths of K-AAS mortar are 130.4% and 72.3% higher than those of N-AAS, the 7-day compressive and flexural strengths of K-AAS mortar are increased by 75.6% and 51.6%, and the 28-day compressive and flexural strengths of K-AAS mortar are, respectively, increased by 49% and 33.7% compared with N-AAS mortar.
Therefore, the strength of K-AAS mortar is significantly higher than that of N-AAS mortar at the early stage, and it also shows an advantage for increased strength at the later stage. Moreover, it can be found that the 1-day compressive and flexural strengths of K-AAS mortar are 130.4% and 72.3% higher than those of N-AAS at a temperature of −10 °C, and the corresponding increase of compressive and flexural strengths are 21% and 31.8% at 20 °C, respectively. Therefore, K-AAS mortar shows a more excellent increase of early-stage strength compared with N-AAS mortar at sub-zero temperature, indicating that K-AAS mortar has a greater application potential in cold weather construction.

3.3. Hydration Heat

The hydration heat flows of K-AAS and N-AAS are shown in Figure 4a. There are two peaks appearing for each sample during the early-age hydration process. Both the wetting and dissolving process of GGBS particles by alkaline activator solution and the reaction of Ca2+ with the [SiO4]4− are the reason for forming the first peak. The alkali activated reaction is the reason for forming the second peak [24,25]. Specifically, GGBS is gradually dissolved in alkali activator solution and releases Ca2+, Al3+, and [SiO4]4−, which leads to the formation of C(-A)-S-H gel.
The first peak of K-AAS emerged within 2 h, whereas for N-AAS, the first peak was delayed 28 min and the range of the peak became wider. This indicates that the wetting and dissolving process of potassium silicate on GGBS particles is more intense at the earliest stage of reaction, and the early polymerization reaction is faster.
The second peak of K-AAS emerged within 2~8 h, and the second peak of N-AAS appeared within 5~10 h. Moreover, the exothermic peak of K-AAS emerged earlier compared with N-AAS, but the peak intensity of N-AAS is higher. This indicates that the main reaction of K-AAS starts earlier than N-AAS, but K-AAS consumes a large amount of Ca2+ and [SiO4]4− in the early stage to form polymerization products, leading to weakening of the main reaction.
Figure 4b shows the cumulative hydration heat release of K-AAS and N-AAS; it can be noticed that the amount of cumulative hydration heat release of K-AAS is higher than that of N-AAS, indicating that K-AAS has a higher reaction degree compared with N-AAS.

3.4. Thermal Analysis

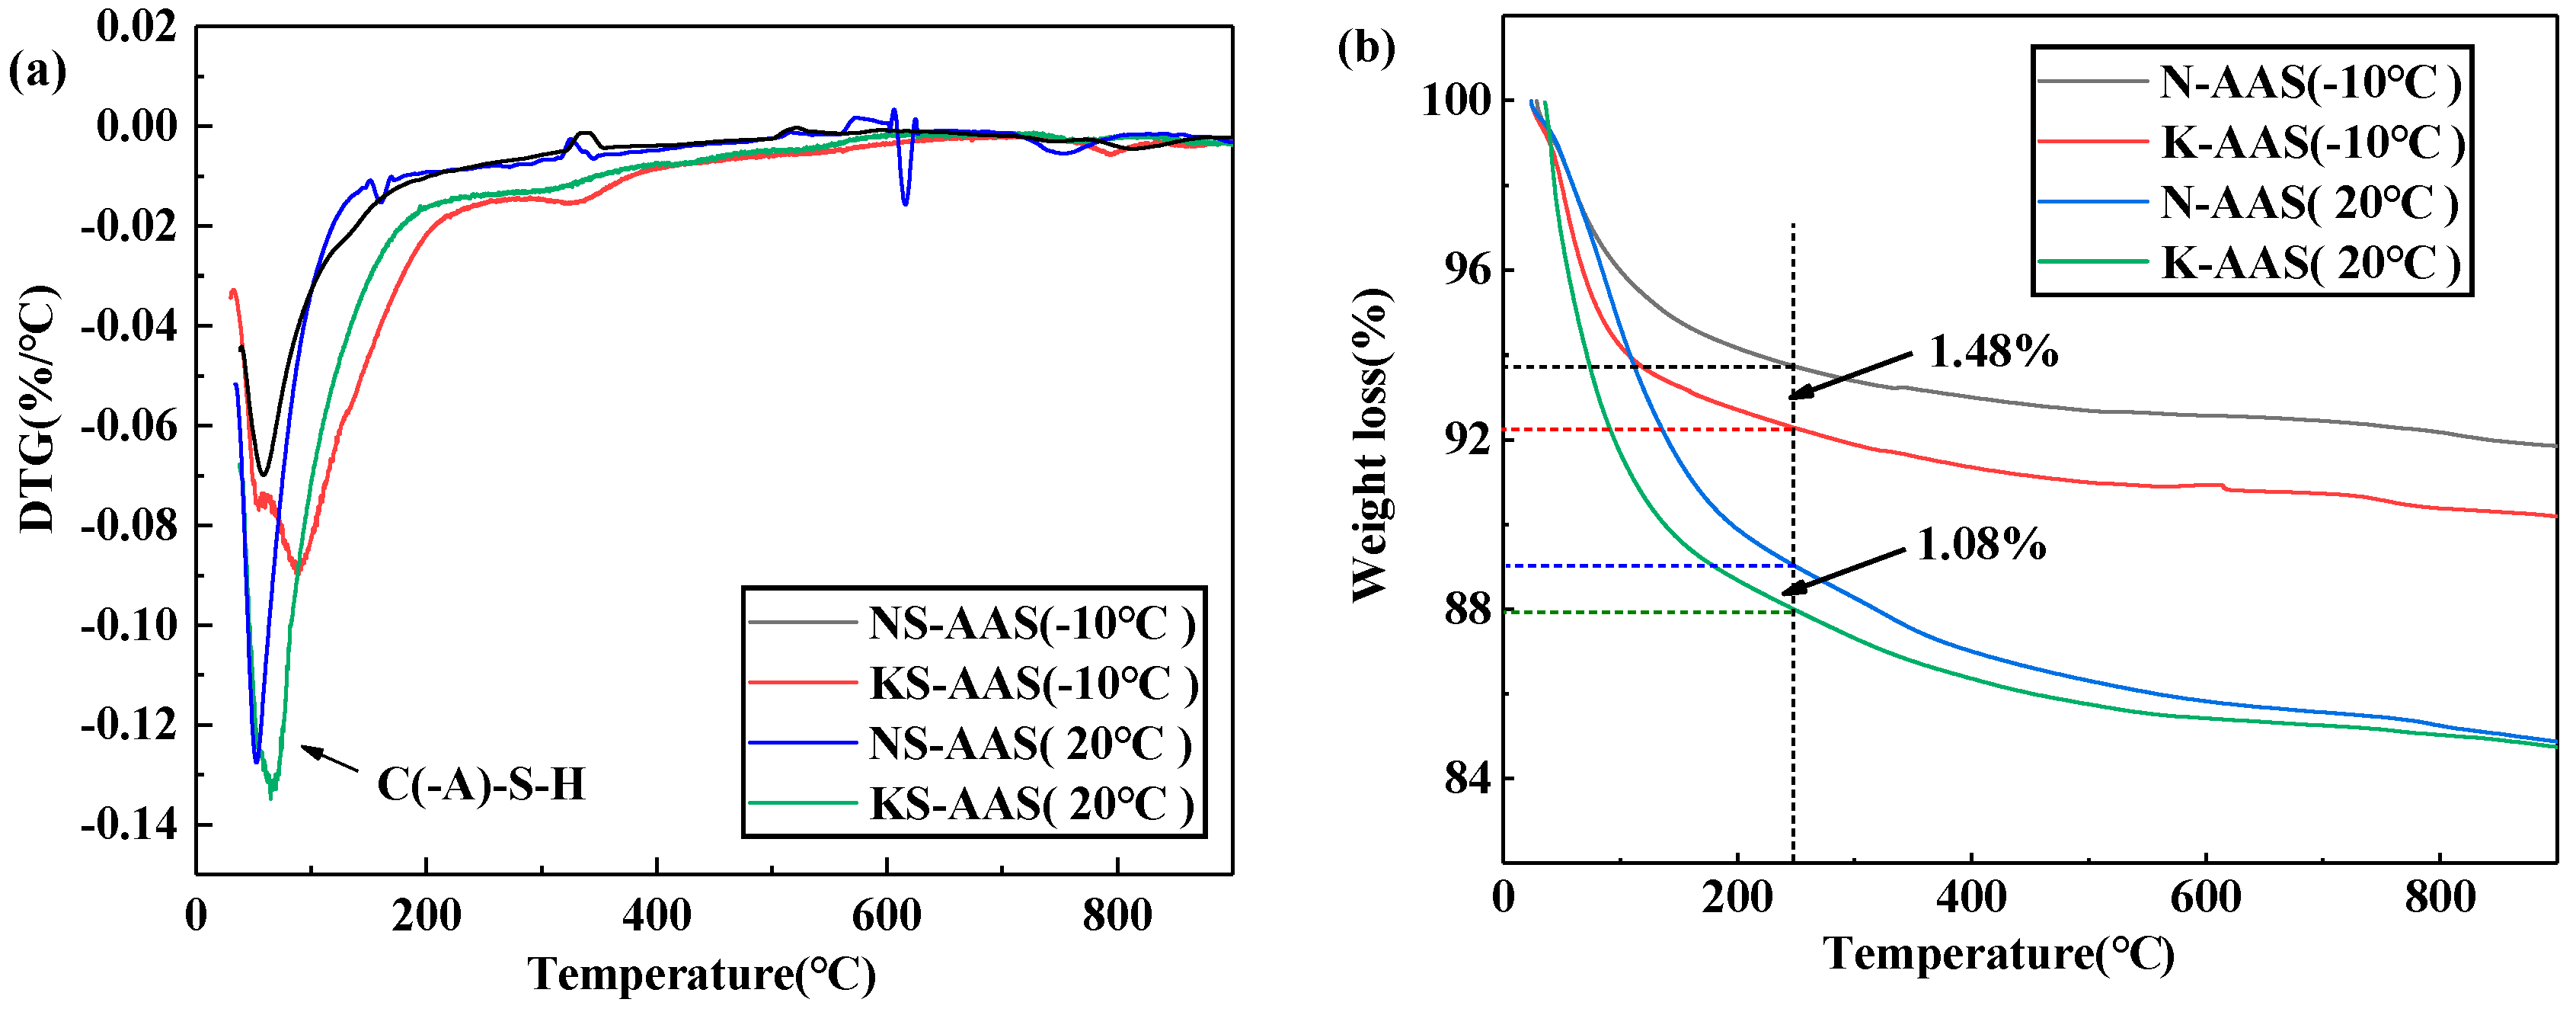
The DTG/TG results of K-AAS and N-AAS after curing for 7 days at −10 °C and 20 °C are shown in Figure 5. DTG/TG is a more accurate method to determine hydration product content.
The weight loss in each temperature range is considered to be the relative amount of the various hydration products [26,27,28]. In this study, 50~250 °C, 300~400 °C, 400~450 °C, 500~600 °C, and 600~800 °C represent the characteristic temperature ranges of C(-A)-S-H gel, Ht, Ca(OH)2, low-crystal CaCO3, and phase-containing CO32−, respectively. By analyzing the relationship between the weight loss of sample and the temperature, Figure 5a shows that the weight loss rate of K-AAS from 50 °C to 250 °C is more on the DTG curve. The weight loss is mainly due to the removal of binding water from the gel of C(-A)-S-H. In other words, the amount of C(-A)-S-H in the AAS sample is indicated by the weight loss.
According to the TG test results shown in Figure 5b, the difference of weight loss rates between the two samples is 1.08% when the curing temperature is 20 °C, whereas the difference of weight loss rates between the two samples is 1.48% when the curing temperature dropped to −10 °C. This difference gradually increased with the decreasing temperature.
The results show that temperature has a remarkable effect on the hydration process of AAS, and affects the generation of gel product C(-A)-S-H. As the temperature decreases, the excitation effect of potassium silicate is more remarkable than sodium silicate. This indicates that K+ is more beneficial to mechanical strength than Na+.

3.5. ATR-FTIR Spectrum

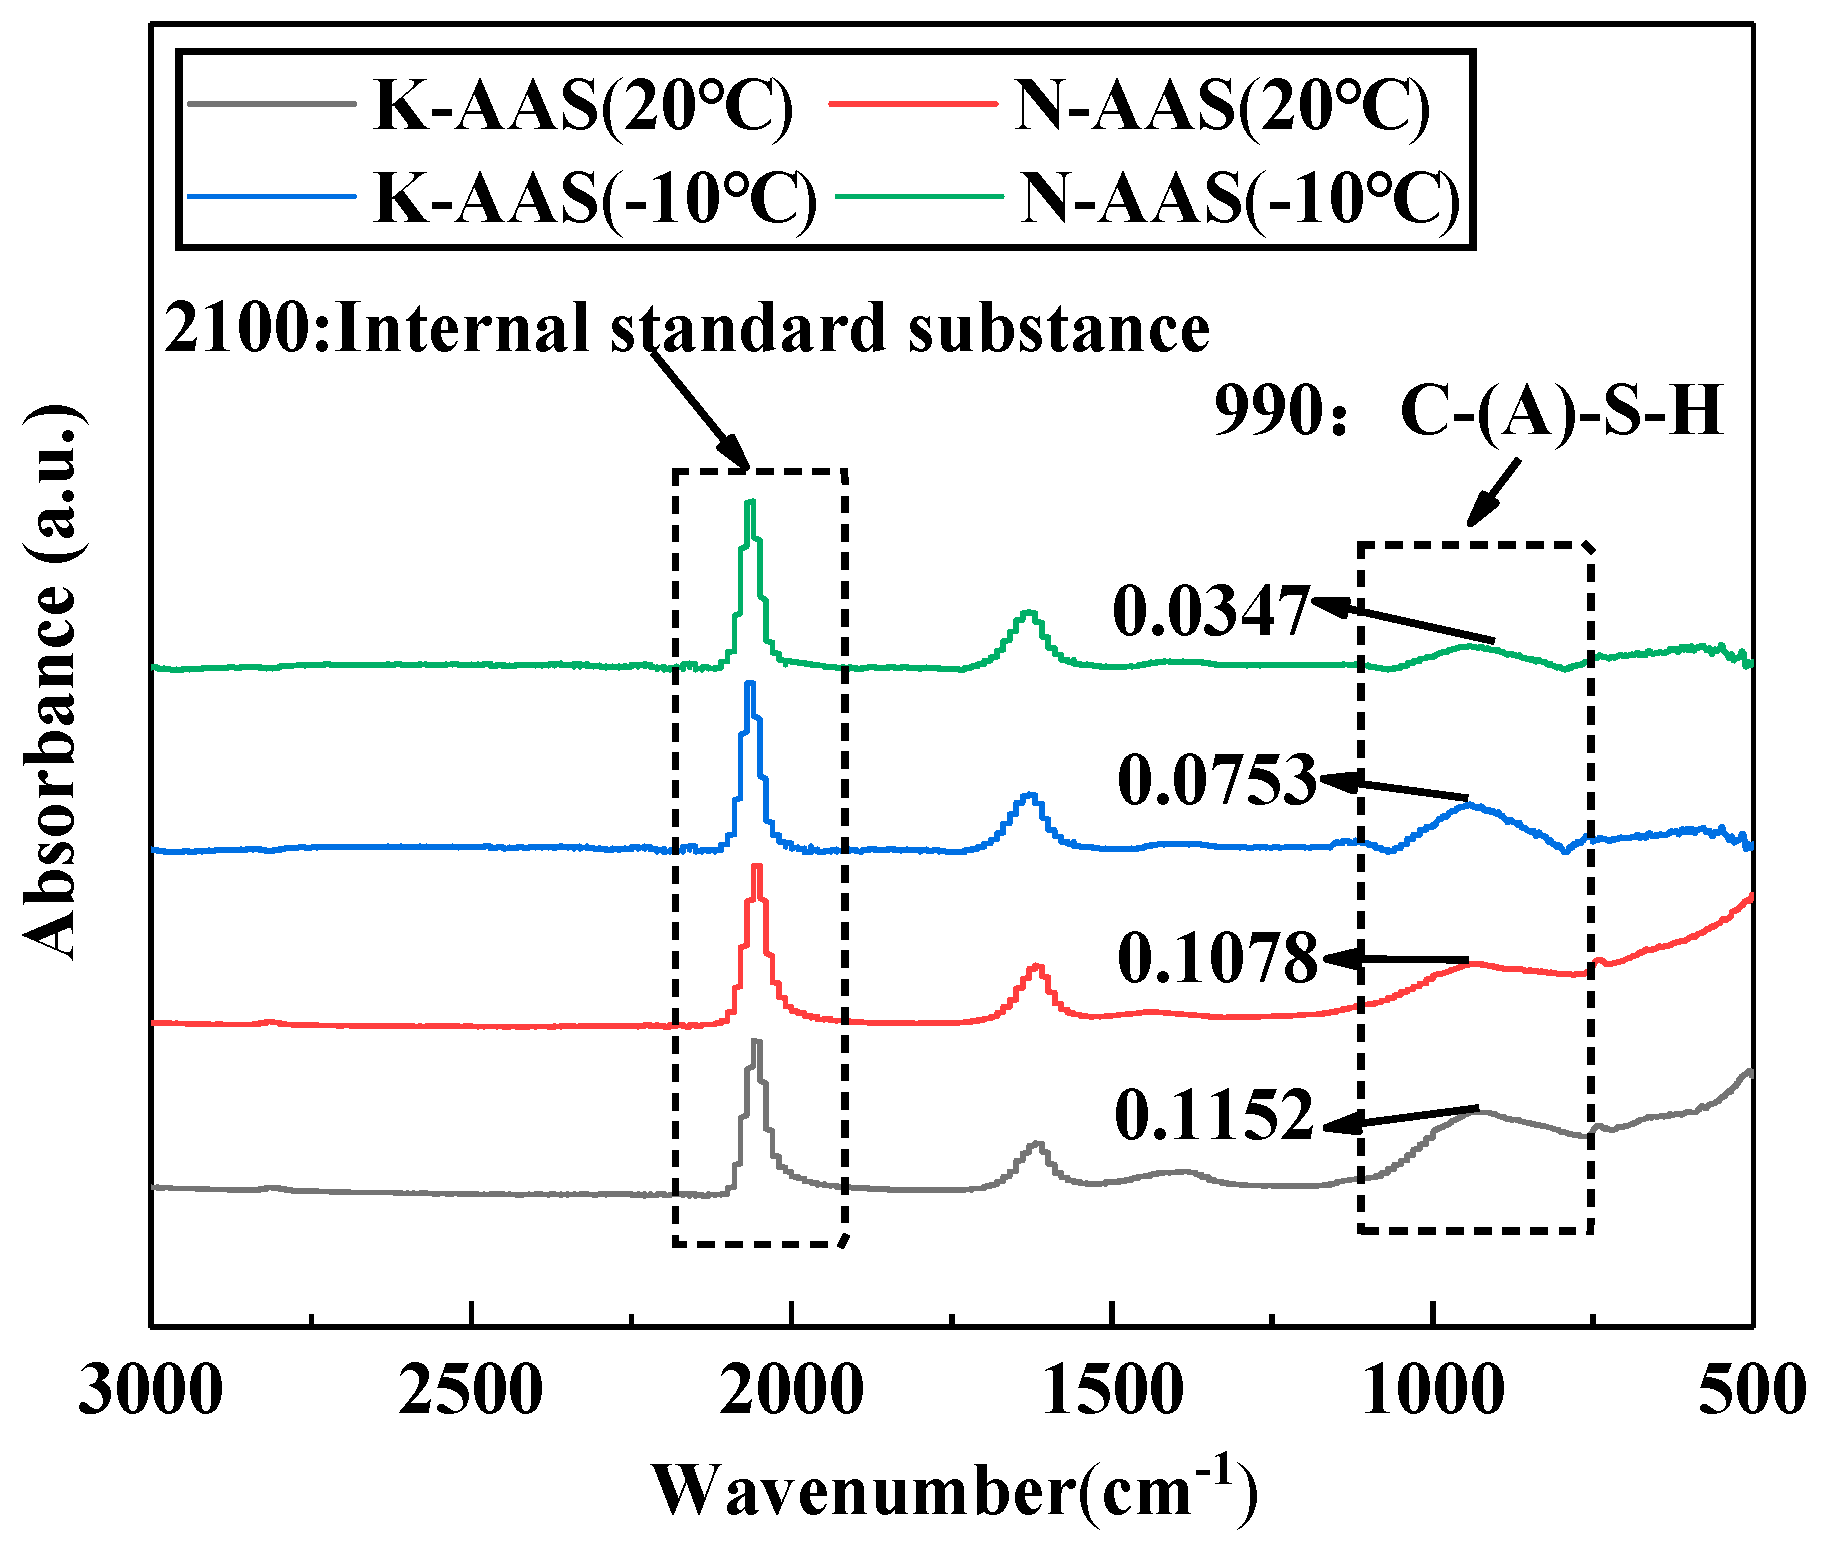
Figure 6 shows the results of ATR-FTIR spectra of AAS cured for 7 days at −10 °C and 20 °C. The absorption peak at 1650 cm−1 is due to the bending vibration of the O-H bond of water; it shows that AAS samples contain moisture [29]. The absorption peak of 990 cm−1 originates from the stretching vibration of long-chain Si-O within C(-A)-S-H gel. The characteristic peak of the internal standard substance is located at 2100 cm−1.
Figure 6 shows that the adsorption peak of the polymerization products of K-AAS and N-AAS is located at the same wave number, whereas their intensity is significantly different. As for AAS cured at 20 °C, the adsorption peak at around 990 cm−1 is relatively intensive compared with AAS cured at −10 °C, indicating a higher generation amount of polymerization products C(-A)-S-H of AAS cured at 20 °C. As the curing temperature drops to below 0 °C, the intensity of the characteristic peak of the polymerization products decreases obviously. This is mainly due to the fact that the rate of polymerization is significantly suppressed by lower temperature.
As shown in Figure 6, the characteristic peak intensity of the Si-O bond at 990 cm−1 for K-AAS is higher than that of N-AAS at 20 °C and −10 °C. When the curing temperature is 20 °C, the characteristic peak intensity of N-AAS is 0.1078, whereas that of K-AAS is 0.1152, and the peak intensity of K-AAS is 6.9% higher than that of N-AAS. As for the K-AAS and N-AAS samples cured at −10 °C, the characteristic peak intensity of N-AAS is 0.0347, while that of K-AAS is 0.0753; the characteristic peak intensity of K-AAS is 117% higher than that of N-AAS. The intensity difference of the characteristic peak of polymerization products between K-AAS and N-AAS indicates that K-AAS has formed more C(-A)-S-H gel.

3.6. Pore Structure

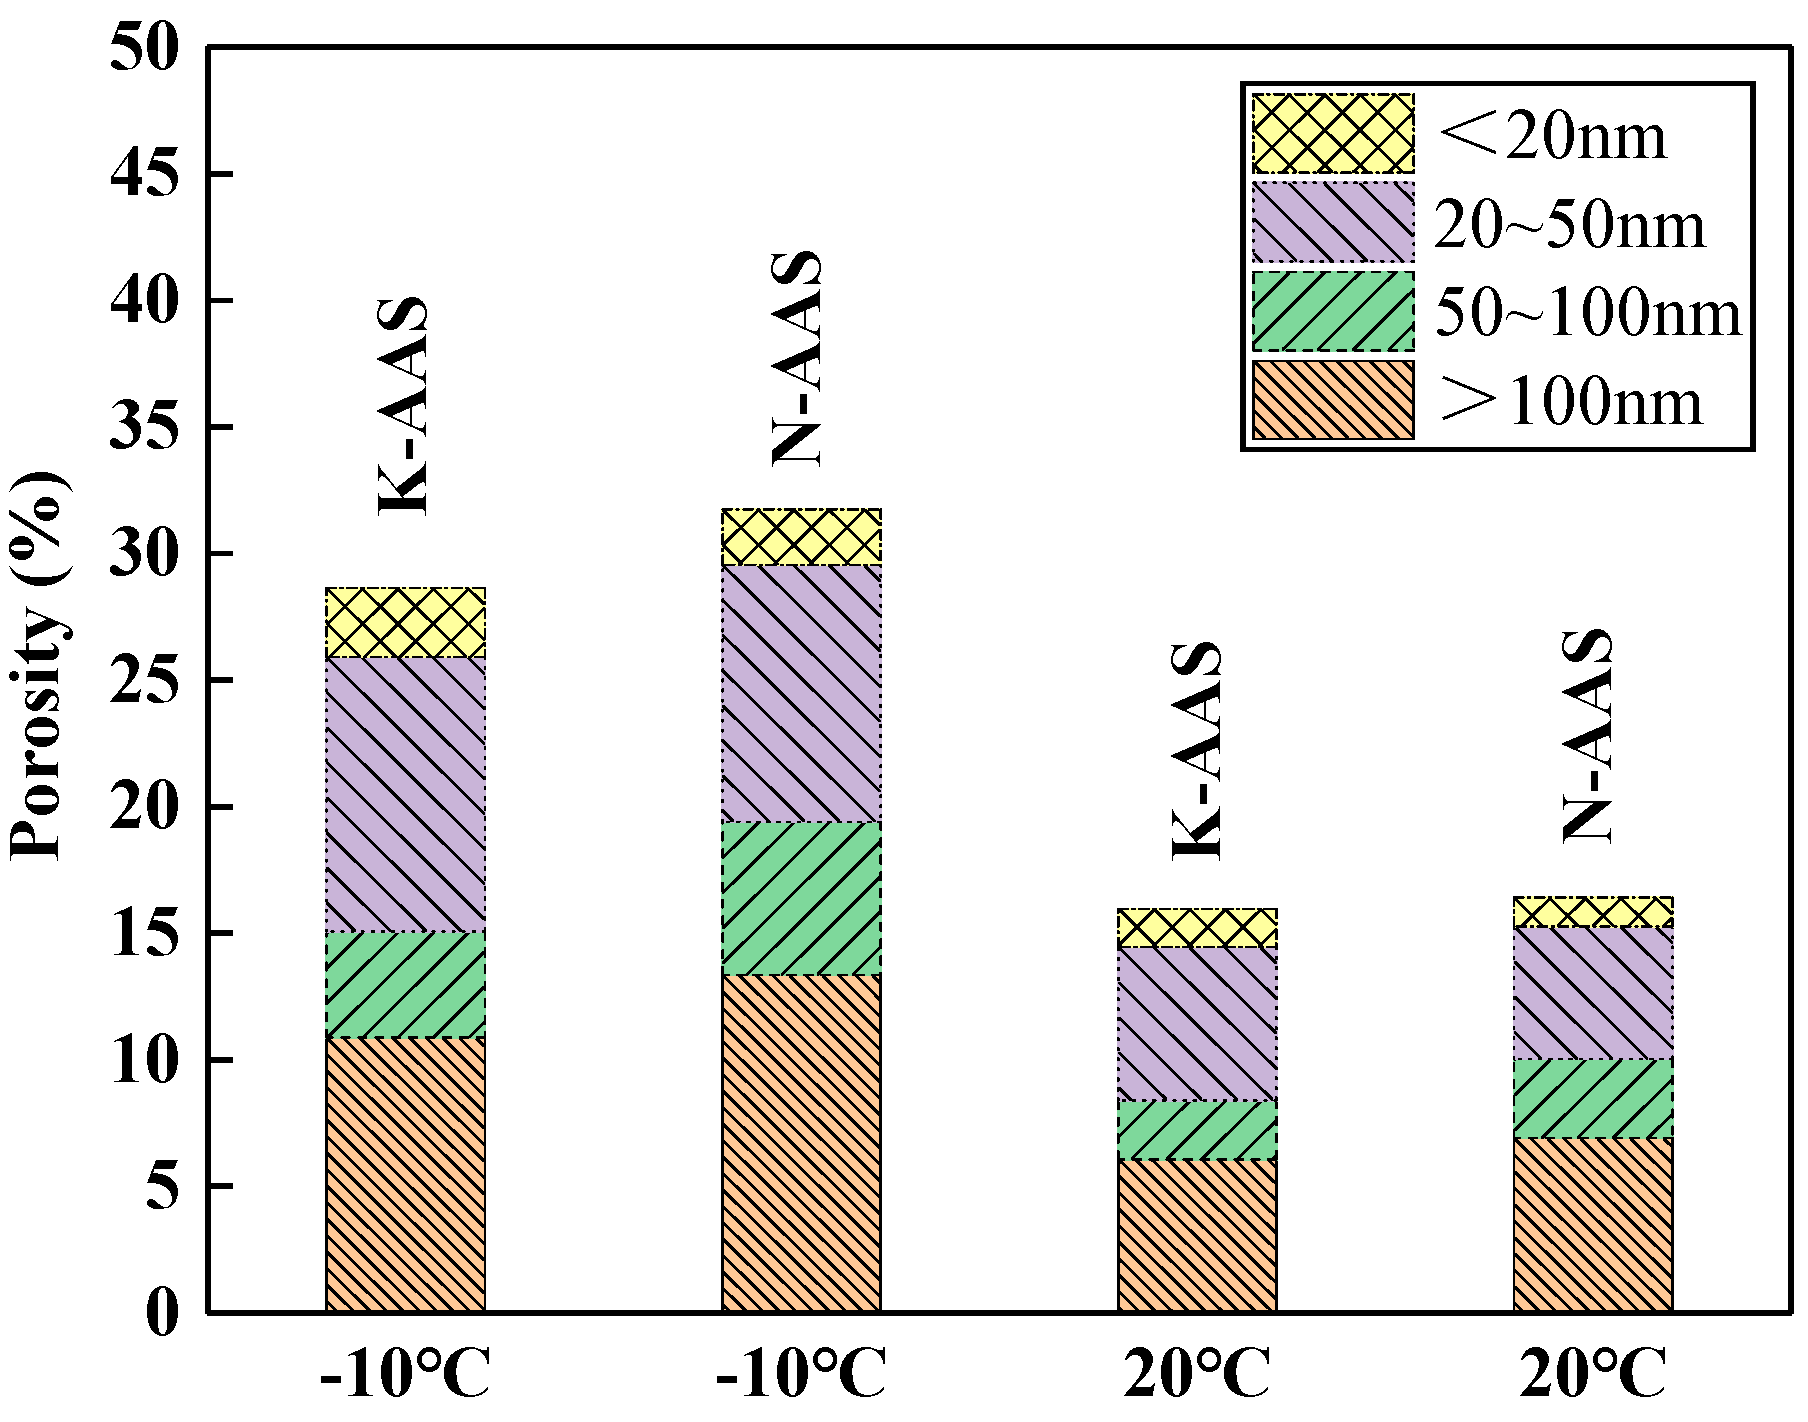
Figure 7 shows the total porosity and pore size distribution of K-AAS and N-AAS cured for 7 days at −10 °C and 20 °C. As for K-AAS and N-AAS cured at −10 °C, the percentage of the harmful pores with a pore size more than 100 nm is 10.88% and 13.35%, respectively. By contrast, for K-AAS and N-AAS cured at 20 °C, the percentages of the pores with a pore size more than 100 nm are only 6.07% and 6.9%, respectively.
Figure 7 shows that the total porosities of K-AAS and N-AAS are 15.97% and 16.39% at 20 °C, respectively, and those of K-AAS and N-AAS are 28.64% and 31.72% at −10 °C, respectively. It can be seen that the total porosity of K-AAS is lower than that of N-AAS at −10 °C and 20 °C. At the curing temperature of −10 °C, the total porosity of K-AAS is 3.08% lower than that of N-AAS. The total porosity of K-AAS is 0.42% lower than that of N-AAS at 20 °C. The deteriorated pore structure of K-AAS and N-AAS cured at −10 °C is due to the fact that the low curing temperature leads to the lower polymerization and loose structure of AAS. Potassium silicate activator has stronger excitation ability, and it has stronger polymerization ability, so more polymerization products of C(-A)-S-H are formed. The total porosity difference between K-AAS and N-AAS under a curing temperature of −10 °C is larger than that under a curing temperature of 20 °C. This indicates that K+ is more beneficial to the pore structure of AAS at sub-zero temperature.

3.7. Mechanisms

There are lots of alkali metal ions of R+ (K+ or Na+), and OH, SiO32−, Si(OH)4 appeared in the solution when R2SiO3 was dissolved in water [30]. The reaction formulas are as follows:
R2O·nSiO2+(2n+1)H2O → 2ROH+nSi(OH)4
ROH → R+ + OH
R2SiO3 → 2R+ + SiO32−
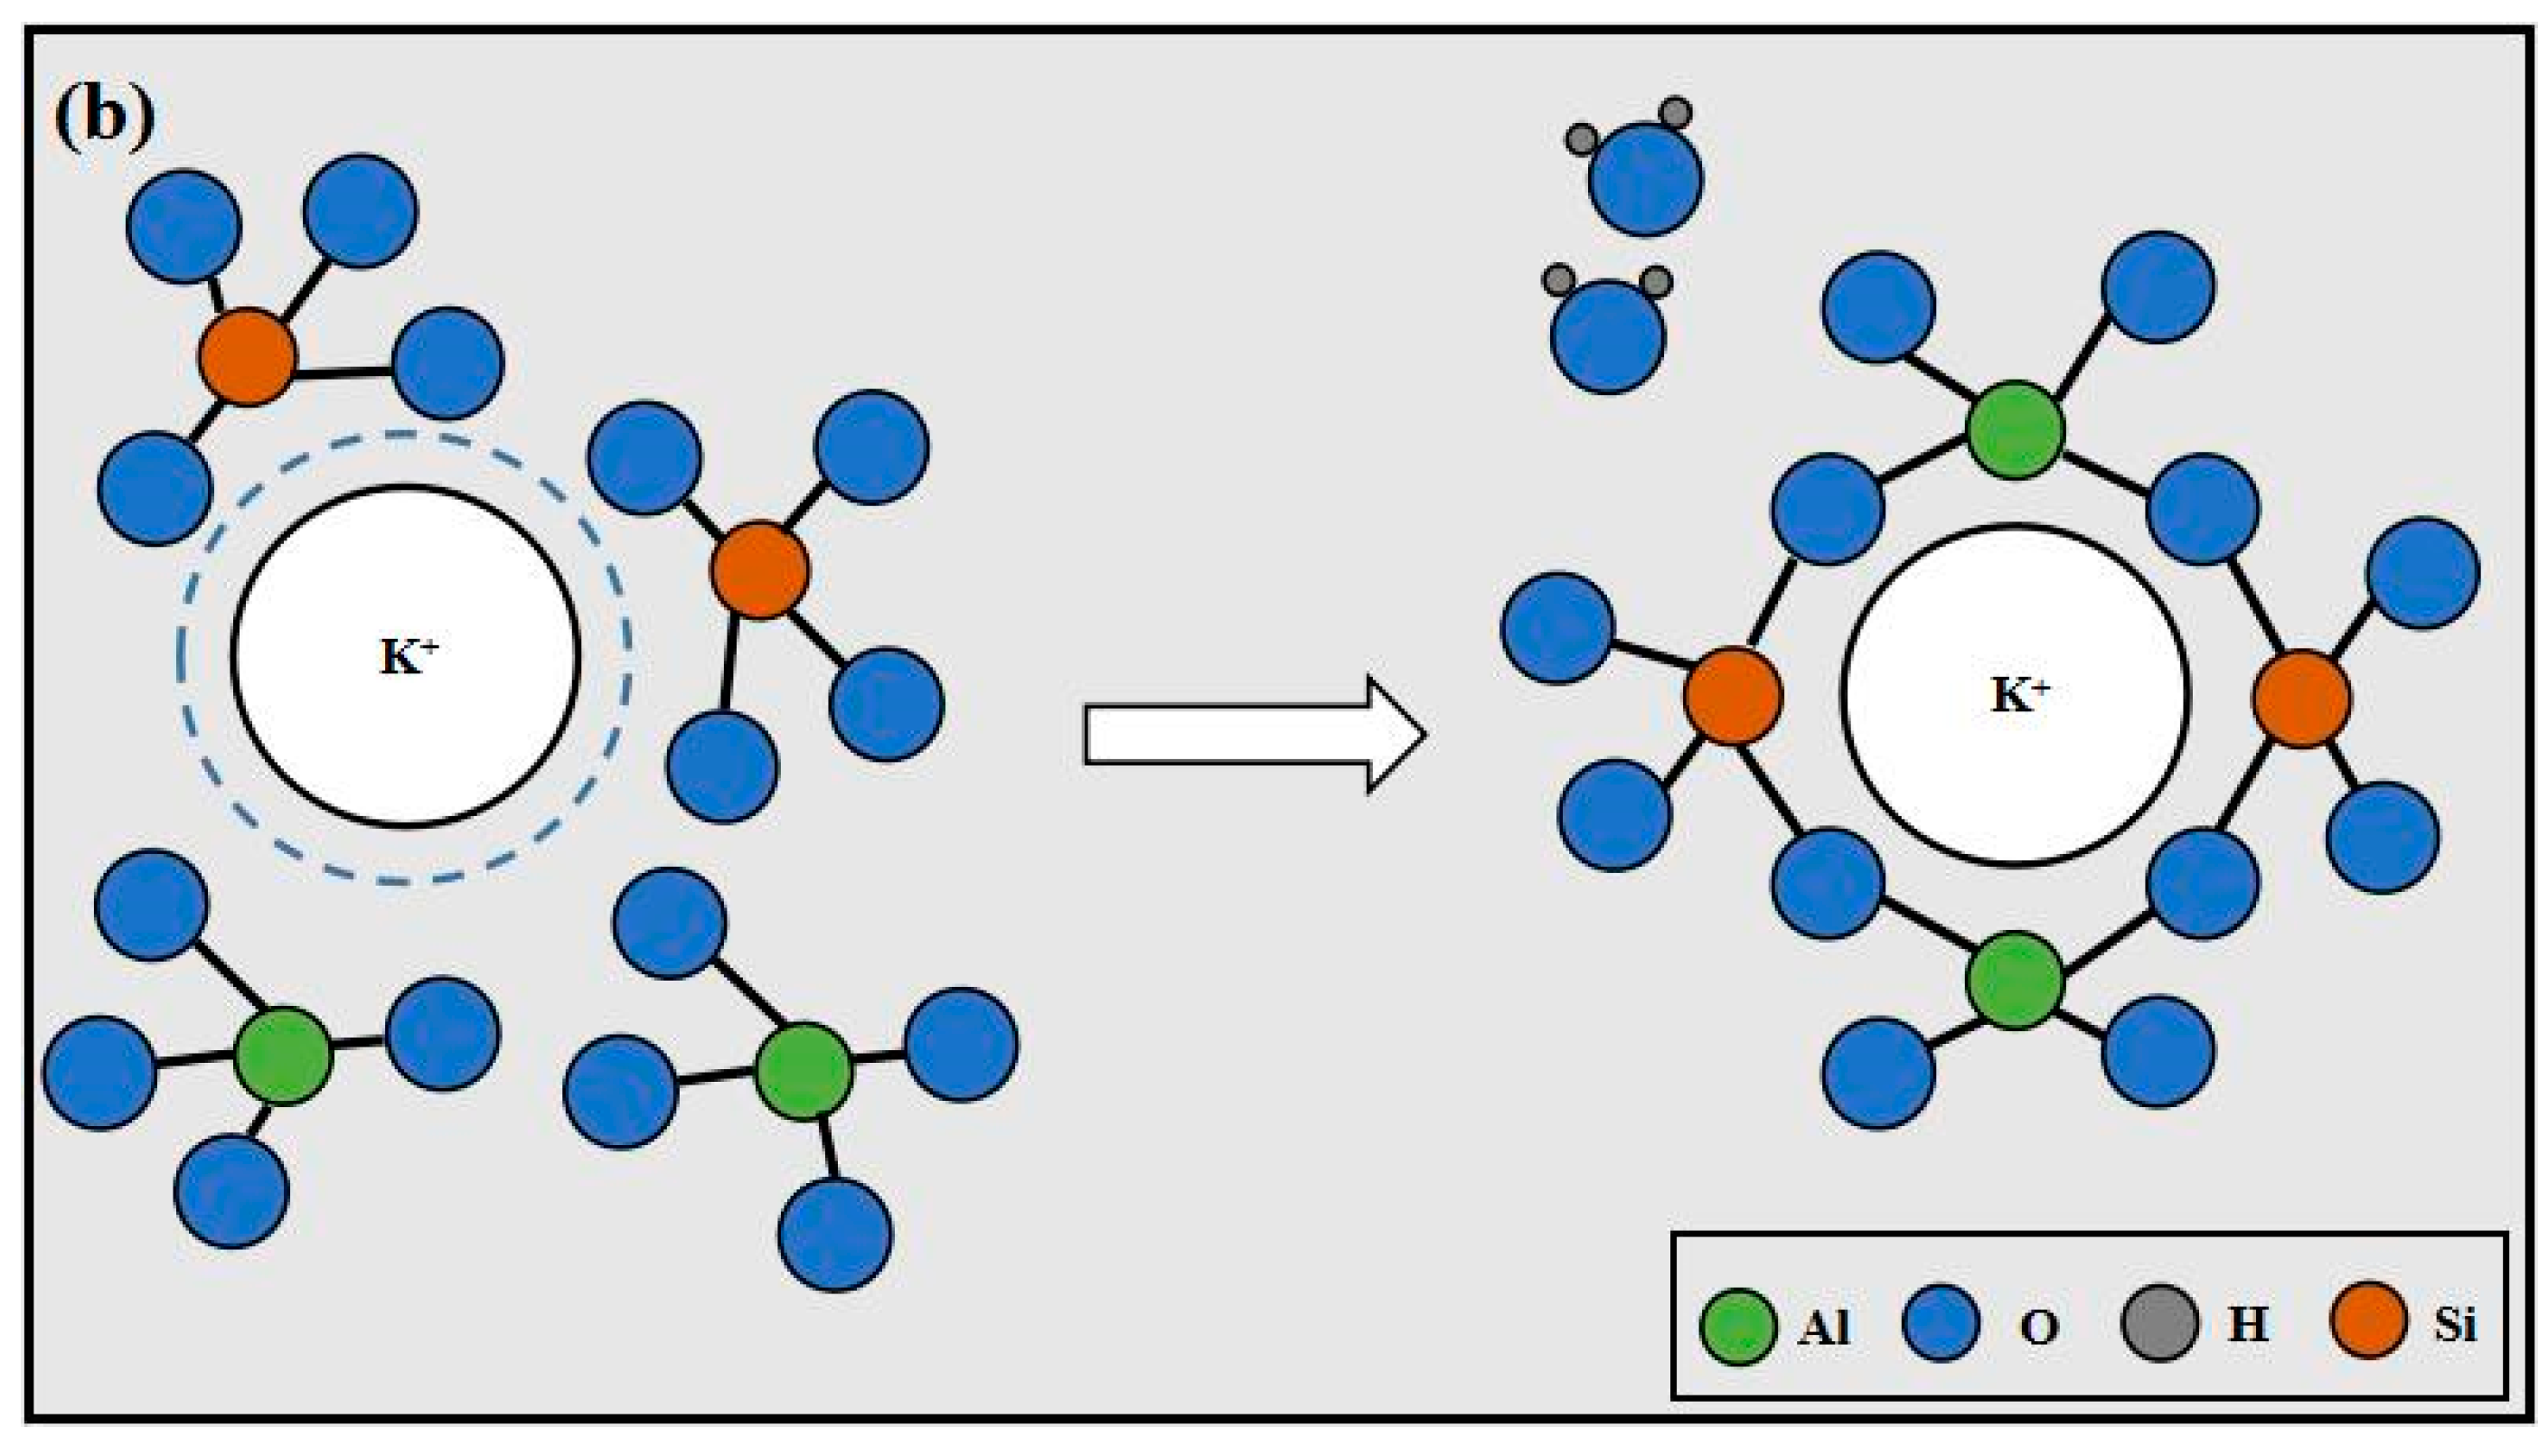
Ions will be hydrated with strongly polar water molecules in a solution of R2SiO3, and each ion is surrounded by a certain number of water molecules to be the hydrated ion. Water molecules as ligands bind to other particles by means of coordination bonds, and the number of water molecules is also determined by the coordination bonds. Therefore, the formation process of the hydrated cation is as follows: the water molecule contains positive and negative dipoles because it is the polar molecule, so the water molecule is adsorbed onto the cation to form a hydrated cation by coordination bonds, and its chemical molecular formulas are H3O+, [R(H2O)m]+ [31].
Glukhovsky and Krivenko explained the reaction mechanism behind alkaline activated calcium-rich silicon materials, and the chemical reaction equations are as follows [32,33]:
≡Si-O-Si + OH ↔ ≡Si-OH + ≡Si-O-
≡Si-O + R ↔ ≡Si-O-R
≡Si-O-R + OH ↔ ≡Si-O-R-OH
≡Si-O-R + OH + Ca2+ ↔ ≡Si-O-Ca-OH + R
The Si-O-Si of silicon oxide will be fractured in an alkaline environment. As the hydroxyl groups on the surface of silicon atoms are absorbed, the complex intermediate complexes are formed, but such intermediate complexes are not stable and will be broken into Si(OH)4 and ≡Si-O- under high-alkaline conditions. The fracture mode of Al-O-Si and Al-O-Al bonds are basically similar to Si-O-Si, and [Al(OH)4], [Al(OH)5]2−, and [Al(OH)6]3− are finally formed. The product of ≡Si-O- quickly binds with the metal cation because it is a negative-charged complex. It can be seen from the above reaction formula that the metal cation plays a catalytic role in the early stage of the hardening reaction, and Ca2+ in the GGBS is bound to a silica-branched chain by ion exchange, and the alkali metal cation R+ will be adsorbed into the structure at the late stage of the reaction [34,35].
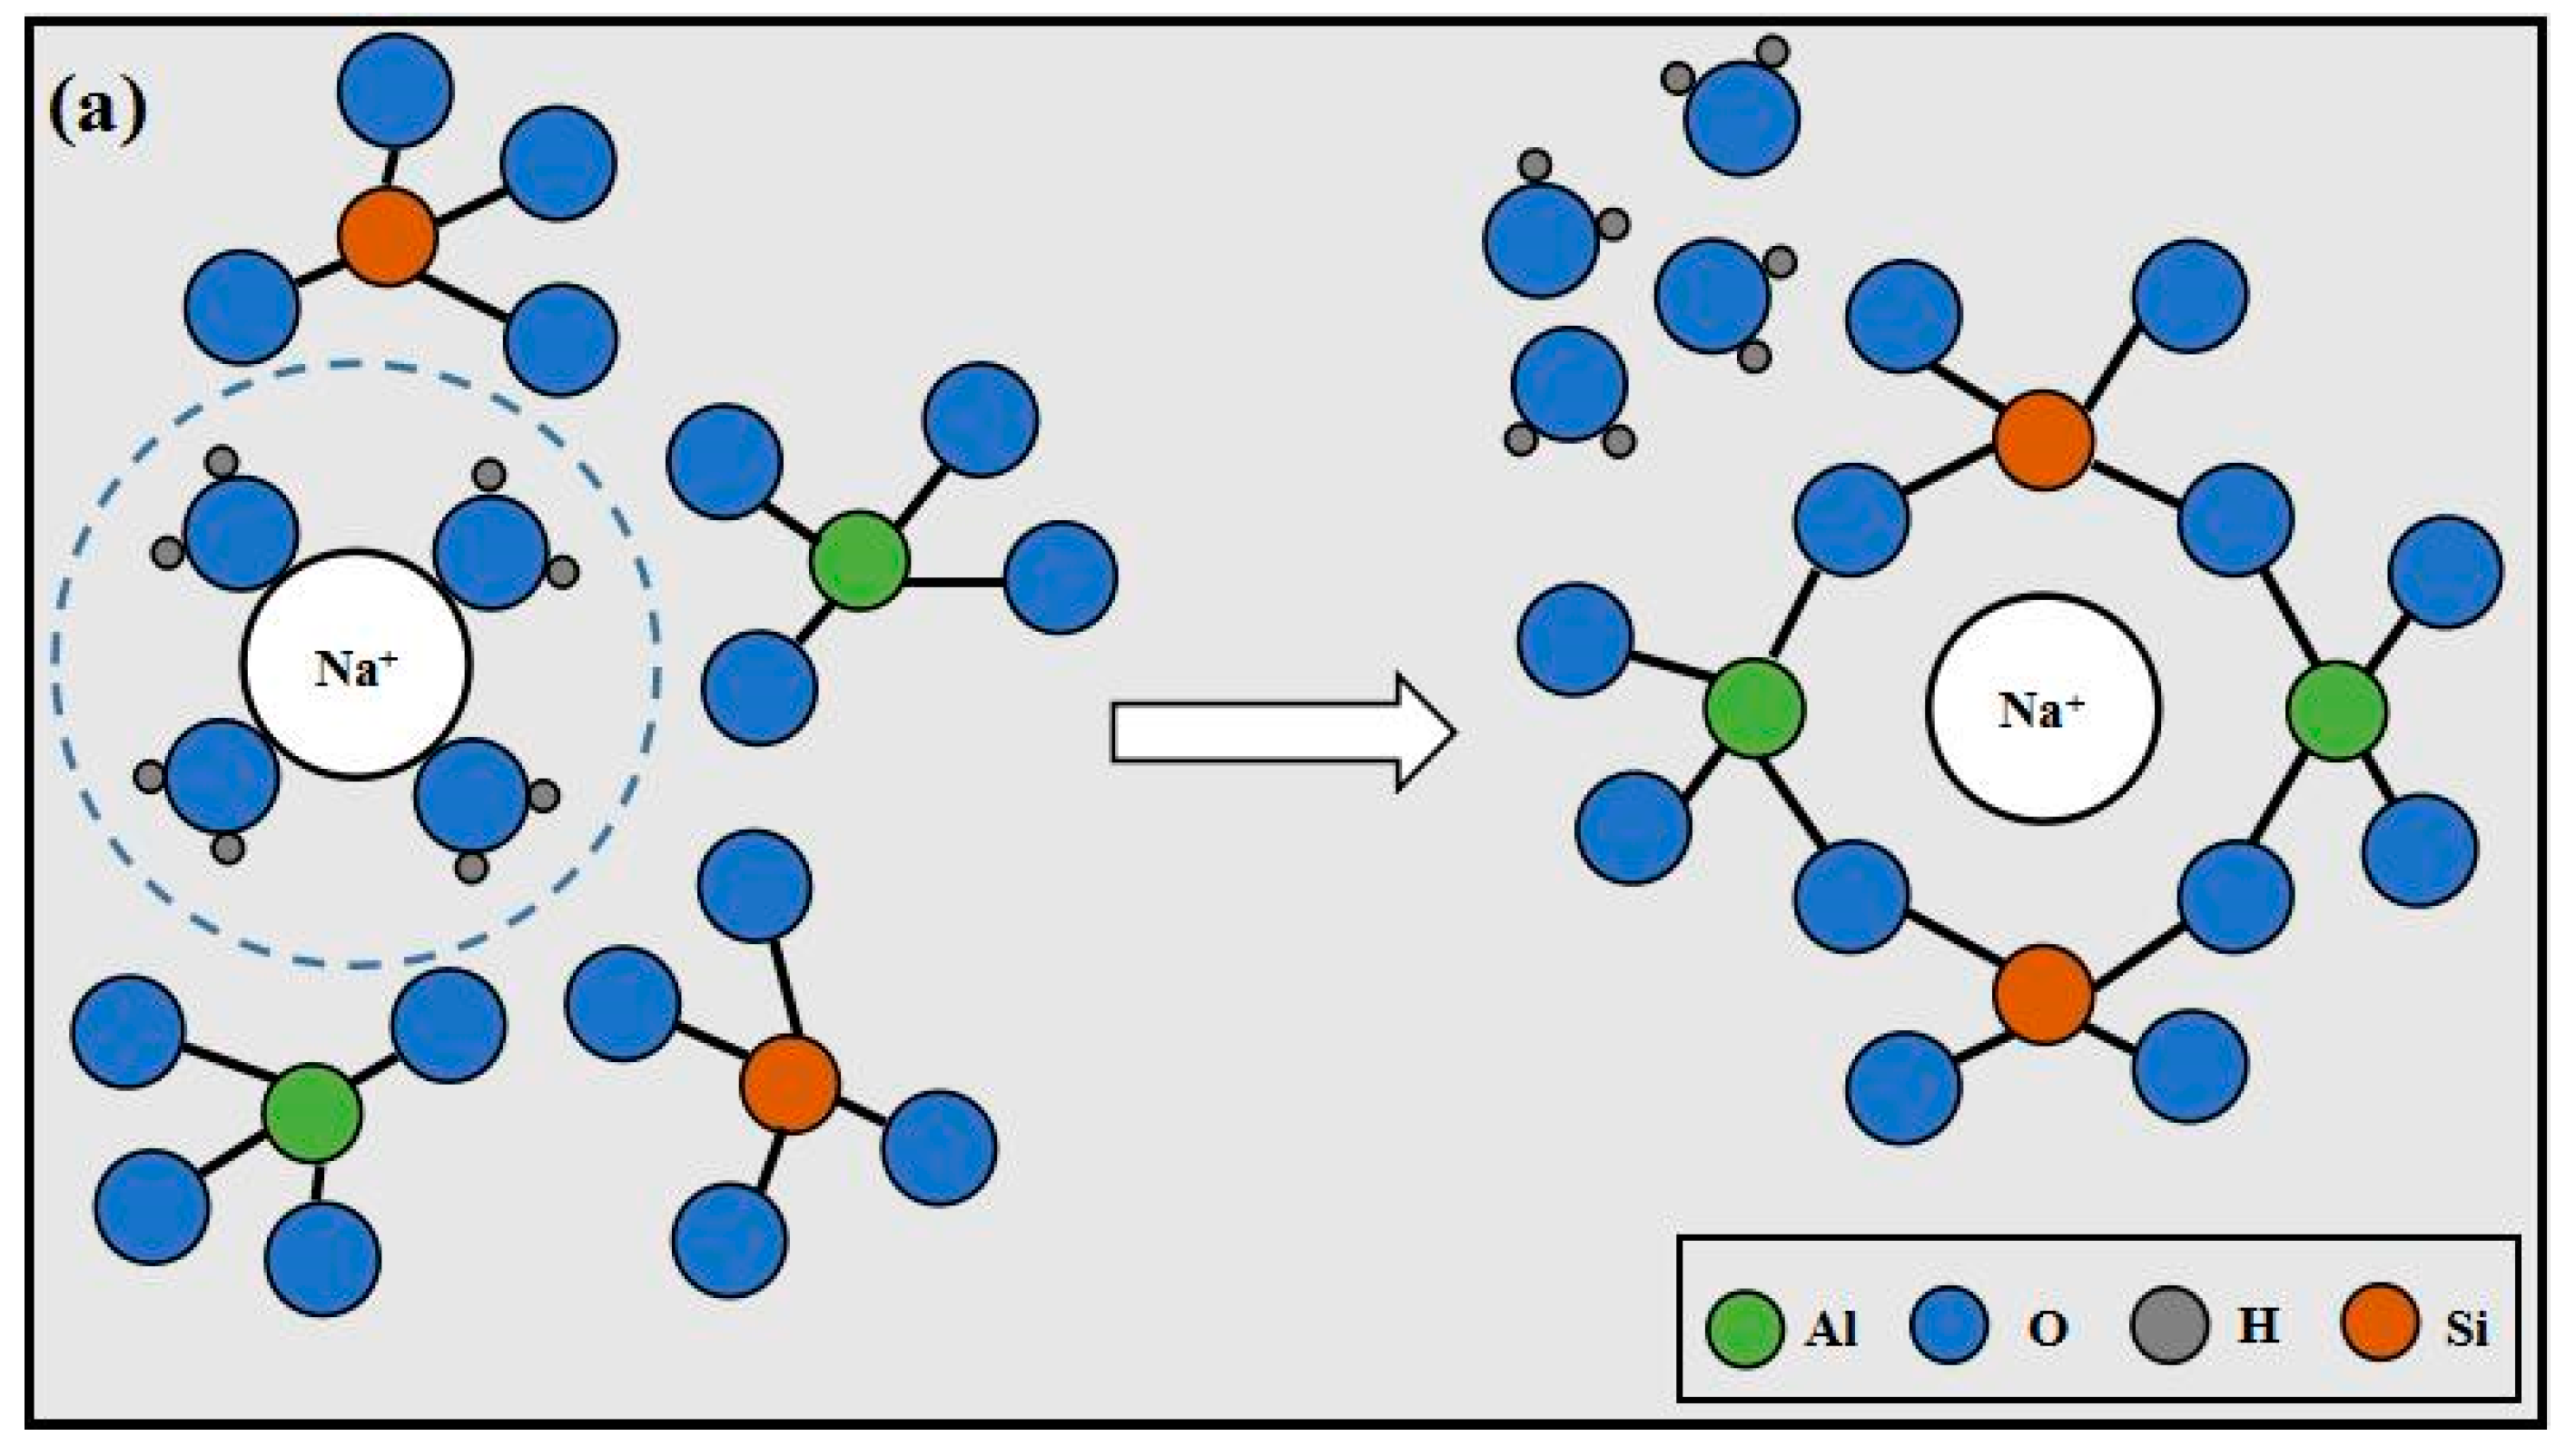
The electrostatic attraction of the alkali metal cation R+ to water molecules will increase as the charge density increases, and the ionic charge density increases as the ionic radius decreases. Table 3 shows that the surface charge density of K+ is less than that of Na+, and the electrostatic attraction of K+ to water molecules is lower than Na+, which is not as effective as Na+ in binding water molecules; it can directly interact with polar groups of others group chains in the system [36,37] (the principle is shown in Figure 8).
The ionic radius of K+ (13.3 nm) is bigger than that of Na+ (9.5 nm), but the hydrated ionic radius of K+ (33.1 nm) is smaller than that of Na+ (35.8 nm), as shown in Table 3. This indicates that the polymerization abilities of K+ and Na+ are different. The dipole moment of the water molecule increases as the temperature of the solution drops, and the affinity between water molecules and ions in the solution is enhanced. This leads to an increased combining ratio between alkali metal cation R+ and water molecules. As a result, the number of water molecules adsorbed on R+ will increase; that is, the thickness of the water film will increase [41].
In summary, the water film thickness of K+ is smaller than that of Na+; thus, K+ needs less heat to remove the water molecules. Therefore, the equivalent amount of heat can make more hydrated K+ take off the water film and participate in the polymerization reaction, generating more polymerization products to improve the mechanical strength of AAS.

3.8. Economic Evaluation

Table 4 shows the cost estimations of K-AAS mortar and N-AAS mortar, which were calculated from the mix proportion of the AAS mortar presented in Table 2. The unit price of all raw materials follows the current market price. It can be seen from Table 4 that the unit price of potassium silicate solution and KOH is relatively high compared with sodium silicate and NaOH. According to the calculation, the unit price of K-AAS mortar is 1.52 CNY/kg, which is slightly higher than 1.4 CNY/kg of N-AAS mortar.
Although the unit price of K-AAS mortar is 8.4% higher than that of N-AAS mortar, K-AAS mortar shows higher mechanical properties at sub-zero temperature. The compressive strengths of K-AAS mortar at 1 day and 28 days are 64% and 27% higher than those of N-AAS mortar at an ambient temperature of 0 °C, respectively. Moreover, the compressive strengths of K-AAS mortar are, respectively, increased by 49% and 34% compared with N-AAS mortar at 1 day and 28 days at an ambient temperature of −10 °C. It can be noticed that the percentage increase in the unit price of K-AAS mortar is much less than the percentage increase in its compressive strength, and this indicates that the K-AAS mortar has a good cost performance. Because of the higher compressive strength of K-AAS mortar, it can be applied to winter construction with a higher requirement for strength. Therefore, K-AAS mortar has wider application prospects compared with N-AAS mortar.

4. Conclusions and Future Prospects

The effect of potassium silicate and sodium silicate as alkali activators on the performance of AAS was investigated. The conclusions are as follows:
(1)
The setting time of K-AAS is shorter than that of N-AAS at sub-zero temperature. The early compressive and flexural strengths (1 day) of K-AAS mortar are 130.4% and 72.3% higher than those of N-AAS, the 7-day compressive and flexural strengths of K-AAS mortar increased by 75.6% and 51.6%, and the 28-day compressive and flexural strengths of K-AAS mortar, respectively, increased by 49% and 33.7% compared with N-AAS mortar at a temperature of −10 °C. Therefore, K-AAS mortar shows a more excellent increase of strength compared with N-AAS mortar at sub-zero temperature, indicating that K-AAS mortar has a greater application potential in weather construction.
(2)
The hydration heat flow and cumulative hydration heat release of K-AAS is higher than that of N-AAS, indicating that K-AAS has a higher reaction degree compared with N-AAS. DTG/TG and ATR-FTIR spectra show that K-AAS generate more gel product C(-A)-S-H compared with N-AAS at same curing temperature, and as the temperature decreases, the gap is more remarkable. The results show that K+ is more beneficial to mechanical strength than Na+.
(3)
The microstructure of K-AAS is denser than N-AAS at the same curing temperature because potassium silicate activator has stronger excitation ability and more products of C(-A)-S-H are formed. As the temperature decreases, the excitation effect of potassium silicate is more remarkable than sodium silicate. K+ is more beneficial to the refinement of pore structure of AAS at sub-zero temperature.
(4)
The existence form of K+ and Na+ is hydrated ions in the system, which is surrounded by a layer of water film, and the water film of Na+ is much thicker than that of K+. In order to participate in the reaction, K+ and Na+ must take off the water film by absorbing energy. Under the same energy applied, a greater quantity of K+ can take off the water film, and more alkali metal cations can participate in the reaction. This accelerates the polymerization reaction to enhance strength by generating more polymerization products.
The sub-zero temperature environment of this experiment was created by the constant temperature freezer in the laboratory; it is obviously different from the natural cold environments in winter, where the ambient temperature has large fluctuations during the day. Therefore, in order to promote the practical application of AAS mortar in winter construction, the influences of potassium silicate and sodium silicate on the mechanical properties and microstructure of AAS mortar in fluctuating sub-zero temperature environments need to be further studied in the future.

Author Contributions

Methodology, C.J., R.Y.; validation, C.J.; formal analysis, C.J., R.Y., Y.W., P.S., Y.L. and Y.Y.; investigation, Y.L. and Y.Y.; writing—original draft preparation, C.J.; writing—review and editing, Y.L.; supervision, Y.Y. All authors have read and agreed to the published version of the manuscript.

Funding

This research was funded by [the Fund of Basic Scientific Research Business Fee of Heilongjiang Provincial Colleges and Universities] grant number [No. 2019-KYYWF-1374].

Data Availability Statement

The data shown in this study are contained within the article.

Acknowledgments

Financial support from the Fund of Basic Scientific Research Business Fee of Heilongjiang Provincial Colleges and Universities (No. 2019-KYYWF-1374).

Conflicts of Interest

The authors declare no conflict of interest.

References

  1. Liu, J.; Li, Y.; Ouyang, P.; Yang, Y. Hydration of the silica fume-Portland cement binary system at lower temperature. Constr. Build. Mater. 2015, 93, 919–925. [Google Scholar] [CrossRef]
  2. Çullu, M.; Arslan, M. The effects of antifreeze use on physical and mechanical properties of concrete produced in cold weather. Compos. Part B 2013, 50, 202–209. [Google Scholar] [CrossRef]
  3. Krylov, B.A. Cold weather concreting. Book review. J. Cold Reg. Eng. 1999, 3, 213–216. [Google Scholar]
  4. Yu, K.; Jia, M.; Yang, Y.; Liu, Y. A clean strategy of concrete curing in cold climate: Solar thermal energy storage based on phase change material. Appl. Energy 2023, 331, 120375. [Google Scholar] [CrossRef]
  5. Liu, Y.; Sun, F.; Yu, K.; Yang, Y. Experimental and numerical research on development of synthetic heat storage form incorporating phase change materials to protect concrete in cold weather. Renew. Energy 2020, 149, 1424–1433. [Google Scholar] [CrossRef]
  6. Bakharev, T.; Sanjayan, J.G.; Cheng, Y. Alkali activation of Australian slag cements. Cem. Concr. Res. 1999, 29, 113–120. [Google Scholar] [CrossRef]
  7. Gruskovnjak, A.; Lothenbach, B.; Holzer, L.; Figi, R.; Winnefeld, F. Hydration of alkali-activated slag: Comparison with ordinary Portland cement. Adv. Cem. Res. 2006, 18, 119–128. [Google Scholar] [CrossRef]
  8. FernándezJiménez, A.; Puertas, F.; Palomo, J.G. Alkali-activated slag mortars: Mechanical strength behaviour. Cem. Concr. Res. 1999, 29, 1313–1321. [Google Scholar] [CrossRef]
  9. Sun, Q.; Li, T.; Liang, B. Preparation of a New Type of Cemented Paste Backfill with an Alkali-Activated Silica Fume and Slag Composite Binder. Materials 2020, 13, 372. [Google Scholar] [CrossRef] [Green Version]
  10. Mater, Y.; Kamel, M.; Karam, A.; Bakhoum, E. ANN-Python prediction model for the compressive strength of green concrete. Constr. Innov. 2021, 8, 145. [Google Scholar] [CrossRef]
  11. Jiayuan, Y.; Zhang Wensheng, Z.; Di, S.; Wang, H.; Wang, Z. Effect of Low-temperature Curing and Water Addition Method on Strength of Geopolymers Synthesized from Ore dressing Tailing of Bauxite. Bull. Chin. Ceram. Soc. 2013, 32, 537–541. [Google Scholar]
  12. Zhang, G.; Yang, H.; Ju, C.; Yang, Y. Novel selection of environment-friendly cementitious materials for winter construction: Alkali-activated slag/Portland cement. J. Clean. Prod. 2000, 258, 120592. [Google Scholar] [CrossRef]
  13. Ju, C.; Liu, Y.; Jia, M.; Yu, K.; Yu, Z.; Yang, Y. Effect of calcium oxide on mechanical properties and microstructure of alkali-activated slag composites at sub-zero temperature. J. Build. Eng. 2020, 32, 101561. [Google Scholar] [CrossRef]
  14. Xiao, X.; Ming, X.; Guang, X.; Jingting, L. The effect of different conditions on the strength of alkali slag concrete in low temperature. Constr. Des. Proj. 2017, 1007–9467, 10-0071-03. [Google Scholar]
  15. Wang, K. Reaction Mechanism and Applications of Alkali-Based Geopolymers at Low Temperature and Vacuum Conditions. Ph.D. Thesis, Guangxi University, Nanning, China, 2016. [Google Scholar]
  16. Lizcano, M.; Kim, H.S.M.; Basu, S.; Radovic, M. Mechanical properties of sodium and potassium activated metakaolin-based geopolymers. J. Mater. Sci. 2012, 47, 2607–2616. [Google Scholar] [CrossRef]
  17. Król, M.; Rożek, P.; Chlebda, D.; Mozgawa, W. Influence of alkali metal cations/type of activator on the structure of alkali-activated fly ash-ATR-FTIR studies. Spectrochim. Acta Part A Mol. Biomol. Spectrosc. 2018, 198, 33–37. [Google Scholar] [CrossRef]
  18. Kinrade, S.D.; Pole, D.L. Effect of alkali-metal cations on the chemistry of aqueous silicate solutions. Inorg. Chem. 1992, 31, 4558–4563. [Google Scholar] [CrossRef]
  19. Palomo, A.; Grutzeck, M.W.; Blancoa, M.T. Alkali-activated fly ashes: A cement for the future. Cem. Concr. Res. 1999, 29, 1323–1329. [Google Scholar] [CrossRef]
  20. Fernández-Jiménez, A.; Palomo, A.; Criado, M. Alkali-activated fly ash binders. A comparative study between sodium and potassium activators. Mater. Constr. 2006, 56, 51–55. [Google Scholar]
  21. Jiao, Z.; Wang, Y.; Zheng, W.; Huang, W. Effect of the activator on the performance of alkali-activated slag mortars with pottery sand as fine aggregate. Constr. Build. Mater. 2019, 197, 83–90. [Google Scholar] [CrossRef]
  22. Shao, Q.F.; Ming, D.; Chen, S.H.; Chao, W.; Xie, X.H. Study on quantitative analysis of cross linked copolymer by IR. Spectrosc. Spectr. Anal. 2008, 27, 2445–2447. [Google Scholar]
  23. Sindhunata, J.S.J.; van Deventer, G.; Lukey, C.; Xu, H. Effect of curing temperature and silicate concentration on fly-ash-based geopolymerization. Ind. Eng. Chem. Res. 2006, 45, 3559–3568. [Google Scholar] [CrossRef]
  24. Chang, J. A study on the setting characteristics of sodium silicate-activated slag pastes. Cem. Concr. Res. 2003, 33, 1005–1011. [Google Scholar] [CrossRef]
  25. Aydın, S.; Baradan, B. Effect of activator type and content on properties of alkali-activated slag mortars. Compos. Part B Eng. 2014, 57, 166–172. [Google Scholar] [CrossRef]
  26. Abdalqader, A.F.; Jin, F.; Al-Tabbaa, A. Characterisation of reactive magnesia and sodium carbonate-activated fly ash/slag paste blends. Constr. Build. Mater. 2015, 93, 506–513. [Google Scholar] [CrossRef]
  27. Gu, K.; Jin, F.; Al-Tabbaa, A.; Shi, B.; Liu, J. Mechanical and hydration properties of ground granulated blastfurnace slag pastes activated with MgO-CaO mixtures. Constr. Build. Mater. 2014, 69, 101–108. [Google Scholar] [CrossRef] [Green Version]
  28. Jin, F.; Gu, K.; Al-Tabbaa, A. Strength and hydration properties of reactive MgO-activated ground granulated blastfurnace slag paste. Cem. Concr. Compos. 2015, 57, 8–16. [Google Scholar] [CrossRef] [Green Version]
  29. Yu, P.; Kirkpatrick, R.J.; Poe, B.; Mcmillan, P.F.; Cong, X. Structure of Calcium Silicate Hydrate (C-S-H): Near-, Mid-, and Far-Infrared Spectroscopy. J. Am. Ceram. Soc. 2010, 82, 742–748. [Google Scholar] [CrossRef]
  30. Li, N.; Gu, H.; Zhao, H. Refractory; Metallurgical Industry Press: Beijing, China, 2010; pp. 305–309. [Google Scholar]
  31. Song, P. To from hydrated ion and to have an influence on the nature of inorganic salt. J. Qinghai Jr. Teach. Coll. 1998, 4, 62–64. [Google Scholar]
  32. Krivenko, P.V. Alkaline Cements. In Proceedings of the 9th International Congress on the Chemistry of Cements, New Delhi, India, 23 November–28 November 1992; Volume 4, pp. 482–494. [Google Scholar]
  33. Glukhovskii, V.D.; Pashkov, I.A. Starchevskaya E A, et al, Soil silicate concrete for hydraulic and irrigation structures. Hydrotech. Constr. 1967, 12, 120–124. [Google Scholar] [CrossRef]
  34. Arbin, K.; Palomo, A.; Jiménez, A.F. Alkali-activated blends of calcium aluminate cement and slag/diatomite. Ceram. Int. 2013, 39, 9237–9245. [Google Scholar] [CrossRef]
  35. Rovnaník, P. Effect of curing temperature on the development of hard structure of metakaolin-based geopolymer. Constr. Build. Mater. 2010, 24, 1176–1183. [Google Scholar] [CrossRef]
  36. Collins, K.D. Ions from the Hofmeister series and osmolytes: Effects on proteins in solution and in the crystallization process. Methods 2004, 34, 300–311. [Google Scholar] [CrossRef]
  37. Takano, M.; Ogata, K.; Kawauchi, S.; Satoh, M.; Komiyama, J. Ion-specific swelling behavior of poly (N-vinyl-2-pyrrolidone) gel: Correlations with water hydrogen bond and non-freezable water. Polym. Gels Netw. 1998, 6, 217–232. [Google Scholar] [CrossRef]
  38. Nightingale, E.R. Phenomenological theory of ion solvation, Effective radii of hydrated ions. J. Chem. Phys. 1959, 63, 1381–1387. [Google Scholar] [CrossRef]
  39. Jang, E.S.; Kamcev, J.; Kobayashi, K.; Yan, N.; Sujanani, R.; Dilenschneider, T.J.; Park, H.B.; Paul, D.R.; Freeman, B.D. Influence of water content on alkali metal chloride transport in cross-linked Poly(ethylene glycol) Diacrylate.1. Ion sorption. Polymer 2019, 178, 1–10. [Google Scholar] [CrossRef]
  40. Binder, H.; Zschornig, O. The effect of metal cations on the phase behavior and hydration characteristics of phospholipid membranes. Chem. Phys. Lipids 2002, 115, 39–61. [Google Scholar] [CrossRef]
  41. Gregory, J.K.; Clary, D.C.; Liu, K.; Brown, M.G.; Saykally, R.J. The water dipole moment in water clusters. Science 1997, 275, 814–817. [Google Scholar] [CrossRef]
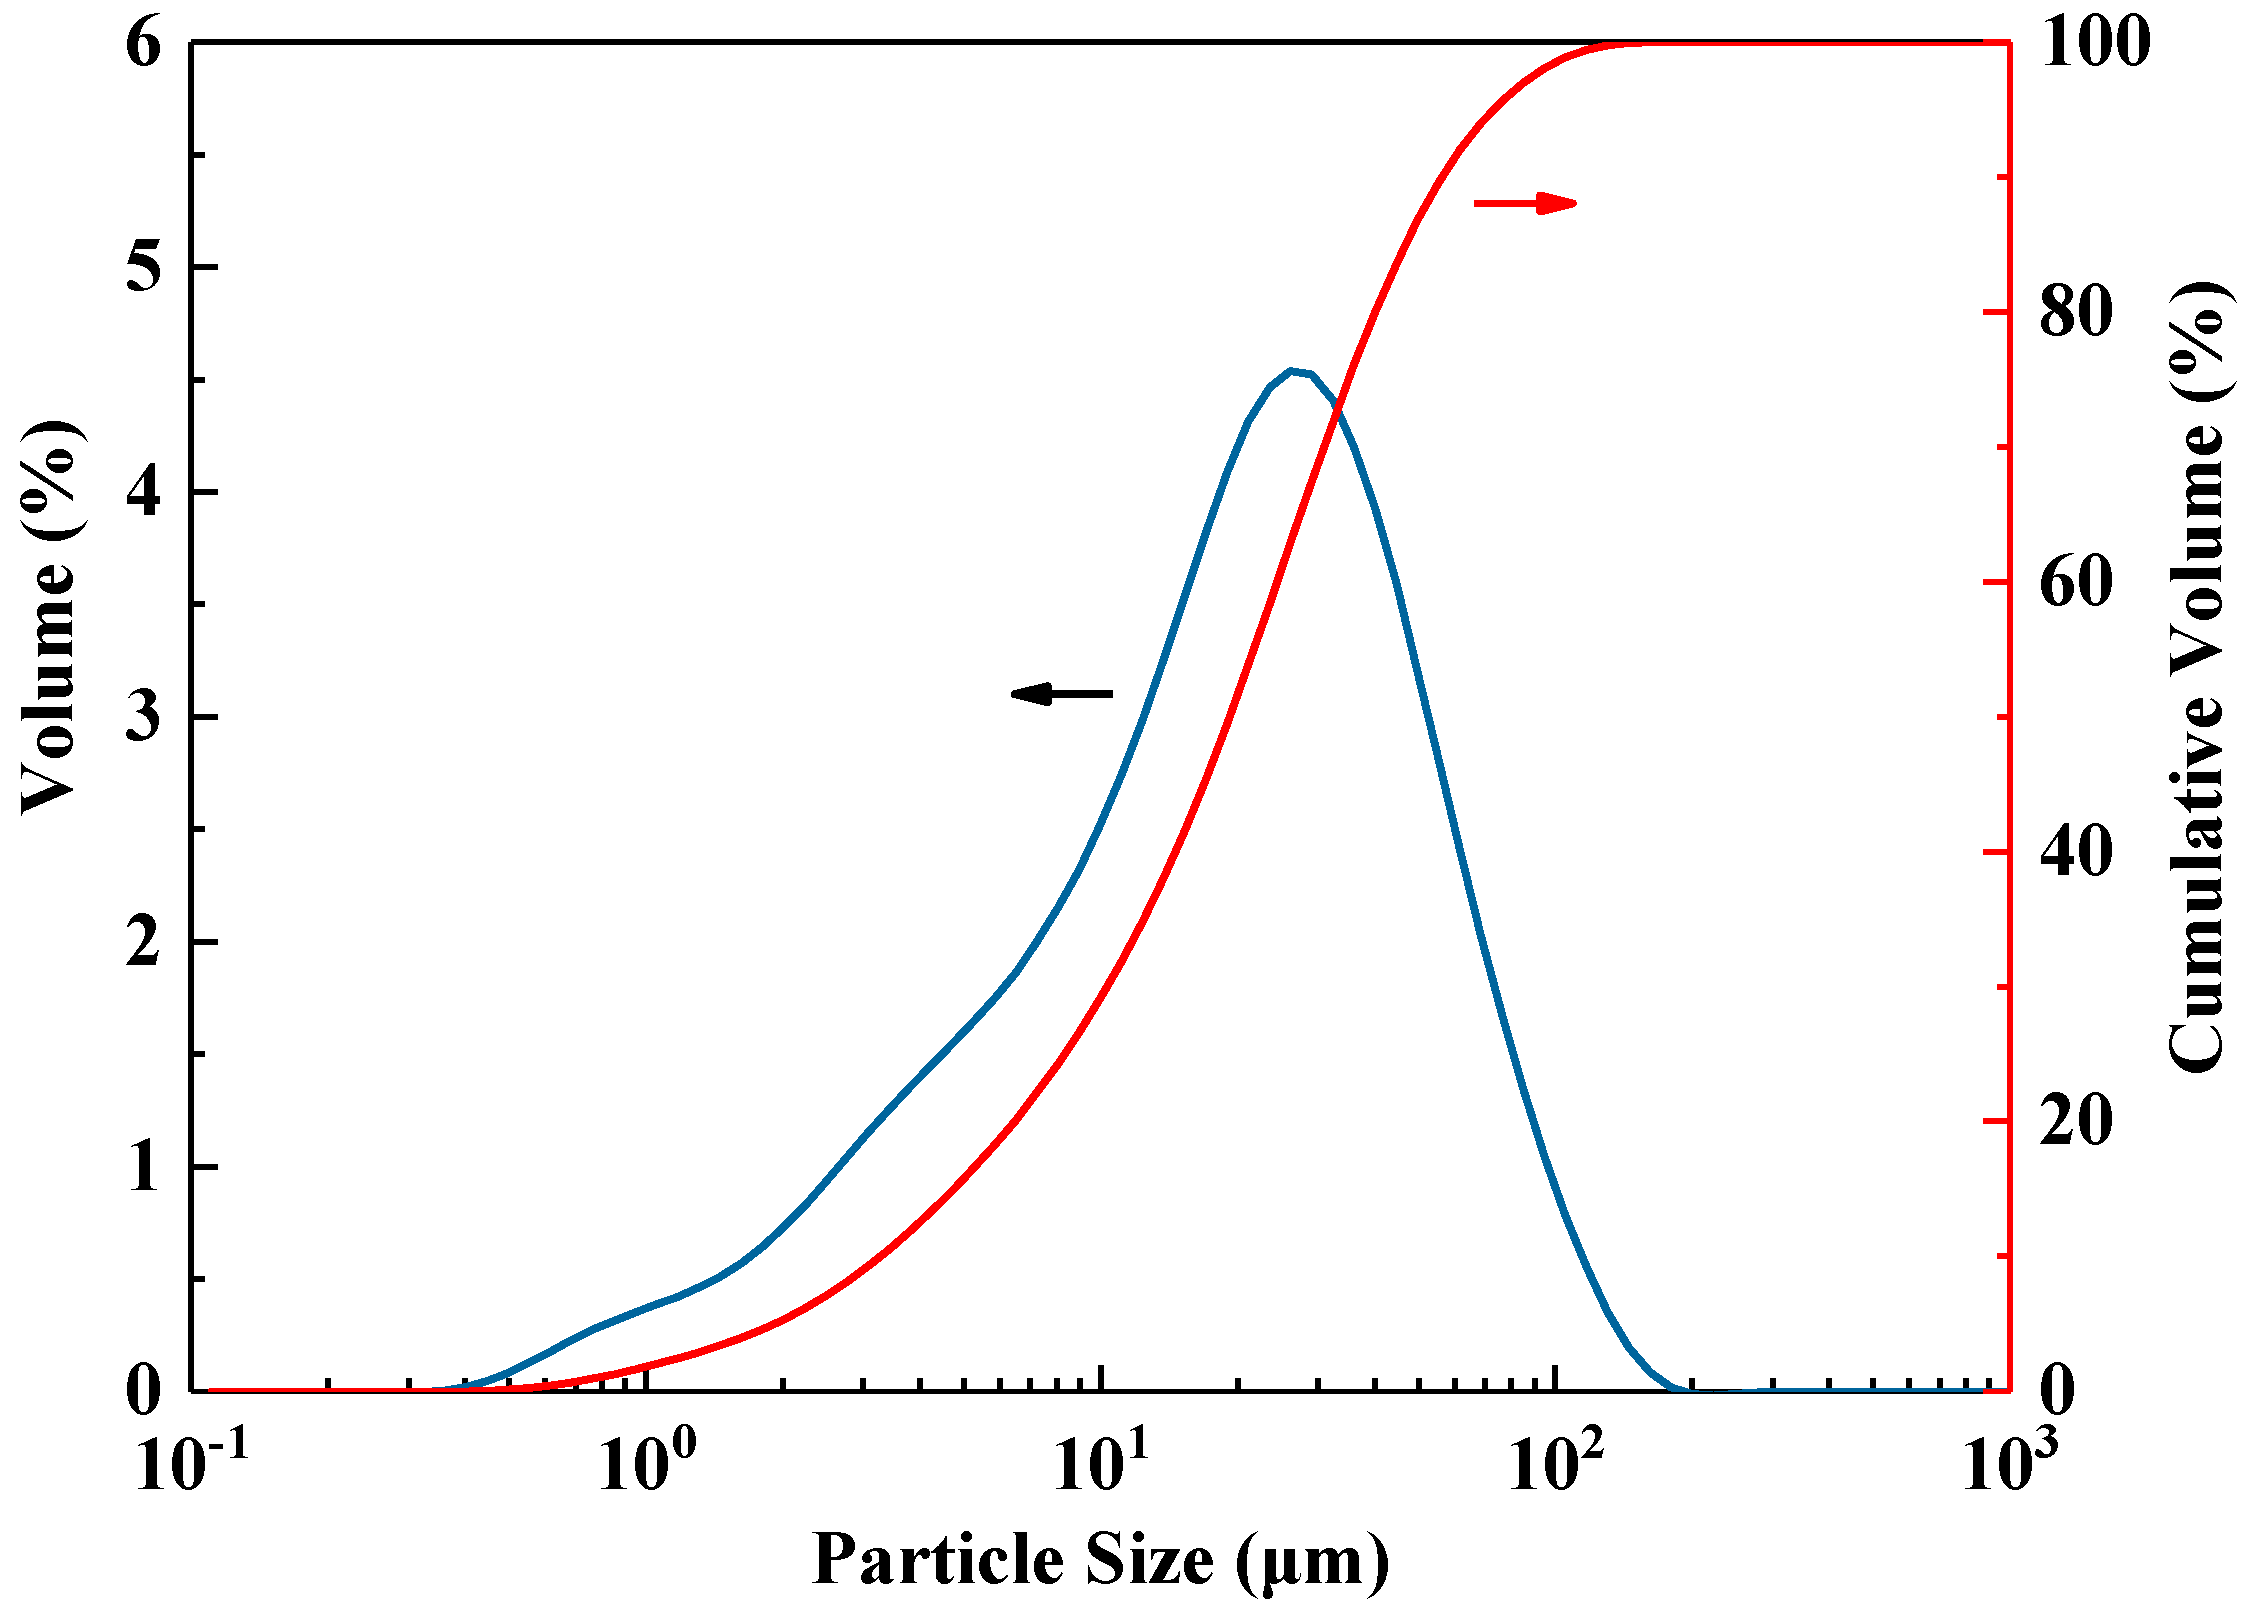
Figure 1. Particle size distribution of GGBS.
Separations 09 00450 g001
Figure 2. Setting time of K-AAS mortar and N-AAS mortar at different temperatures.
Separations 09 00450 g002
Figure 3. Compressive and flexural strengths of AAS mortar at different curing temperatures: (a) and (b) at −10 °C, (c) and (d) at 0 °C, (e) and (f) at 20 °C.
Separations 09 00450 g003
Figure 4. Hydration heat of K-AAS and N-AAS. (a) Heat flow curves and (b) cumulative heat release curves.
Separations 09 00450 g004
Figure 5. DTG/TG of AAS cured for 7d at temperatures of −10 °C and 20°C. (a) DTG, (b) TG.
Separations 09 00450 g005
Figure 6. Effects of alkaline activator on the ART-FTIR spectra of samples at temperature of 20 °C and −10 °C.
Separations 09 00450 g006
Figure 7. The pore size distribution of K-AAS and N-AAS samples cured for 7 days at temperatures of −10 °C and 20 °C.
Separations 09 00450 g007
Figure 8. The schematic diagram of the polymerization of AAS incorporated with K+ and Na+.
Separations 09 00450 g008aSeparations 09 00450 g008b
Table 1. Chemical composition of GGBS (wt%).
Chemical CompositionSiO2CaOAl2O3Fe2O3MgOSO3FeOTiO2Loss
Mass fraction31.8535.516.690.169.520.760.640.25
Table 2. Mix proportion of the AAS mortar (g).
SamplesGGBSKOHPotassium Silicate SolutionNaOHSodium Silicate SolutionFine SandWater
K-AAS60031.92157.28001200184.96
N-AAS6000020.16197.241200135.46
Table 3. The properties of K+ and Na+.
PropertiesNa+K+
Ionic radius, (nm) [38]9.513.3
Surface charge densit, (mC/cm2) [39]0.1410.072
Hydrated ionic radius, (nm) [38]35.833.1
Hydration energy, (kJ/mol) [40]−365−271
Table 4. The cost estimation of K-AAS and N-AAS.
Raw MaterialsUnit Price (CNY/kg)Usage Cost (CNY/kg)
K-AAS mortarN-AAS mortar
Potassium silicate solution151.521.4
Sodium silicate solution12
KOH18
NaOH14
GGBS0.5
Fine sand0.05
Water0.004
Publisher’s Note: MDPI stays neutral with regard to jurisdictional claims in published maps and institutional affiliations.