Article

The Effect of Initial Water Content and Density on the Swelling-Shrinkage and Cracking Characteristics of Compacted Clay

1
State Key Laboratory of Geomechanics and Geotechnical Engineering, Institute of Rock and Soil Mechanics, Chinese Academy of Sciences, Wuhan 430071, China
2
College of Civil and Engineering, Nanjing Forestry University, Nanjing 210037, China
3
School of Civil Engineering and Architecture, Hubei University of Arts and Science, Xiangyang 441053, China
*
Author to whom correspondence should be addressed.
Separations 2022, 9(12), 424; https://doi.org/10.3390/separations9120424
Submission received: 10 November 2022 / Revised: 1 December 2022 / Accepted: 7 December 2022 / Published: 9 December 2022

Abstract

:
The swelling-shrinkage and cracking characteristics of compacted clay under the coupling effect of initial conditions are rarely studied. The dry-wet cycle test of compacted clay with varying initial water contents and densities was performed in this study; the size and cracking conditions were investigated. The results showed that when the initial moisture content was 21% and the dry density was 1.65 g/cm3, the longitudinal expansion amount of the compacted clay was relatively small. However, it was rather large when the initial water content was 17% and 19%. Under the same dry density, the final vertical shrinkage ratio of the sample with a water content of 21% was the smallest, while that of the samples with a water content of 23% and 25% was rather big. Under the same water content, the final vertical shrinkage ratio decreased with the increase in dry density. After three wetting-drying cycles, compacted clay with a dry density of 1.65 g/cm3 and an optimal initial water content of 21% produced the fewest cracks and had the lowest cracking factor (CF) (only 7.58%). The compacted clay specimens with the dry densities of 1.55 g/cm3 and 1.60 g/cm3 had rather significant cracking at the same initial moisture content of 21%. The mercury intrusion porosimetry (MIP) test demonstrated that in the first two dry and wet cycles, the distribution of large pores decreased and that of tiny pores increased. After the third cycle, the distribution of small and medium pores decreased slightly. The results of this study will provide theoretical guidance for selecting cover soils in landfills.

1. Introduction

Low-permeability clay, a conventional material, had wide applications in geotechnical, geological, and environmental fields, especially in such environmental barrier constructions as low-permeability waste reservoirs, tailings dam buffers, and landfill liners and covers [1]. Low-permeability compacted clay was usually employed in the liner and cover systems of the traditional municipal solid waste (MSW) landfill [2]. A complete composite lining, including the geosynthetic liner, compacted clay layer, and geomembrane, was an essential part of the landfill anti-seepage system. It could effectively isolate landfill gases and prevent the leakage and spread of harmful leachate pollutants [3,4,5].
However, the compacted clay layer of the landfill was prone to generate shrinkage cracking under environmental factors such as the wetting-drying cycle, freeze-thaw cycle, temperature difference, atmospheric evaporation, rainfall infiltration, uneven settlement, and the piercing of roots. The shrinkage cracking of compacted clay changed not only the pore structure but also the infiltration and evaporation characteristics, leading to a rapid increase in hydraulic conductivity [6,7,8]. There were cracks with a width of 13~25 mm and a depth of 300 mm in the compacted clay layers of a landfill liner [9]. The shrinkage cracking could increase the permeability coefficient of clay liner layers by 12 to 34 times, and some even increased by several orders of magnitude, up to 500 times [10].
The freeze-thaw cycle and wetting-drying cycle could also increase the clay cracks and the permeability coefficient even by one order of magnitude [11,12]. The wetting-drying cycle had little effect on permeability under the optimal moisture content [10]. The part of cracks could be healed by clay expansion under the water absorption, but the cracks grew after the repeated wetting-drying cycles. The cracks of the compacted clay layer would provide a potential preferred path for fluid infiltration, such as rainwater, increasing the permeability coefficient of landfill covers and the risk of landfill leachate [6,13,14]. In addition, the cracks promoted rain infiltration and then increased the clay volume and sliding force after absorption, reducing the shear strength and stability of clay structures [15,16].
Expansive clays are extremely fragile in arid and semi-arid climates or long drying processes, leading to the evaporation loss of soil moisture and the decrease of soil plasticity [17]. The desiccation fissures would easily occur when the surface tensile stress reached the tensile strength of the soil or the volume shrinkage was restricted [1]. Fine-grained soils are more likely to crack than coarse-grained soils, and clay mineral types and contents control soil desiccation. Crack size increases with the increase in plasticity index and clay contents. In addition, the desiccation characteristics of clay soil could be attributed to the negative pore water pressure, the elastic modulus, moisture contents, density, confining pressure, wetting-drying cycle, temperature, and other boundary conditions [1,18,19,20,21]. Previous studies used the cracking intensity factor to represent the cracking degree of fractures. The cracking factor or the crack width increased with the increase in plasticity index and the decrease in particle size [21].
Generally, the wetting-drying cycle significantly increases the cracking factor (CF) compared with the single-drying effect. The CF of compacted clay had a significant change in the first three wetting-drying cycles, but there would be no significant changes after three cycles [1]. With the increase in wetting-drying cycle times, the absolute expansion ratio of compacted expansive soil increases quickly, whereas the relative inflation ratios reduce [22]. Under the optimum moisture content and density, compaction work could lessen the expansion, but the drying will cause the drying shrinkage. In the recent two decades, qualitative studies have been conducted on crack development and transfer through extensive field and laboratory experiments [1,21,23,24]. The development stages of cracking mainly consist of the primary cracking stage, the secondary cracking stage, and the steady terminal stage [14,21].
Building crack model is a new crack measurement technology, which finally forms the quantitative analysis based on image processing [25]. A clay cracking analysis model was set up, and the cracking parameters, such as the depth of cracks and the average spacing of fractures, were predicted with the help of field-measured data [26,27]. The crack propagation in clay was simulated, and the development of cracks and fracture spacing were predicted using the one-dimensional flow theory, the fracture mechanics, and the finite element method. Moreover, many experimental and numerical studies were performed on the influence of the desiccation cracks [1,19,23,24,28].
A layer of compacted clay of a certain thickness was added to the geomembrane to fortify the sealing system and prevent contamination from landfill leachates [29]. However, the cracking of the compacted clay will lead to the infiltration of rainwater and the diffusion of toxic and harmful gases, which will cause a series of environmental problems [30]. There have been numerous studies on clay cracking under the single influencing factor up to now. Studies of clay cracking have not yet been found under the coupling effect of initial conditions. Based on the cracking and seepage problems, therefore, the expansion, shrinkage, and cracking experiments of compacted clay were conducted under different initial water content, dry density, and wetting-drying cycles [31]. The microstructure experiments had also been performed to explore further the expansion-shrinkage and desiccation mechanism of compacted clay [32].

2. Materials and Methods

2.1. Materials

The clay used in this study was taken from the excavation site of a subway foundation pit in the East-West Lake District, Wuhan City. The clay soils were collected from the site at about 3.5 m depth. The main physical properties are listed in Table 1. The moisture content of sediment was measured in the oven under 105 °C, and its Atterberg limits were tested by the fall cone method. The specific gravity and pH (the water-soil ratio of 2:1) of sediment were measured respectively according to ASTM D854-14 and ASTM D4972-19. The particle-size distribution was determined by a laser diffraction particle size analyzer (Mastersizer 2000, Malvern Panalytical, Malvern, UK). The clay soil had the maximum dry density of 1.66 g/cm3 and the optimal moisture content at 20.7%, according to the compaction test. The chemical composition of clay was measured by an X-ray fluorescence spectrometer (LS 55, PerkinElmer, Inc., PerkinElmer, Inc. USA), and the results are shown in Table 2.

2.2. Specimen Preparation and Test Methods

After the clay soil was dried, broken, and sieved (<1.0 mm), the amount of tap water was weighed and admixed into the dry according to the designated water content (w0 = 17%, 19%, 21%, 23%, 25%). Thin silicone grease was smeared onto the polished stainless-steel ring with a diameter of 61.8 mm and an initial height of 20 mm to minimize side friction. The wet mixtures were introduced and compacted into the circle with the geotechnical knife according to the designed initial dry density (ρd = 1.50, 1.55, 1.60, 1.65, and 1.70 g/cm3). It should be noted that the dry density of samples was selected as 1.65 g/cm3 when the influence of initial water content was analyzed, and the water content was selected as 21% when the influence of dry density was analyzed. There were nine kinds of samples with different initial conditions for every experiment. Two parallel samples were made for each different condition.

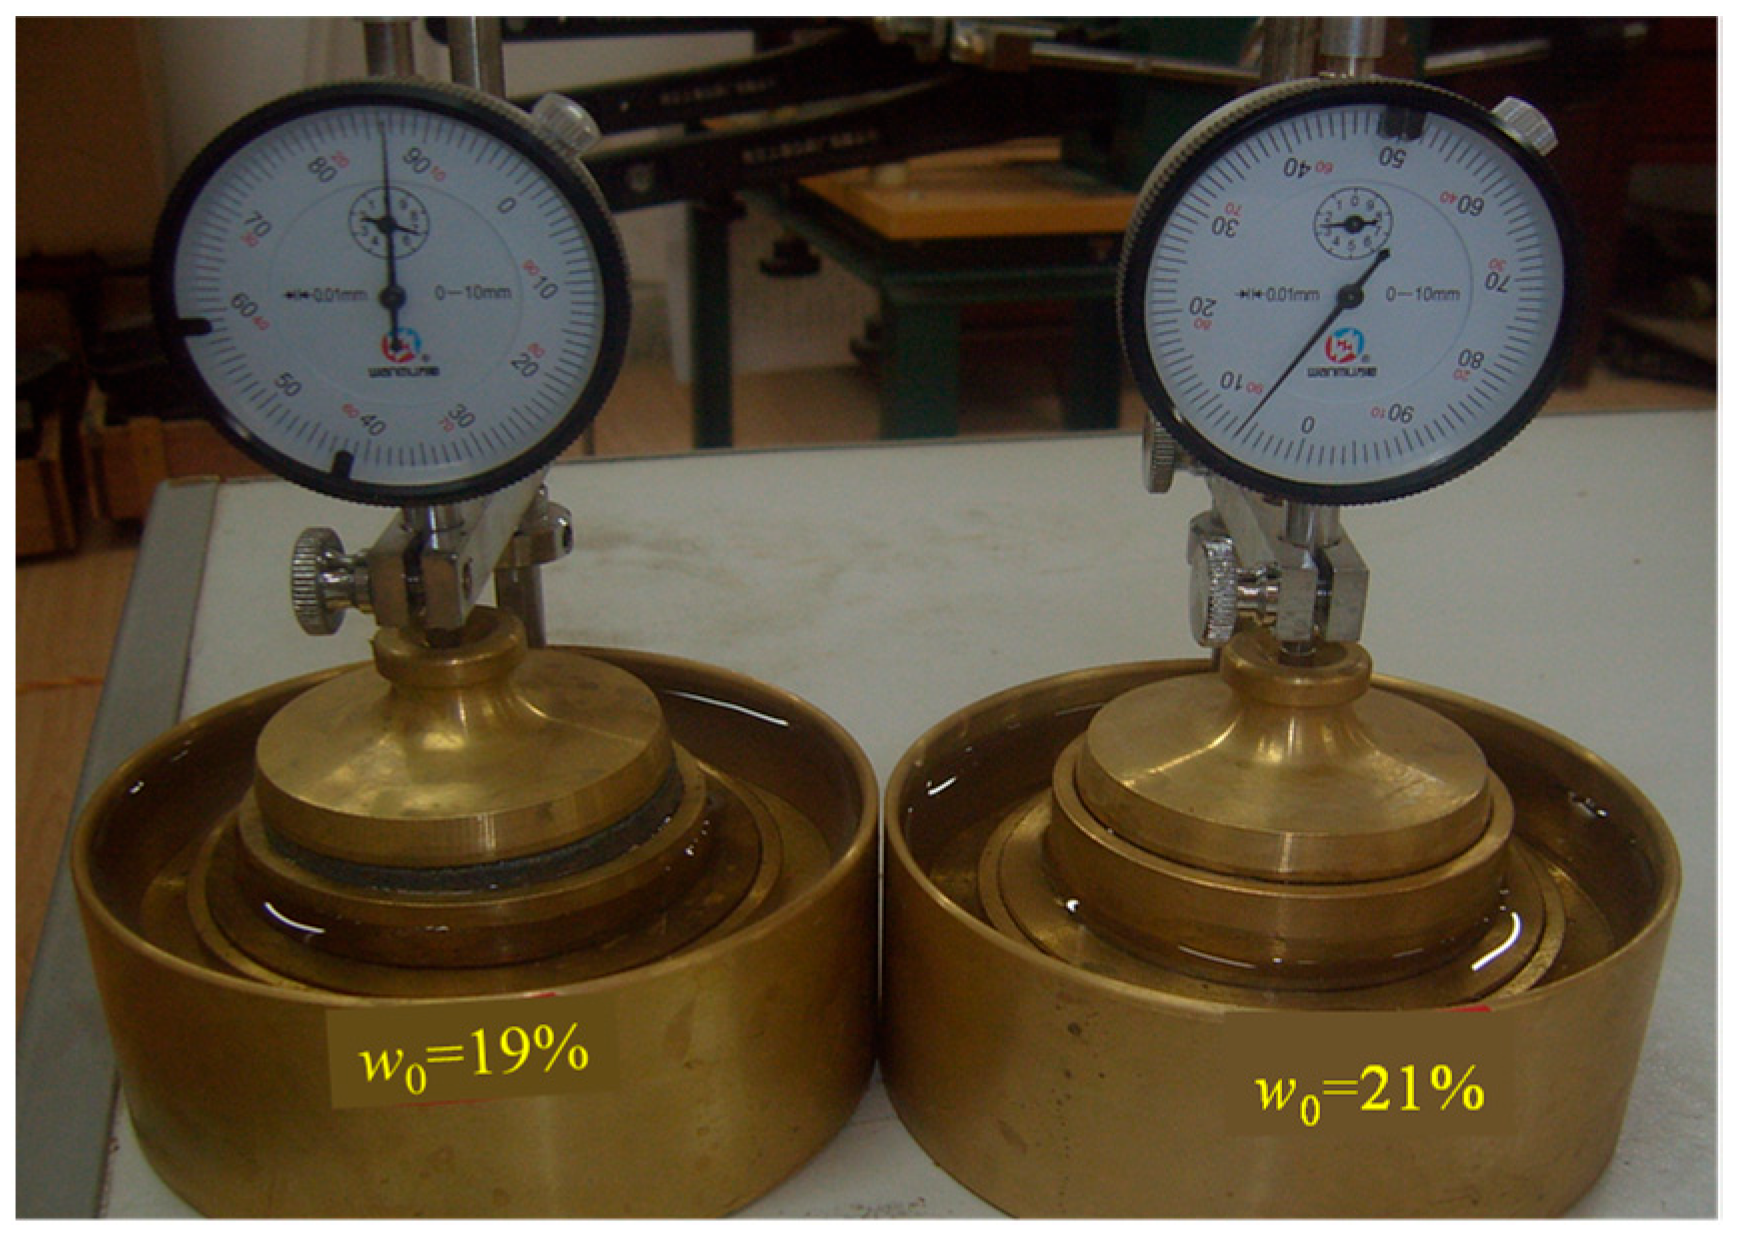
2.2.1. Expansion Test

After trimming both surfaces, the filter paper and porous stones were placed on both ends of the specimen in sequence. The specimen with a ring, filter paper, and porous stone was assembled in the odometers and then submerged in water during the test (see Figure 1). The specimens were subjected to vertical expansion tests with no loading under the circumferential constraint. After adjusting the dial indicator, the expansion was recorded based on the dial gauge reading after 0 min, 1 min, 3 min, 6 min, 15 min, 30 min, 60 min, 3 h, 6 h, 12 h, 24 h, and so on. When the longitudinal expansion ratio was less than 0.005 mm/h, the test was stopped.

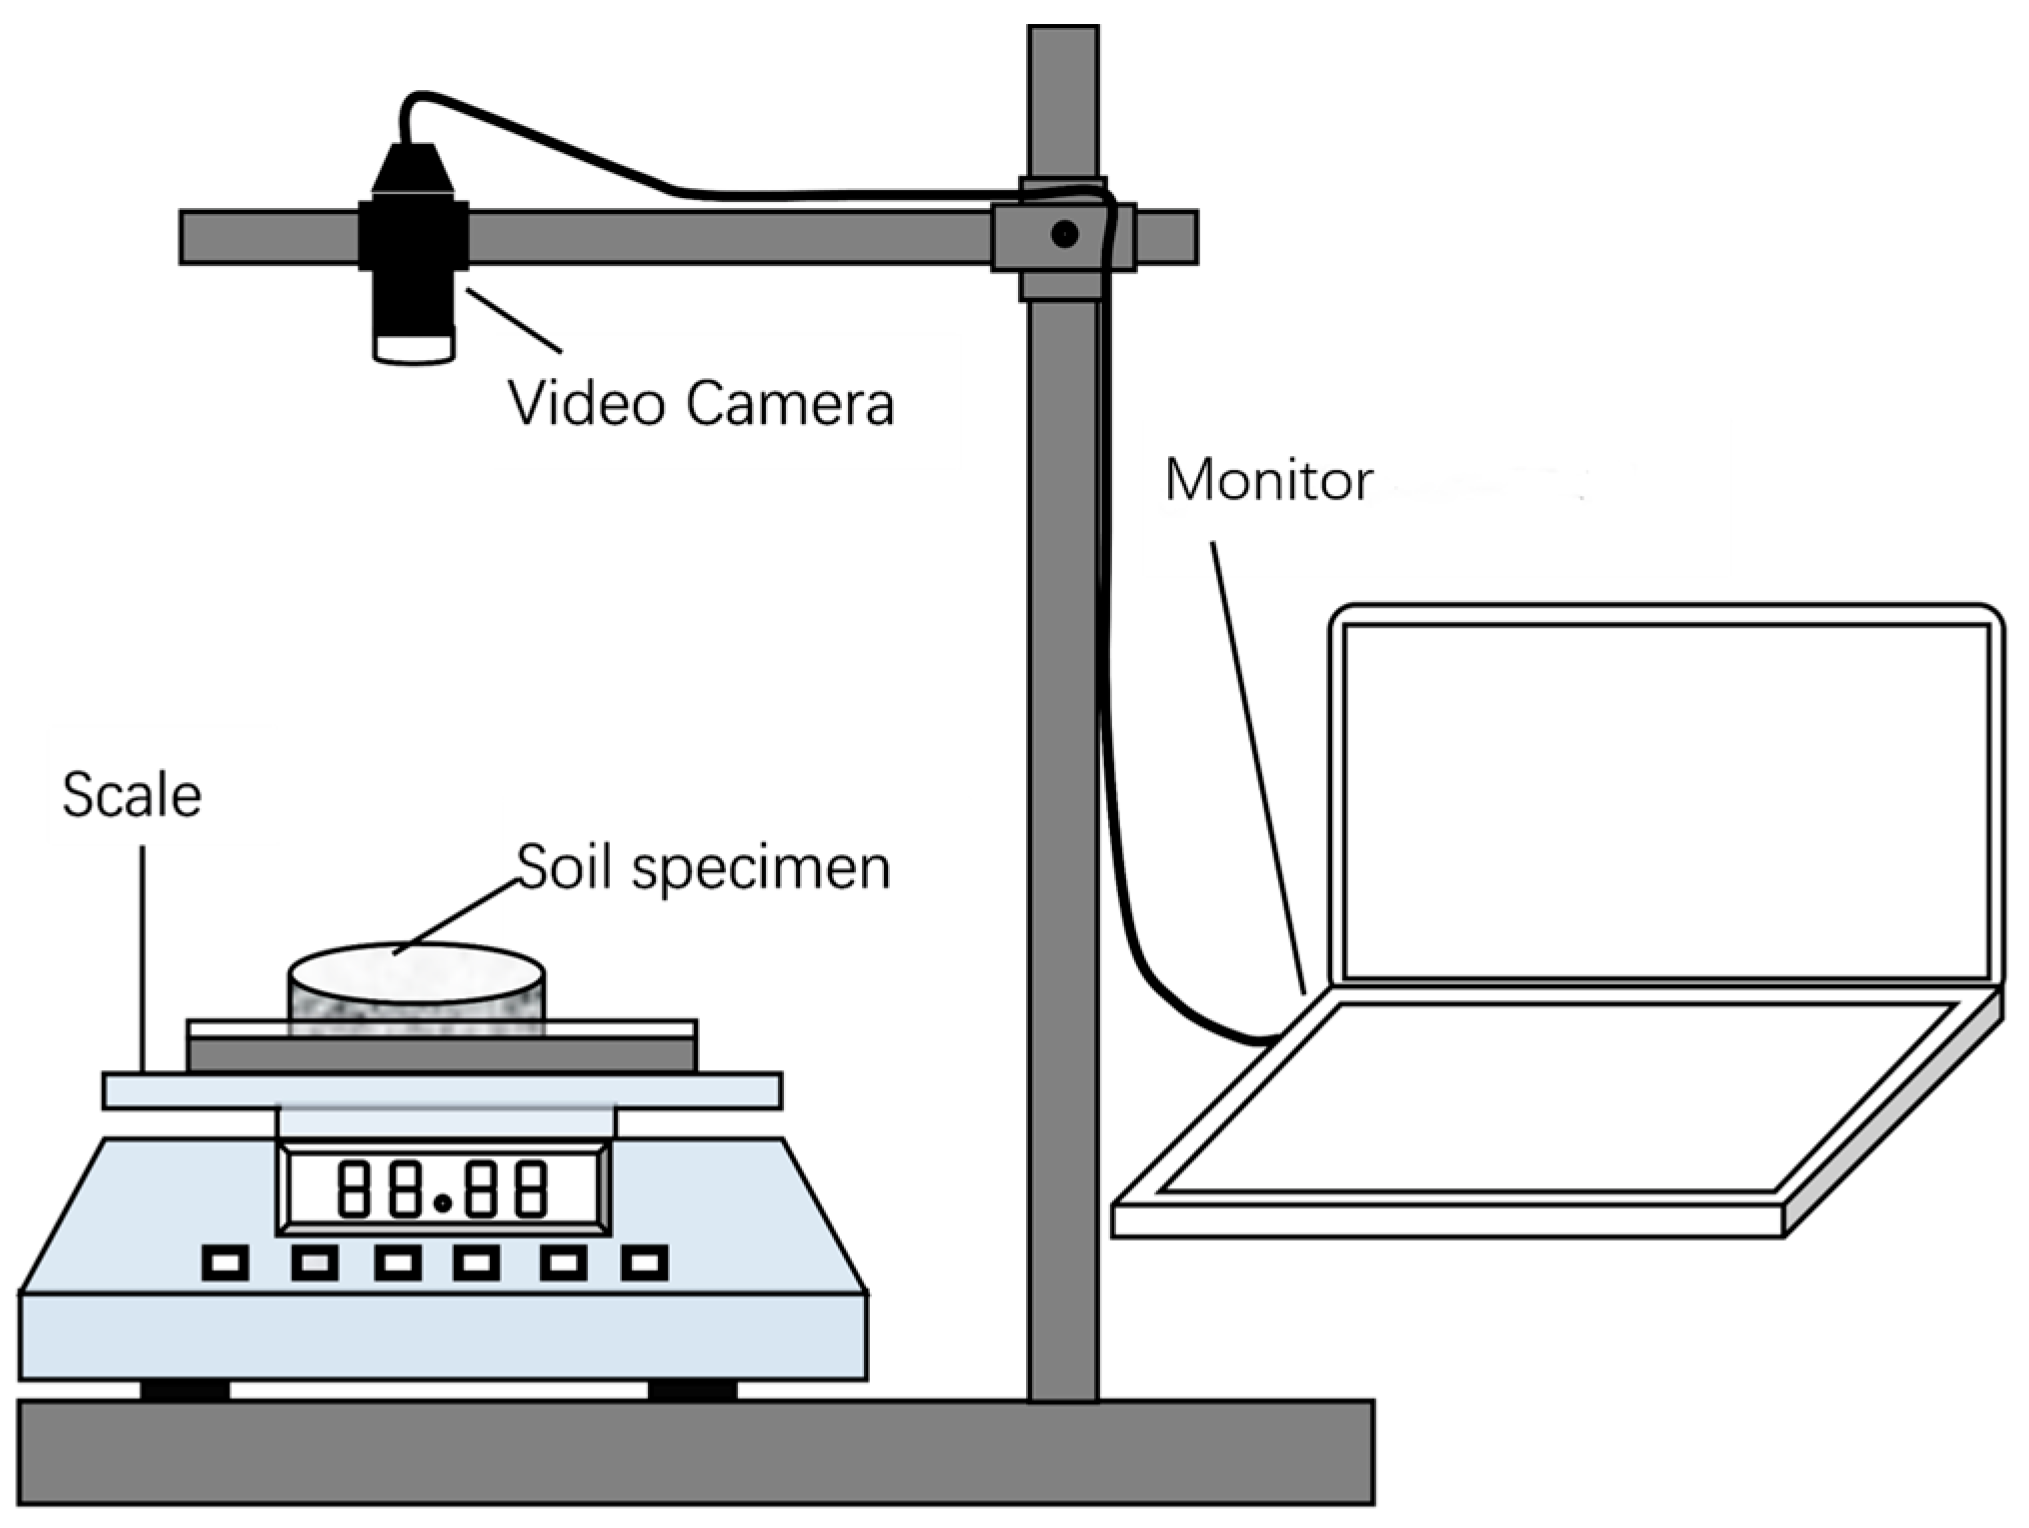
2.2.2. Drying-Shrinkage Test

After the soaking-expansion test, the specimens onto the porous stone were subjected to drying-shrinkage tests in an oven under a constant temperature (30 °C). The shrinkage test included longitudinal shrinkage and radial shrinkage. The longitudinal shrinkage was determined by the average height, which was measured by a vernier caliper. The radial shrinkage was determined by the average diameter, which was measured using a digital microscopic instrument (EV76C560, Teledyne e2v, Chelmsford, Spain) (Figure 2). The vertical distance between the specimen and the camera is 30 cm. The camera has a focal length of 35 mm and a FOV of 8°. The photos are 1280 by 1024 pixels. For the cracked image, only one of the two parallel images was shown in the results. The height and diameter were measured at the time interval of 10 min in the first hour and 1–3 h after the first hour. Finally, the longitudinal shrinkage ratio (εl), the radial shrinkage ratio (εr), and the volumetric shrinkage ratio (εv) of the compacted specimens were calculated according to Equations (1)–(3).
ε l = Δ h h 0 = h 0 h h 0 × 100 %
ε r = Δ d d 0 = d 0 d d 0 × 100 %
ε v = Δ v v ° = v ° v v ° × 100 % = 1 1 ε r 2 1 ε l
where h0, d0, and V0 were the initial height, diameter, and volume of the compacted clay, respectively; h, d, and V were the initial height, diameter, and volume of the compacted clay after a certain time, respectively.

2.2.3. Cracking Test after Wetting-Drying Cycles

The cracking tests of compacted clay specimens were conducted in an oven under a constant temperature of 30 °C after the continuous drying and wetting-drying cycles. The development of cracks was also monitored using the digital microscopic image instrument (Figure 2), and the magnification ratio of the image was 10 times. Electronic balance was used to measure the moisture content of compacted clay samples in the drying stage after each wetting-drying cycle. The clay specimens were dried for five days, followed by the first wetting-drying cycle. One wetting-drying cycle needed 5 days (2 days for wetting and 3 days for drying), and there were 25 days in total for four wetting-drying cycles. According to the colors, the cracks were distinguished from the images, and the cracking parts were dark. The crack characteristic parameters, including fracture width, length, area, and distribution, could be calculated with the help of image analysis and processing software [33,34]. In this study, the cracking factor (CF) was used to represent the cracking degree of compacted clay, as shown in Equation (4). The CF values of two parallel samples differ within 20%, and the calculated results will be accepted; otherwise, the test will be repeated.
C F = A C A t = A C i = 1 n l A c i A t
where Ac was the cracking area of each sample, Aci was the area of each crack, and At was the total area of each sample.

2.2.4. Micropore Test

To reveal the influence mechanism of the wetting-drying cycle on the cracking development, the Mercury intrusion porosimetry (MIP) test was conducted on the compacted samples after different cycles. One sample of ~1 cm3 was chosen from the hand-broken samples after each wetting-drying cycle. The samples were then frozen by dipping them into liquid nitrogen and then placed in a freezing unit attached to a vacuum chamber for the sublimation of frozen water [35]. The MIP test was conducted using an AutoPore IV 9510 mercury intrusion porosimeter. In this study, the pore was assumed to be cylindrical, and thus the pore diameter was calculated according to Equation (5):
d = 4 T C O S θ p
where d was the pore diameter, P was the intrusion pressure (the maximum of 345 MPa), T was the surface tension of the mercury (480 erg/cm2), and θ was the contact angle (140°).
According to previous studies [36], pores were divided into large pores (between the granules, d >10 μm), middle-size pores (inside the granule, 2.5 μm < d < 10 μm), small pores (between particles, 0.4 μm < d < 2.5 μm), tiny pores (inside the particles, 0.04 μm < d < 0.4 μm), and ultra-micro-pore (inside the particle, d < 0.04 μm).

3. Results and Discussion

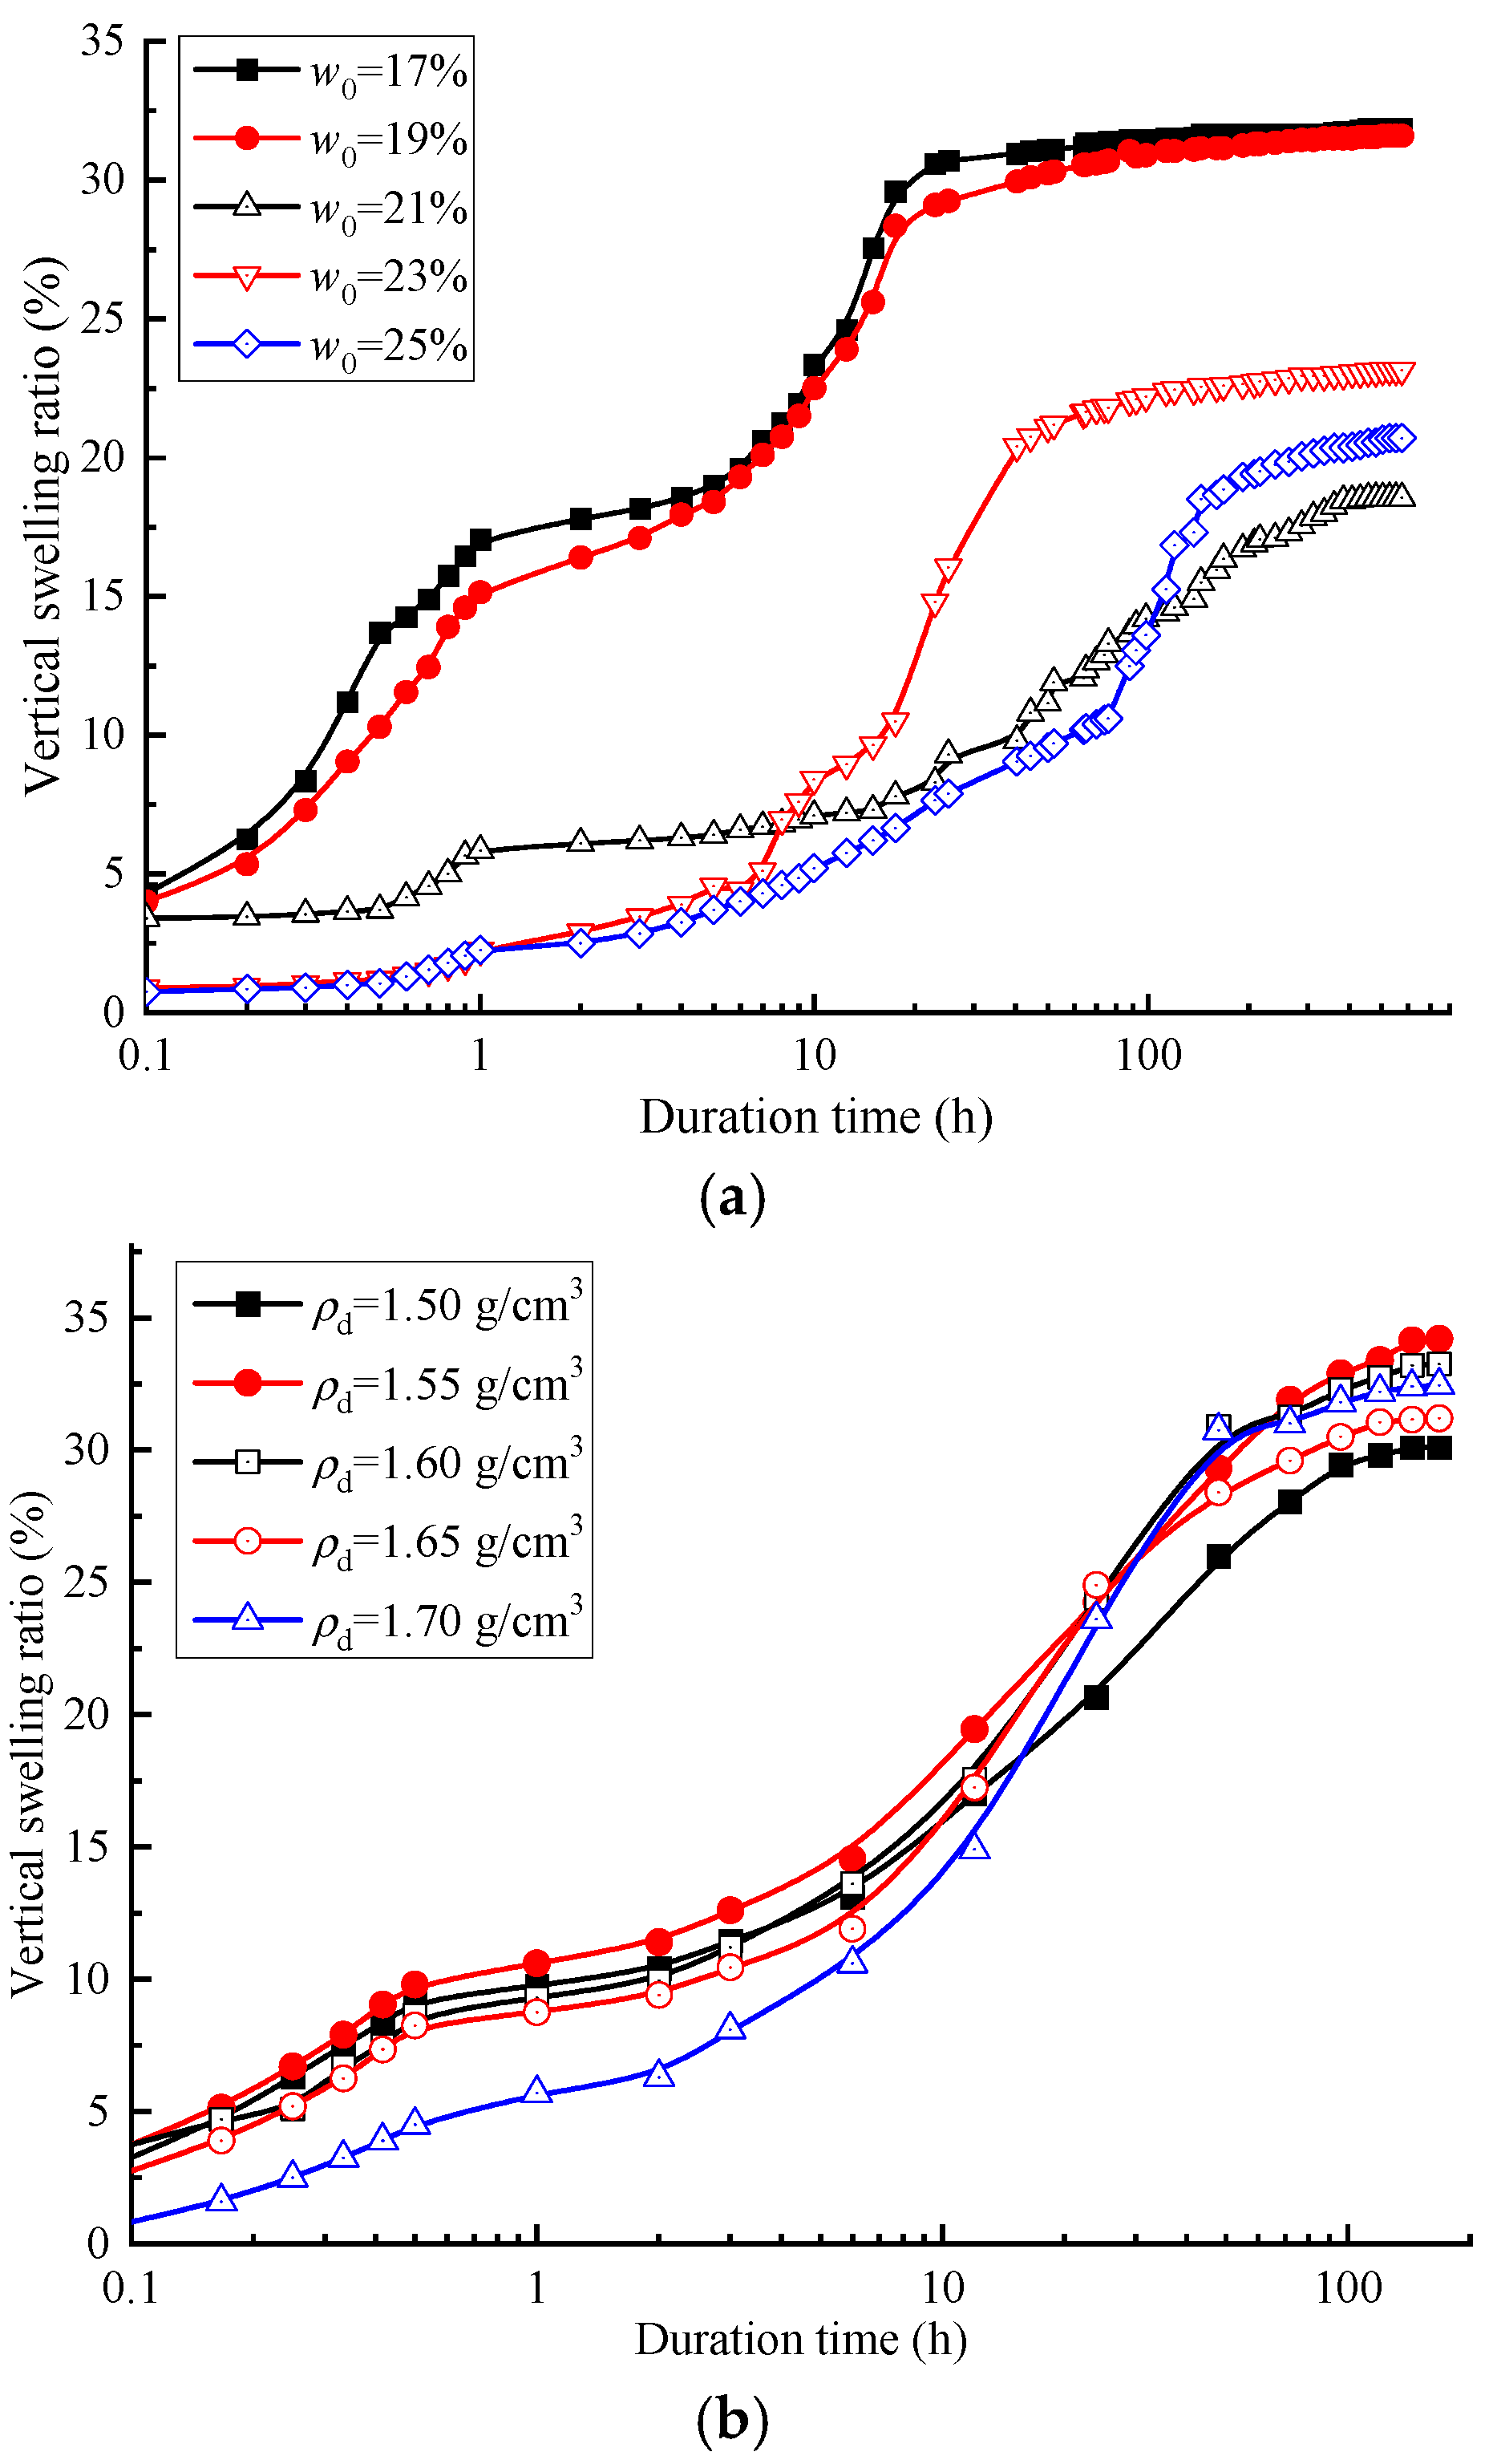
3.1. The Expansion Characteristics

Figure 3a,b shows the vertical swelling ratio of the compacted clay with time under different initial water content and dry density, respectively. It can be found in Figure 3a,b that the expansion changes of compacted clay with time generally were divided into three phases: the slow water-absorption expansion, accelerated expansion, and slow expansion process. In the first stage, water gradually seeped, and the surface of the compacted clay started to take expansion. In the second stage, the change in vertical swelling was greater. When moisture entered the soil and the pores between particles under the capillary action, the soil-water interface area increased, and the matrix suction gradually decreased, speeding up the water absorption. In the third stage, the water between clay particles continued to increase until the space saturation, which might cause the collapse of the aggregate structure, leading to slow or no expansion.
Based on Figure 3a, it can be found that the vertical swelling of the compacted clay (initial dry density of 1.65 g/cm3) increased gradually with time and eventually tended to be stable. Within the first 10 h, the vertical expansion ratio decreased with increasing the initial moisture content. The vertical expansion ratio had a faster development for the compacted clay with an initial water content of less than 21%. Within 10–45 h, the increase in vertical expansion of compacted clay with an initial water content of 21% slowed down. After 45 h, the vertical expansion ratios increased stably, and their final values reached the maximum of ~31.8% for the samples less than 21%. However, the vertical expansion ratios were 18.5%, 23.1%, and 20.7%, respectively, for the compacted samples with the initial water content of 21%, 23%, and 25%. The reason might be that there were more unsaturated clay particles and larger pores in the compacted samples when the initial water content was less than 21%, producing a larger expansion after absorbing water. Under the optimum water content of ~21%, there are the least intergranular pores. When the water content is greater than 21%, the final swelling ratio of the samples was between the final swelling ratio of the samples whose water content is 21% and 19%.
Figure 3b shows the change in vertical swelling ratio under different dry densities (initial water content of 21%). The vertical swelling ratio increased with duration time, and it reached the maximum after 100 h. Compared with the initial water content, the final vertical swelling ratio of samples under the influence of dry density almost reaches or exceeds 30%. Within ten hours, the final expansion ratio was the lowest when the dry density was 1.70 g/cm3. The final expansion ratio was the maximum when the dry density was 1.55 g/cm3, while it reached the minimum when the dry density was 1.50 g/cm3.

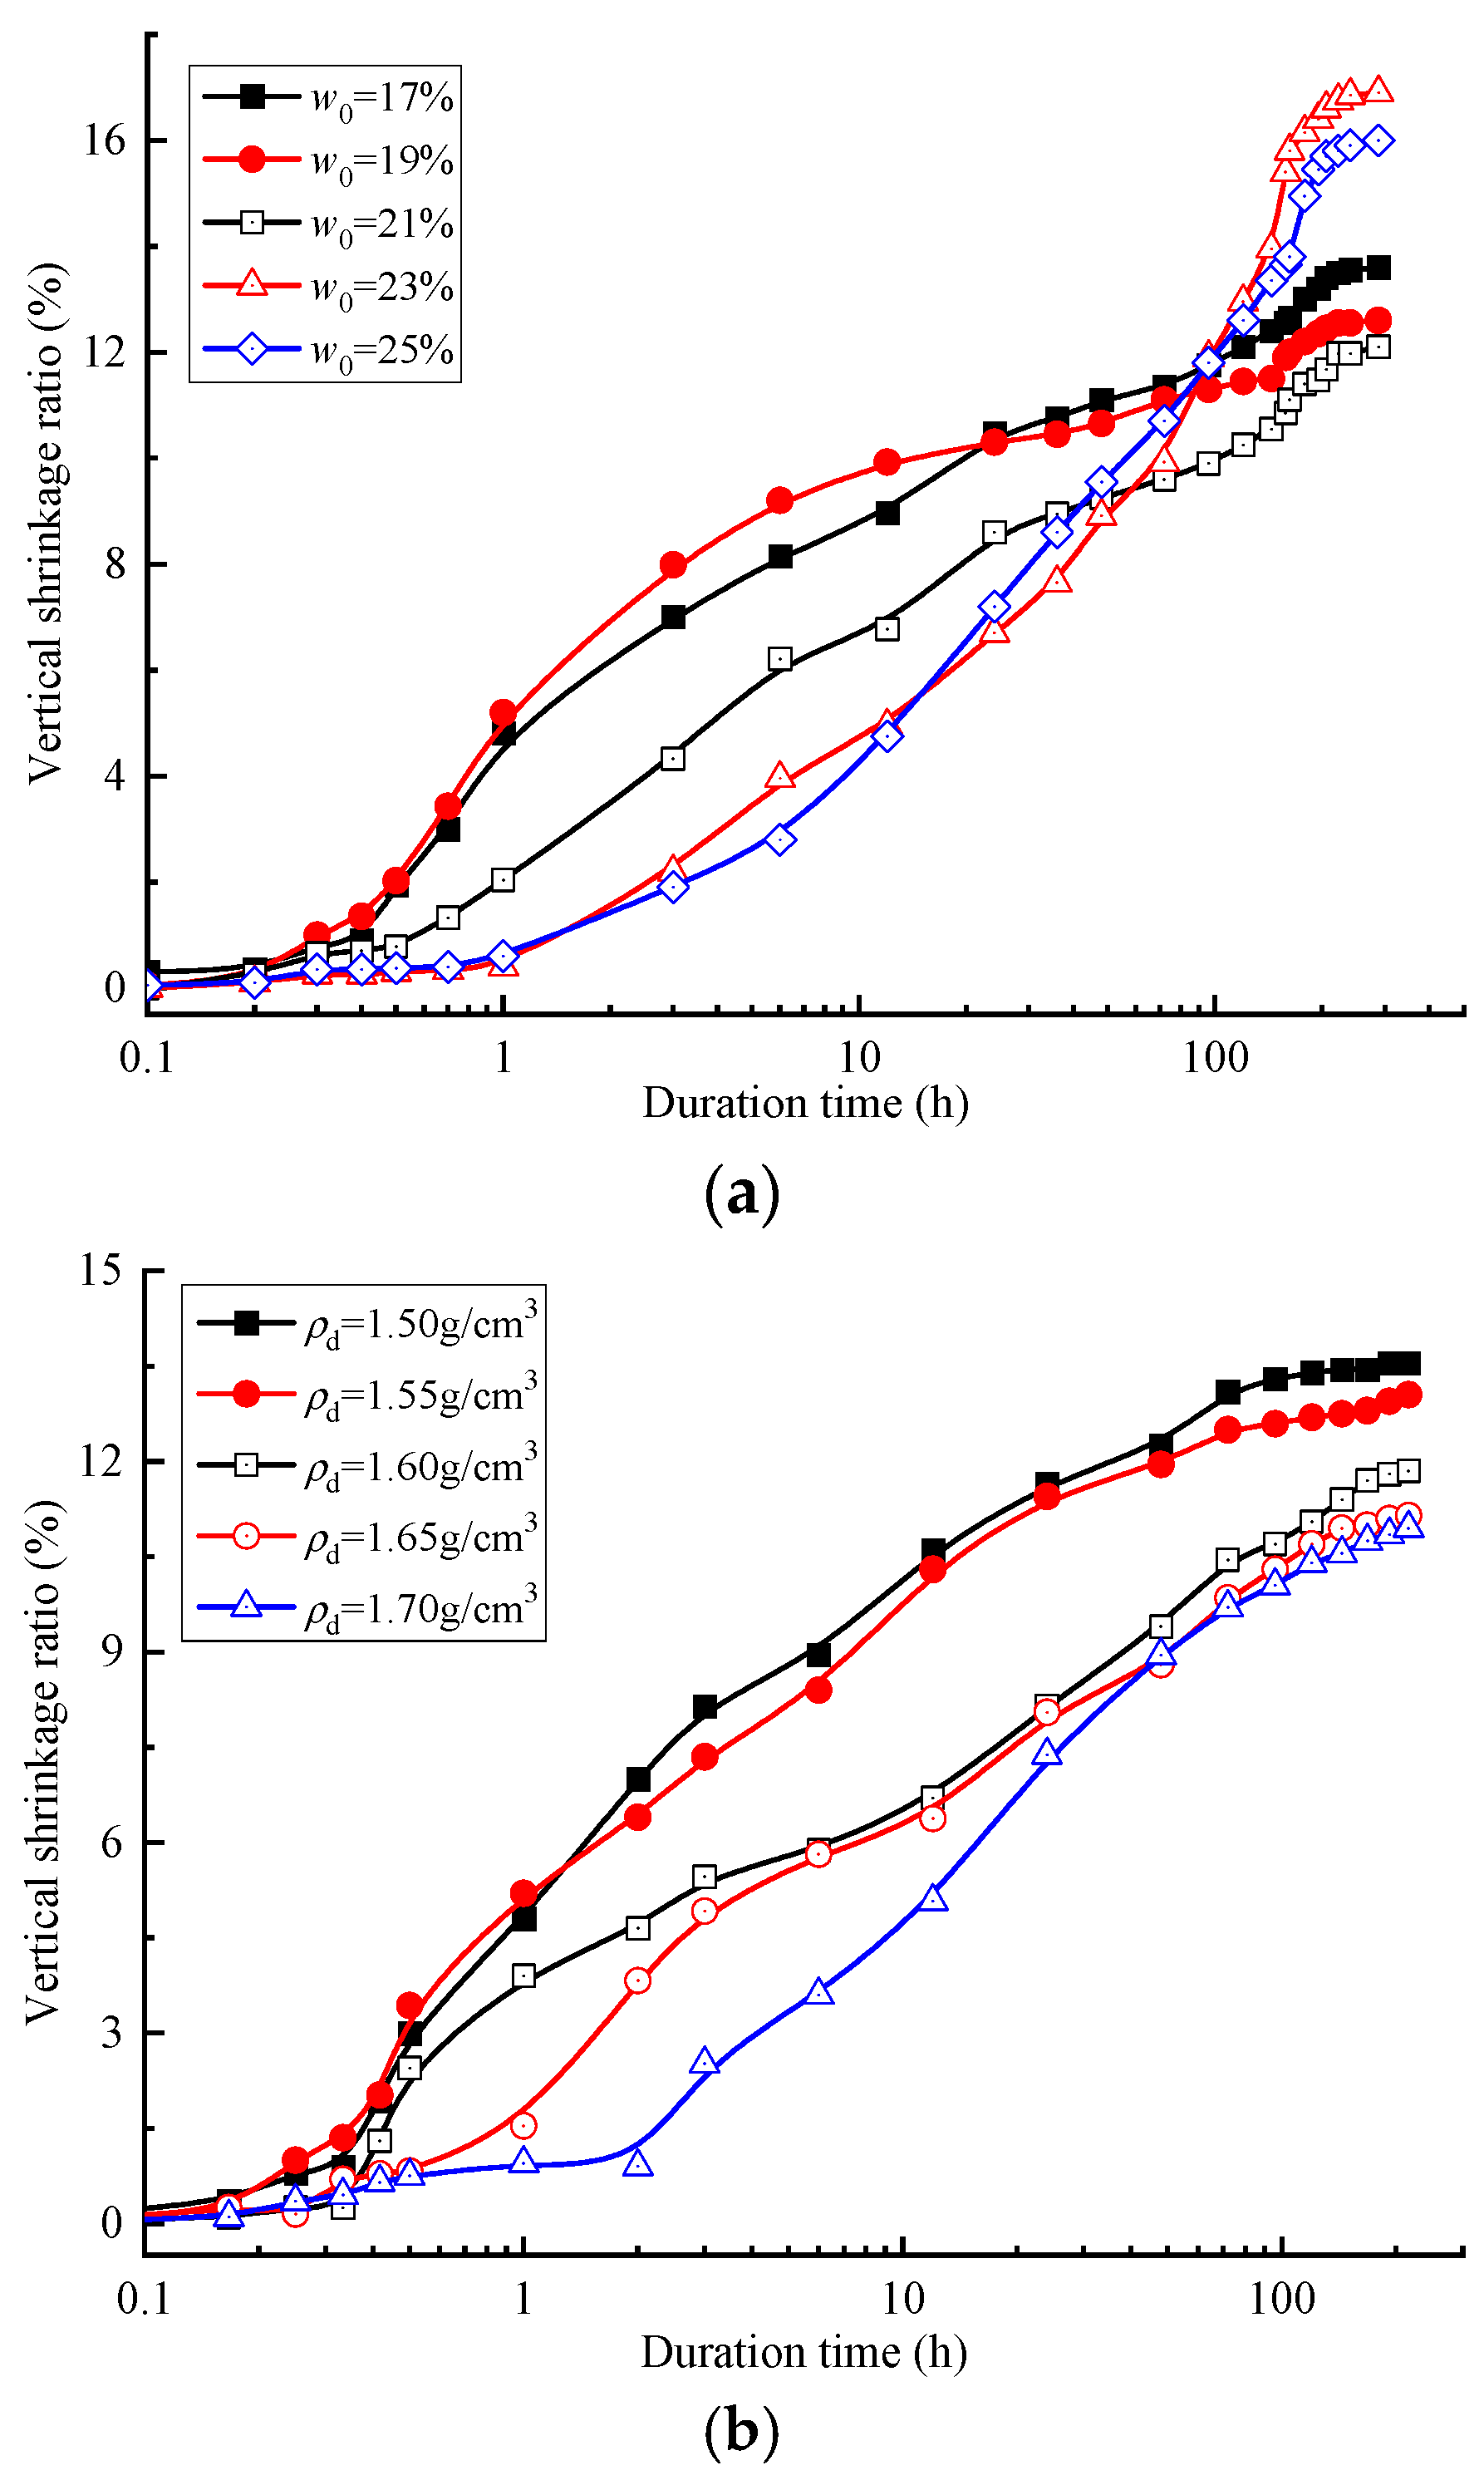
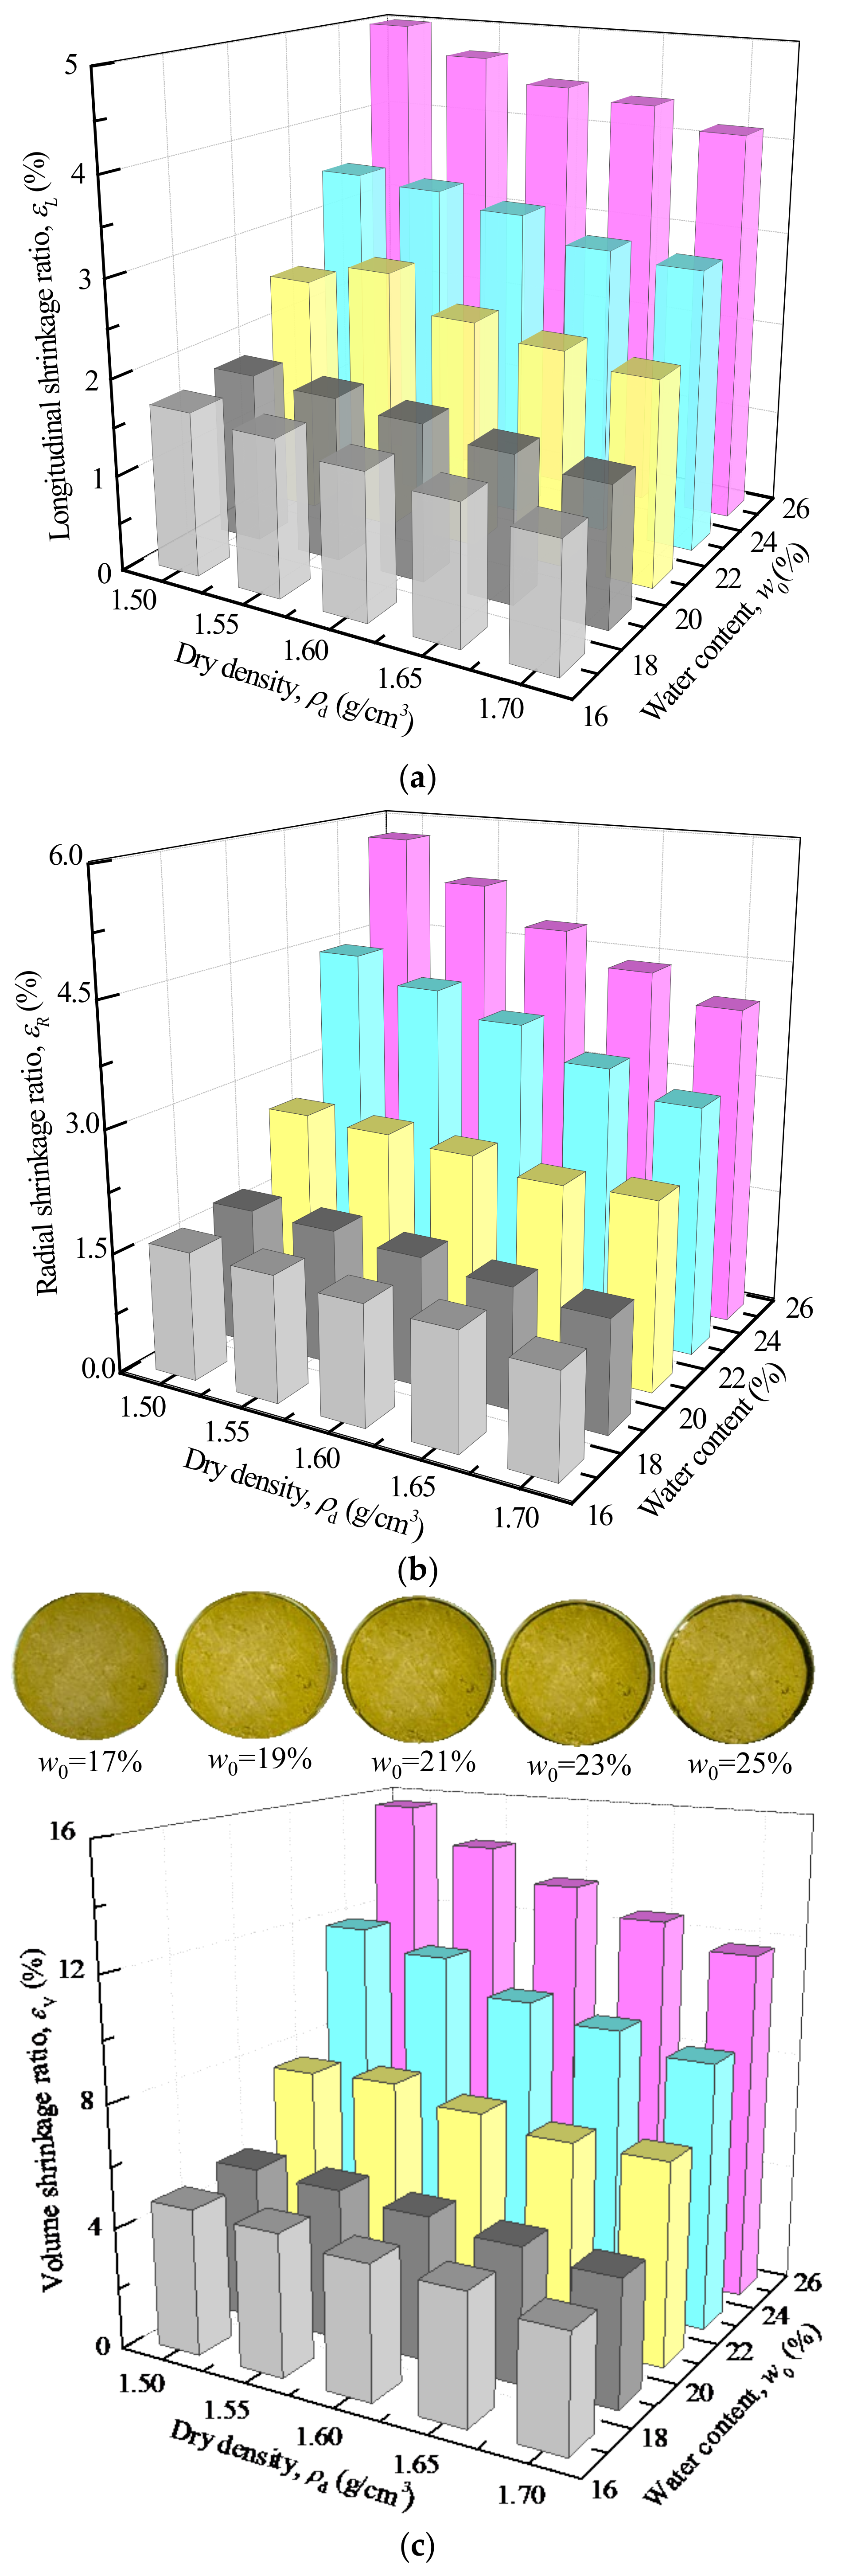
3.2. Dehydration-Shrinkage Characteristics

Figure 4a,b depict the vertical shrinkage ratio of compacted clay specimens with time under different initial water content and dry density, respectively. It can be observed from Figure 4a,b that the shrinkage increased with time, and the dehydration-shrinkage process concluded the rapid shrinkage and the residual shrinkage. At the rapid shrinkage process, the water content of the soil was lower than the air-intake value of soil mass, and the pore water was evaporated. The reduction of pore volume was close to the water volume, and the vertical shrinkage increased with the increase in initial water content. In the second stage, the free water in the pores was gradually evaporated, and the water film onto the clay particles became thinner. Meanwhile, the development of soil suction in an unsaturated state increased the effective stress between soil particles and improved the anti-deformation ability of soil. As a result, the cementation between particles would be strengthened, hindering the rearrangement of particles. The part volume of water was occupied by the entered air, and the reduction of soil volume was less than that of water volume, slowing down the shrinkage of the samples [37].
Under the same dry density, the final vertical shrinkage ratio of the sample with a water content of 21% was the smallest, while that of the samples with a water content of 23% and 25% is rather big (Figure 4a). Under the same water content, the higher the dry density was, the smaller the vertical shrinkage ratio was (Figure 4b). The possible reason might be that the compacted clay, after absorbing water, can be regarded as a saturated specimen, and the pores between soil particles were occupied by water. The water was evaporated constantly during the drying and dehydration process. When the water content approached the air intake value, the evaporation began to decline, and thus the shrinkage increased [38,39].
Compared to soaking expansion, the compacted clay specimens in the ring could produce shrinkage in both longitudinal and radial directions. To analyze the relationship between shrinkage ratio and initial water content and dry density, the longitudinal shrinkage ratio, radial shrinkage ratio, and volume shrinkage ratio were calculated according to Equations (1)–(3). Figure 5a–c show the changes in longitudinal shrinkage ratio, radial shrinkage ratio, and volumetric shrinkage ratio with initial water content and dry density, respectively. It can be found that the longitudinal, radial, and volumetric shrinkage ratios had a slight decrease with initial dry density increasing, especially under large water contents of 23% and 25%. However, the three shrinkage ratios increased with the increase in initial water content, especially from 19% to 25%. The results might be attributed to the fact that the pores between soil particles would provide shrinkage space. With the increase in water content, the water film on the clay particles became thicker, and the pore between particles got larger. Besides, the bond force between clay particles and effective stress decreased with the increase of water content, hindering the soil structure rearrangement.

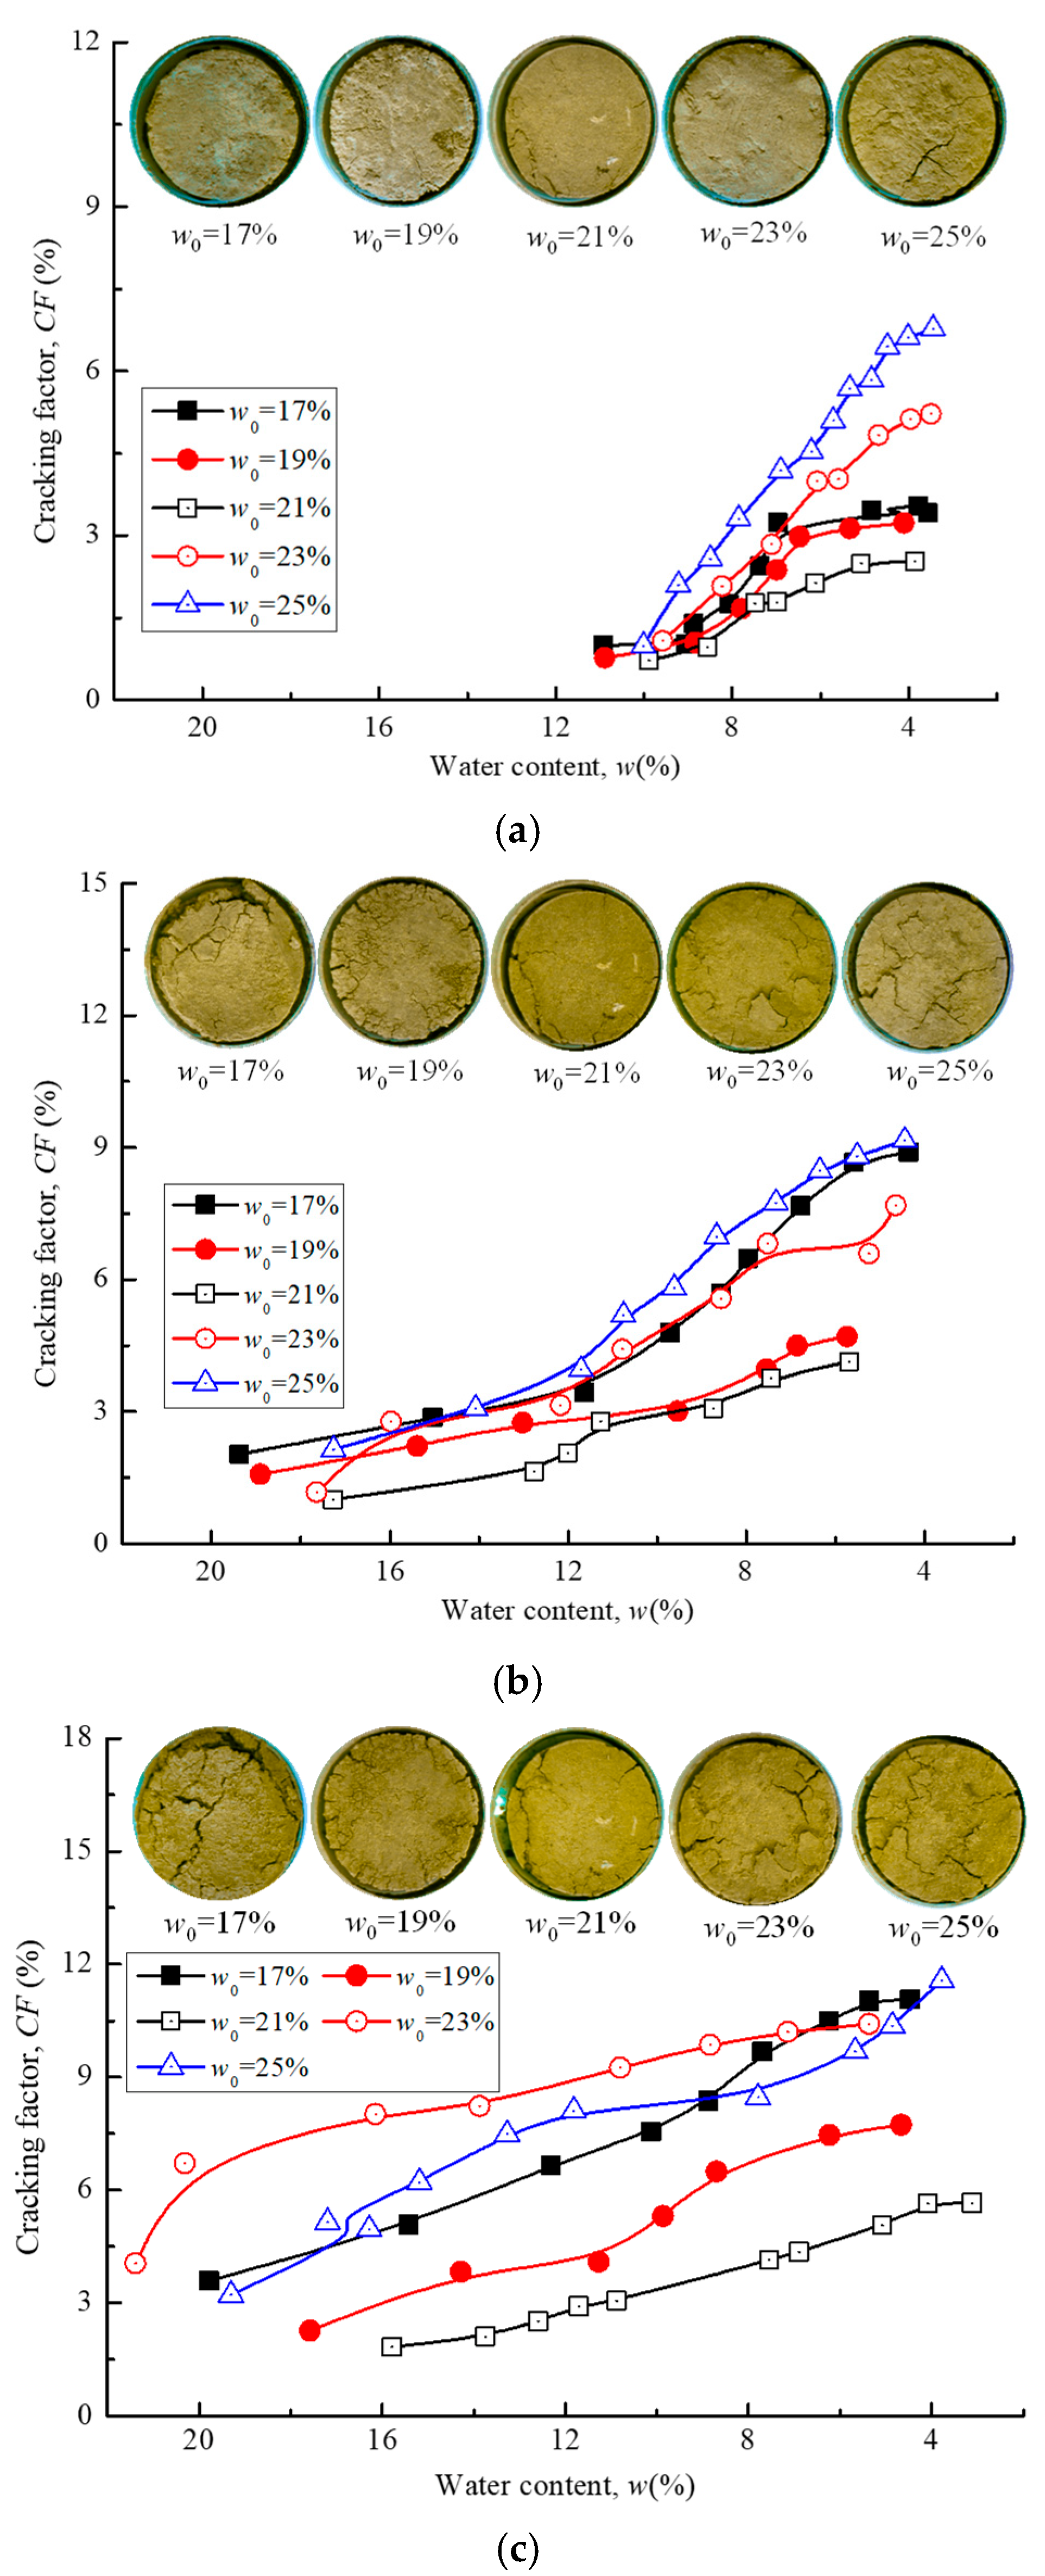
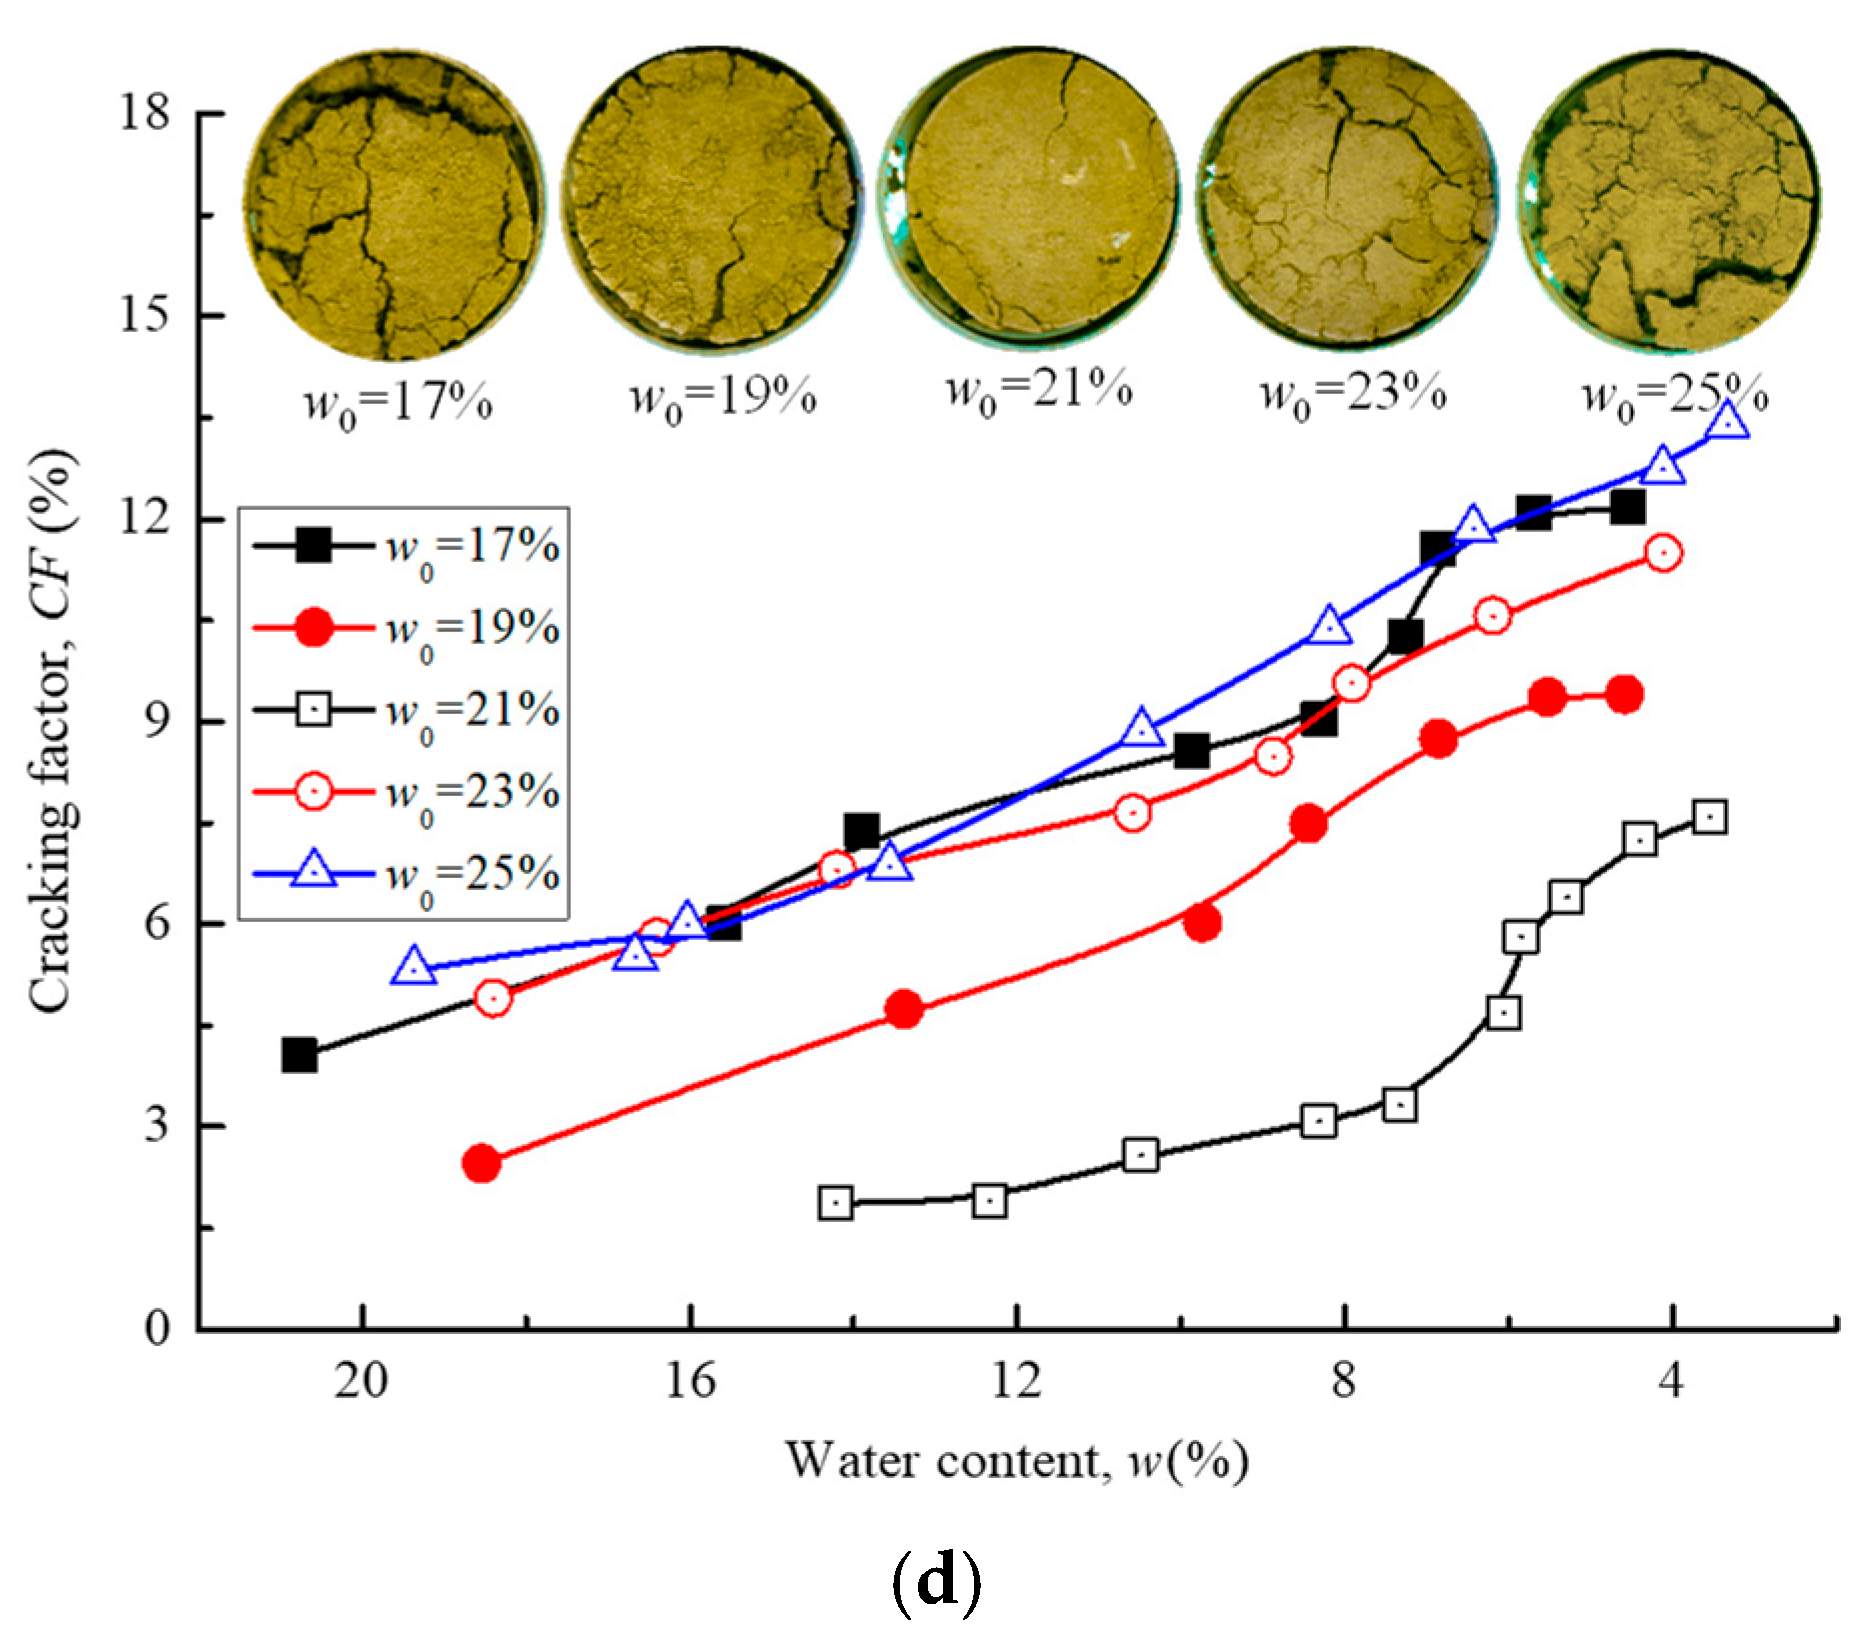
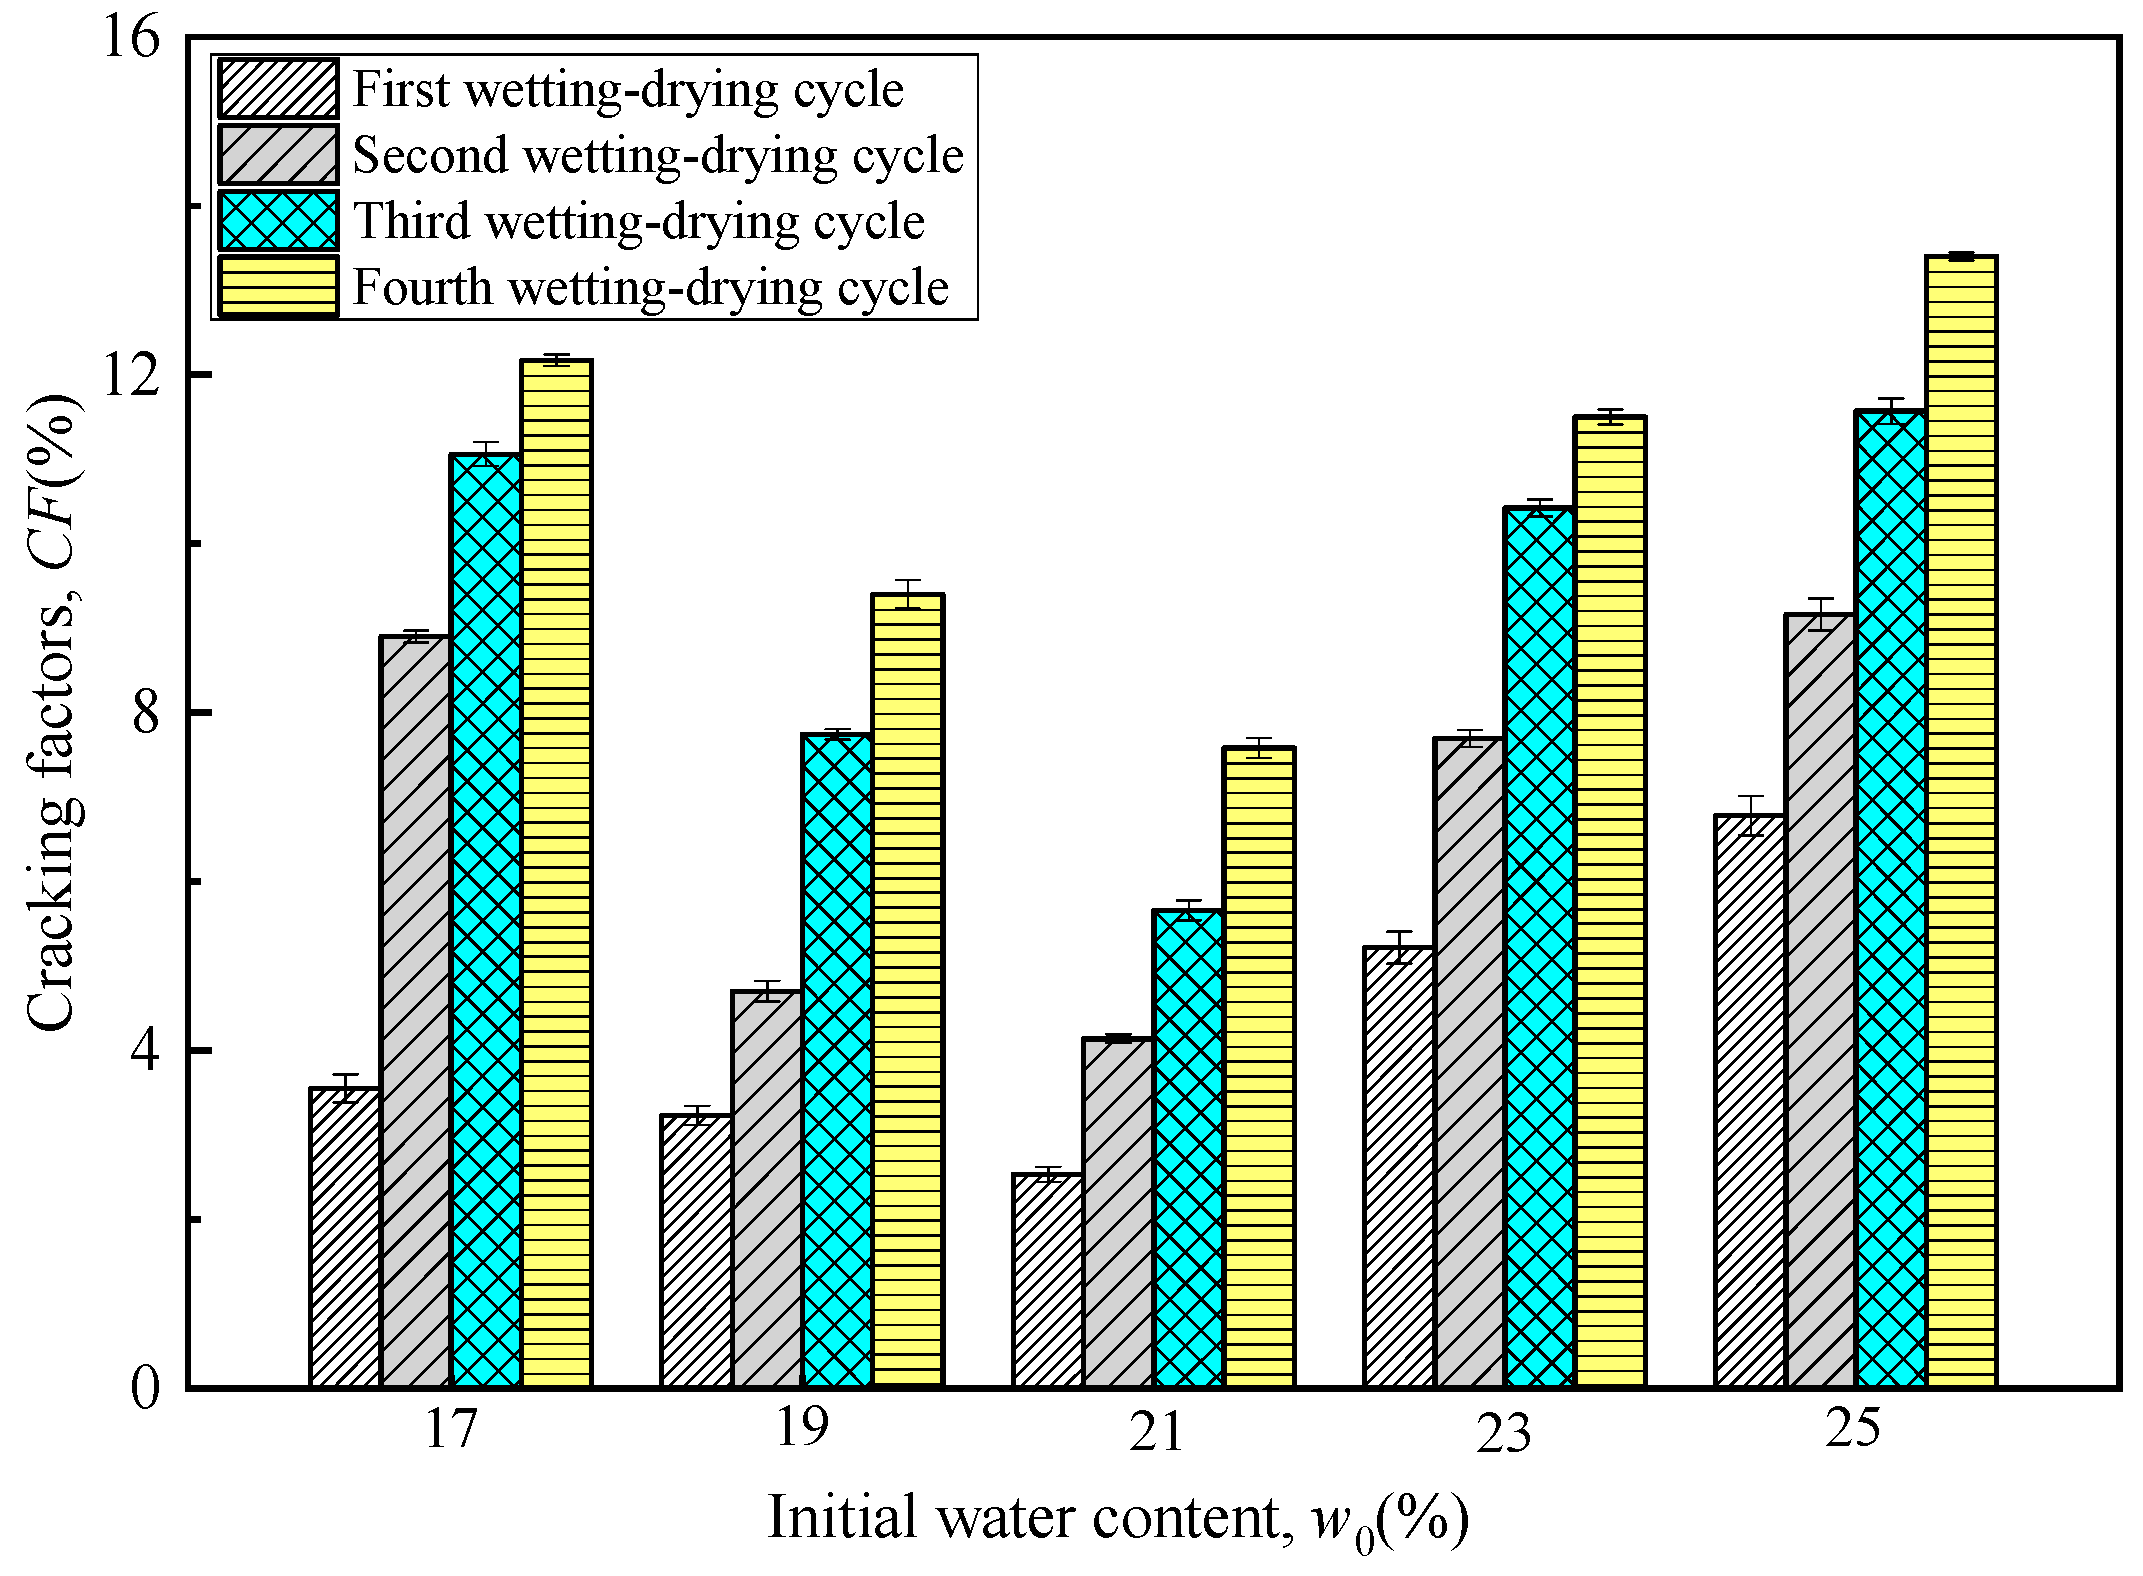
3.3. Cracking Characteristics

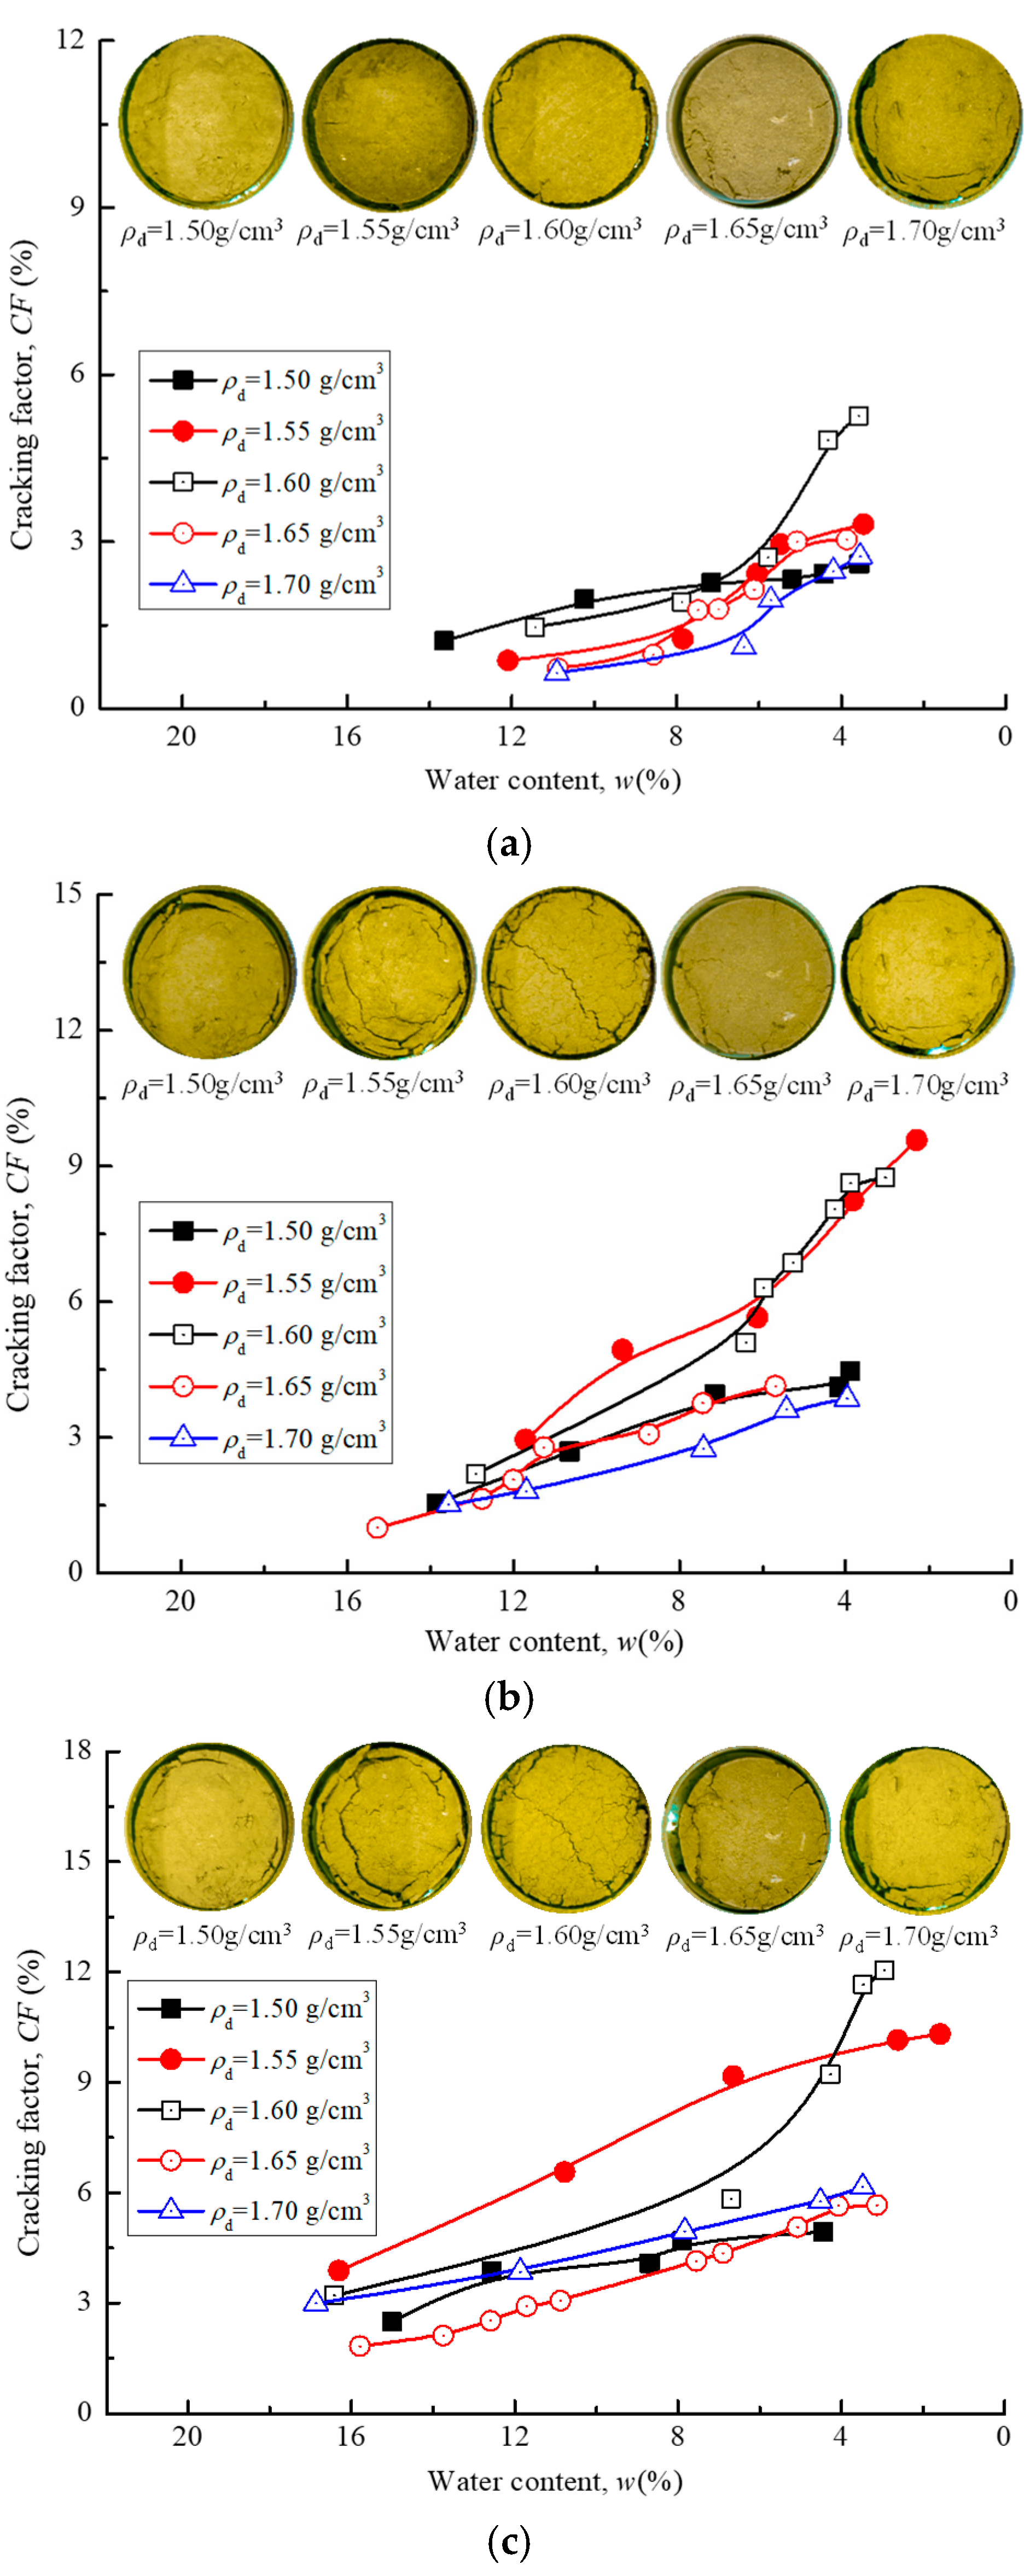
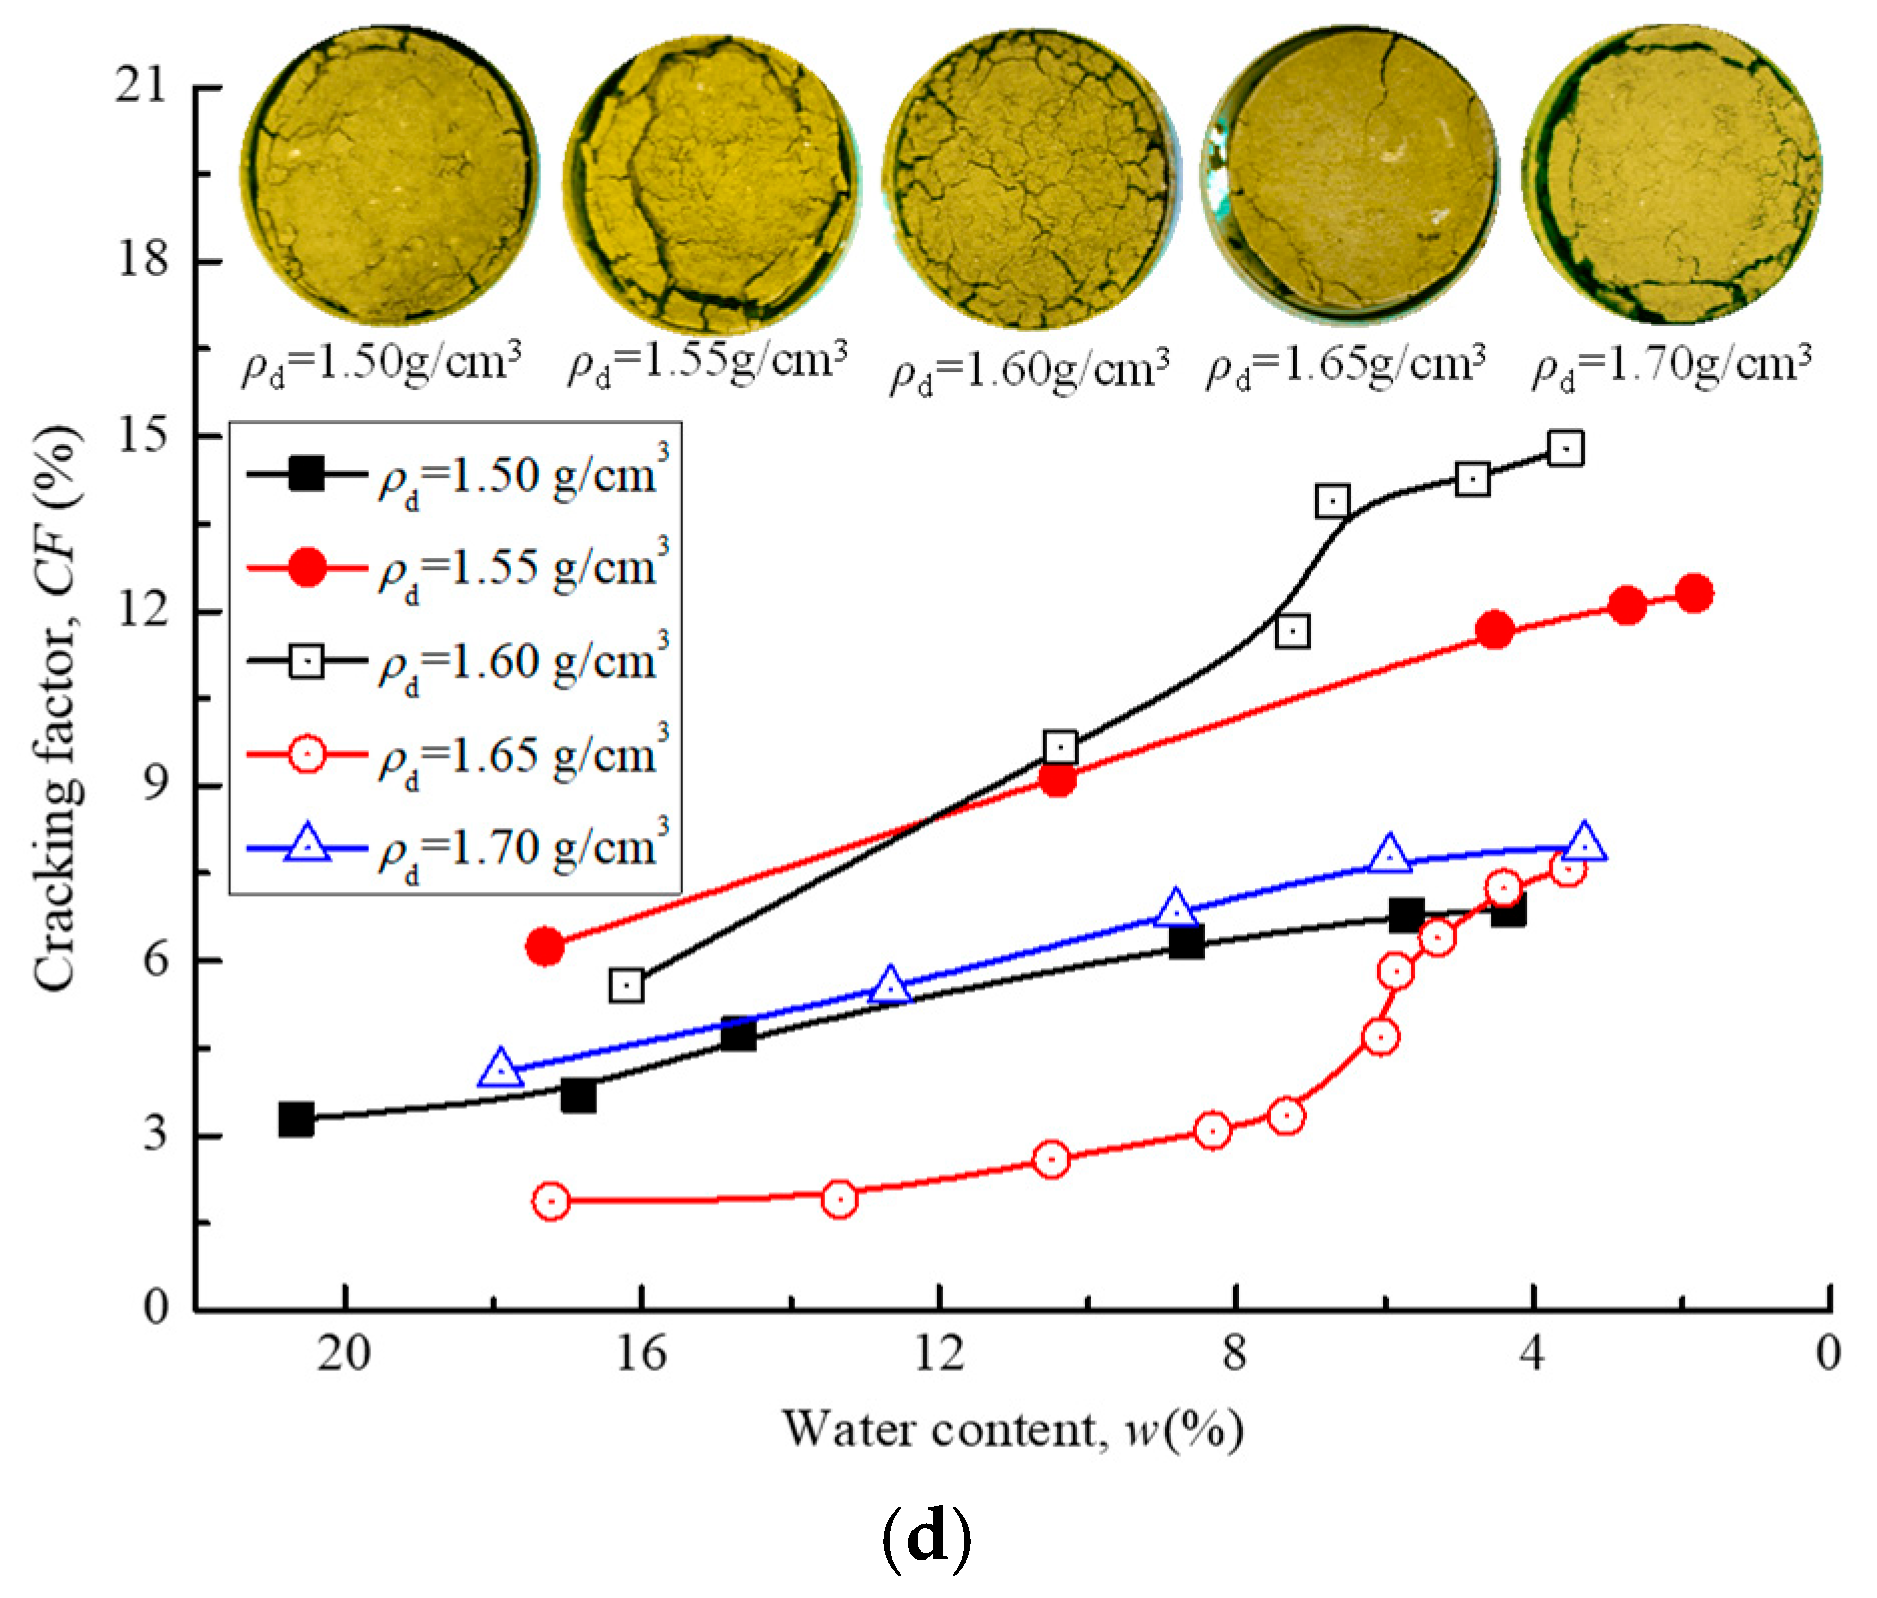
3.3.1. Influence of Initial Water Content

Figure 6a–d show cracking factors (CF) of compacted clay (the initial dry density of 1.65 g/cm3) with water content under different drying-wetting cycles. Under each drying-wetting cycle, the changes in cracking factor and the apparent pictures of compacted clay specimens were also shown in Figure 6a–d. It could be seen from all apparent pictures that the compacted clay specimens presented a significant volume shrinkage after each wetting-drying cycle. The first cracks only appeared on the compacted clay with an initial moisture content of 25% after the first wetting-drying cycle. As the times of the wetting-drying cycle increased, the cracking degree and cracks gradually became more and more obvious. The most significant cracking mainly occurred in the compacted specimens with an initial water content of 25%, while the cracks appeared in the compacted samples with an initial water content of 17%, 23%, and 19%, according to the weakening degree. The cracking degree was related to the compacted clay with a water content of 21%.
Moreover, it can also be observed from Figure 6a–d that the cracking factor (CF) gradually increased with the reduction of water content under the same initial dry density and initial water content. The result indicated that cumulative water loss was the main cause of the extension of the crack area. With the increasing times of wetting-drying cycles, the CF had a slight increase due to wetting, while it had a significant increase due to drying. Among all the compacted specimens, the CF of the compacted specimen with the initial water content of 21% was the smallest, which might be attributed to the close soil particles and large viscosity under the optimum water content and maximum dry density. However, the CF of the compacted specimen with a water content of 25% was the largest of all specimens. In particular, the CF of the compacted specimen with the initial water content of 25% changed from 0.99% to 6.78% when the water content decreased from 10.01% to 3.44% after the first wetting-drying cycle. The CF increased from 2.14% to 9.16% when the water content decreased from 17.26% to 4.44% after the second wetting-drying cycle. Similarly, the CF increased from 3.22% to 11.57% and from 5.32% to 13.40%, respectively, but the water content decreased from 19.30% to 3.78% and from 19.36% to 3.33% after the third and fourth wetting-drying cycles.
When the compacted clay was dehydrated and dried, the linkage between soil particles was first destroyed at the place with the lowest cohesion, accompanied by a few microcracks. The cracking would further cause irreversible structural changes in the compacted clay, and thus the bonding between soil particles was destroyed, and the structure was weakened. However, when the compacted clay was subjected to wetting, the rearranged soil structure would be weakened due to absorbing water. The initial micro cracks on the surface will partially heal due to clay expansion, decreasing the infiltration of water and the transient decrease in CF. With the infiltration of water, the cohesion between clay particles will be weakened. In the next drying process, the shrinkage and crack would be formed in the weakest link again, and thus the cracking degree and the CF increased again.
Figure 7 shows the cracking factors of compacted clay after different initial water content and wetting-drying cycles. It was evident in Figure 7 that the CF of compacted clay increased with the increase of the wetting-drying cycle under the same initial water content. The CF first decreased and then increased with the increase in the initial water content, and it reached the smallest at the initial water content of 21%. After four wetting-drying cycles, the CFs for compacted clay specimens with initial water contents of 17% to 25% were 12.17%, 9.4%, 7.58%, 11.5%, and 13.4%, respectively. The CF for compacted specimens with an initial moisture content of 25% was almost two times that with an initial moisture content of 21%. The above results indicated that initial moisture contents had a significant influence on the cracking of compacted clay. Therefore, it should be strictly controlled to reduce the cracking of the compacted layer.
Figure 8 shows a schematic diagram of a dry shrinkage model for compacted clay. In the saturated state, the soil particles are filled with pore water (Figure 8a). When the water content of the soil is lower than the shrinkage limit, the pore water evaporates from the soil surface. The bonded water film on the surface of soil particles gradually becomes thin and disappears, causing the meniscus to sag, the surface tension (Ts) to be eliminated, and the pore water pressure (Pc) to be generated. Pc is proportional to Ts, and inversely proportional to the curvature radius (R) of the meniscus. As water evaporates, Ts decreases and R increases, resulting in a decrease in Pc (Figure 8b). Under this action, the spacing between soil particles shrinks until cracking occurs (Figure 8c).

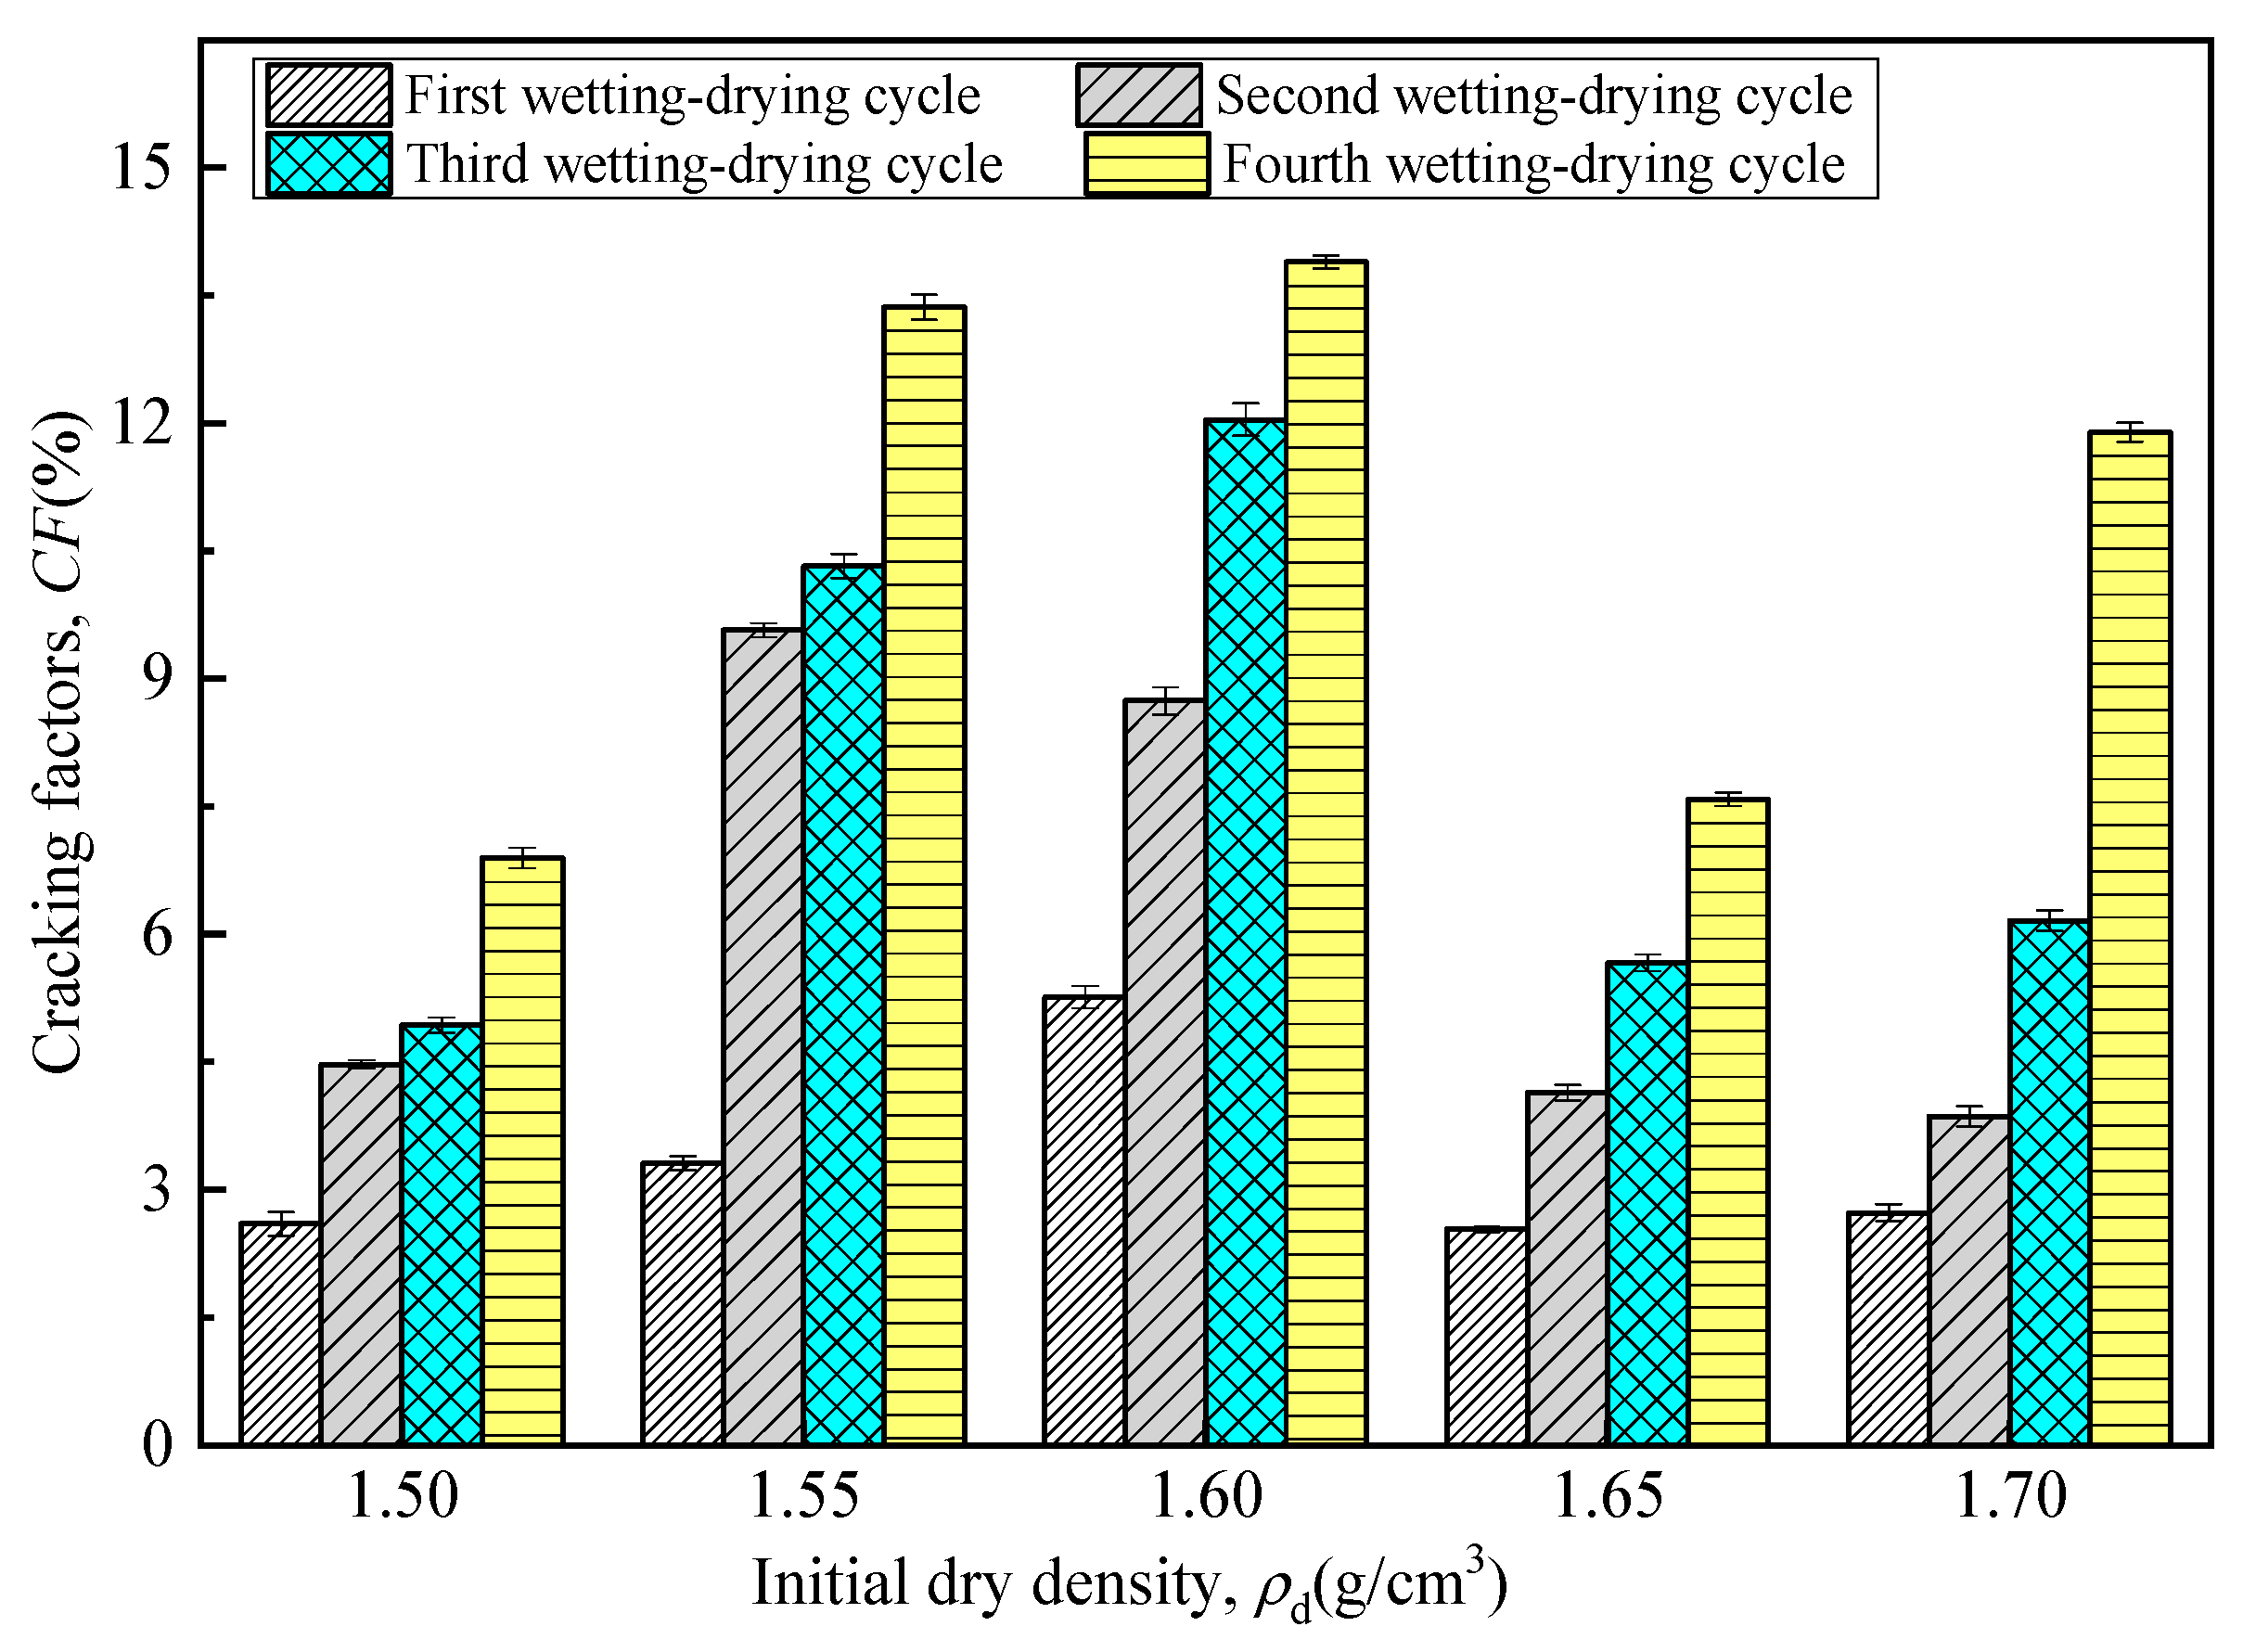
3.3.2. Influence of Initial Dry Density

Figure 9a–d show the cracking factors and apparent pictures of compacted clay specimens under different initial dry density and wetting-drying cycles. It can be observed that there was significant volume shrinkage in compacted clay specimens after the first wetting-drying cycle, which was similar to the change in Figure 6. Under the same initial conditions, the CF increased gradually with the decrease in moisture content and the increase of the wetting-drying cycle. For the compacted clay specimen with a dry density of 1.60 g/cm3, the CF increased from 1.46% to 5.26% when the water content decreased from 11.43% to 3.57% after the first wetting-drying cycle. The CF increased from 2.95% to 9.57% and from 3.21% to 12.04%, respectively, when the water content decreased from 16.71% to 2.92% after the second and third wetting-drying cycles. The CF increased from 5.58% to 13.89% when the water content decreased from 16.21% to 3.56% after four wetting-drying cycles.
Figure 10 shows the cracking factors of compacted clay after different initial dry density and wetting-drying cycles. The CF increased with the increasing wetting-drying cycle under the same condition. The CF of compacted clay specimens was 6.89%, 13.36%, 13.89%, 7.582%, and 11.892%, respectively, when the initial dry densities were 1.50 g/cm3, 1.55 g/cm3, 1.60 g/cm3, 1.65 g/cm3, and 1.70 g/cm3. The smaller CF at the dry density of 1.50 g/cm3 was attributed to the fact that the larger pores between particles provided sufficient space for the swelling of clay particles and the water-air migration during the wetting-drying cycle [21,24,37]. The smaller CF at the dry density of 1.65 g/cm3 might be because the small porosity in the compacted specimen limited the deep infiltration of water and the swelling and shrinkage of the soil in the wetting process. Nevertheless, the high permeability coefficient of the compacted clay under the dry density of 1.55 and 1.60 g/cm3 had the risk of losing its seepage-proof feature, which went against the Technical code for sanitary landfill of municipal domestic refuse (CJJ17, 2004). Therefore, the dry density of compacted clay should also be strictly controlled to decrease the rainfall infiltration and to maintain the seepage-proof function of the landfill cover.

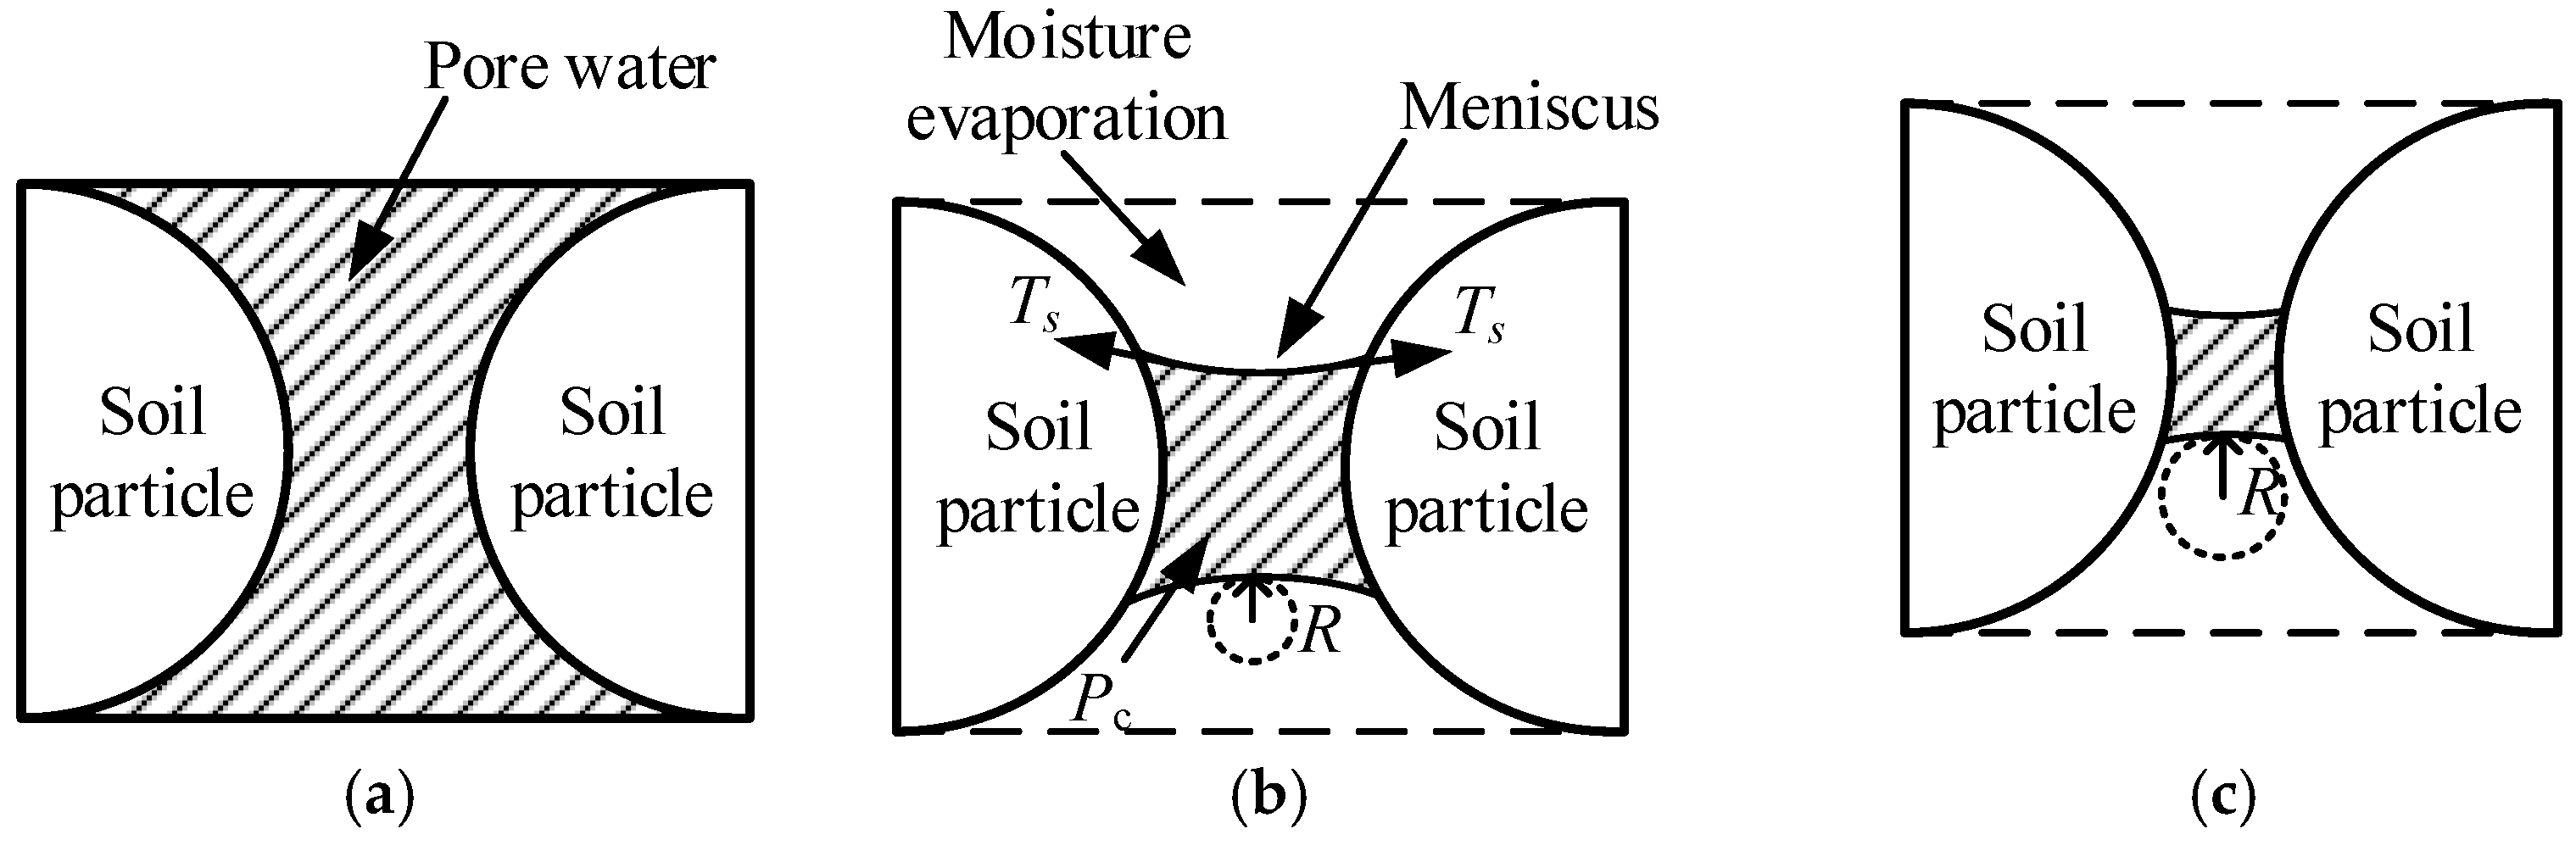
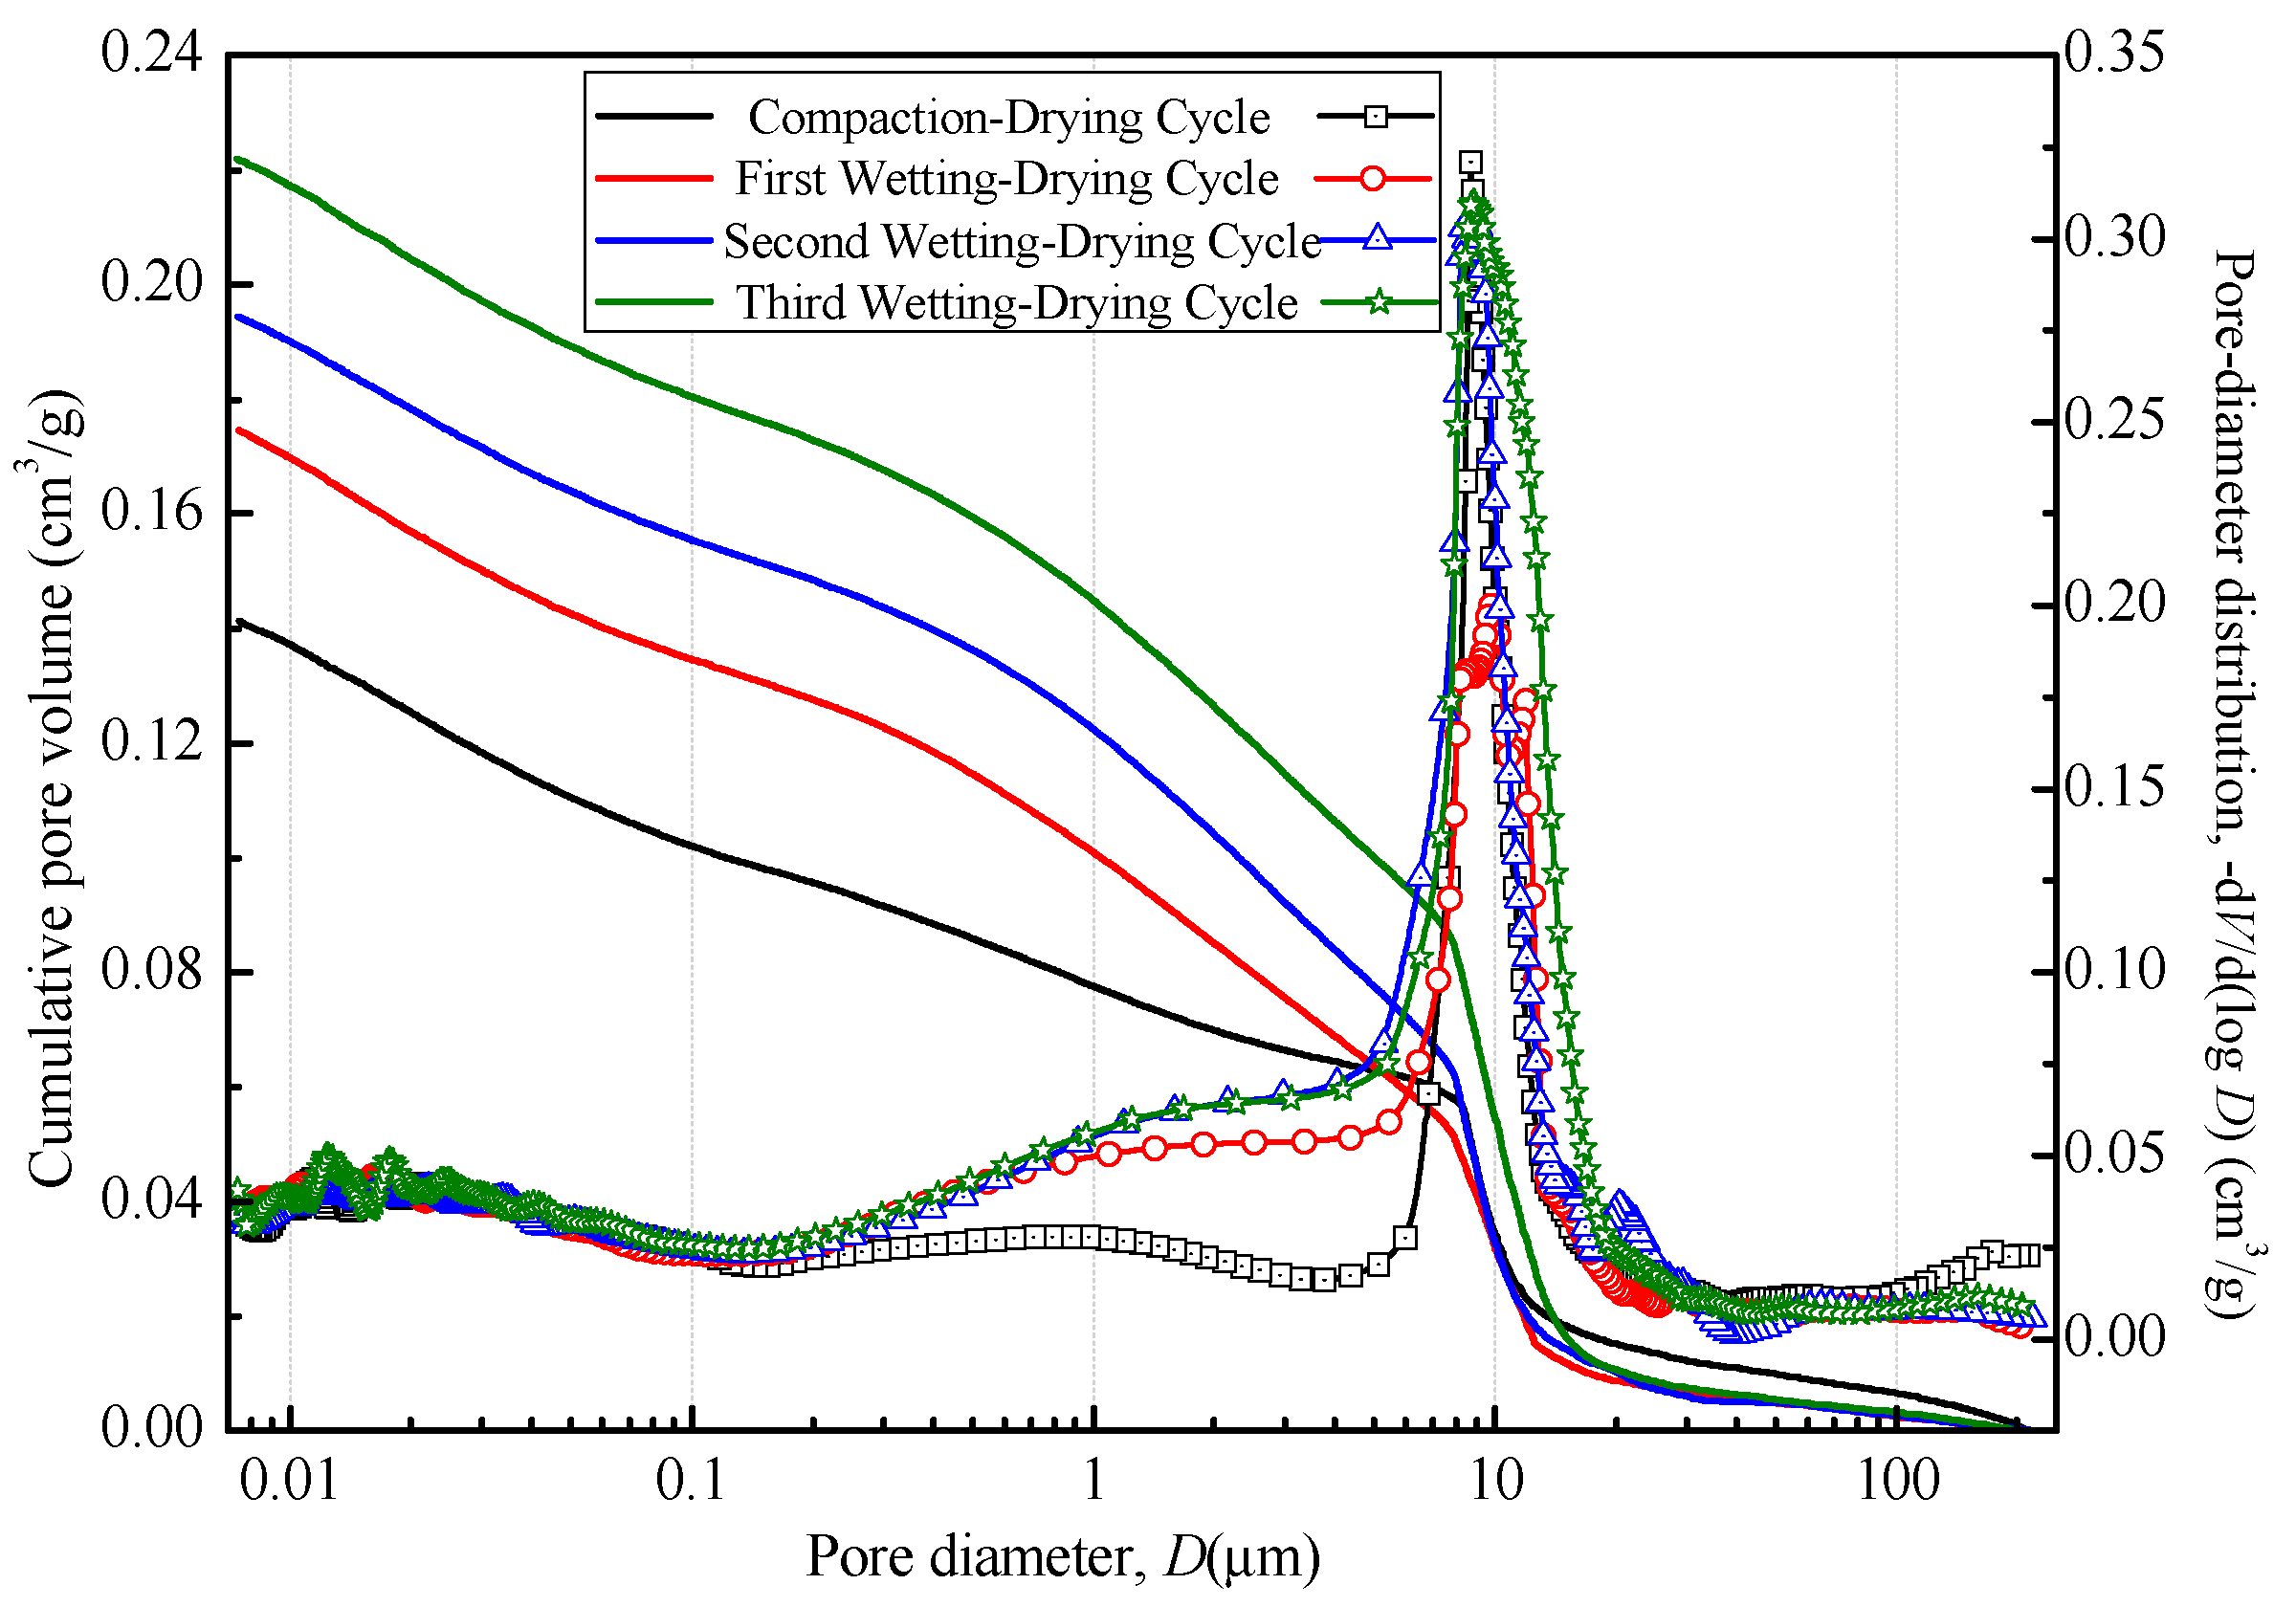
3.4. Microscopic Characteristics

Figure 11 shows the variation curves of the accumulated mercury volume intruded and the pore diameter distribution with the diameter. With the decrease of the pore diameter, the accumulated mercury volumes intruded underwent a gradual increase. For different drying phases of the compacted clay, their accumulated mercury volumes intruded showed obvious differences. When the pore diameter of the compaction-drying clay was over 10 μm, the mercury volume intruded ranked the highest. Still, it was of a small amount after three wetting-drying cycles, which indicated that wetting-drying cycles prompted the transformation of big pores to smaller ones. Combined with the decrease in the total pore volume, it can be considered that the sample was shrunk. Nevertheless, for all the pores except large pores(>10 μm), the mercury volumes intruded increased gradually with the increase of wetting-drying cycle times. After the compaction-drying cycle and three wetting-drying cycles, the accumulated mercury volumes intruded were 0.1414, 0.1746, 0.1944, and 0.222 cm3/g, respectively, and the corresponding pore diameter distribution peaked at middle-sized pores of 8.7, 9.8, 9.11, and 8.78–8.85 μm, being 0.321, 0.201, 0.303, and 0.31 cm3/g, respectively. This indicated that the mercury volume intruded was optimal for those pore diameters near the peak of the curve.
Table 3 shows the average pore distribution of samples under different dry-wet cycles in the MIP test. It can be seen from Table 3 that from the first compaction-drying cycle to more and more wetting-drying cycles, the total volume of accumulated mercury intruded increased gradually from 0.1414 cm3/g to 0.222 cm3/g. This indicates the promoting effect of wetting-drying cycles on the enlargement of pores and on cracking. Furthermore, the clay specimens’ microporosity and ultra-micro porosity underwent decrement from 17.96% and 19.59%, respectively, to 13.24% with the increase in dry and wet cycles. However, for the compacted clay subjected to the compaction-drying cycle and the first two wetting-drying cycles, its large porosity reduced significantly, but its middle-sized and tiny porosity increased significantly; after the third wetting-drying cycle, due to the overall enlargement of clay pores, their large porosity did not continue to reduce, and middle-sized and tiny porosity did not obviously reduce.

4. Conclusions

This study conducted clay cracking experiments under different working conditions, such as expansion and shrinkage, drying shrinkage, and wetting-drying cycles, as well as the mercury intrusion porosimetry (MIP) test. The following conclusions could be drawn based on the experimental results:
(1) The compacted clay with an initial water content of 21% and a dry density of 1.65 g/cm3 has the smallest vertical swelling ratio. However, the compacted clays with a dry density of 1.65 g/cm3 and initial water contents of 17% and 19% have a rather big vertical swelling ratio.
(2) Under the same dry density, the final vertical shrinkage ratio of the sample with a water content of 21% was the smallest, while that of the samples with a water content of 23% and 25% is rather big. Under the same water content, the final vertical shrinkage ratio decreases with the increase in dry density.
(3) After three wetting-drying cycles, compacted clay with a dry density of 1.65 g/cm3 and an initial water content of 21% produced the fewest cracks and had the lowest CF (only 7.582%). The compacted clay with the initial water content of 21% and the dry densities of 1.55 g/cm3 and 1.60 g/cm3 had rather significant cracking after four wetting-drying cycles.
(4) The cumulative mercury intake (total pore volume) increased with the increase in the number of dry and wet cycles. In the first two dry and wet cycles, the distribution of large pores decreased, and that of small pores increased. After the third cycle, the distribution of small and medium pores decreased slightly.
Based on the results of this study, some suggestions for practical engineering are put forward: (1) The cracking factor (CF) of clay should be taken into account when selecting the sealing soil in the landfill; (2) The initial water content and dry density of the clay should be controlled according to the optimal water content and maximum dry density to control its compactness; (3) The effect of initial water content on clay cracking is greater than that of dry density.

Author Contributions

Conceptualization, G.C.; methodology, Y.Z.; software, G.Z.; validation, G.Z.; formal analysis, Y.Z.; investigation, G.Z.; resources, G.C.; data curation, Y.Z.; writing—original draft preparation, G.C.; writing—review and editing, G.Z.; visualization, Y.Z.; supervision, G.C.; project administration, G.Z.; funding acquisition, G.C. All authors have read and agreed to the published version of the manuscript.

Funding

This research was funded by the Open Fund for State Key Laboratory of Geotechnical Mechanics and Engineering, grant number SKLGME021029 and Z019026; the CRSRI Open Research Program, grant number CKWV20221015/KY; National Natural Science Foundation of China, grant number 41902286 and 52074112, the Natural Science Foundation of Hubei Province, grant number 2021CFB491, Hubei Superior and Distinctive Discipline Group of “New Energy Vehicle and Smart Transportation”, and the Open Fund for Hubei Provincial Engineering Research Center of Slope Habitat Construction Technique Using Cement-based Materials, grant number 2022SNJ08.

Data Availability Statement

The data that support the findings of this study are available on request from the corresponding authors.

Acknowledgments

The authors are sincerely thankful for the funding support.

Conflicts of Interest

The authors declare no conflict of interest.

References

  1. Morris, P.H.; Graham, J.; Williams, D.J. Cracking in drying soils. Can. Geotech. J. 1992, 29, 263–277. [Google Scholar] [CrossRef]
  2. Sadek, S.; Ghanimeh, S.; El-Fadel, M. Predicted performance of clay-barrier landfill covers in arid and semi-arid environments. Waste Manag. 2007, 27, 572–583. [Google Scholar] [CrossRef] [PubMed]
  3. Bouazza, A.; Vangpaisal, T.; Abuel-Naga, H.; Kodikara, J. Analytical modeling of gas leakage rate through a geosynthetic clay liner–geomembrane composite liner due to a circular defect in the geomembrane. Geotext. Geomembr. 2008, 26, 122–129. [Google Scholar] [CrossRef]
  4. El-Zein, A.; Rowe, R.K. Impact on groundwater of concurrent leakage and diffusion of dichloromethane through geomembranes in landfill liners. Geosynth. Int. 2008, 15, 55–71. [Google Scholar] [CrossRef]
  5. Saidi, F.; Touze-Foltz, N.; Goblet, P. Numerical modeling of advective flow through composite liners in case of two interacting adjacent square defects in the geomembrane. Geotext. Geomembr. 2008, 26, 196–204. [Google Scholar] [CrossRef]
  6. Tay, Y.Y.; Stewart, D.I.; Cousens, T.W. Shrinkage and desiccation cracking in bentonite–sand landfill liners. Eng. Geol. 2001, 60, 263–274. [Google Scholar] [CrossRef]
  7. Osinubi, K.J.; Nwaiwu, C.M.O. Desiccation-induced Shrinkage in Compacted Lateritic Soils. Geotech. Geol. Eng. 2008, 26, 603–611. [Google Scholar] [CrossRef]
  8. Groenevelt, P.H.; Grant, C.D. Analysis of soil shrinkage data. Soil Till. Res. 2004, 79, 71–77. [Google Scholar] [CrossRef]
  9. Miller, C.J.; Mishra, M. Modeling of leakage through cracked clay liners-I: State of the art. Water Resour. Bull. AWRA. 1989, 25, 551–555. [Google Scholar] [CrossRef]
  10. Albrecht, B.A.; Benson, C.H. Effect of Desiccation on Compacted Natural Clays. J. Geotech. Geoenviron. Eng. 2001, 127, 67–75. [Google Scholar] [CrossRef]
  11. Liu, J.P.; Yang, P.; Yang, Z.H. Water and salt migration mechanisms of saturated chloride clay during freeze-thaw in an open system. Cold Reg. Sci. Technol. 2021, 186, 103277. [Google Scholar] [CrossRef]
  12. Wang, J.H.; Zhang, F.; Yang, Z.H.; Yang, P. Experimental investigation on the mechanical properties of thawed deep permafrost from the Kuparuk River Delta of the North Slope of Alaska. Cold Reg. Sci. Technol. 2022, 195, 103482. [Google Scholar] [CrossRef]
  13. Xue, Q.; Zhao, Y.; Liu, L.; Lu, H.J. Study of Thermo-Hydro-Mechanical-Chemical Coupling Effect of Catastrophe Process of Laddfill. Chin. J. Rock Mech. Eng. 2011, 30, 1970–1988. [Google Scholar]
  14. Li, J.H.; Zhang, L.M. Study of desiccation crack initiation and development at ground surface. Eng. Geol. 2011, 123, 347–358. [Google Scholar] [CrossRef]
  15. Peng, M.; Zhang, L.M. Breaching parameters of landslide dams. Landslides 2011, 9, 13–31. [Google Scholar] [CrossRef]
  16. Xu, Y.; Zhang, L.M. Breaching parameters of earth and rockfill dams. J. Geotech. Geoenviron. Eng. 2009, 135, 1957–1970. [Google Scholar] [CrossRef]
  17. Liu, P.; Shao, G.H.; Huang, R.P. Treatment of bayer-process eed mud through microbially induced carbonate precipitation. J. Mater. Civ. Eng. 2021, 33, 4021067. [Google Scholar]
  18. Nowamooz, H.; Mrad, M.; Abdallah, A.; Masrouri, F. Experimental and numerical studies of the hydromechanical behaviour of a natural unsaturated swelling soil. Can. Geotech. J. 2009, 46, 393–410. [Google Scholar]
  19. Rodríguez, R.; Sánchez, M.; Ledesma, A.; Lloret, A. Experimental and numerical analysis of desiccation of a mining waste. Can. Geotech. J. 2007, 44, 644–658. [Google Scholar]
  20. Tang, C.S.; Cui, Y.J.; Shi, B.; Tang, A.M.; Liu, C. Desiccation and cracking behaviour of clay layer from slurry state under wetting–drying cycles. Geoderma 2011, 166, 111–118. [Google Scholar] [CrossRef] [Green Version]
  21. Tang, C.S.; Shi, B.; Liu, C.; Zhao, L.Z.; Wang, B.J. Influencing factors of geometrical structure of surface shrinkage cracks in clayey soils. Eng. Geol. 2008, 101, 204–217. [Google Scholar] [CrossRef]
  22. Liu, S.Y.; Ji, P.; Fang, L. Approach to cyclic swelling behavior of compacted expansive clays. Chin. J. Geotech. Eng. 1999, 21, 9–13. [Google Scholar]
  23. Nahlawi, H.; Kodikara, J.K. Laboratory experiments on desiccation cracking of thin soil layers. Geotech. Geol. Eng. 2006, 24, 1641–1664. [Google Scholar] [CrossRef]
  24. Tang, C.S.; Cui, Y.J.; Tang, A.M.; Shi, B. Experiment evidence on the temperature dependence of desiccation cracking behavior of clayey soils. Eng. Geol. 2010, 114, 261–266. [Google Scholar] [CrossRef] [Green Version]
  25. Vogel, H.J.; Hoffmann, H.; Roth, K. Studies of crack dynamics in clay soil. Geoderma 2005, 125, 203–211. [Google Scholar] [CrossRef]
  26. Kodikara, J.K.; Choi, X. A simplified analytical model for desiccation cracking of clay layers in laboratory tests. Unsaturated Soils 2006, 12, 2558–2569. [Google Scholar]
  27. Konrad, J.M.; Ayad, R. Desiccation of a sensitive clay-field experimental observations. Can. Geotech. J. 1997, 34, 929–942. [Google Scholar] [CrossRef]
  28. Peron, H.; Laloui, L.; Hueckel, T.; Hu, L.B. Desiccation cracking of soils. Eur. J. Environ. Civ. Eng. 2009, 13, 869–888. [Google Scholar] [CrossRef]
  29. Camp, S.; Gourc, J.P.; Ple, O. Landfill clay barrier subjected to cracking: Multi-scale analysis of bending tests. Appl. Clay Sci. 2010, 48, 384–392. [Google Scholar] [CrossRef]
  30. The Ministry of Construction of the People’s Republic of China. Technical Code for Sanitary Landefill of Municipal Domestic Refuse (CJJ17-2004); China Building Industry Press: Beijing, China, 2004.
  31. Zhong, Y.Q.; Cai, G.H.; Wang, S.Q.; Qin, H.J.; Zhang, C.H.; Li, J.S. Influence of Organic Content on the Mechanical Properties of Organic-Rich Soils Stabilized with CaO-GGBS Binder and PC. Water 2022, 14, 3053. [Google Scholar] [CrossRef]
  32. Cai, G.H.; Zhou, Y.F.; Poon, C.S.; Li, J.S. Engineering performance and microstructure characteristics of natural marine sediment stabilized with quicklime-activated GGBS under different lime proportions. Mar. Georesour. Geotechnol. 2022, 1–15. [Google Scholar] [CrossRef]
  33. Chertkov, V.Y.; Ravina, I. Shrinking–swelling phenomenon of clay soils attributed to capillary-crack network. Theor. Appl. Fract. Mech. 2000, 34, 61–71. [Google Scholar] [CrossRef]
  34. Konrad, J.M.; Ayad, R. A idealized framework for the analysis of cohesive soils undergoing desiccation. Can. Geotech. J. 1997, 34, 477–488. [Google Scholar] [CrossRef]
  35. Cai, G.H.; Zhou, Y.F.; Li, J.S.; Han, L.J.; Poon, C.S. Deep insight into mechanical behavior and microstructure mechanism of quicklime-activated ground granulated blast-furnace slag pastes. Cem. Concr. Compos. 2022, 134, 104767. [Google Scholar] [CrossRef]
  36. Kong, L.R.; Huang, H.W.; Zhang, D.M.; Hicher, P.Y. Experiment study on eelationship between pore distribution and different stress levels due to consolidation of soft clays. Chin. J. Undergr. Space Eng. 2007, 3, 1036–1040. [Google Scholar]
  37. Xue, Q.; Zhang, Q. Effects of leachate concentration on the integrity of solidified clay liners. Waste Manag. Res. 2014, 32, 198–206. [Google Scholar] [CrossRef]
  38. Tang, A.M.; Cui, Y.J.; Vu, M.N. Effects of the maximum soil aggregates size and cyclic wetting–drying on the stiffness of a lime-treated clayey soil. Géotechnique 2011, 61, 421–429. [Google Scholar] [CrossRef]
  39. Tang, C.S.; Shi, B.; Liu, C.; Suo, W.B.; Gao, L. Experimental characterization of shrinkage and desiccation cracking in thin clay layer. Appl. Clay Sci. 2011, 52, 69–77. [Google Scholar] [CrossRef]
Figure 1. Expansion test of compacted clay after absorbing water.
Separations 09 00424 g001
Figure 2. Image acquisition equipment of compacted clay.
Separations 09 00424 g002
Figure 3. The vertical swelling ratio of compacted clay by time for different initial water content/dry density. (a) Influence of initial water content. (b) Influence of initial dry density.
Separations 09 00424 g003
Figure 4. The longitudinal shrinkage ratio of compacted clay by time for different initial water content/dry density. (a) Influence of initial water content. (b) Influence of initial dry density.
Separations 09 00424 g004
Figure 5. The shrinkage ratio of compacted clay with the dry density and the initial water content. (a) Longitudinal shrinkage ratio. (b) Radial shrinkage ratio. (c) Volume shrinkage ratio.
Separations 09 00424 g005
Figure 6. Cracking factors of compacted clay with water content. (a) The drying process of the first wetting-drying cycle. (b) The drying process of the second wetting-drying cycle. (c) The drying process of the third wetting-drying cycle. (d) The drying process of the fourth wetting-drying cycle.
Separations 09 00424 g006aSeparations 09 00424 g006b
Figure 7. Cracking factors of compacted clay after different initial water content and wetting-drying cycles. Note: error bars are the values of the repetitions.
Separations 09 00424 g007
Figure 8. Dry shrinkage model. (a) Saturated soils. (b) Liquid surface depression. (c) Decrease in particle spacing.
Separations 09 00424 g008
Figure 9. Cracking factors of compacted clay with water content under different dry densities. (a) After the first wetting-drying cycle. (b) After the second wetting-drying cycle. (c) After the third wetting-drying cycle. (d) After the fourth wetting-drying cycle.
Separations 09 00424 g009aSeparations 09 00424 g009b
Figure 10. Influence of initial dry density on cracking factors of compacted clay after different wetting-drying cycles. Note: error bars are the values of the repetitions.
Separations 09 00424 g010
Figure 11. The variation curves of the accumulated mercury volume intruded and the pore diameter distribution with the diameter.
Separations 09 00424 g011
Table 1. The physical indexes of clay soil.
PropertyValue
Natural moisture content, wn/%27
Natural unit weight, γ (kN/m3)41.4
Optimum water content, wopt (%)20.7
Maximum dry density, ρdmax (g/cm3)1.66
Liquid limit, wL/%38.9
Plastic limit, wP/%22.5
Plasticity index, IP16.4
Specific gravity, GS2.72
Grain-size distribution/%<0.005 mm57
0.005–0.075 mm33
>0.075 mm10.0
Soil pH (water: soil = 2:1)8.27
Table 2. Main chemical compositions of clay.
MgOAl2O3CaOSiO2Fe2O3Na2OK2OTiO2Loss on Ignition
0.2823.800.4360.690.302.034.030.038.21
Table 3. The average porosity distribution of the compacted clay under the different drying conditions.
SamplesTotal Mercury Amount/[cm3/g]Large Porosity/%Middle-Sized Porosity/%Small Porosity/%Tiny Porosity/%Ultra-Micro Porosity/%
>10 μm2.5~10 μm0.4~2.5 μm0.04~0.4 μm<0.04 μm
Compaction-Drying Cycle0.141424.04524.04514.3617.9619.59
First Wetting-Drying Cycle0.174618.2727.3818.3815.8616.55
Second Wetting-Drying Cycle0.194416.5133.5421.9113.8914.15
Third Wetting-Drying Cycle0.222024.5929.4119.5013.2413.24
Publisher’s Note: MDPI stays neutral with regard to jurisdictional claims in published maps and institutional affiliations.

