Article

A New Partially Phosphorylated Polyvinyl Phosphate-PPVP Composite: Synthesis and Its Potentiality for Zr (IV) Extraction from an Acidic Medium

1
INPOLDE Research Center, Department of Chemistry, Physics and Environment, Faculty of Sciences and Environment, Dunarea de Jos University of Galati, 47 Domneasca Street, 800008 Galati, Romania
2
Institute of Physics and Technology, Ural Federal University, Yekaterinburg 620002, Russia
3
Physics Department, Faculty of Science, Al-Azhar University, Assiut 71524, Egypt
4
Nuclear Materials Authority, El-Maadi, Cairo 11381, Egypt
5
Faculty of Science, Zagazig University, Zagazig 44519, Egypt
6
Department of Chemistry, College of Science, Taibah University, Al-Madinah Al-Munawarah 30002, Saudi Arabia
7
Department of Criminal Justice and Forensics, King Fahad Security College, Riyadh 11461, Saudi Arabia
8
Geology Department, Faculty of Science, Al-Azhar University, Assiut 71524, Egypt
9
Physics Department, Faculty of Science, University of Tabuk, Tabuk 47512, Saudi Arabia
10
Department of Chemistry, College of Science and Arts, King Abdulaziz University, Rabigh 25726, Saudi Arabia
11
Faculty of Science, King Khalid University, Abha 61413, Saudi Arabia
*
Authors to whom correspondence should be addressed.
Separations 2022, 9(11), 382; https://doi.org/10.3390/separations9110382
Submission received: 17 October 2022 / Revised: 16 November 2022 / Accepted: 17 November 2022 / Published: 21 November 2022

Abstract

:
A newly synthesized partially phosphorylated polyvinyl phosphate derivative (PPVP) was functionalized to extract Zirconium (IV) from Egyptian zircon sand. The specifications for the PPVP composite were approved effectively via different techniques, namely, FT-IR, XPS, BET, EDX, TGA, 1H-NMR, 13C-NMR, GC-MS, XRD and ICP-OES analyses, which demonstrated a satisfactory synthesis of PPVP and zircon dissolution from Egyptian zircon sand. Factors controlling parameters, such as pH values, shaking time, initial zirconium concentration, PPVP dose, nitrate ions concentration, co-ions, temperature and eluting agents, have been optimized. At 25 °C, pH 0, 20 min shaking, 0.05 mol/L zirconium ions and 0.5 mol/L nitrate ions, PPVP has an exciting preservation potential of 195 mg/g, equivalent to 390 mg/L zirconium ions. From the extraction–distribution isotherm, the practical outcomes of Langmuir’s modeling are better than the Freundlich model. With a theoretical value of 196.07 mg/g, which is more in line with the experimental results of 195 mg/g. The zirconium ions adsorption onto the PPVP composite follows the pseudo-second-order kinetics with a theoretical capacity value of 204.08 mg/g. According to thermodynamic potential, the extraction process was expected to be an exothermic, spontaneous and beneficial extraction at low temperatures. The thermodynamic parameters ΔS (−0.03 kJ/mol), ΔH (−12.22 kJ/mol) and ΔG were also considered. As the temperature grows, ∆G values increase from −2.948 kJ/mol at 298 K to −1.941 kJ/mol at 338 K. Zirconium ions may be eluted from the working loaded PPVP by 0.025M HNO3, with a 99% efficiency rate. It was found that zirconium ions revealed good separation factors towards some co-ions such as Hf4+ (28.82), Fe3+ (10.64), Ti4+ (28.82), V5+ (86.46) and U6+ (68.17). A successful alkali fusion technique with NaOH flux followed by the extraction with PPVP is used to obtain a high-purity zirconia concentrate with a zircon content of 72.77 % and a purity of 98.29%. As a result of this, the improved factors could finally be used.

1. Introduction

Among the many elements that have found widespread use in modern science and industry is Zirconium (Zr). For nuclear applications, coating structural materials with zirconium alloys is a standout application [1].
Zirconium Silicate (ZrSiO4), popularly known as Zircon, is the primary source of Zirconium, related compounds, and alloys [2]. In nature, hafnium (Hf) and zirconium (Zr) minerals are often found together because of their similar chemical and physical characteristics. A problematic separation is required because of the resemblance between Zr and Hf [3,4].
The fact that Hf, in contrast to Zr, is a good neutron absorber is one of these elements’ most notable characteristics. In order to use Zr concentrated in nuclear reactors, one must provide Hf levels of less than 100 ppm [5]. In order to use zirconium tubes holding nuclear fuel, the separation of these elements is critical. It is necessary to use complex methods in order to separate Zirconium and hafnium. Of the commercially available methods, four are currently in industrial use: fractional crystallization, solvent extraction, chloride distillation and ion exchange [6].
Zirconium-oxychloride is mostly made from zircon sand [7,8]. Several studies have attempted to overcome the chemical inertness of Zircon to develop processing methods; currently, Zircon is processed using a different technique, such as chlorination [9,10,11], sodium hydroxide [12,13,14,15], sodium carbonate incorporation [16], mixed alkali fusion [17], the use of other alkali metal oxides such as liming and plasma thermal dissociation with carbon [18,19,20,21]. NaOH fusion, the most popular approach, has the advantages of being simple to use and requiring a relatively low reaction temp [22].
Alkali fusion, water leaching, acid leaching, drying and crystallization are all steps to hydrate zirconium oxychloride [23]. To produce zirconium compounds, the alkali fusion process has become an essential step [24]. Due to the viscosity of molten alkali, the alkali/zircon mass ratio is typically between 1.3 and 1.5, and the alkali content in raw materials is typically 60 wt%, which causes continuous application to be difficult, leading to non-homogeneous reaction and the contamination of alkali mist [25,26].
To achieve zirconium recovery from different matrices, different techniques are required. Solvent extraction (SX), adsorption and ion exchange (IX) and precipitation processes are applied [27]. Hydrometallurgy’s recovery of strategic metals often involves solvent extraction. The solvent extraction efficiency is affected by a number of variables, including the category of separation equipment used, the flow sheets implemented, the characteristics of the feed solution, the extraction solvent composition and the flow rates (time shaking) of both organic and aqueous phases during the extraction and stripping process [28]. Extractant is the most essential component of the SX process. It should be highly soluble in the organic solvent and of very low solubility in the aqueous phase. Solvents used to produce the element should be safe, non-volatile, non-flammable and free of harmful substances for industrial use [29].
Previous investigations have employed several extractants to extract Zirconium using a solvent extraction approach. Organophosphorus compounds have been applied in zirconium extraction processes such as TBP/HNO3 [30,31], TBP/HCl [32,33], Cyanex 923/TBP mixture [34], Cyanex 272 [35], Cyanex 272/TOPO mixture [36], MAPO (mixed alkyl phosphine oxides) [37], Cyanex 272/TBP mixture [38], P204/DIBK mixture in NH4SCN medium [39], D2EHPA in kerosene [40,41], Cyanex 301 and Cyanex 302 [42,43,44]. LIX extractant systems were proved to be more efficient for Zr than other elements in different matrices [45,46,47]. Various ligand systems have been proposed for the selective extraction of Zirconium with higher separation factors, including higher organic acids (Versatic acid 10), [48] chelating ketones [49,50] and chelating amides [51,52].
The extraction of anionic metallic complexes using long-chain amines was shown to be highly effective. They are broadly applied to extract Zirconium over hafnium such as n-octylaniline/xylene from succinate medium [53], Aliquate 336 and Alamine 336 [54], Aliquate 336S [55,56], a mixture of Aliquate 336 and TBP [57], Aliquat 336 and DOSO mixtures [58], Aliquat 336 and TOPO [59], Tri-octylamine (TOA) [60], Primene JMT (a long-chain primary amine) [61], Tri-2-Ethylhexyl amine (TEHA) [62] and Hyamine 1622 (Hn) [63].
In terms of volume, polyvinyl alcohol (PVA) is the world’s principal synthetic water-soluble polymer [64]. PVA has a good chemical resistance, a worthy mechanical character, a respectable film-creating capability and a high biocompatibility [65]. The biodegradability of PVA in the presence of appropriate microorganisms is also a benefit. When it comes to making ecologically friendly materials, PVA has a wide range of applications because of its numerous helpful qualities [66]. PVA, on the other hand, is an inert substance. Improved reactivity can be achieved by adding chemical functionalities [67]. It is possible to make chemical alterations to PVA through its hydroxyl groups, such as esterification, etherification, or acetalization of the hydroxyl groups [68,69,70,71,72].
Textile [73,74], coating and corrosion [75], fire-retardant [76], electrolyte [77], membrane [78], metal chelating [79] and paper production [80] are all examples of applications where PPVA has been used. PPVA has also been used to make sensors [81], synthetic bone teeth [82], electrical and optical devices [83] as well as nanoparticle/nano-composite [84].
In this work, a new partially phosphorylated polyvinyl phosphate (PPVP) was synthesized and employed for zirconium extraction from a highly acidic solution of Egyptian zircon sand. Different instrumentations characterized the new PPVP. The extraction and stripping parameters were optimized. Physico-chemical aspects examine the kinetics, equilibrium and thermodynamics of zirconium extraction from Egyptian zircon concentrate.

2. Experimental

2.1. Instrumentation

The Sartorins TE 214S type of analytical balance with a high sensitivity of 10−5 g was used to weigh each sample. A digital pH meter of the Digimed DM-21 (São Paulo, Brazil) type was used to detect the hydrogen ion concentration; the error estimated was ±0.1. The liquid contents of the separating funnels were shaken for the equilibrium trials using a Vibromatic-384 shaker. With gelatin serving as a protective colloid and Xylenol Orange (XO) serving as an indicator at 530 nm, Zr(IV) was quantitatively analyzed by a single-beam spectrometer built by Meterch Inc. (SP-8001) [85,86]. In a solution of 0.8 M HCl, the Zr-XO complex has a molar absorptivity of 7.5 × 10⁴ (a = 0.75). The resultant zirconium concentrate was specified using ICP-OES (Prodigy High Dispersion ICP, California, TExxLEDYNE-Leeman Labs USA), and the tolerance limit of the co-existing ions was established. The X-Ray Diffraction technique (XRD), a PHILIPS PW 3710/31 diffractometer with a scintillation counter, a Cu-target tube and an Ni filter at 40 kV and 30 mA were used. By employing KBr discs, the Gasco-Japan FT-IR 4100 spectrometer capturing IR spectra at 400 MHZ was used to record. The 1H,13C-NMR spectra by the mercury 400 Bruker spectrometer utilized DMSO as the solvent; a spectroscopic study of the diluted solution was carried out at 293 K. Reports on the coupling constant (J) and chemical shift (δ) are given in ppm and hertz (Hz), respectively. The Finnigan SSQ 7000 spectrophotometer was used for the GC-MS analyses. The National Research Center (NRC), laboratories in Cairo, Egypt, conducted the 1H-NMR analysis, and the FT-IR, GC-MS and 1H,13C-NMR spectrum studies were performed at the Microanalytical Center at Cairo University.

2.2. Reagents and Chemicals

All reagents that were utilized were prepared from analytical mark chemicals. Thermo Fisher Scientific-Acros Organics Inc. (Morris Plains, NJ, USA) supplied poly vinyl alcohol (PVA), di-isooctylamine, ascorbic acid and gelatin. POCH S.A. Poland provided analytical excellence H3PO4, HNO3, H2SO4 and NaOH. Zirconium (IV) oxychloride octahydrate and Xylenol Orange were obtained from Merch, Germany. Methanol, ethanol, ethyl acetate, chloroform and DMSO were obtained from Fluka Company, England. Prior to use, solvents were freshly distilled and purified in accordance with accepted laboratory procedures. Glassware that has been flame-dried was used for all reactions. Thin-paper chromatography (PC) was used to keep track of the reaction’s development (ethanol + ethyl Acetate, 50:50 v/v) as the eluent was employed. A UV lamp made spots on the PC plates visible (250 nm).

2.3. Experimental Procedures

Dissolving 3.52 g of ZrOCl2.8H2O in 1000 mL of distilled water acidified with 5 mL of conc. HNO3 resulted in a stock solution of 1000 mg/L (0.01 mol/L) Zr(IV). In addition, numerous standard solutions (1000 mg/L) of probable co-exist ions through Zr(IV) extraction by the PPVP complexion ligand may be organized by dissolving suitable weights of their salts in 1000 mL of highly pure distilled water.

2.4. The Extraction Activities

To optimize Zr(IV) extraction from an artificial prepared solution by PPVP, the following controlling factors were improved: pH, shaking duration, starting Zr(IV) conc., PVP dose., temp. and several co-ions. In working experiments, 25 mL of working synthetic Zr(IV) solution with 1000 mg/L (0.01 mol/L) was mechanically shaken with 25 mL of different PVPP for a fixed time at several temperatures by stirring at 150 rpm with a dose of 0.1 g PPVP. The maximum adsorption or uptake capacity (qe) in mg/g and the distribution coefficient (Kd) were utilized as the most significant indexes for evaluating the effectiveness of the Zr(IV) extraction procedure and were mathematically calculated via Equation (1) [87]:
q e = ( C o C e ) × [ v m ]
where:
  • Co is the initial concentration (mg/L) of Zr(IV);
  • Ce is the equilibrium concentration (mg/L) of Zr(IV);
  • v is the working volume of the solution with Zr(IV) in liters;
  • m is the dry weight of the prepared composite (g).
The coefficient of distribution (Kd) is mathematically calculated via the following Equation (2):
K d = C o C e C o × [ v m ]

3. Results and Discussion

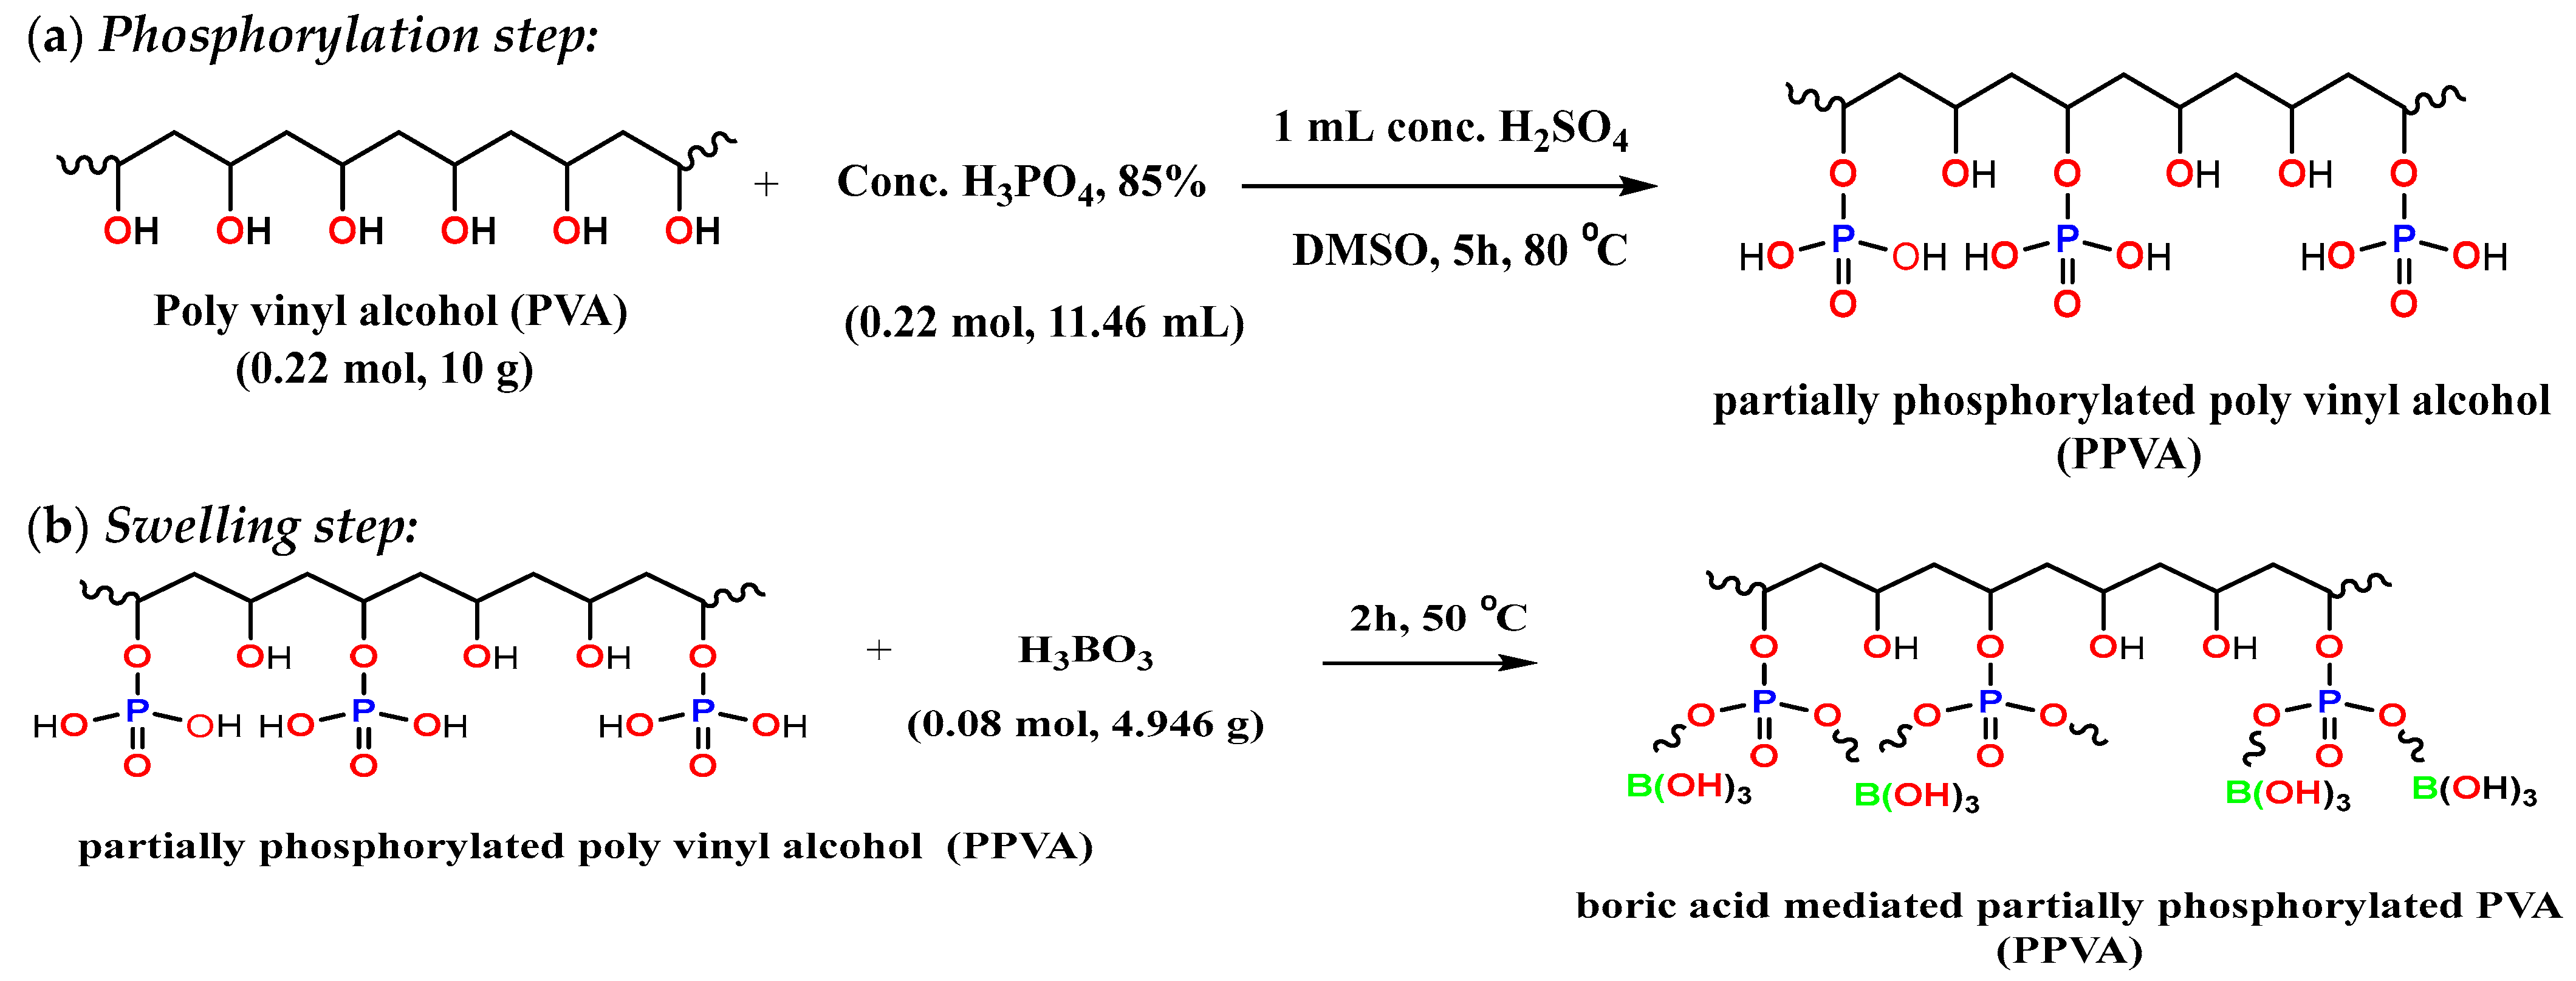
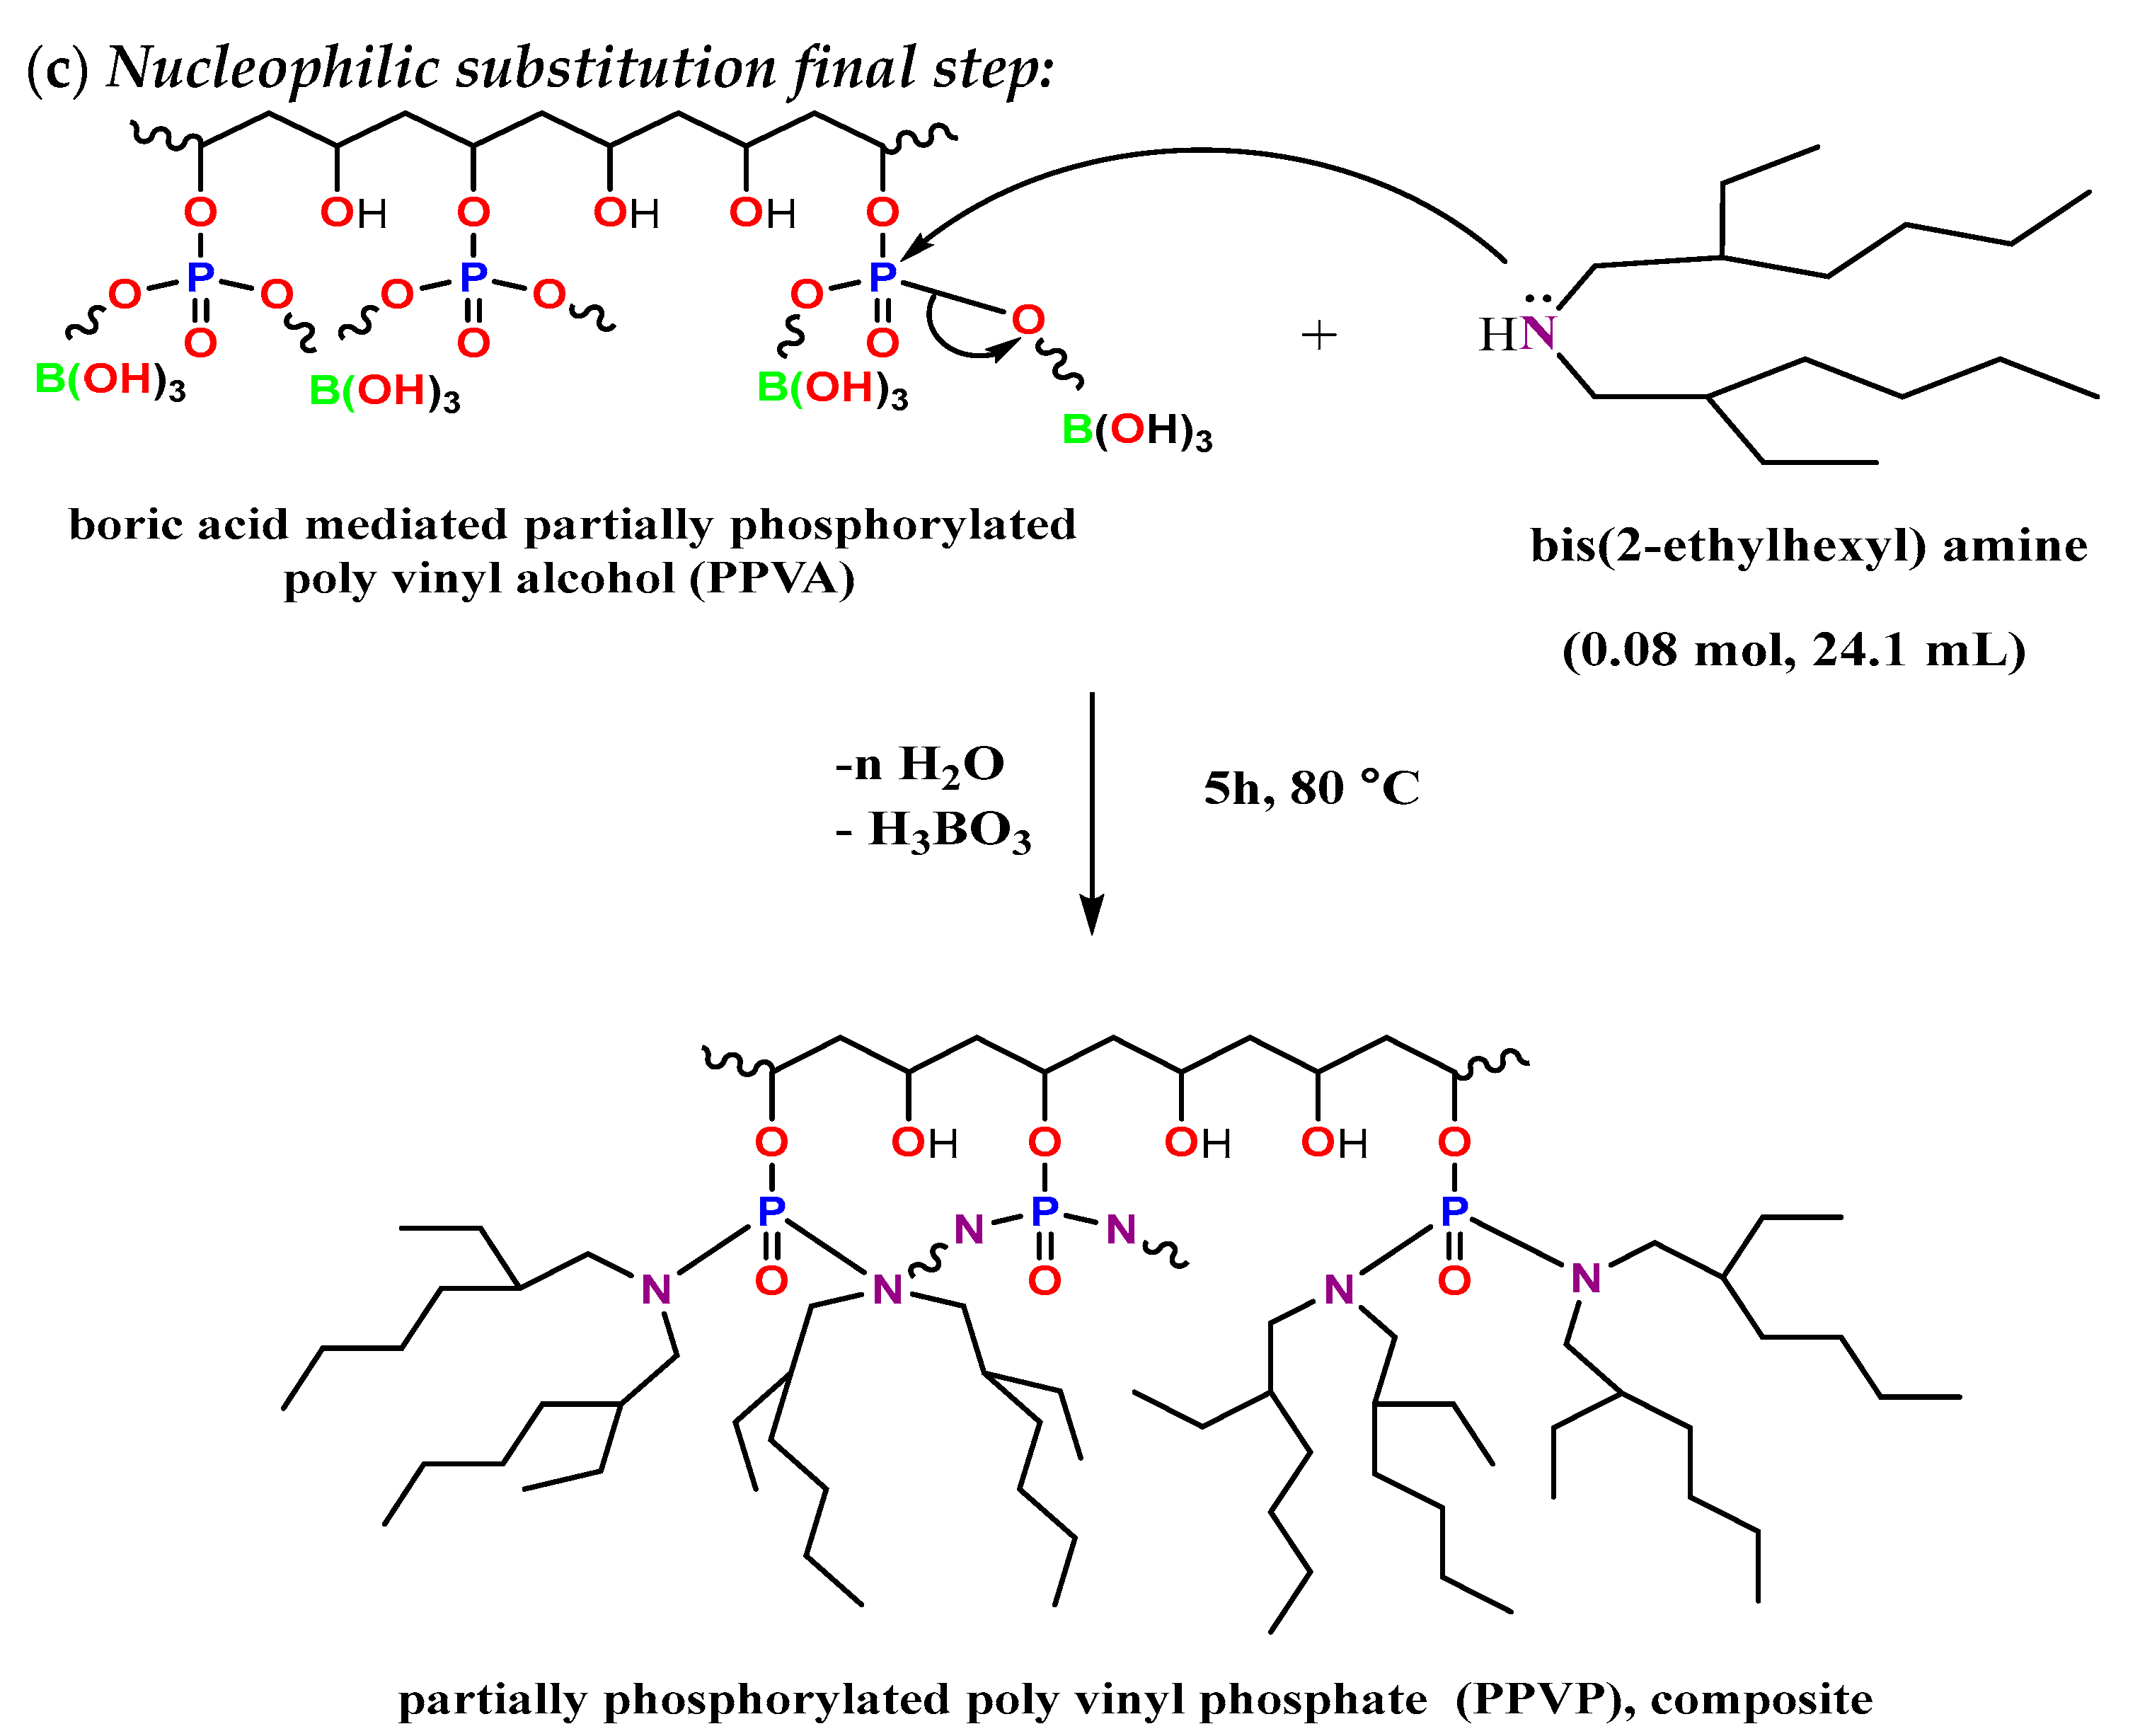
3.1. Preparation of Partially Phosphorylated Polyvinyl Phosphate Derivative (PPVP) Composite

Partially phosphorylated polyvinyl phosphate (PPVP) was synthesized via three main steps. The first phosphorylation step begins by refluxing a mixture of 0.22 mole (≈10 g) from PVA, 0.22 mole of 85% H3PO4 (11.46 mL) and 1 mL conc. H2SO4 in suitable 50 mL of DMSO solvent. The mixture was refluxed at 80 °C for 5 h. The chief purpose of the later step is to introduce phosphoric acid groups into the skeleton of PVA to form the phosphate ester of PVA (partially phosphorylated poly vinyl alcohol, PPVA). After the condensation reaction is turned off, the mixture is allowed to cool at ambient temperature, and then the mixture is slowly poured into absolute ethanol, a white floury pulp precipitate is obtained, which is washed three times with absolute ethanol, and then the precipitate is compiled by vacuum air Buchner. The next swelling step initiates by adding the resulting phosphate ester of PVA to 0.08 mole (4.946 g) of H3BO3 and boric acid [88], which acts as a mediated Lewis acid, in a condenser for 2 h at 50 °C. Lastly, the latter mixture was added to 0.08 mole (24.1 mL) of bis-(2-ethylhexyl) amine, and the mixture was refluxed for 5 h at 80 °C.
The development of the working reaction was observed by using paper chromatography (PC). A solvent is ethanol+ ethyl acetate, and a UV lamp has visualized the spots upon PC sheets. The resulting PPVP, with a sticky, oily liquid brown color with a bad odor, is obtained at a density of 1.33 g/cm3. At the final stage of the reaction, the product was obtained by cooling and washing with absolute ethanol three times to remove any remaining DMSO and boric acid, and the later oily viscous liquid was turned into a nearly brown elastic material, which is collected by vacuum air Buchner. After 12 h of heating at 120 degrees Celsius, the resulting elastic material was transformed into PPVP composite. The stages of the partially phosphorylated poly vinyl phosphate (PPVP) composite and the proposed mechanism of the working reaction are shown in Scheme 1. A very important clarification should be mentioned concerning the role of the mediated Lewis acid (H3BO3) in the fabrication of the PPVP composite. A high charge density describes Lewis acid with vacant orbitals. The latter can attract electrons from the oxygen of the phosphoric acid group. This operation facilitates the breaking of the –P-OH bond. After that, the nucleophilic attack of diiso-octyl amine upon the phosphoric acid group can perform easily, as the phosphorous atom acts as an electrophile with water release.

3.2. Characterization of Partially Phosphorylated Polyvinyl Phosphate (PPVP) Composite

The working product yield was found to be ≈ 18 g (≈ 68%); m.p ≈ 300 °C; FT-IR (KBr) v/cm−1 = 3450 (-OH), 2853 (-CH aliphatic), 701.38 ((-CH2)n aliphatic), 1170 (-P=O), 819.83 (-P-N), 980 (-P-OH), 1080 (-C-N),1090 (-C-O) and 663.02, 772.02 (Zr-O). 1H-NMR (400 MHz, DMSO-d6, 25 °C, TMS) δ, ppm: 0.86 (m, 3H, -CH3, J = 7.1 Hz), 1.26 (m, 2H, (-CH2)n, J = 9.07 Hz), 1.53 (m, 1H, -CH, J = 7.3 Hz), 1.69 (m, 2H, -CH2, J = 6.55 Hz), 3.84 (m, 1H, -CH, J = 6.43 Hz), 4.02 (m, 1H, -OH, J = 5.12 Hz). 13C-NMR (125 MHz, DMSO-d6, 25 °C, TMS) δ, ppm: 66.1 (s, -CH), 37.6 (s, -CH2), 14 (s, -CH3), 29.4 (s, (-CH2)n), 47.7 (s, -CH2), 38.2 (s, -CH). GC-MS (EI, 30 eV), m/z (% rel): [m/z]+ of 570, 545, 528, 88, 56, 444, 43, 29, 28, 15. Anal. Calc. for [C34H71N2O2P]n building block (570 g/mol, n = 1): C, 71.58; H, 12.45; N, 4.91; O, 5.61; P, 5.43. Found: C, 71.63; H, 12.4; N, 4.912; O, 5.59; P, 5.5.

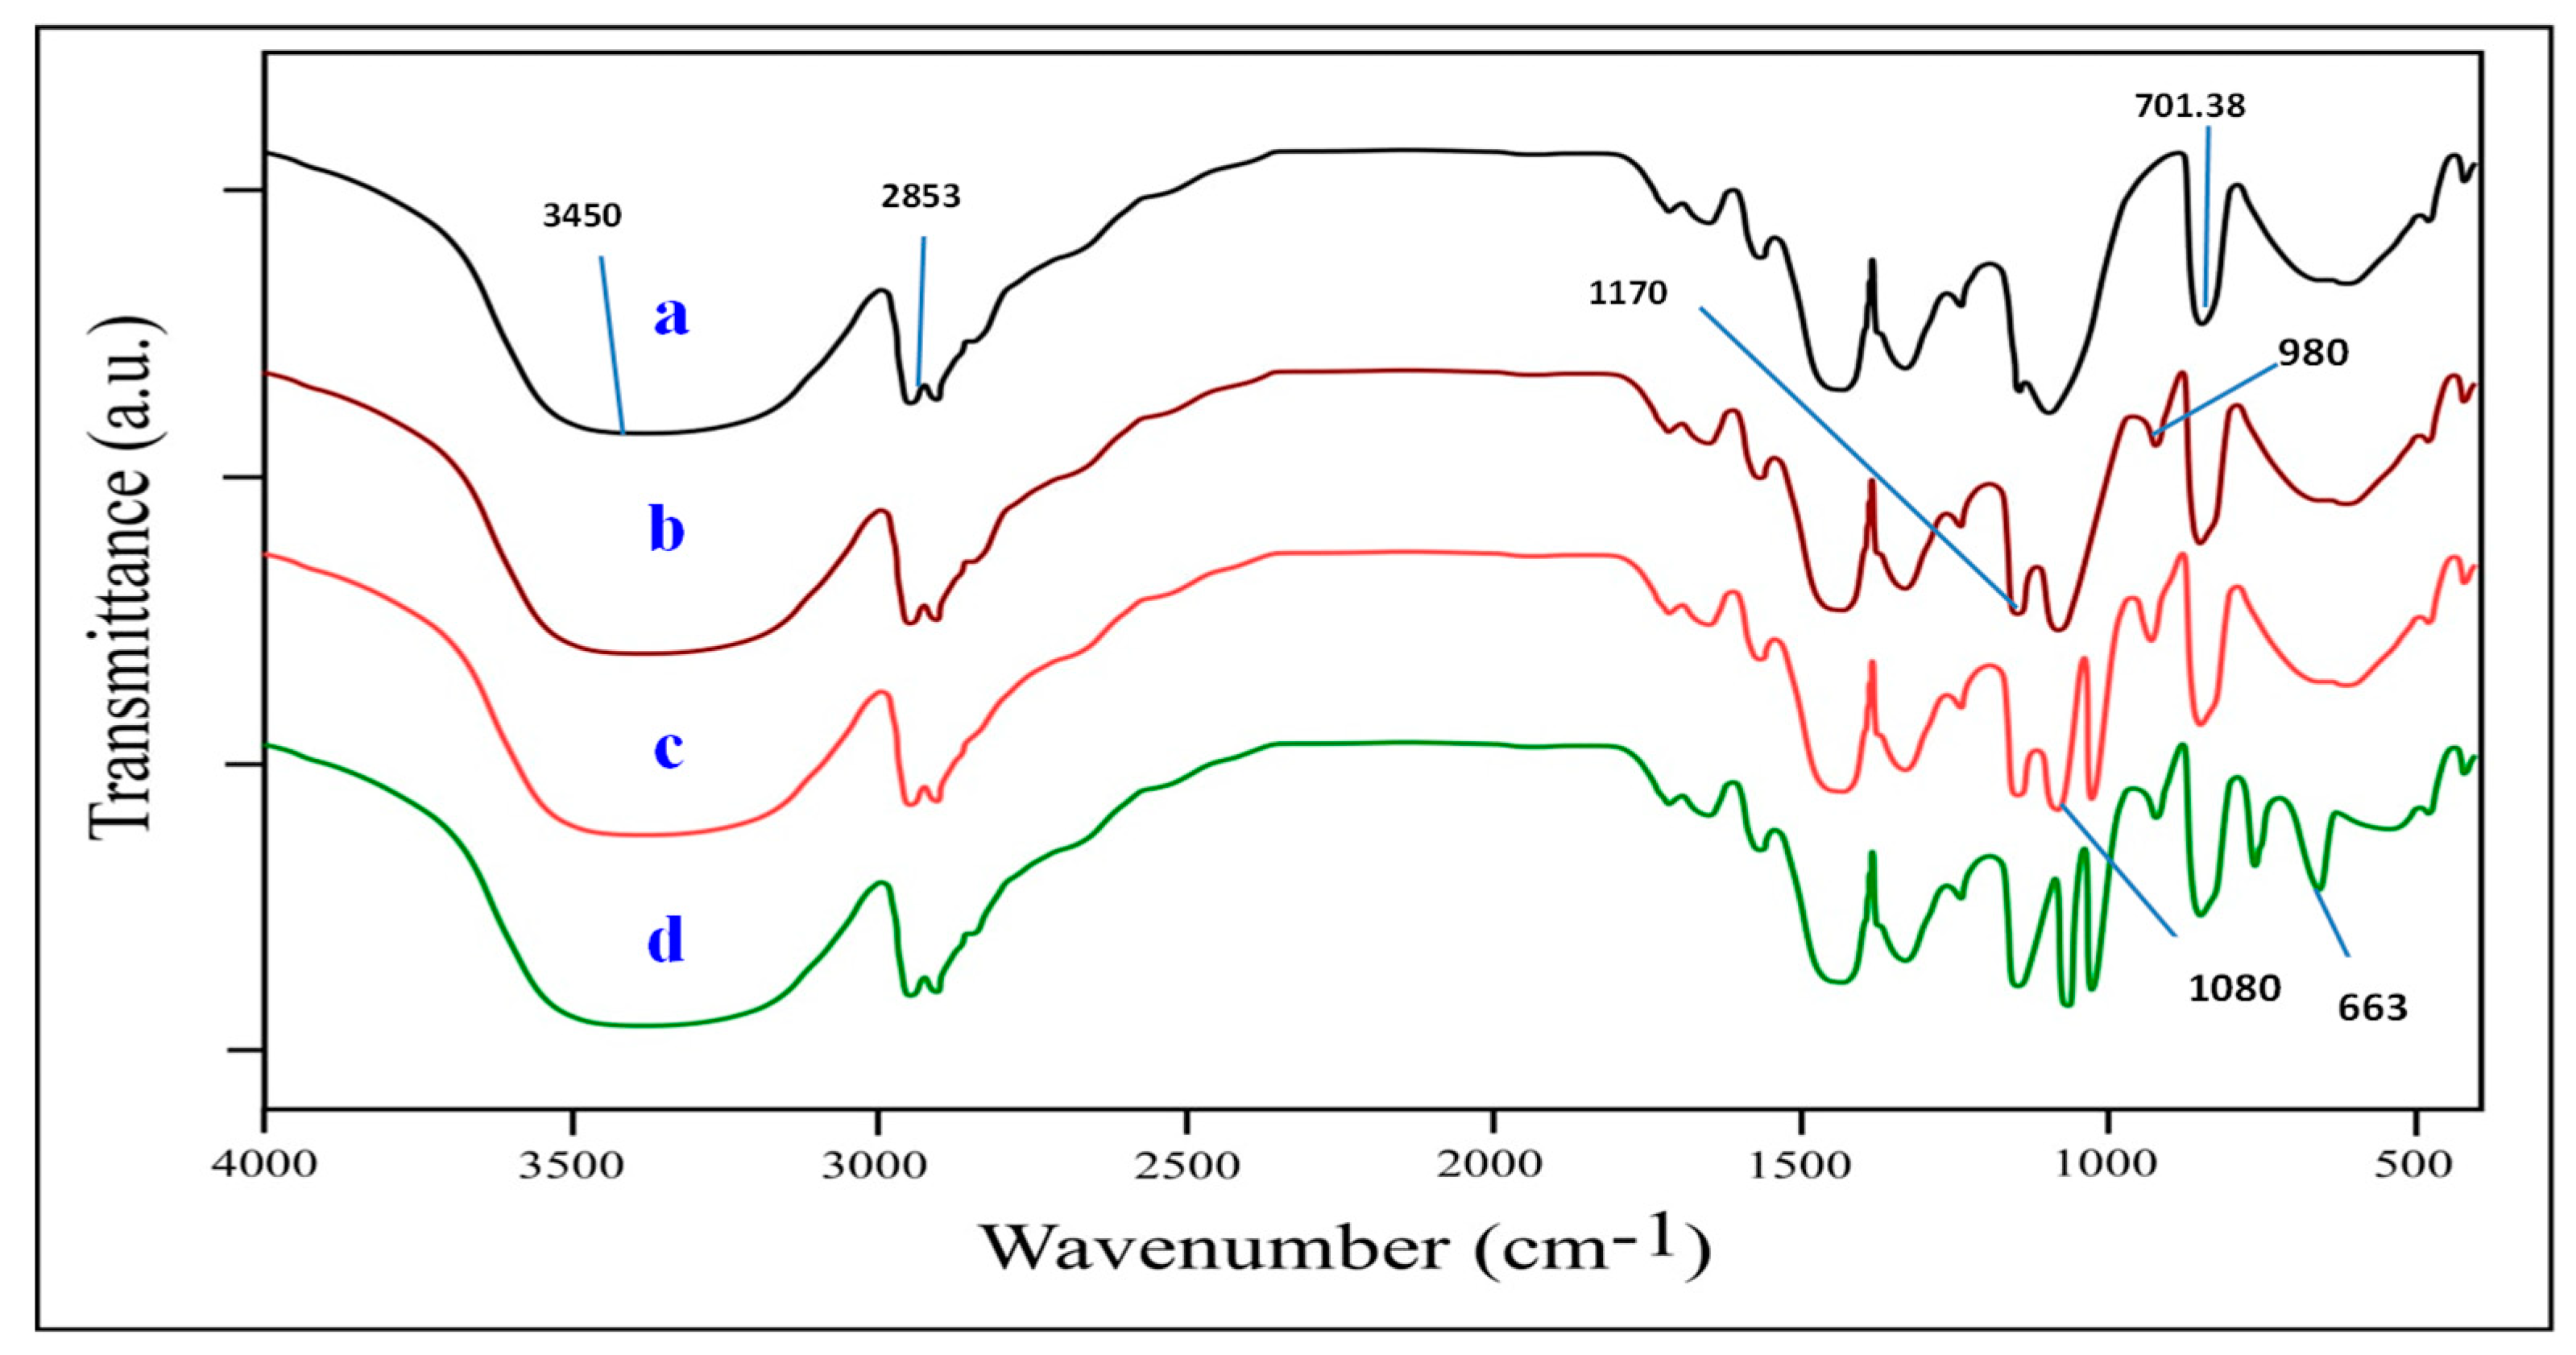
3.2.1. FT-IR Analysis

Several function groups in the synthesized PPVP composite were advanced using key observations from Fourier transformation infrared spectroscopy (FT-IR). The main assignments in the synthesized PPVP were measured as 2853 cm−1 (-CH aliphatic), 701.38 cm−1 ((CH2)n aliphatic), 1170 cm−1 (-P=O), 819.83 cm−1 (-P-N), 980 cm−1 (-P-OH), 1080 cm−1 (-C-N), 1090 cm−1 (-C-O) and 3450 cm−1 (-OH). After the condensation of PVA with conc. phosphoric acid to form PPVA, new assignments appear at 1170 cm−1 (-P=O) and 980 cm−1 (-P-OH). Moreover, the condensation between PPVA and bis-(2-ethylhexyl) amine constructs other new assignments such as 819.83 cm−1 (-P-N) and 1080 cm−1 (-C-N). It was established that only -P=O assignment at 1170 cm−1 was shifted to a lower wave number (1160 cm−1) after condensing with the amino group of bis-(2-ethylhexyl) amine. It is assumed that the principle vibrational assignments were observed at 3450 cm−1 of the -OH group of PPVP, which should disappear after condensation, but it just did not happen, as the partial phosphorylation of PVA leaves a fair number of hydroxyl groups without phosphorylation. The other assignments of PPVP that remained unchanged after condensation were 701.38 cm−1 ((CH2)n aliphatic), 2853 cm−1 (-CH aliphatic), 1090 cm−1 (-C-O) and 3450 cm−1 (-OH). The FT-IR spectra of the PPVP with zirconium ions are shown in Figure 1, which reveal the shift to a lower frequency of two characteristic assignments of –P=O from 1160 to 1140 cm−1, with a wave number difference of ≈ 20 cm−1, and –P-OH from 980 to 950 cm−1, with a wave number difference of ≈ 30 cm−1. The advent of a new band in the chelate at 772.02 and 663.02 cm−1 may be considered for the formation of coordinated Zr–O bonds [89].

3.2.2. XPS Interpretation

The chemical compositions of unmodified PVA, PPVA, PPVP and PPVP-Zr were examined by XPS, as shown in Figure 2 and Table 1. The four modified samples contained C1S and O1S, which resulted in peaks at 300 eV and 543 eV, respectively [90]. Compared with PVA, the PPVA showed an increase in both oxygen and phosphorous elements to 47.45% and 23%. This rise may be due to the successful partial phosphorylation of PVA to PPVA. Furthermore, compared with PVA, the PPVP showed an increase in both carbon and nitrogen elements to 71.38% and 5%. In the case of the PPVA, the peak at 191 eV was assigned to B1S, which is related to boric acid used as a Lewis acid [91], and a peak at 131 eV, which corresponds to P2p, clearly appeared [92]. After a successful condensation of PPVA with bis-(2-ethylhexyl) amine, nitrogen was introduced to PPVA to form PPVP composite. The peak of nitrogen, N1S, appears at 405 eV [93]. It was found that the content of nitrogen was increased in PPVP by a value of ≈5%. After a successful chelation of Zr by PPVP composite, the peak assignment of Zirconium (Zr3d) appeared at 195 eV [94], with an increase in Zr content by 10.77%. Consequently, the chemical modification of PVA with phosphoric acid and bis-(2-ethylhexyl) amine was successful in forming the PPVP composite.

3.2.3. BET (Brunauer–Emmett–Teller) Interpretation

The BET (Brunauer–Emmett–Teller) theory was used to demonstrate the sorption–desorption of nitrogen dioxide on PVA, PPVA and PPVP. From Table 2, it can be seen that the volume of the pore, surface area and pore size of PPA were 0.03 cc⋅g−1, 9.25 m2⋅g−1 and 9.1 nm, respectively. When phosphorylation was performed with PVA to form PPVA, the pore volume, surface area and pore size were enhanced to 0.05 cc⋅g−1, 12.03 m2⋅g−1 and 11.33 nm. Moreover, the PPVA with bis-(2-ethylhexyl) amine’s condensation reaction resulted in the PPVP composite’s formation, with enhancements in pore volume, surface area and pore size of 0.06 cc⋅g−1, 17.48 m2⋅g−1 and 16.01 nm. These results confirmed the successful condensation reactions of PVA to PPVA and PPVA to PPVP. The pore volume, surface area and pore size of PVA, PPVA and PPVP are illustrated in Table 2.

3.2.4. SEM-EDX Interpretation

The surface morphologies of PVA, PPVA, PPVP and PPVP-Zr were monitored by SEM analysis at 2000× magnification, with 50μm of full scale. It was found that PVA was comprised of a sleek and flathead microstructure filled with many switchbacks. After the conversion of PVA to PPVA and then PPVP, it was found that the surface morphology was turned to be more uneven. When zirconium ions were introduced to PPVP, the surface of PPVP-Zr was converted to be of an irregular shape, inaccessible and rough due to Zr4+ ions extraction upon the surface. The EDAX analysis of PVA, PPVA, PPVP and PPVP-Zr is shown in Figure S1a–d. The chemical verification of PVA, PPVA, PPVP and PPVP-Zr by EDX analysis yielded C, O for PVA, C, O, P for PPVA, C, O, P, N for PPVP and C, O, P, N, Zr peaks. These observations confirmed the successful synthesis of PPVP from PVA and its capability to adsorb Zr4+ ions on its surface.

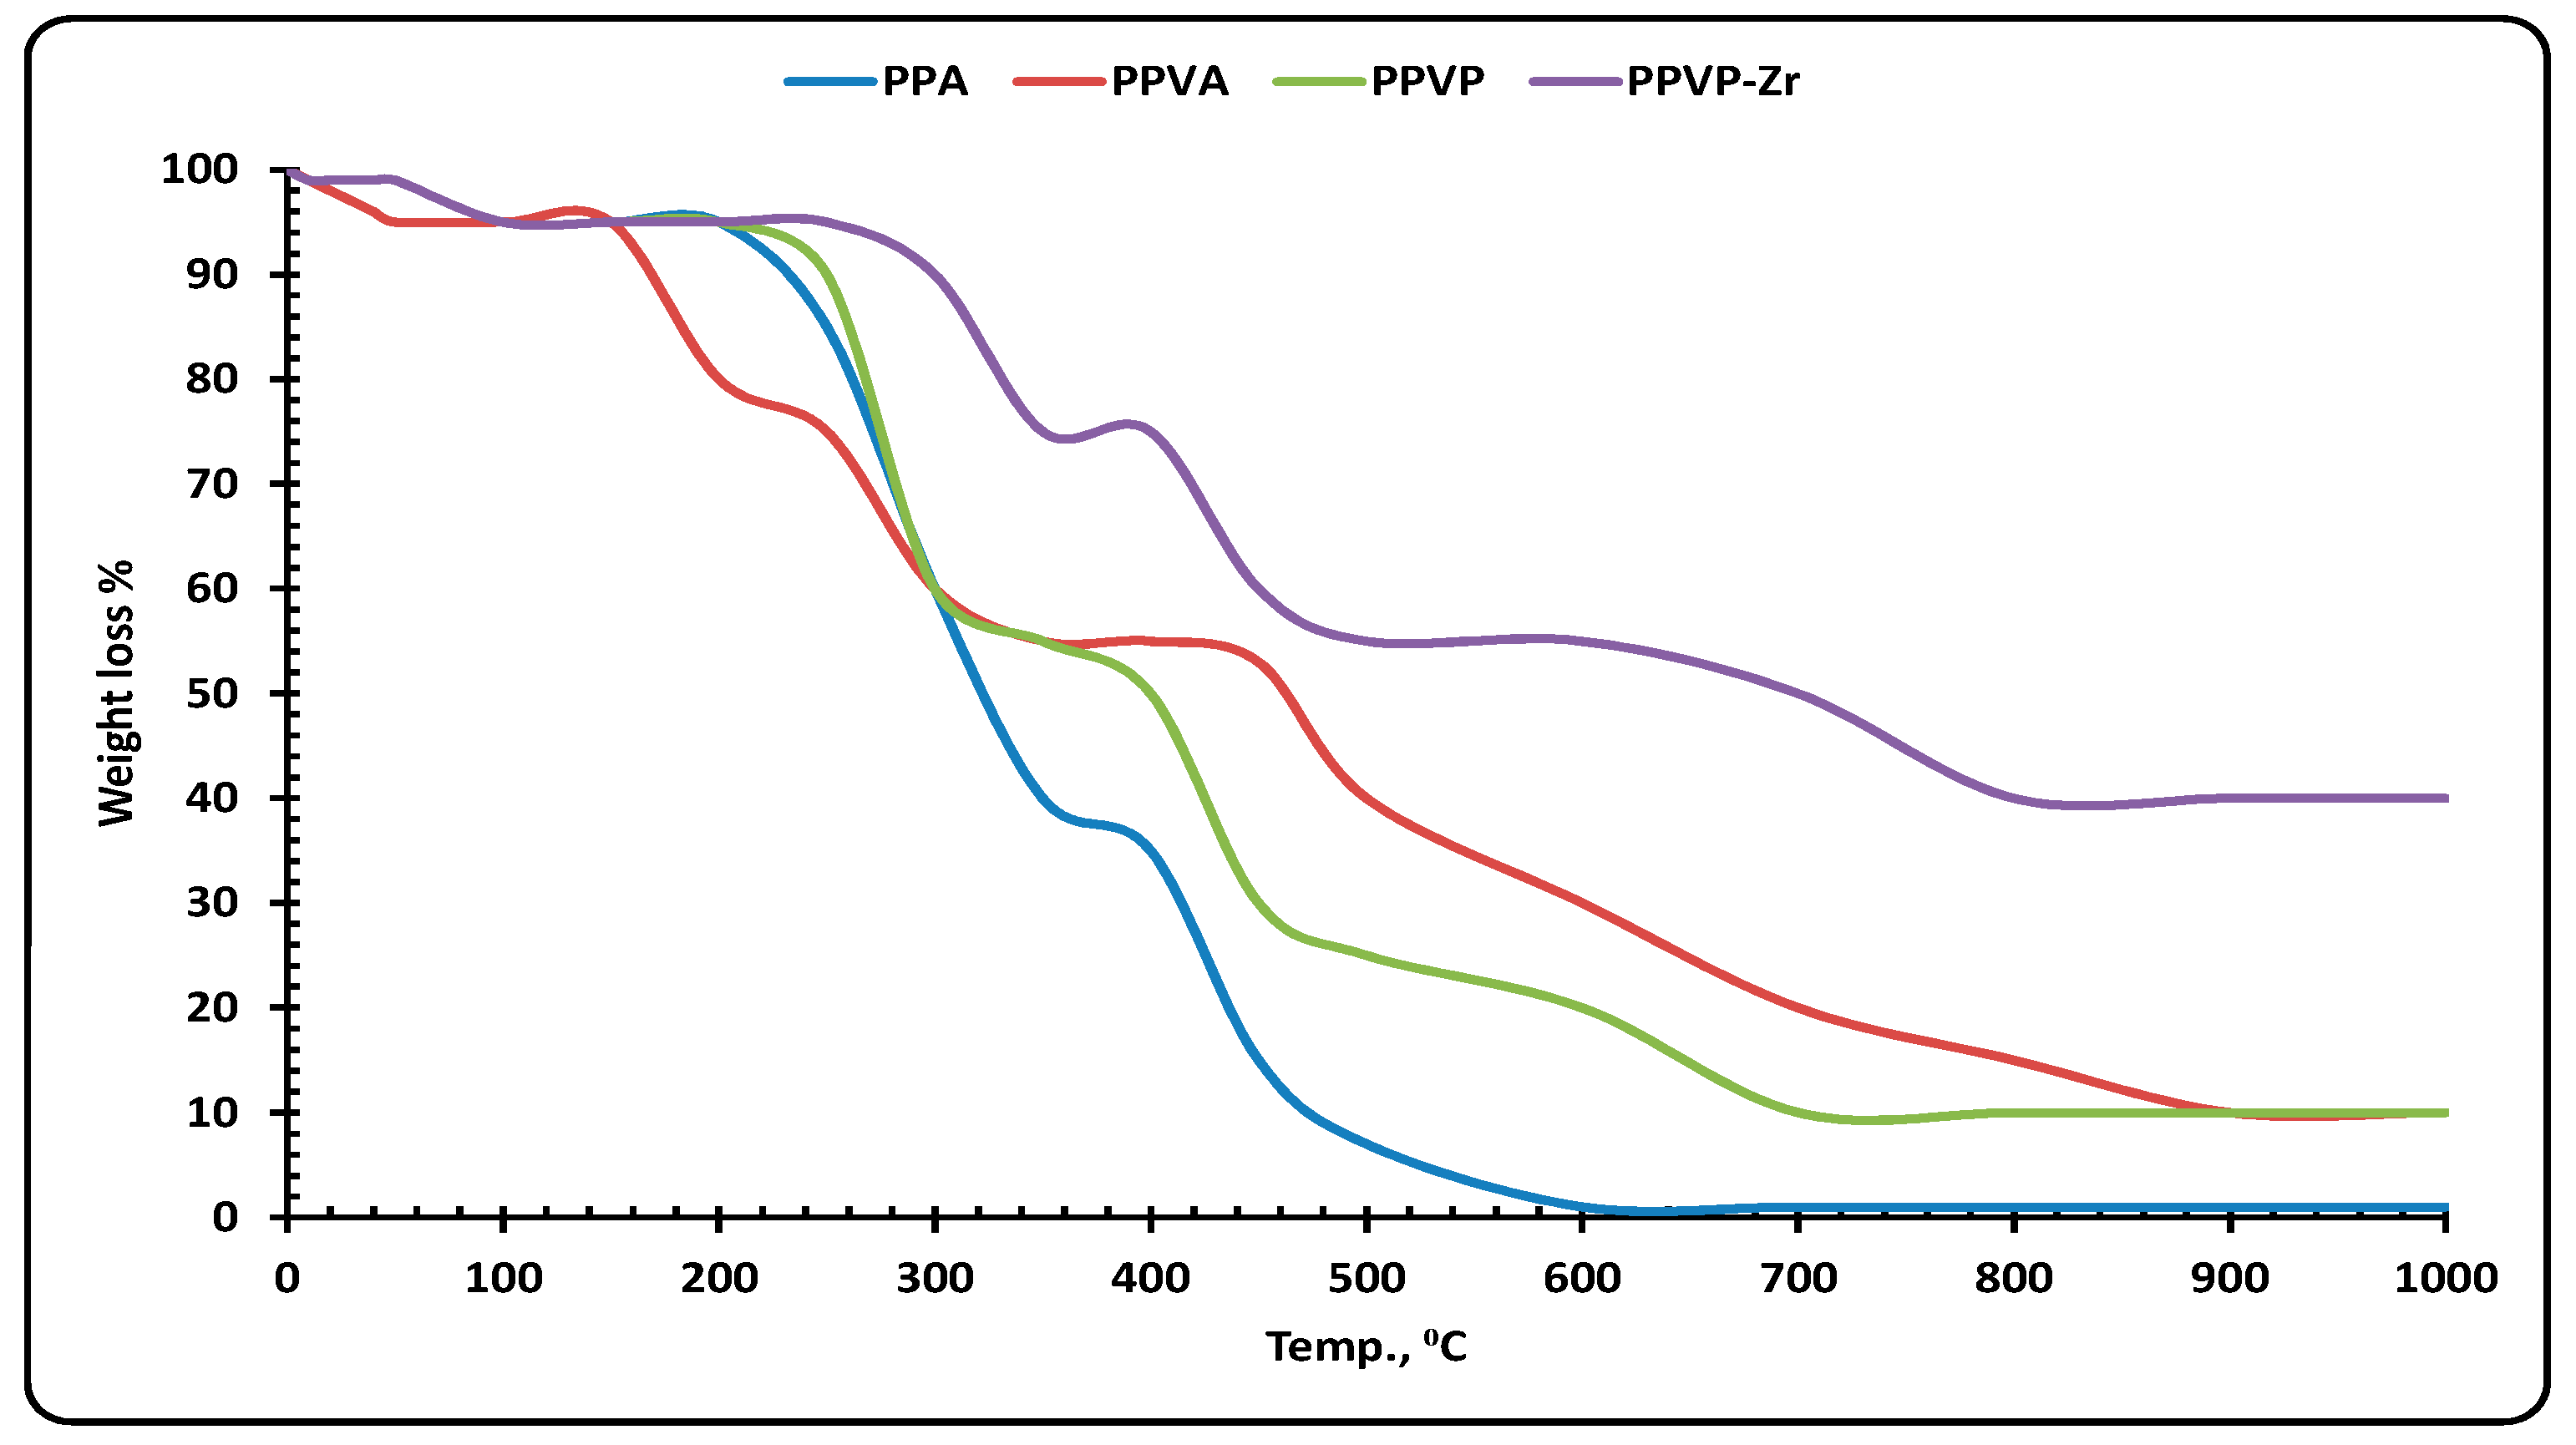
3.2.5. TGA Interpretation

TGA analysis is applied to examine the effect of the chemical modification upon the thermal stability of PVA. The data from TGA are illustrated in Figure 3. The TGA stages, deflection temperatures, weight loss % and final weight residue are shown in Table S1.
The TGA data show that, at 105 °C, PVA, PPVA, PPVP and PPVP-Zr samples all lost weight, up to about 5%. The evaporation of the adsorbed water causes this loss. At 105 °C, PVA separated itself visibly from the other samples. Unaltered PVA showed three inflexions, one at 105–250 °C (10% weight loss), one at 250–450 °C (70% weight loss) and one at 450–600 °C (15% weight loss), matching these three decomposition phases. The first temp. was associated with the side chain polyene and cyclization reactions due to the water splitting off the PVA polymer chain, whereas the next second temperature could be associated with the decomposition and carbonization process; furthermore, the third stage can be related to the thermo-oxidation process [64]. Like in PVA, four inflexions were observed for PPVA from 105 to 200 °C (weight loss 15%), 200 to 450 °C (weight loss 27%) and 450 to 900 °C (weight loss 43%), along with the appearance of a new final weight residue stage of a 10% loss of weight at 900–1000 °C, which may due to the formation of the residual phosphorous oxide. It is clear that the phosphorylation of PVA may cause some thermal instability for the PPVA.
PPVP showed the presence of four inflexions at 105–300 °C (weight loss 35%), 300–450 °C (weight loss 30%) and 450–700 °C (weight loss 20%), along with the appearance of a final weight residue stage of a 10% weight loss between 700 and 1000 °C. For the initial degradation temperature to show, the other deflections must change, and this change must be related to the successful incorporation of bis-(2-ethylhexyl) amine onto the PPVA matrix, which somewhat causes thermal stability.
Moreover, PPVP-Zr also showed the presence of four inflexions at 105–350 °C (weight loss 20%), 350–450 °C (weight loss 15%) and 450–750 °C (weight loss 20%), along with the appearance of a final high-weight residue stage of a 40% weight loss, which may be due to the formation of both residual phosphorous and Zirconium oxide. The form of the first temp. of the mentioned degradation and the shift to a higher degradation temperature, 350 °C, should be related to the successful adsorption of zirconium ions onto the PPVA matrix, which increases the thermal stability [71,76].
The results demonstrated that the thermal stability of PVA was enhanced by the addition of bis-(2-ethylhexyl) amine groups and zirconium ions, with the greatest impact seen in the case of PPVA, which is generally regarded as less thermally stable than the other modified PVA.

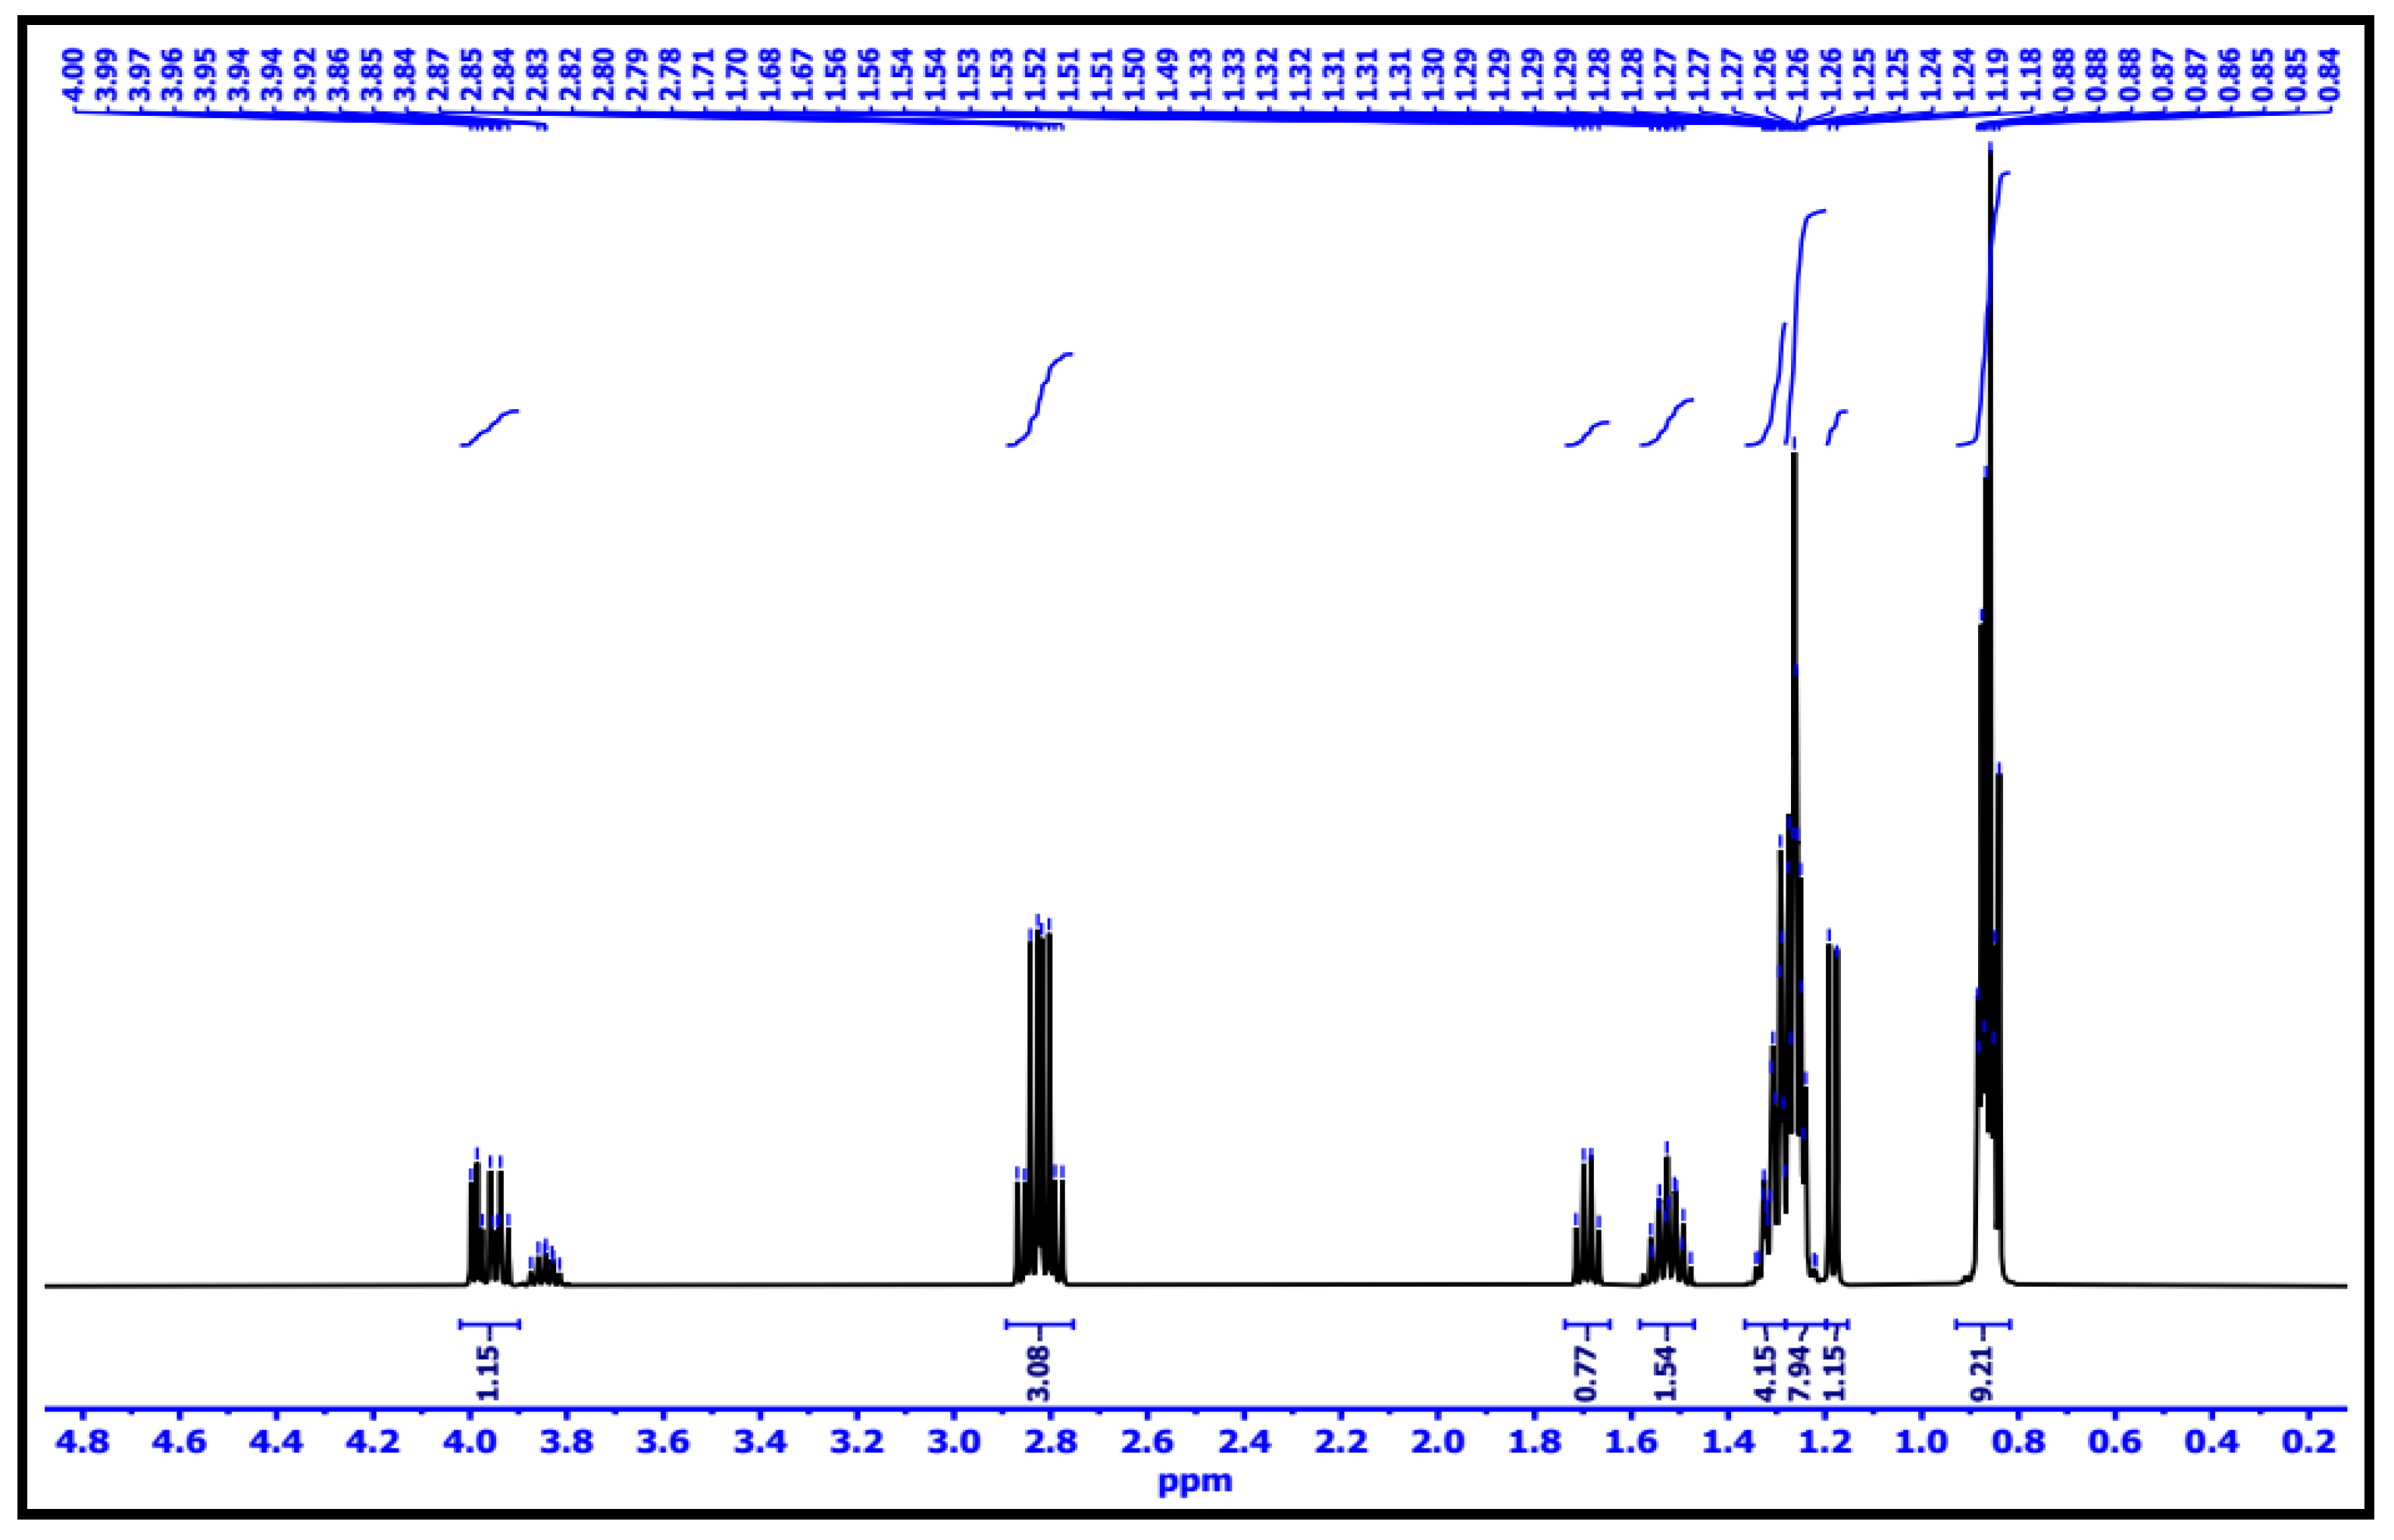
3.2.6. 1H-NMR Interpretation

An efficient and crucial tool for predicting the structure of a synthesized ligand is 1H-NMR analysis at 400 MHZ, with DMSO-d6 as a diluent and tetramethyl silane as a reference, performed at 25 °C. The key δ (ppm) mark appears at 0.86, 1.26, 2.84 and 1.53 ppm, which are related to the branched -CH3, -CH2, -N-CH2 and -CH protons of bis-(2-ethylhexyl) amine moiety, respectively. It was found that the methylene protons directly attached to nitrogen atoms (electronegative atom) are more de-shielded than the normal methylene group, resulting in an increase in the value of its chemical shift. The other main δ (ppm) assignments for the Skelton of PVA appear at 1.69, 3.84 and 4.02 ppm, which are related to branched -CH2, -CH and -OH protons, respectively. The characterization of the PPVP composite using 1H-NMR is shown in Figure 4.

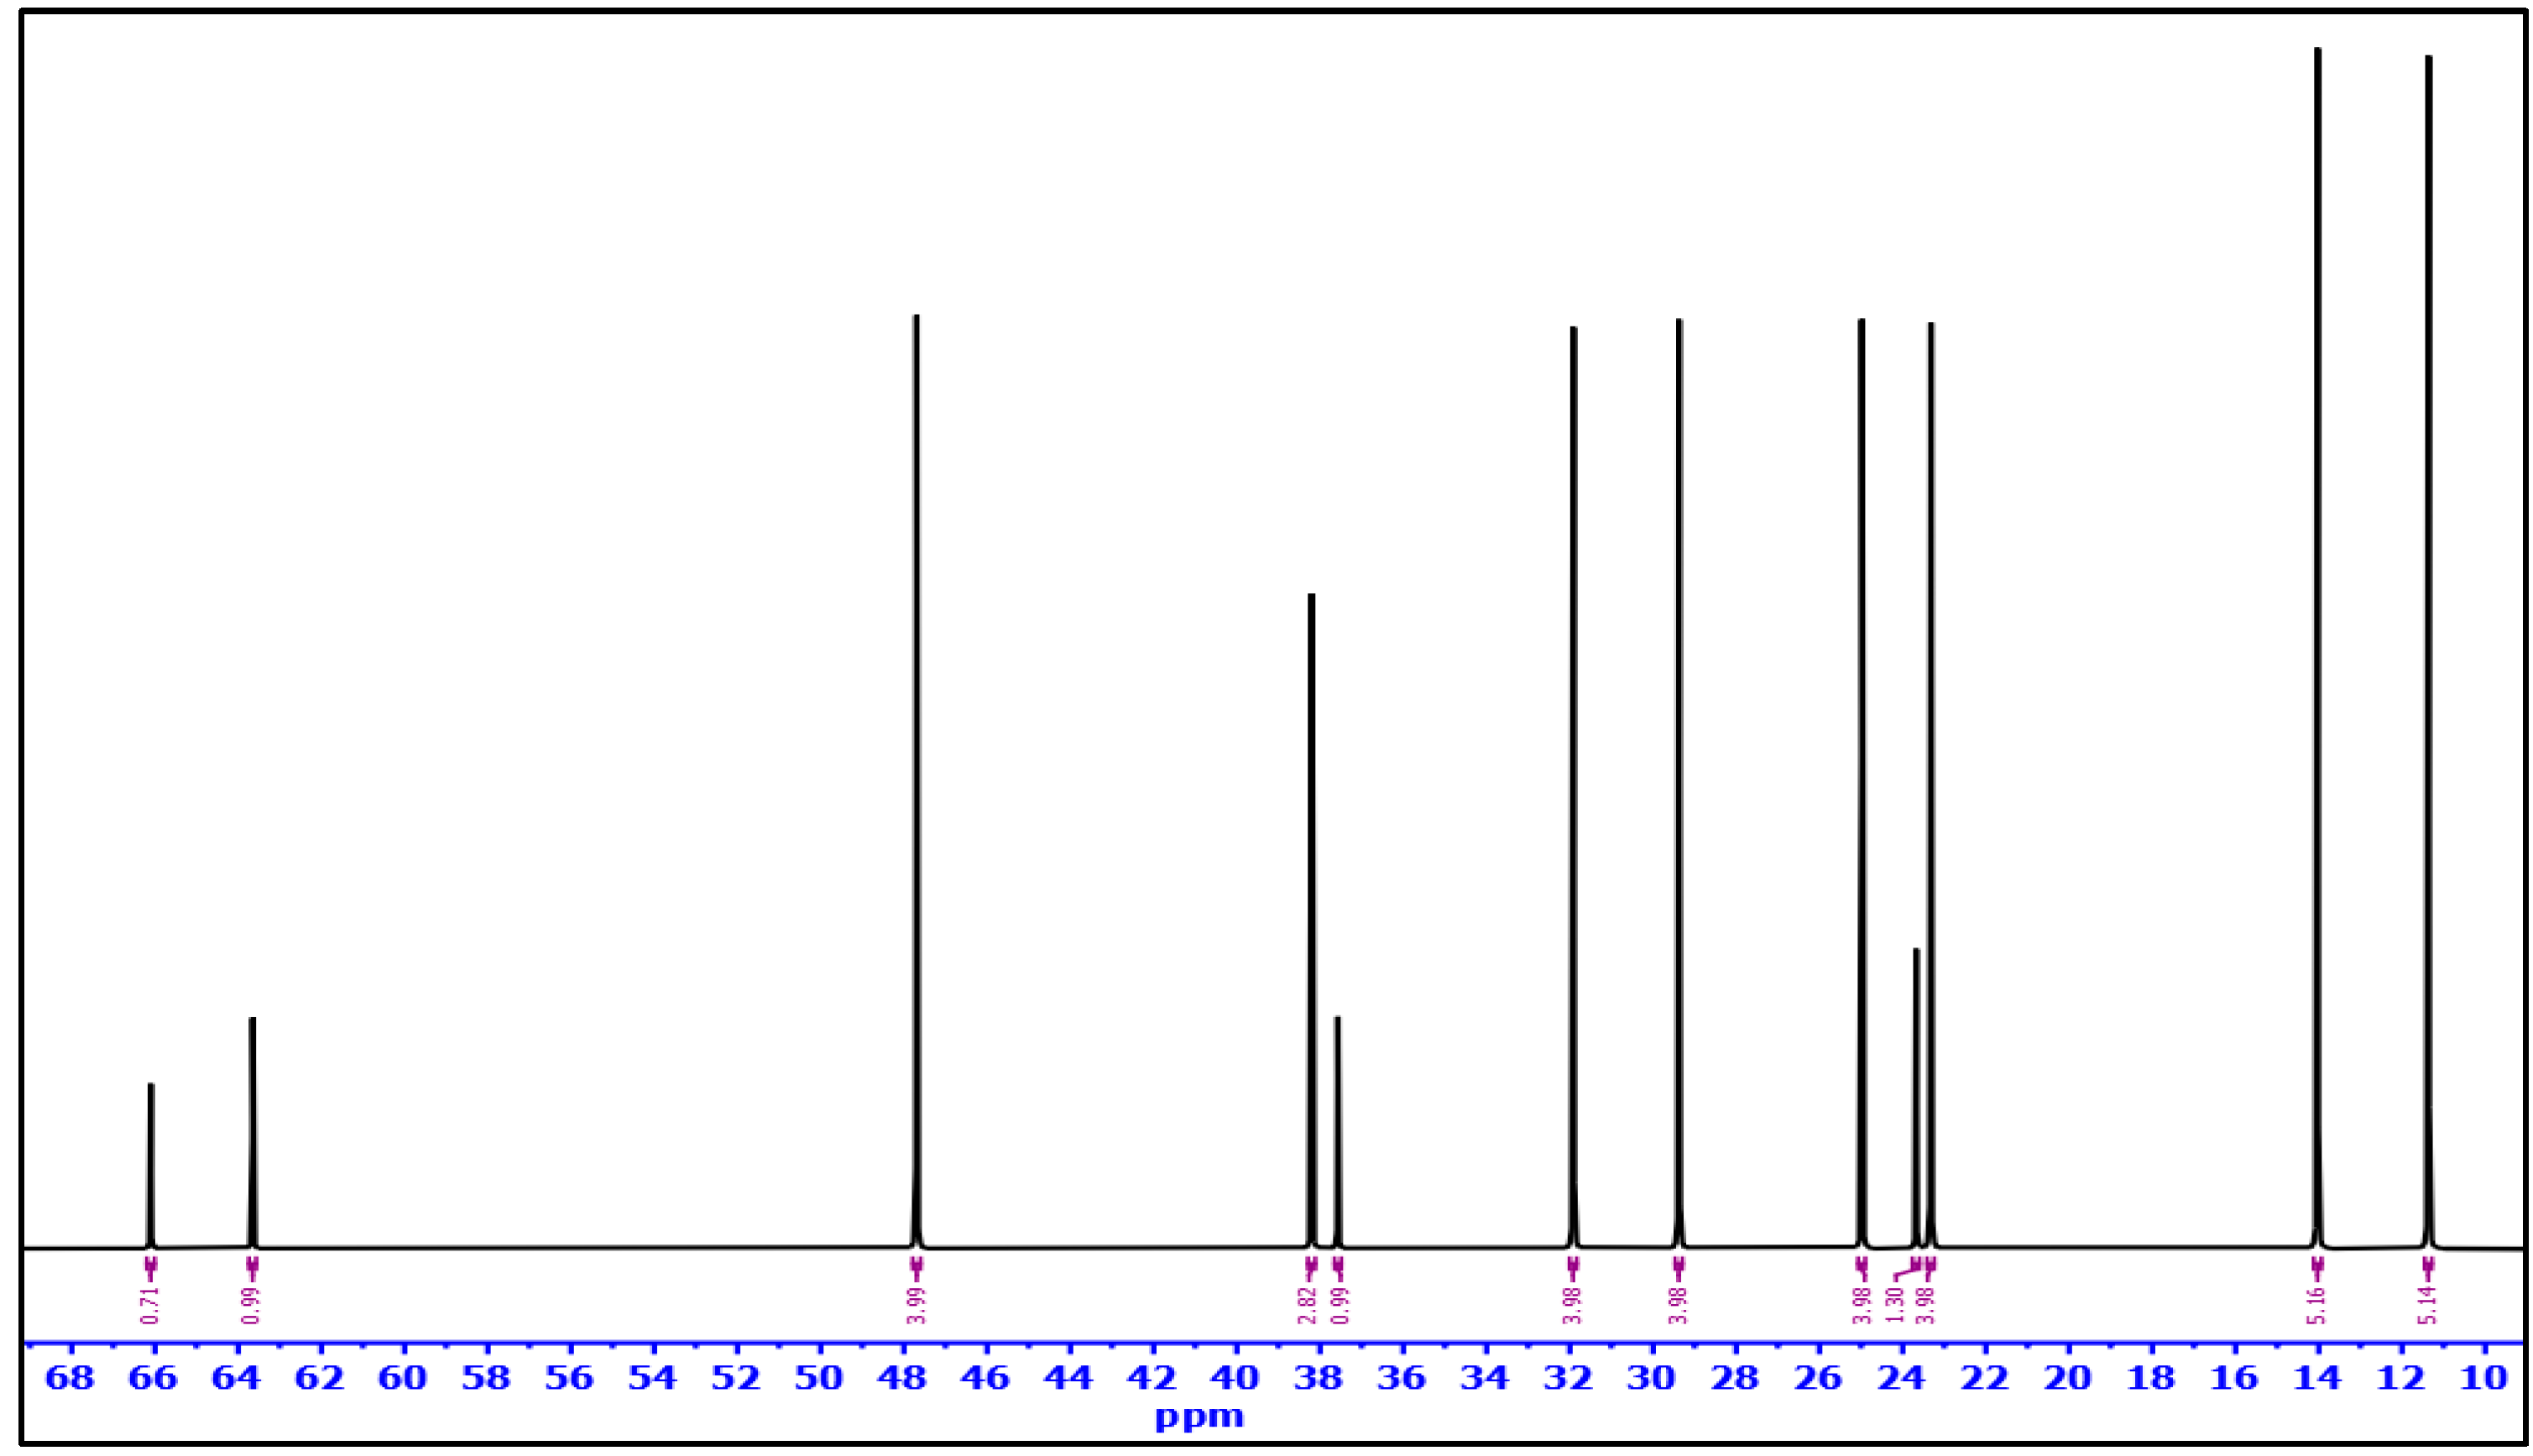
3.2.7. 13C-NMR Interpretation

The number of carbon atoms in the synthesized PPVP can be accurately determined by 13C-NMR analysis at 125 MHZ, with DMSO-d6 as the diluent. The skeleton of PVA has the main δ (ppm) that appears at 66.1 ppm as a singlet related to -CH group. The high value of the chemical shift may be due to the attachment of the –OH group. It was found that the methylene group (-CH2) appears at 37.6 ppm. The main δ (ppm) assignments appear at 14, 29.4, 47.7 and 38.2 ppm, which are related to branched -CH3, (-CH2)n, -N-CH2 and -CH carbons of bis-(2-ethylhexyl) amine moiety. It was found that the methylene carbons which are directly attached to nitrogen atoms (electronegative atom) are more de-shielded than the normal methylene carbon, resulting in an increase in the significance of its chemical shift. The specification of the PPVP solvating extractant using 13C-NMR is illustrated in Figure 5.

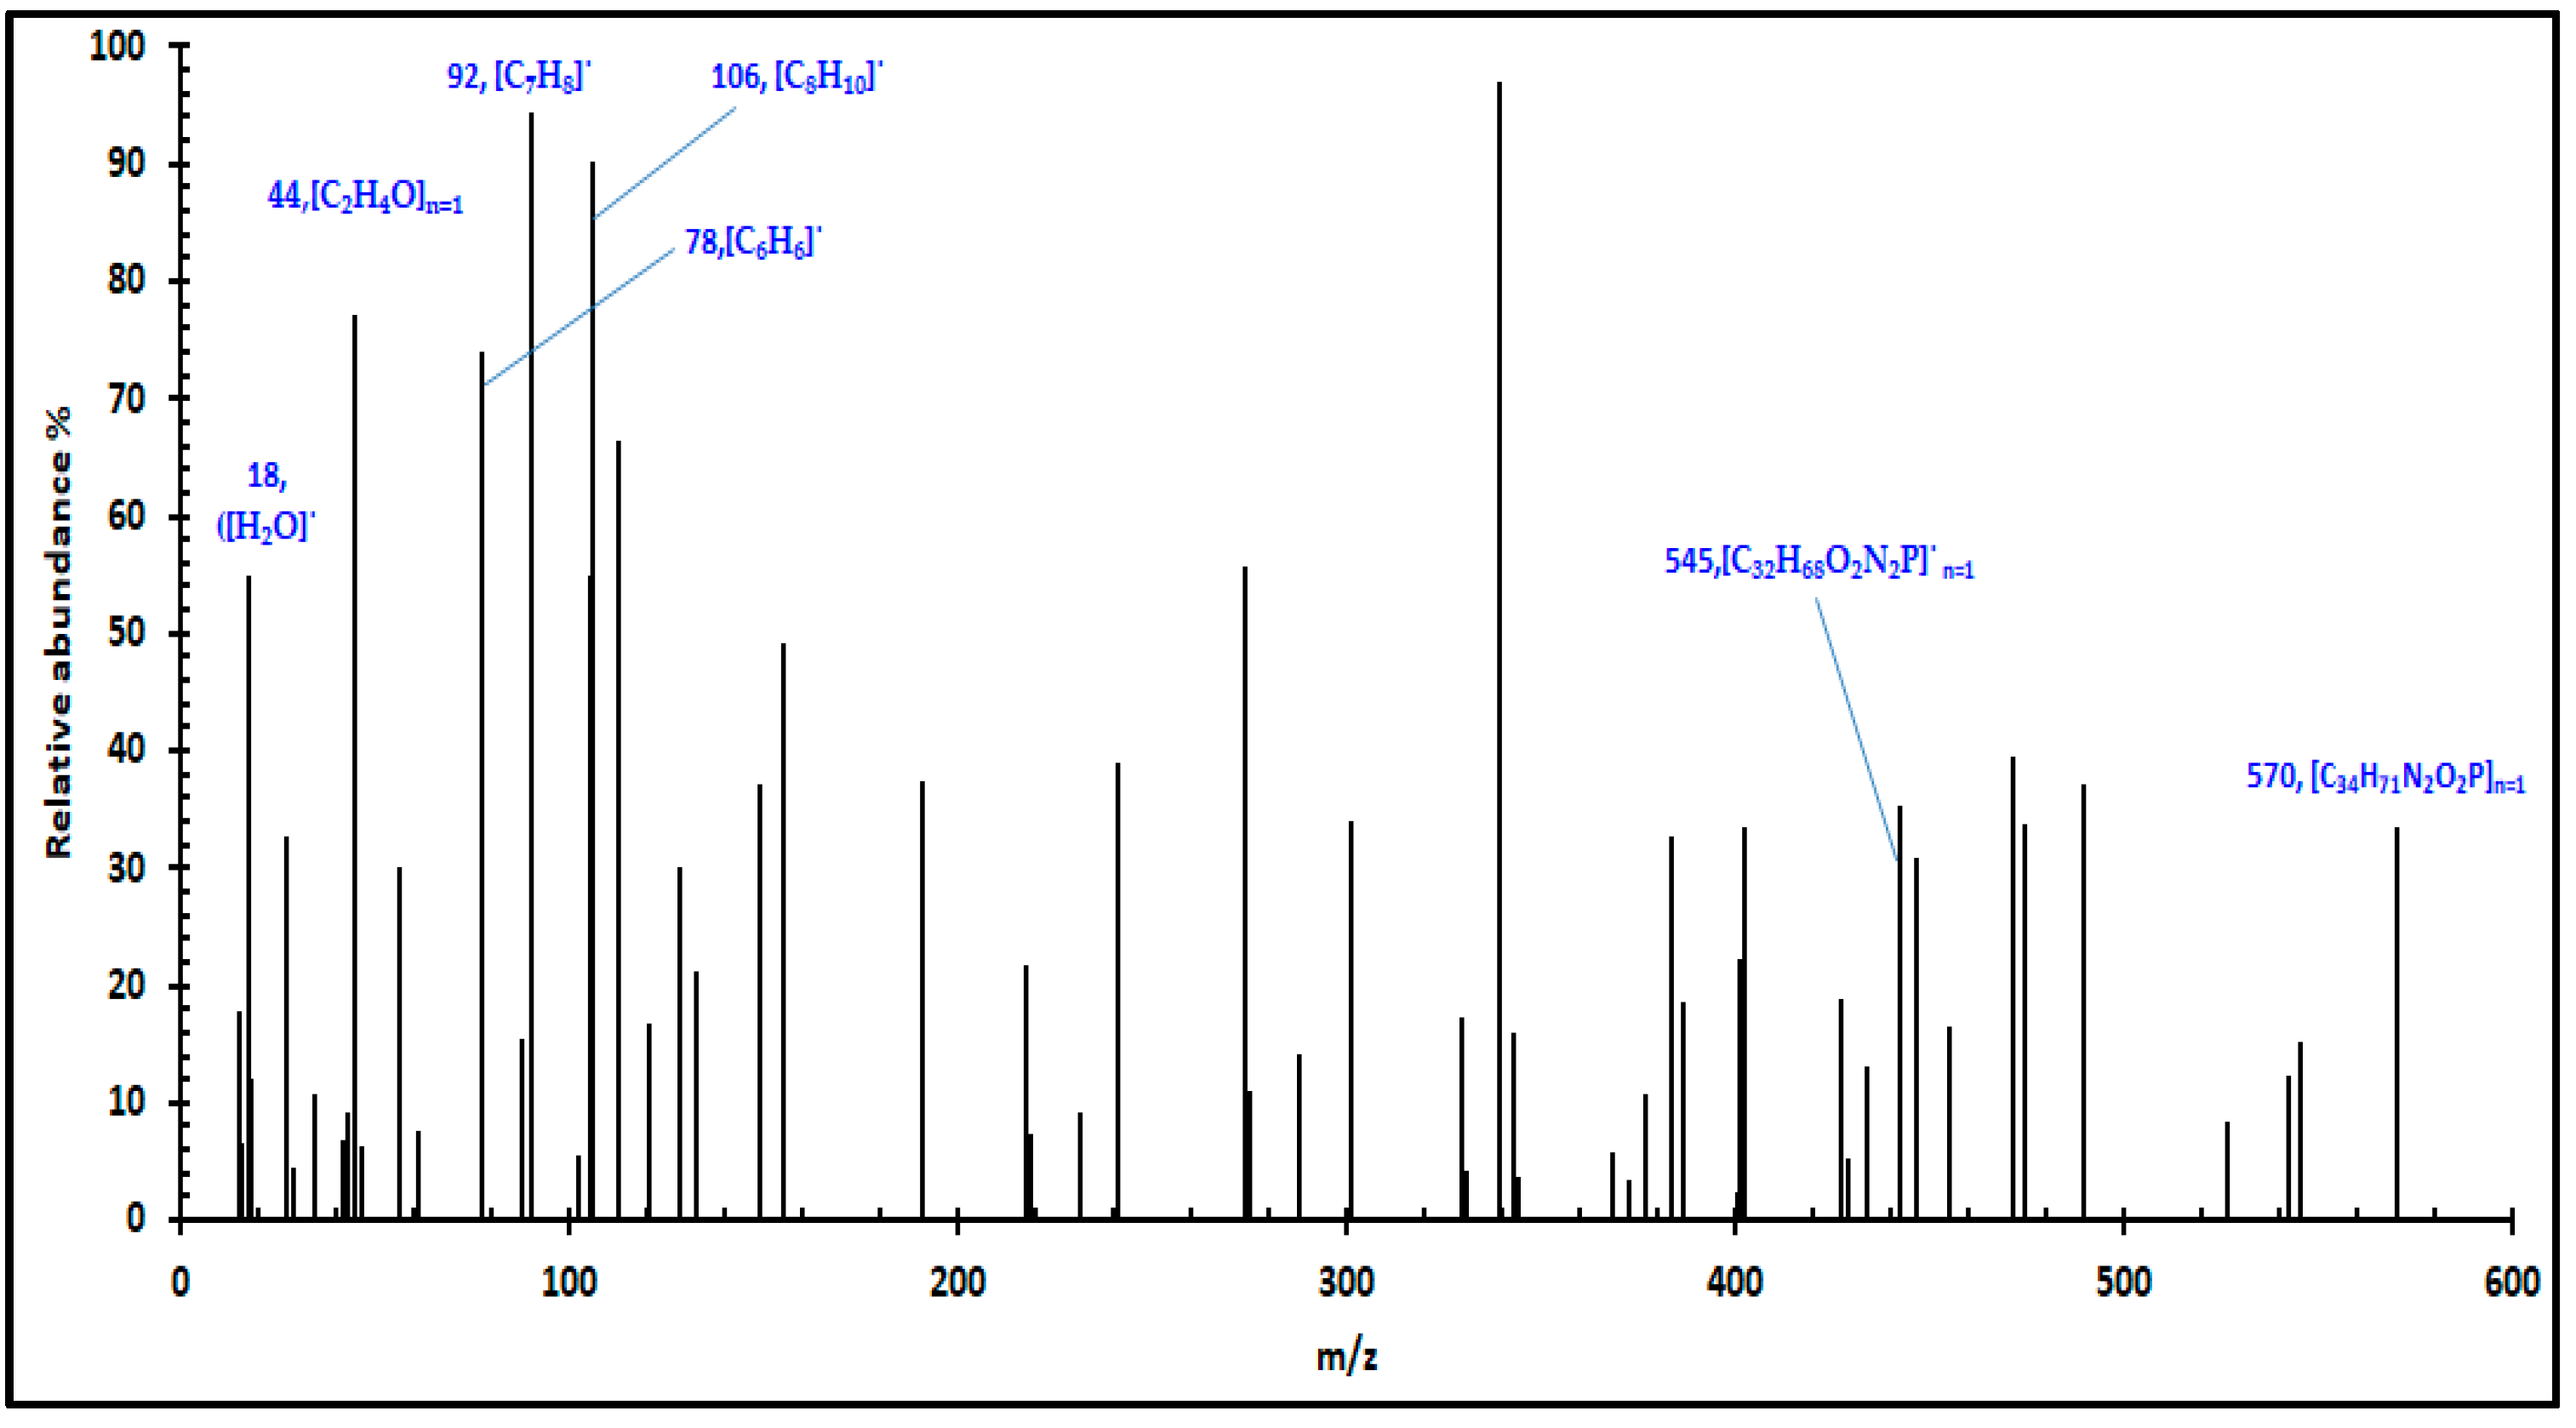
3.2.8. Mass Interpretation

Gas chromatograph-mass spectrometry (GC-MS) was used to determine the purity, base peak (associated with the more stable fragment) and quasi-molecular ion peak (related to the molecular formula). As shown by its molecular ion peak, the molecular weight of the produced ligand is 570 [C34H71N2O2P]n, with a relative abundance of 33%. Some important fragmentation patterns, which are connected to the prepared PPVP, were detected—for example, [C2H4O]n, with m/z =44 (n = 1) and a relative abundance of 77%, [C2H4O]n˙, with m/z = 88 (n = 2) and a relative abundance of 15%, and [C2H3O]n˙, with m/z = 43 (n = 1) and a relative abundance of 7%. These observations indicate the presence of remaining vinyl alcohol building units in the chain of PPVP. Furthermore, other fragments were observed which are considered as signs to the successful formation of PPVP, such as [C2H4]n˙, with m/z = 28 (n = 1) and a relative abundance of 32%, [C2H4]n˙, with m/z = 56 (n = 2) and a relative abundance of 30%, [C32H69O2N2P]˙, with m/z = 545 and a relative abundance of 15%, [C32H68O2N2P]˙, with m/z = 544 and a relative abundance of 12%, and [C32H68ON2P]˙, with m/z = 528 and a relative abundance of 8%. Some alkyl radicals which resulted from the fragmentation of the long chains of bis-(2-ethylhexyl) amine moiety were observed, such as [CH3]˙, with m/z = 15 and a relative abundance of 3%, [CH3CH2]˙, with m/z = 29 and a relative abundance of 4%, and [CH3CH2CH2]˙, with m/z = 43 and a relative abundance of 23%.
It is common knowledge that, when PVA is subjected to an electron flux, water is released ([H2O]˙, with m/z = 18 and a relative abundance of 55%), forming the polymerized polyene, which can form cyclic compounds such as benzene [C6H6]˙, with m/z = 78 and a relative abundance of 74%, ethyl benzene [C8H10]˙, with m/z = 106 and a relative abundance of 90%, toluene [C7H8]˙, with m/z = 92 and a relative abundance of 95%, and naphthalene [C10H8]˙, with m/z = 128 and a relative abundance of 30%. It is obvious that the whole analysis promises an acceptable synthesis of the PPVP solvating extractant. An explanation of the PPVP composite that utilized GC-MS is shown in Figure 6.

3.3. Factors Controlling the Extraction Process
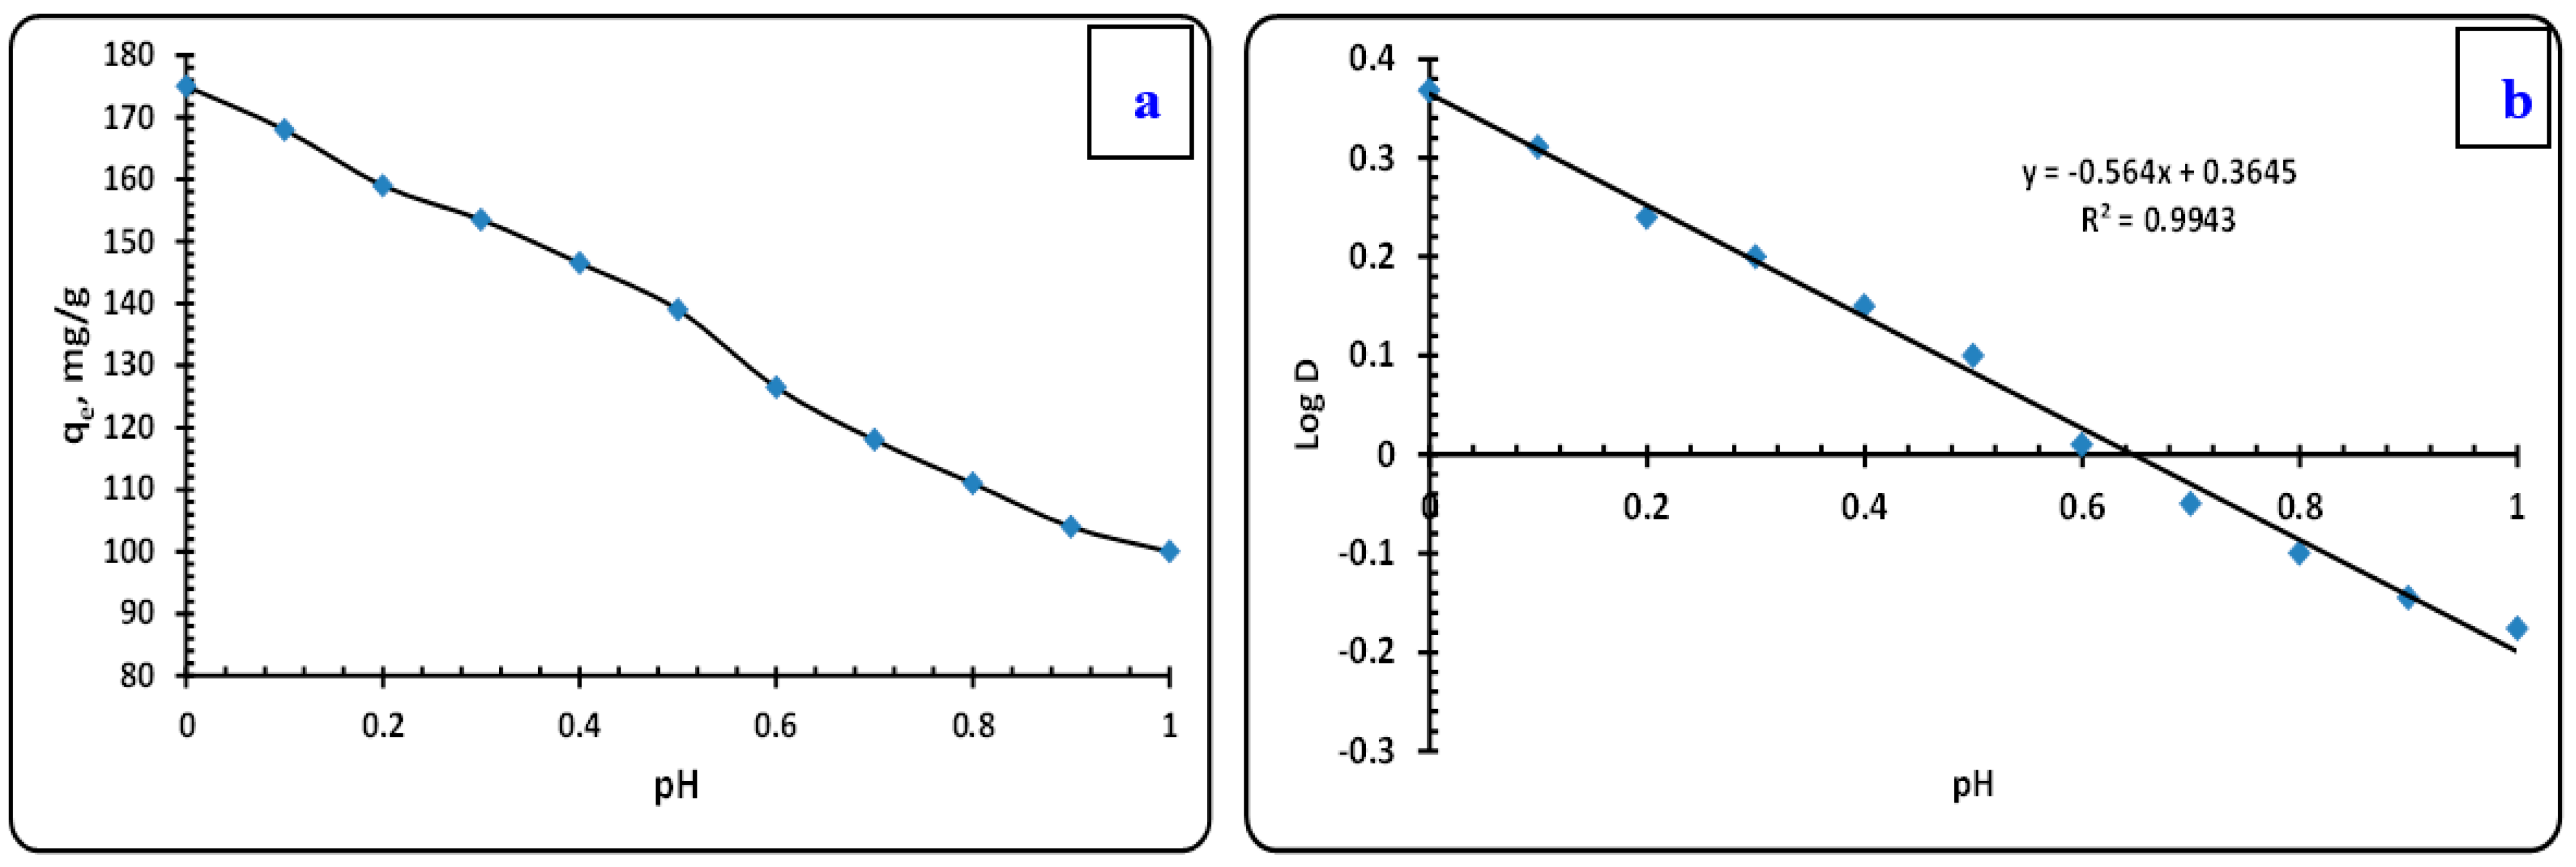
3.3.1. Effect of pH

According to the chemistry of Zirconium and the characteristics of the active sites of the PPVP composite both being affected by pH, pH is essential for the retention of zirconium ions onto all PPVP active sites. Zirconium ion speciation at different pH levels is shown in Figure S1 from the HYDRA-MEDUSA software. Several species in the solution have been suggested in prior investigations. These are separated into three types, namely, cationic, anionic and neutral species. Zirconium ions are primarily found in the cationic species Zr4+, Zr(OH)3+, Zr3(OH)57+ and Zr4(OH)88+ at pH values between 1 and −1. These cationic species can be neutralized with the stoichiometric amount of nitrate anions, where the neutralized species can be written as Zr(NO3)4, Zr(OH)(NO3)3, Zr3(OH)5(NO3)7 and Zr4(OH)8(NO3)8. The neutralized zirconium species can be extracted onto the neutral PPVP at a higher nitrate medium by the resembling solvating mechanism as follows:
Z r ( O H ) n + + m ( P P V P ) + n H N O 3 ( Z r ) n . ( P P V P ) m n + . n N O 3 + n H 2 O
It is known that the phosphine group in PPVP can be written in two tautomeric forms as follows:
P = O P + O
Hence, the phosphorous cation can attach the negative nitrates, and the negative oxygen can attach the positive zirconium cation species, forming a neutral resembling solvating chelate.
The neutral species resemble ZrO2 crystals, called basic zirconium oxide or basic zirconate, which start to form from approximately pH 1.5 to 12. The anionic species resemble Zr(OH)5−, which is detected between pH 11 and 12 [95].
The retention of zirconium ions on PPVP was examined at ambient temperature for 10 min. of shaking using 50 mL of 500 mg/L zirconium ions (0.005 mol/L) solution and 0.1 g of PPVP at a pH that ranged between 0 and 1, because the hydrolysis of Zirconium begins approximately at pH 1.5. Hence, the pH study limit will be in the range between 0 and 1 to avoid the hydrolysis of Zirconium [28]. Figure 7a depicts the acquired data, which reveal the enhancement of the adsorption capacity (qe, mg/g) from pH 1 (qe = 100 mg/g) to pH 0 (qe = 175 mg/g), which remains constant in a highly acidic medium (more –ve pH). The maximum uptake of zirconium ions at pH 0 (qe = 170 mg/g) was observed, since the cationic species were predominant in this range. As the obtained data suggested, pH 0 is the optimum pH for zirconium ions retention on PPVP, with an uptake capacity of qe = 170 mg/g (70%).
A straight line with a slope of −0.56 and an intersection at 0.3645 may be drawn from the linear regression analysis (slope analysis) of log D vs. pH. (Figure 7b). No hydrogen ions are released into the solution, as shown by the slope value, which determines the quantity of hydrogen ions released during the formation of the PPVP-Zr neutral complex. This means that the resembling solvating mechanism, rather than the cation exchange mechanism, is responsible for the extraction process. The stability constant (β) of the PPVP-Zr complex was calculated at pH 0–1 (log β = 0.3645), and it was found to be equal to 2.314.

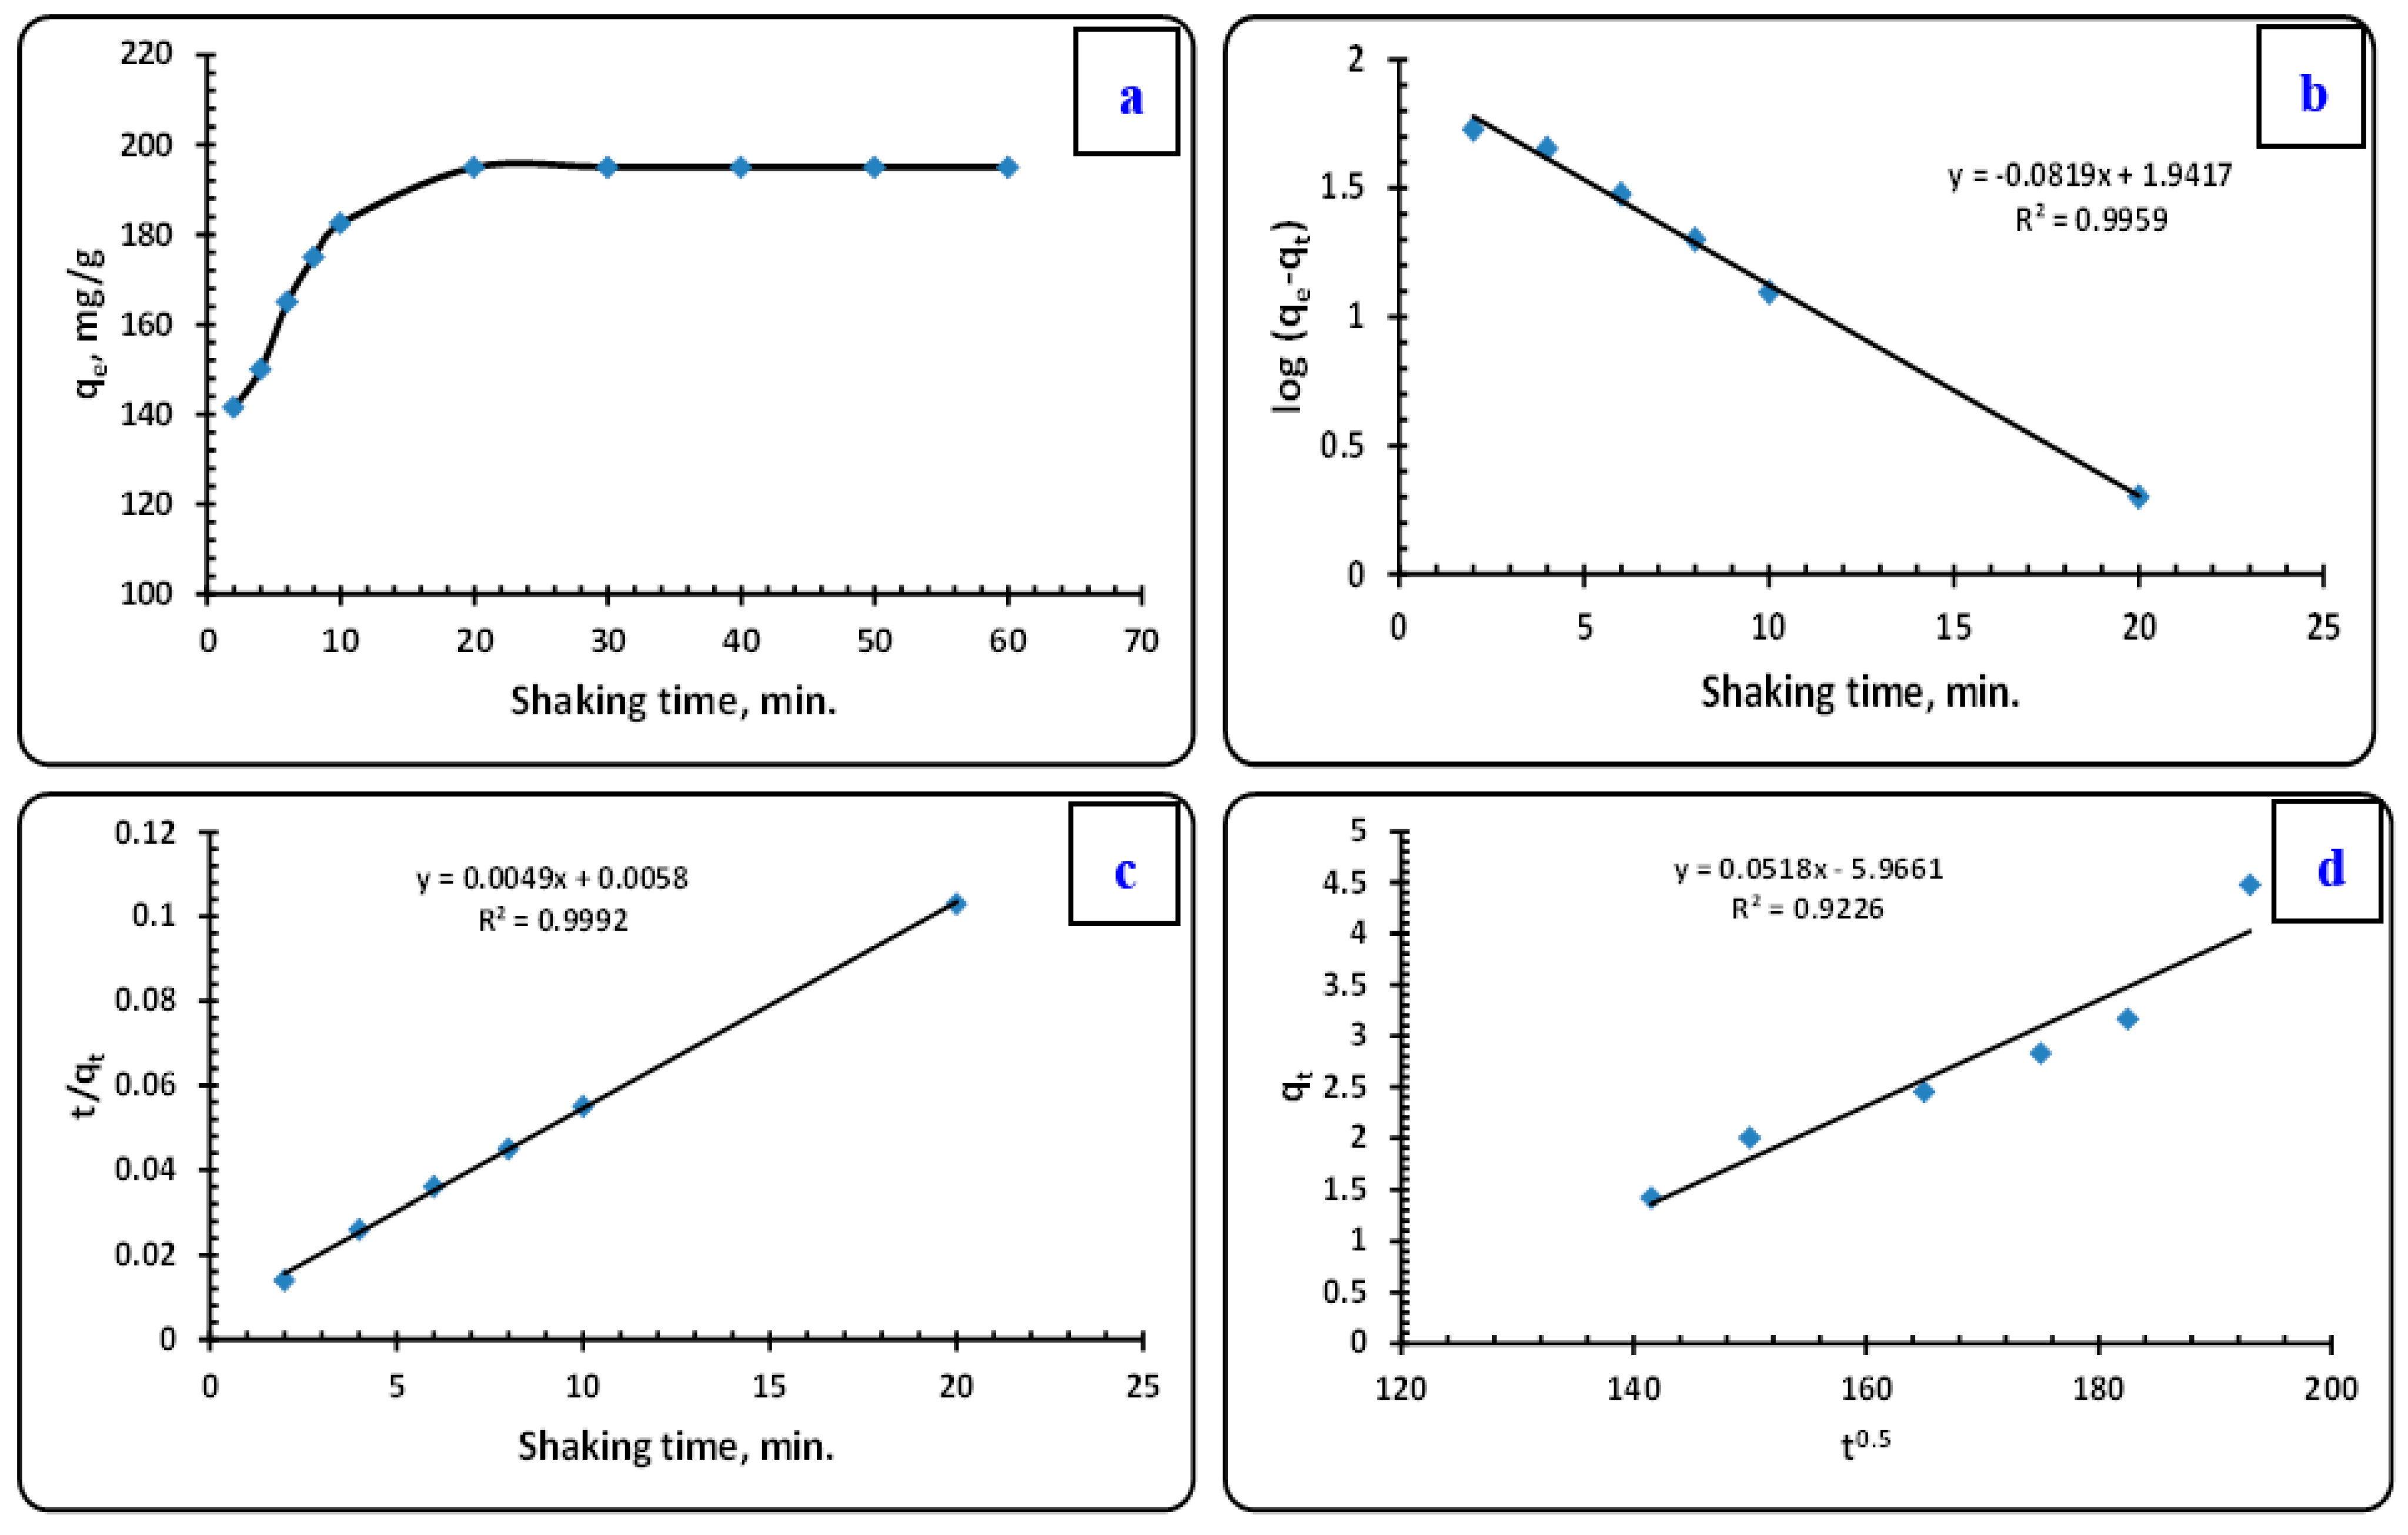
3.3.2. The Effect of Shaking Time

Economically, balance time is one of the most significant controlling factors. The effect of balance time on zirconium ions preservation over 2 to 60 min. is examined by 0.1 g PPVP and 50 mL zirconium solution with a concentration of 0.005 mol/L (500 mg/L) at pH 0. The results displayed in Figure 8a show that the uptake of zirconium ions enhances with an enhancing period of shaking time and achieves a maximum evaluation value at 20 min. (195 mg/g, 78% efficiency), after which it remains almost constant until 60 min. Accordingly, 20 min. were observed as more than satisfactory for equilibrium in sequential experiments and were approved in the next research.

Kinetic Prospects

The kinetic of the uptake of zirconium ions on PPVP explains the rate of extraction. The kinetic factors help to predict the extraction rate and provide crucial data to design and model extraction procedures. The suggested mechanism for zirconium ions extraction on PPVP and the rate constants of the extraction were estimated using pseudo-first-order, second-order and intra-particulate diffusion models. The next calculated equation defines the pseudo-first-order kinetic model:
L o g ( q e q t ) = L o g q e ( K 1 2.303 ) t
where K1 (min.−1) means a constant rate and qe is the quantity of zirconium ions extracted in a balanced way per unit mass (t, min.−1). Figure 8b depicts a straight line that results in the first-order extraction rate constant K1 and qe values from their slope and intercept, which are obtained from the plotting Log (qeqt). According to the plot diagram below, the pseudo-first-order kinetic modeling could not be employed to fit the practical data. The computed value of qe was 87.43 mg/g, which is not realistic (195 mg/g) at a rate of adsorption (K1 = 0.188 min−1, R2 = 0.9959) [96].
The kinetic modeling of the pseudo-second-order is defined using the next equation:
t q t = 1 k 2 q e 2 + ( 1 q e ) t
K2 indicates the constant rate (g/mg·min). The slope of the t/qt line is 1/qe,, and the interception is 1/k2qe2. Figure 8c presents that the kinetic modeling for the pseudo-second-order can be employed for the practical data. The mathematically calculated value of qe was 204.08 mg/g, which is nearly similar to the determined realistic uptake of 195 mg/g, with a correlation coefficient R2 = 0.9992 and an extraction rate (K2 = 2.4 × 10⁻⁵ g/mg·min). The results demonstrated that the second-order kinetic model is compatible with the experimental results and is therefore appropriate to explain the system being researched. According to the results, the kinetic second-order modeling is more comparable with the test results and is hence suitable for the extraction system interpretation.
PPVP-Zr extraction must be seen as a liquid–solid interaction. There are various ways to adjust the extraction rate of zirconium ions at the liquid–solid interface: (1) the process of diffusion, because it allows for diffusion from the bulk of the concerning solution to the film around the composite-active site (bulk diffusion mechanism), (2) the zirconium ions inter-sphere diffusion is noticed in the second scenario (external diffusion mechanism), (3) intra-particle diffusion is a kind of diffusion that takes place inside a particle (pore diffusion mechanism), (4) physical and chemical adsorption, ion exchange and complexation mechanisms are only a few of the various routes through which direct contact between zirconium ions and PPVP sites may occur [97].
The system agitation speed was regulated by external diffusion impacting the extraction rate. As the agitation speed increases, the thickness of the outside frontier or boundary layer decreases. The intra-particle diffusion model equation of Weber and Morris is used to depict zirconium ions extraction in various intervals in order to determine the likelihood of the square root of balancing time as a rate-controlling stage of the extraction of zirconium ions on the PPVP composite.
q t = K a d t + I
where qt is the uptake capacity of zirconium ions at t, Kad denotes the rate constant (mg/g·min.−1/2) and I represent the thickness of the boundary layer. The pitch of the qt linear gradients against t1/2 is used to compute the rate constant (Figure 8d). The R2 correlation coefficient was established to be 0.9226, while the constant intra-particle diffusion rate Kad was 0.0518 mg/g min.−1/2 and the computed boundary layer thickness (I) was −5.9661. The negative value of (I) suggests that the intra-particle diffusion mechanism could not regulate the zirconium ions extraction on the PPVP composite.

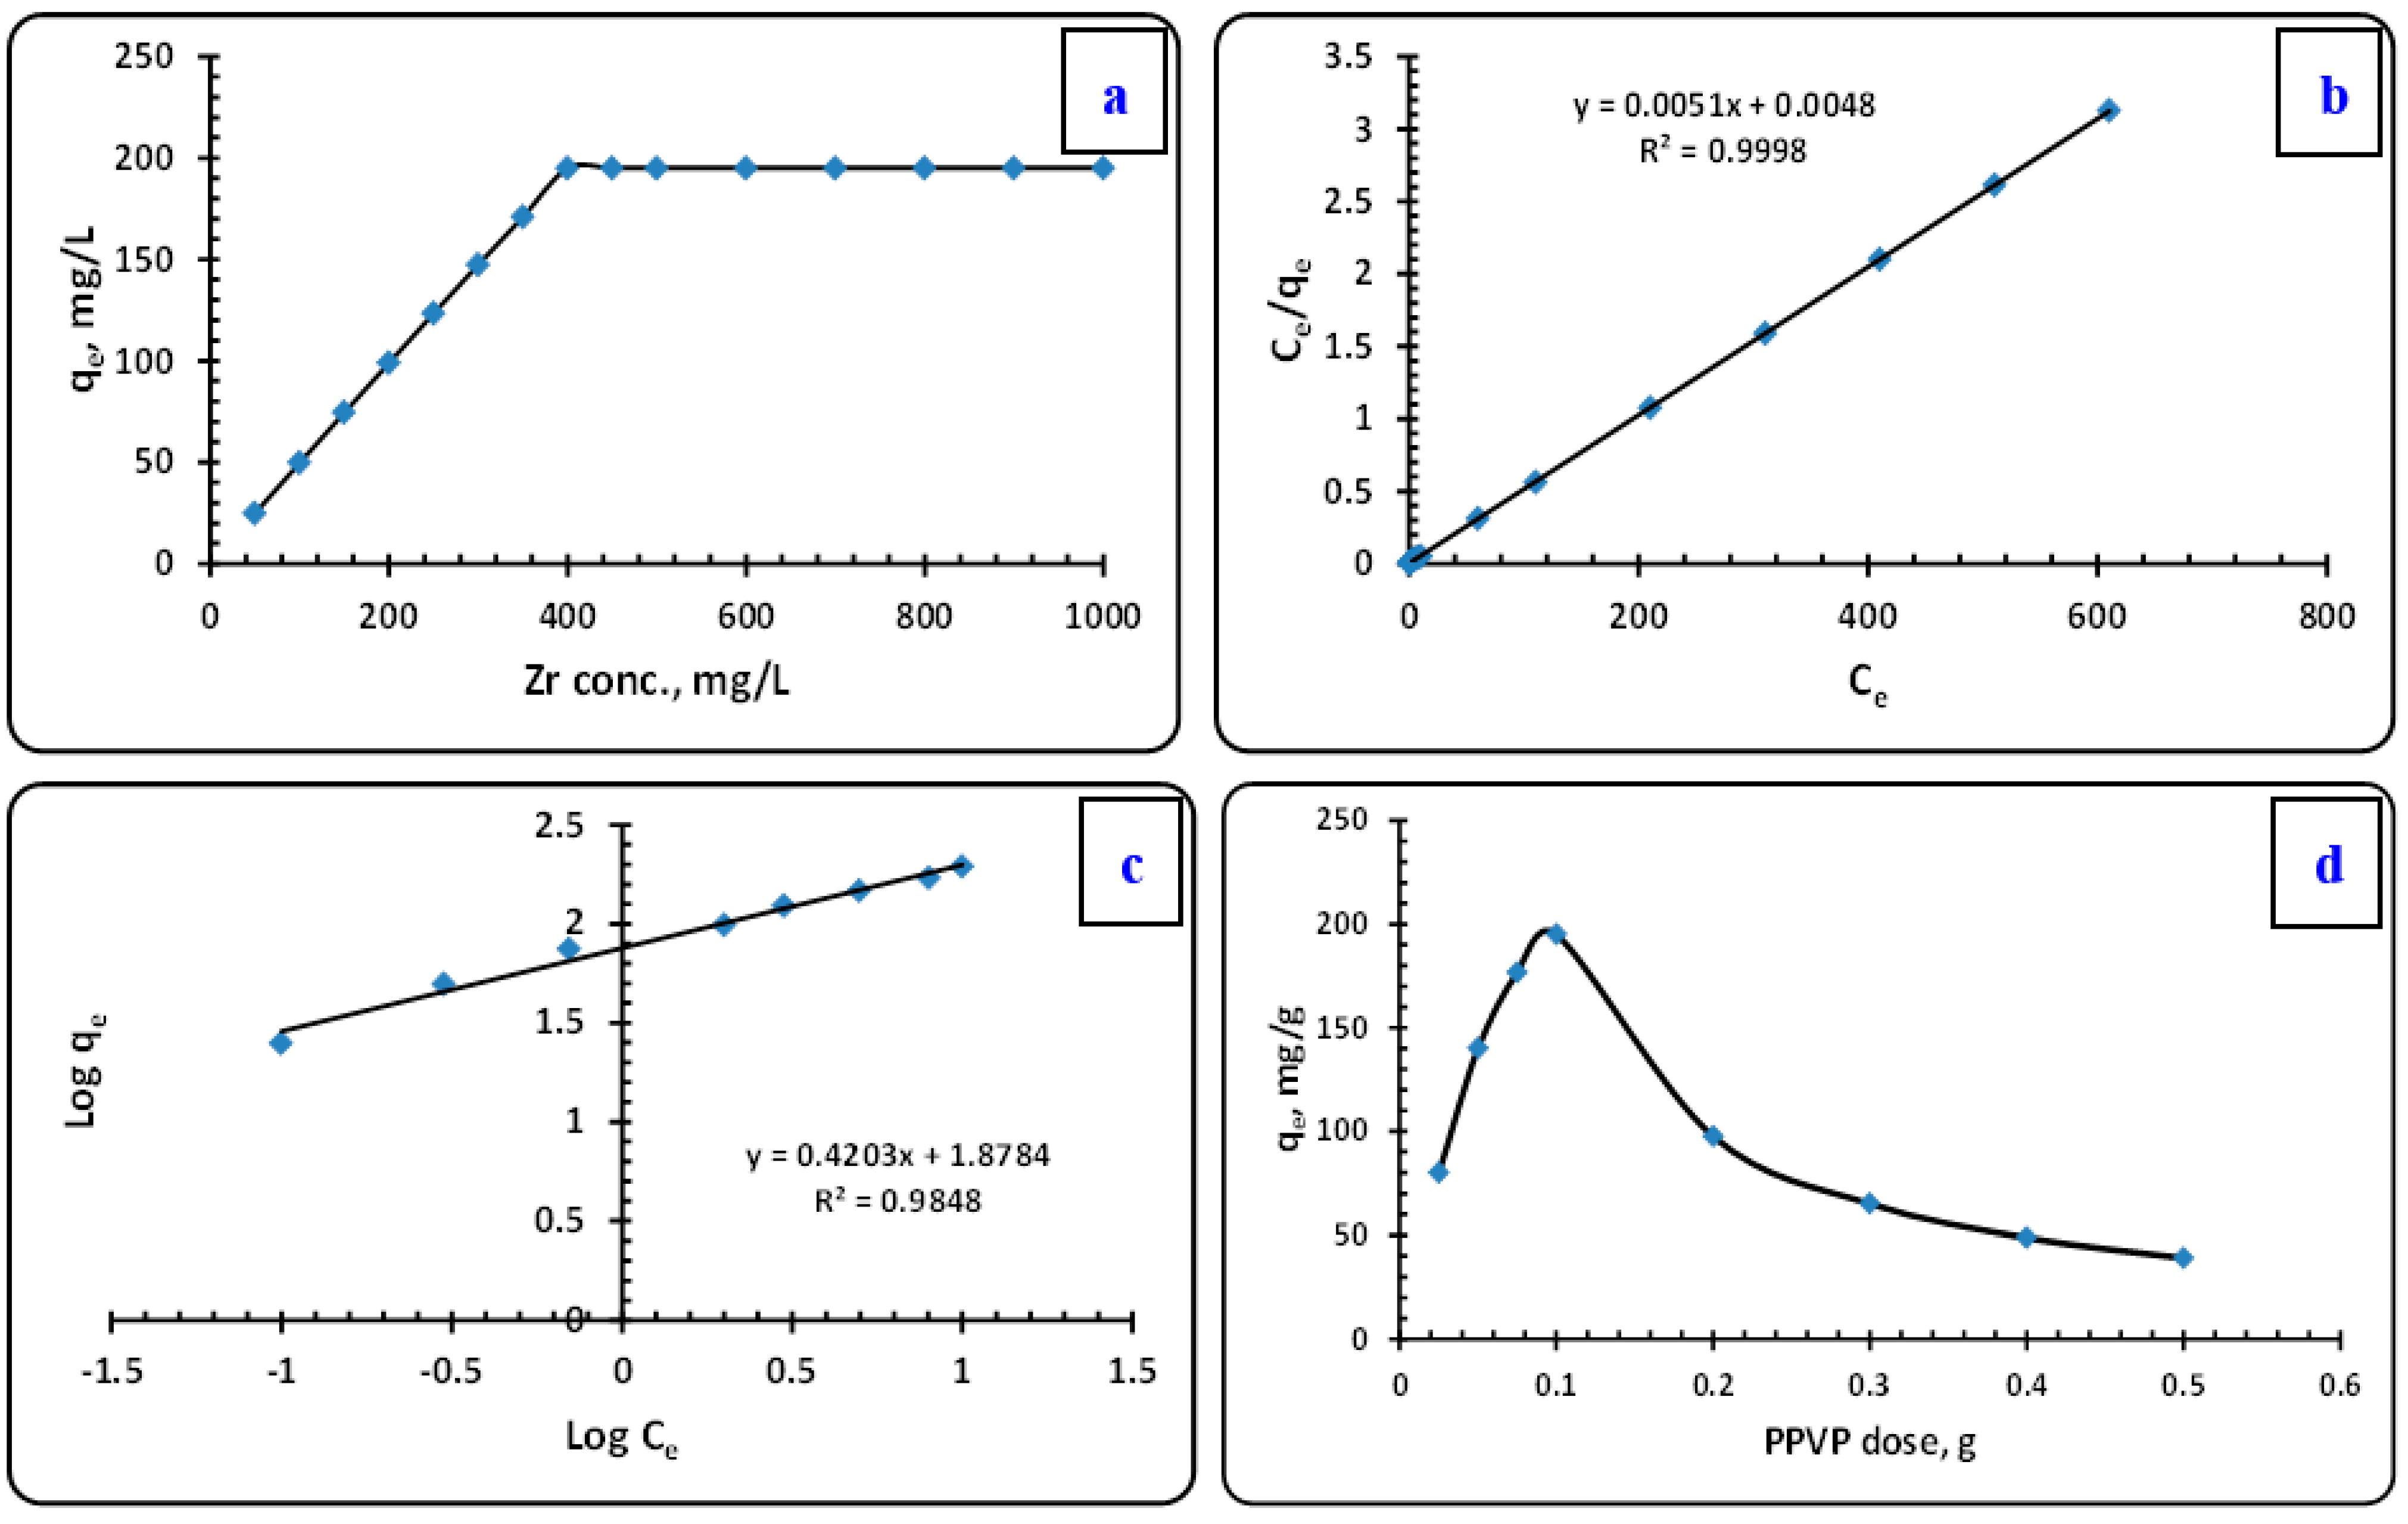
3.3.3. The Influence of Initial Zirconium Ions Concentration

An essential consideration for estimating extraction power is studying the influence of zirconium ions uptake as a function of initial zirconium conc. Zirconium ion uptake vs. initial zirconium ion conc. is shown in two stages in Figure 9a. In the first stage, zirconium extraction was significantly raised up from 50 mg/L to 350 mg/L because zirconium ions could not saturate PPVP at a low zirconium conc. due to a lack of zirconium ions relative to PPVP’s active site density. Zirconium ions extraction stays constant in the second stage, from 400 mg/L to 1000 mg/L, since the PPVP active sites have been saturated. At a zirconium concentration of 390 mg/L at room temperature, the highest value of zirconium retention (195 mg/g) is recorded.

Extraction-Distribution Isotherm Modeling

In order to determine the equilibrium concentration of zirconium ions at ambient temperature, the total number of zirconium ions extracted to PPVP was determined. The Langmuir approach depends on the postulates that (a) a monolayer of adsorbate molecules on the adsorbent surface is saturated at the maximum adsorption level, (b) the adsorption energy is constant and (c) there is no adsorbate trans-migration on the surface plane. The following equation describes the Langmuir isotherm model [98,99]:
C e q e = 1 q e b + C e q e
where Ce is the equilibrium concentration in milligrams per liter, qe is the total number of zirconium ions extracted at equilibrium and qe and b are Langmuir constants relating to the maximum extraction potential in milligrams per gram and the extraction energy in liters per milligram (L/mg), respectively.
The linear relationship between Ce/qe and Ce, shown in Figure 9b, suggests that the extraction process is compatible with the Langmuir model. R2 = 0.9998 was calculated as the correlation coefficient for the linear regression model best fitting the Langmuir plot. After factoring in the slope and the interception, we obtain an estimated value of 196.07 mg/g for qe and an estimate of 0.941 g/mg for b. The computed value for qe (195 mg/g) is closer to the experimental measurement. A dimensionless constant, separation factor or equilibrium parameter, RL, given by the following equation, can be used to explain the essential features of the Langmuir isotherm:
R L = 1 1 + b C o
where b is the Langmuir constant and Co is the initial zirconium ions concentration, ranging between 50 and 1000 mg/L. The values of RL were found between 0.001 and 0.02, indicating the promising extraction of zirconium ions onto PPVP. The Freundlich isotherm was also utilized for the extraction [100]. Although fundamentally mathematical, this equation is frequently helpful when trying to make sense of the data. The Freundlich isotherm model is modeled by the following equation:
L o g q e = L o g K f + ( 1 n ) L o g C e
Kf is the extraction uptake potential (mg/g) and n is the extraction rate, both defined by the Freundlich constants; Ce is the equilibrium concentration (mg/L); qe is the total number of extracted zirconium ions at equilibrium. The constants Kf and n were calculated to be 75.57 mg/g and 2.379, respectively, using a linear plot of Log qe vs Log Ce (Figure 9c). When (n) is between 0 and 10, it has also been demonstrated to extract useful information. The Kf value (75.57 mg/g) is less than the experimental value, and R2 = 0.9848 was discovered in the Freundlich plot correlation coefficient. This indicates that the practical findings are more closely fitting to Langmuir’s theory than Freundlich’s model.

3.3.4. The Influence of PPVP Dose

It is a grand cursor that zirconium ions uptake would be effective, as it affects the sorbent–sorbate balance in the extraction system. To consider the PPVP dose effect on zirconium uptake, an investigation was performed on the influence of a 0.025 g to 0.5 g PPVP composite dose on zirconium ions extraction at a constant zirconium concentration (390 mg/L), which is equivalent to the experimental maximum adsorbed capacity (195 mg/g), using 0.1 g of PPVP. Figure 9d indicates that the PPVP dose from 0.025 g to 0.1 g results in rising zirconium ions uptake and then gradually decreases due to the excessive number of active PPVP sites. By increasing the PPVP dose from 0.2 g to 0.5 g, The zirconium ions uptake decreases as the number of PPVP active sites becomes more than the number of zirconium ions. Based on the results, 0.1 g of PPVP may be considered a breakthrough point, with a total consumption potential of 195 mg/g, equivalent to 390 mg/L zirconium ions.

3.3.5. The Influence of Nitrate Concentration

The effect of nitrate ions on the PPVP uptake is a considerable driver to examine, because it allows for a better understanding of nitrate’s potential role in raising or reducing PPVP uptake towards zirconium ions. Figure S3a spells out two stages of the plot of zirconium ions extraction versus nitrate ions concentration. In the first stage, there was an important enhancement in Zirconium adsorbed from 126.5 mg/g at 0.1 mol/L nitrate to 190 mg/g at 0.5 mol/L nitrate. A steady state is noticed for zirconium uptake (190 mg/g) after 0.5 mol/L to 1 mol/L nitrate. A maximal value of zirconium uptake by PPVP (195 mg/g) is identified at a zirconium concentration of 390 mg/L and 0.5 mol/L nitrate ions at ambient temp.
Linear regression analysis (as slope analysis), involving a plot of log D against nitrate ions concentration (mol/L), gives a straight line with a slope of 1.24 (Figure S3b). The slope value specifies the stoichiometric number of nitrates bonded to the PPVP-Zr neutral complex during the extraction process, so it indicates that nearly one nitrate ion is bonded to PPVP-Zr. It is confirmed that the resembling solvating mechanism controls the working extraction process.

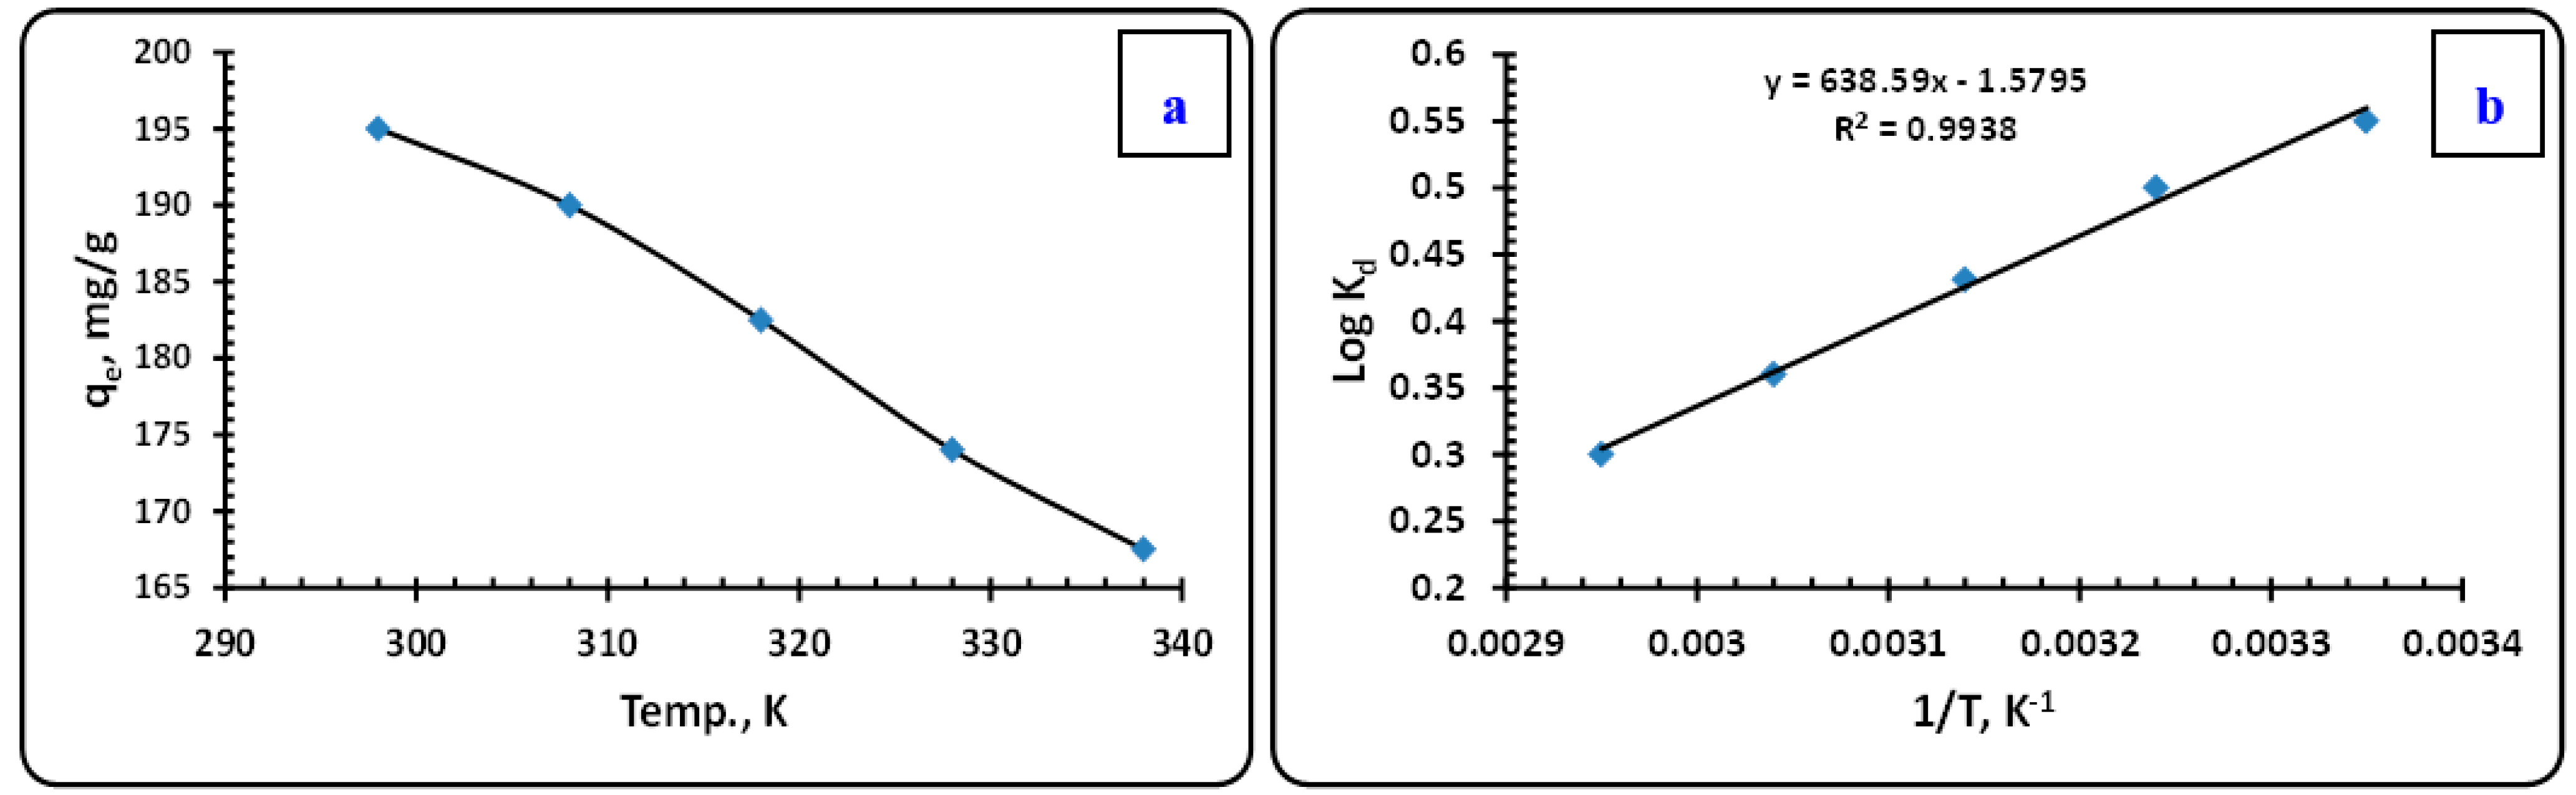
3.3.6. Thermodynamic Prospects

The substantial thermodynamic elements resulting from both Vant-Hoff and Gibbs free energy calculations can be utilized to explain the influence of temperature on the extraction equilibrium and the spontaneity of the extraction process at altered temperatures. The effect of temperature on zirconium ions uptake is calculated by contacting 0.1 g PPVP and 50 mL aqueous zirconium solution with a concentration of 500 mg/L at pH 0 for 20 min. at temperatures ranging between 298 and 338 K. It was observed that when the temperature rises from 298 to 338 K, the uptake capacity decreases from 195 mg/g to 167.5 mg/g, respectively. The influence of temperature on zirconium ions uptake is illustrated in Figure 10a.
In order to calculate the thermodynamic elements such as Gibbs free energy (∆G, kJ/mol), enthalpy change (∆H, kJ/mol) and entropy change (∆S, J/mol.K), the next equations were used [101]:
Δ G = Δ H T Δ S
L o g K d = Δ S 2.303 R Δ H 2.303 R T
where R (8.314 J·mol−1·K−1) means the universal gas constant; T is the temp. in Kelvin (K).
Figure 10b shows that the values of ∆H and ∆S were mathematically calculated from the slope and intersection of the Log Kd against 1/T plot and yielded a slope of 638.59 within an intersection of −1.5795 and a correlation coefficient R2 = 0.9938.
Table S2 shows ∆H with the negative value of (−12.22 kJ/mol), which illustrates that zirconium ions conservation onto PPVP is an exothermic mechanism, suggesting that some heat is free through the extraction progression.
The ∆S modest negative value of (−0.03 kJ/mol) specifies a slight reduction in unpredictability (randomness) throughout the extraction process. Negative ∆G values revealed that the extraction mechanism is thermodynamically spontaneous and probable at low temperatures.
Furthermore, increasing ∆G values with accumulative temperatures from −2.948 kJ/mol at 298 K to −1.941 kJ/mol at 338 K indicates that the extraction process is desirable at low temperatures. The Arrhenius equation is important due to the slope of the straight line produced in Figure 10b aiding in calculating the apparent activation energy (Ea) of zirconium ions extraction on PPVP at different temperatures. The Arrhenius equation can be considered via the next equation [102]:
L o g K d = 2.303 E a R T + L o g A
where
  • Kd is the partition coefficient,
  • Ea represents the extraction activation energy (kJ/mol),
  • R means the molar gas constant (8.314 J/mol·K),
  • T is the temperature in Kelvin (K),
  • A signifies the pre-exponential factor that is independent of temperature.
The activation energy vital for zirconium ions extraction was mathematically calculated and gives −2.305 kJ/mol. This means that the extraction of zirconium ions upon PPVP is considered an exothermic process that occurs spontaneously at ambient temperature. There is a lack of a need for activation energy, and the extraction process is not very sensitive to temperature.

3.3.7. The Effect of Co-Ions

The final leach liquid contains potential co-ions along with zirconium ions. The effect of co-existing ions was investigated separately using a 500 mg/L aqueous zirconium solution at pH 0 that had been agitated with 0.1 g PPVP at 25 °C for 20 min. The efficiency and the selectivity of PPVP towards zirconium ions are administered by the separation factor, which represents (DM). From the data revealed in Table 3, it is determined that PPVP can extract zirconium ions from the nitrate medium that has co-ions via the optimal conditions with a satisfactory separation factor. It was clear that a high S.F could be obtained with metal cations such as Na+, K+, Si4+, Al3+, Ca2+ and Mg2+, but heavy metals such as Fe3+, Cr3+, Mn2+ and V5+ can affect the extraction of zirconium ions and can be co-extracted simultaneously with zirconium ions with different separation factors. Importantly, PPVP has a great affinity to Hf4+ ions, which means that Zirconium and hafnium will be found together in the final prepared zirconium concentrate. Increasing the separation factor will enable us to separate the co-ions from zirconium ions by multi-stage extraction.

3.3.8. Zirconium Elution and Precipitation

Three inorganic acids ranging in concentration from 0.025 M to 2 M were tested as eluting or stripping agents at ambient temp. using 25 mL acid volume for 0.1 g loaded PPVP/Zr under 10 min. of agitation in order to back extract (elute) zirconium ions from the PPVP. From the given data tabulated at Table 4, it was found that the zirconium ions elution efficiency decreases at high acidic concentrations, while it was enhanced by decreasing the concentration of acid. It has been possible to achieve an elution efficiency of 99% with 25 mL of 0.025M HNO3, 0.025M HCl or 0.05M H2SO4. For economic aspects, 0.025M H2SO4 (99%) is used to elute zirconium ions from the loaded PPVP/Zr. To prepare proper zirconium oxide concentrate from the eluted solution, the solution is subjected to pH adjustment until pH 5 by 30% NH4OH, where Zirconium is precipitated as basic zirconate [7,12]. The precipitate is left to settle down for 12 h and is filtered. The precipitate is calcined at 850 °C for 3 h in an electric oven to obtain the zirconium oxide (ZrO2) concentrate as a final product.

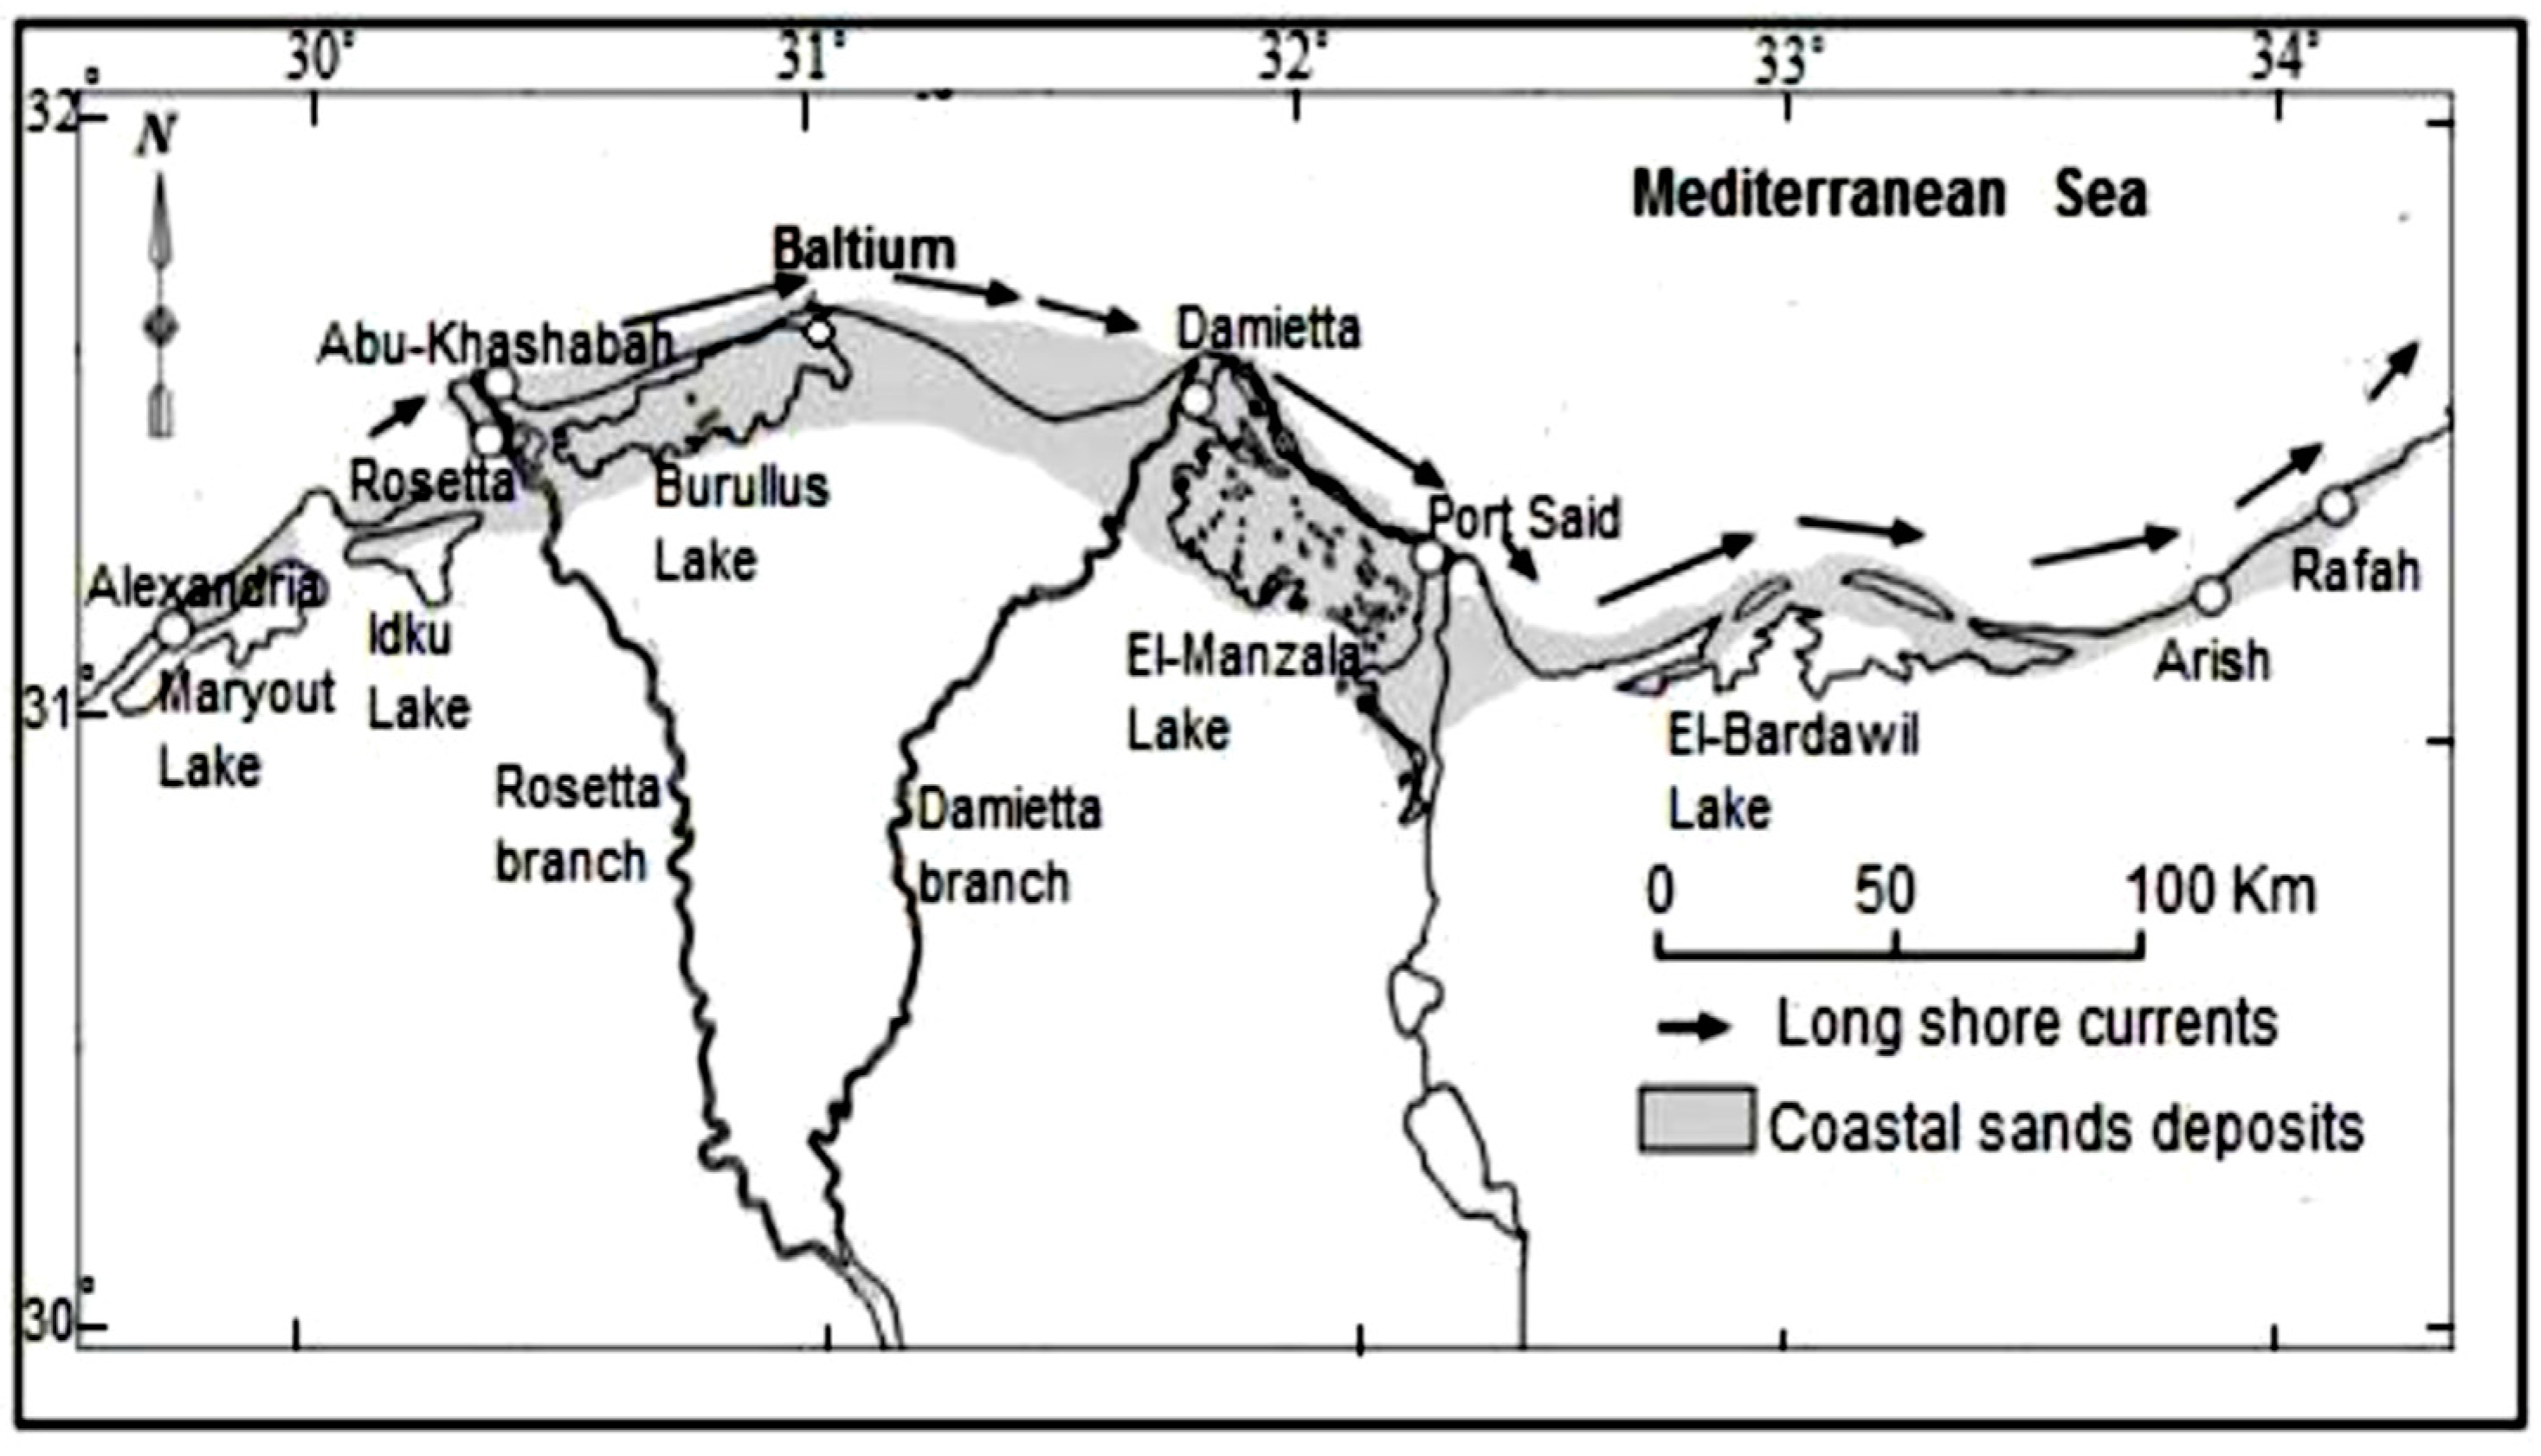
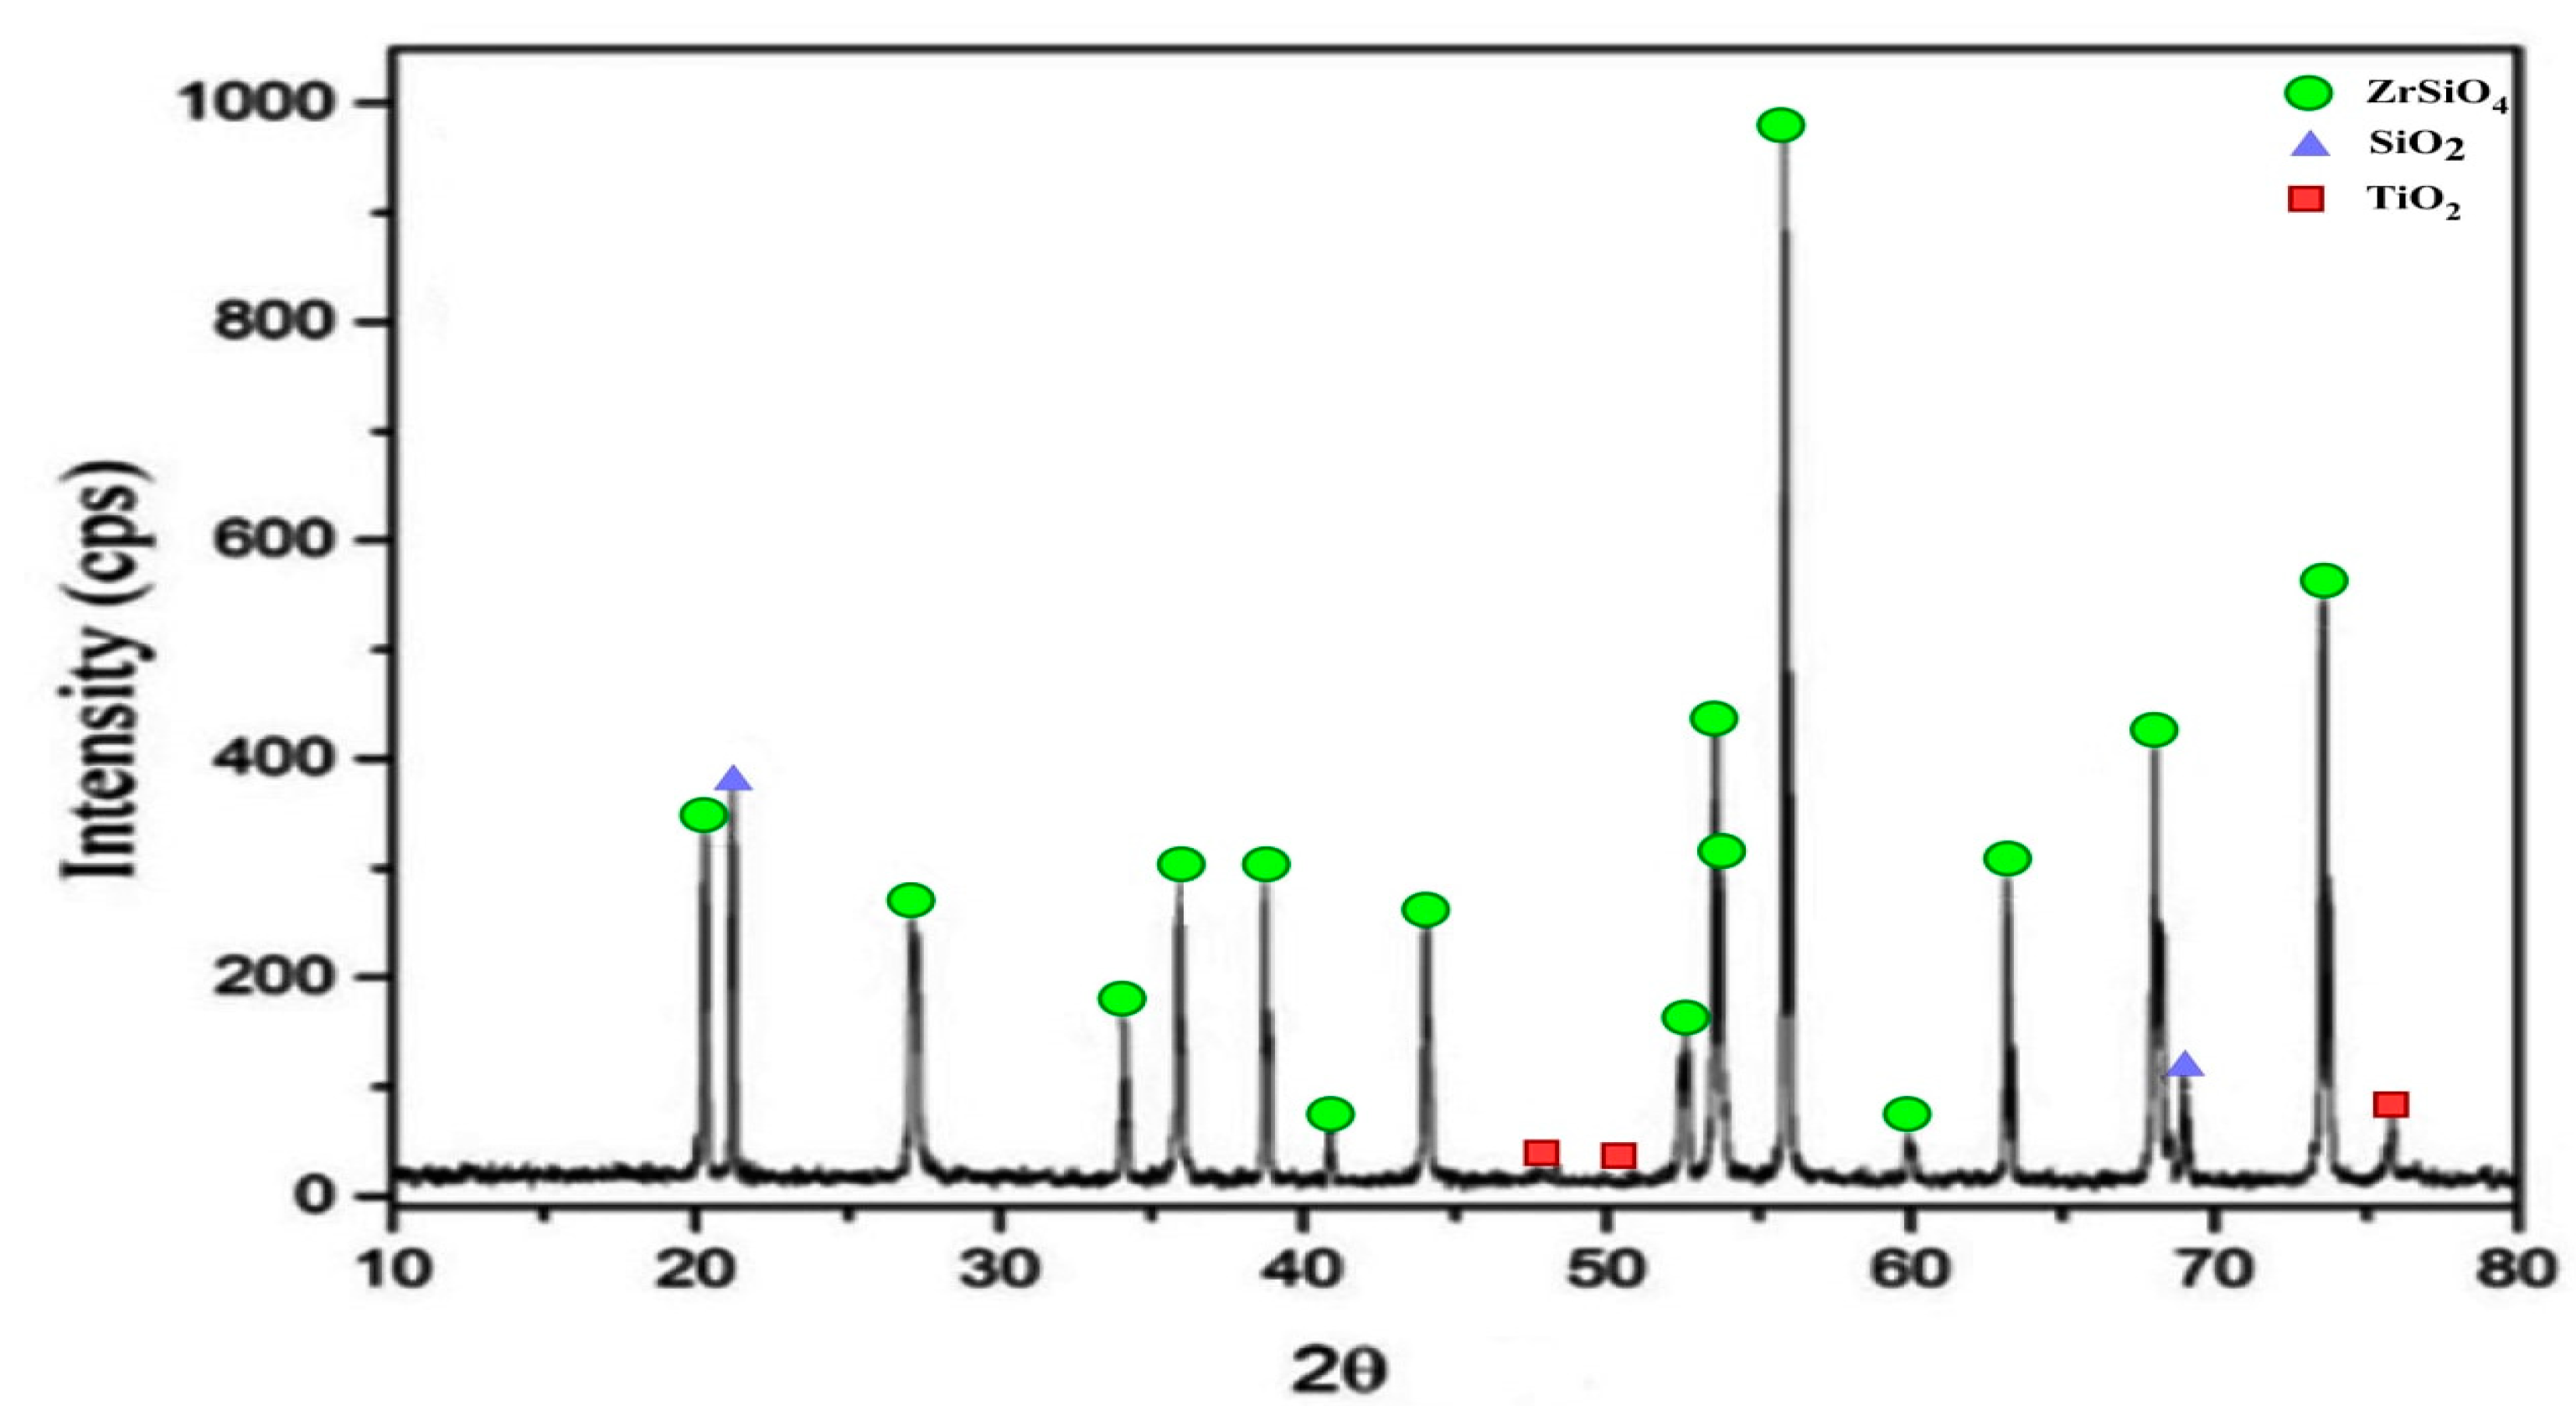
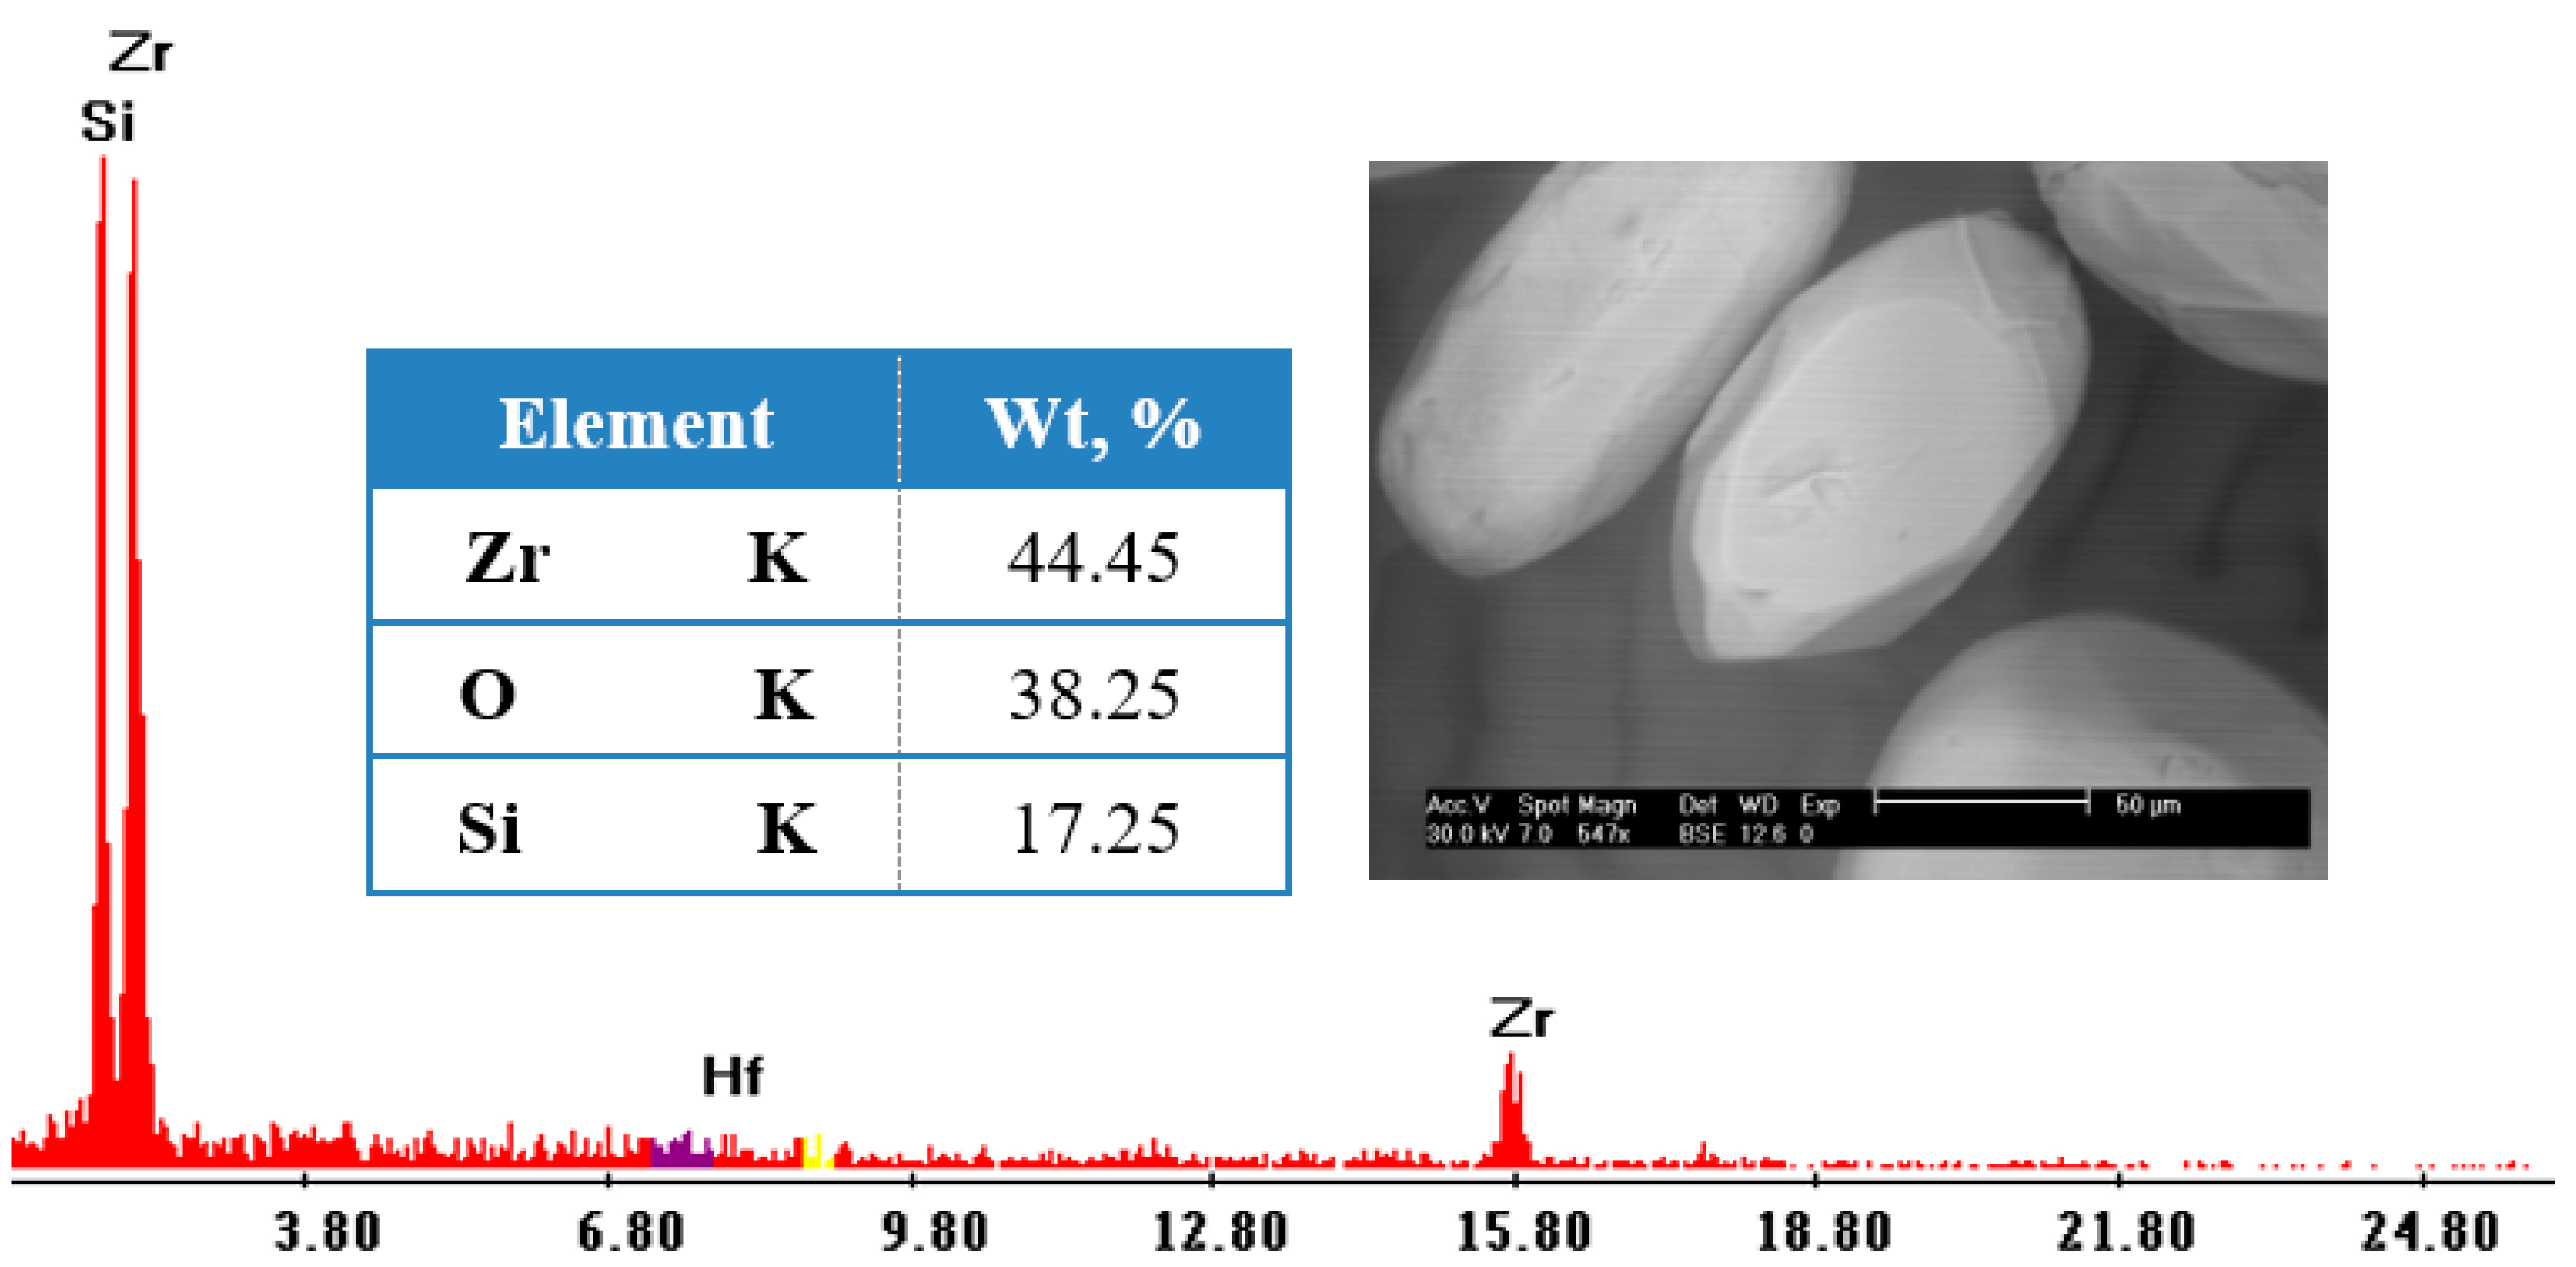
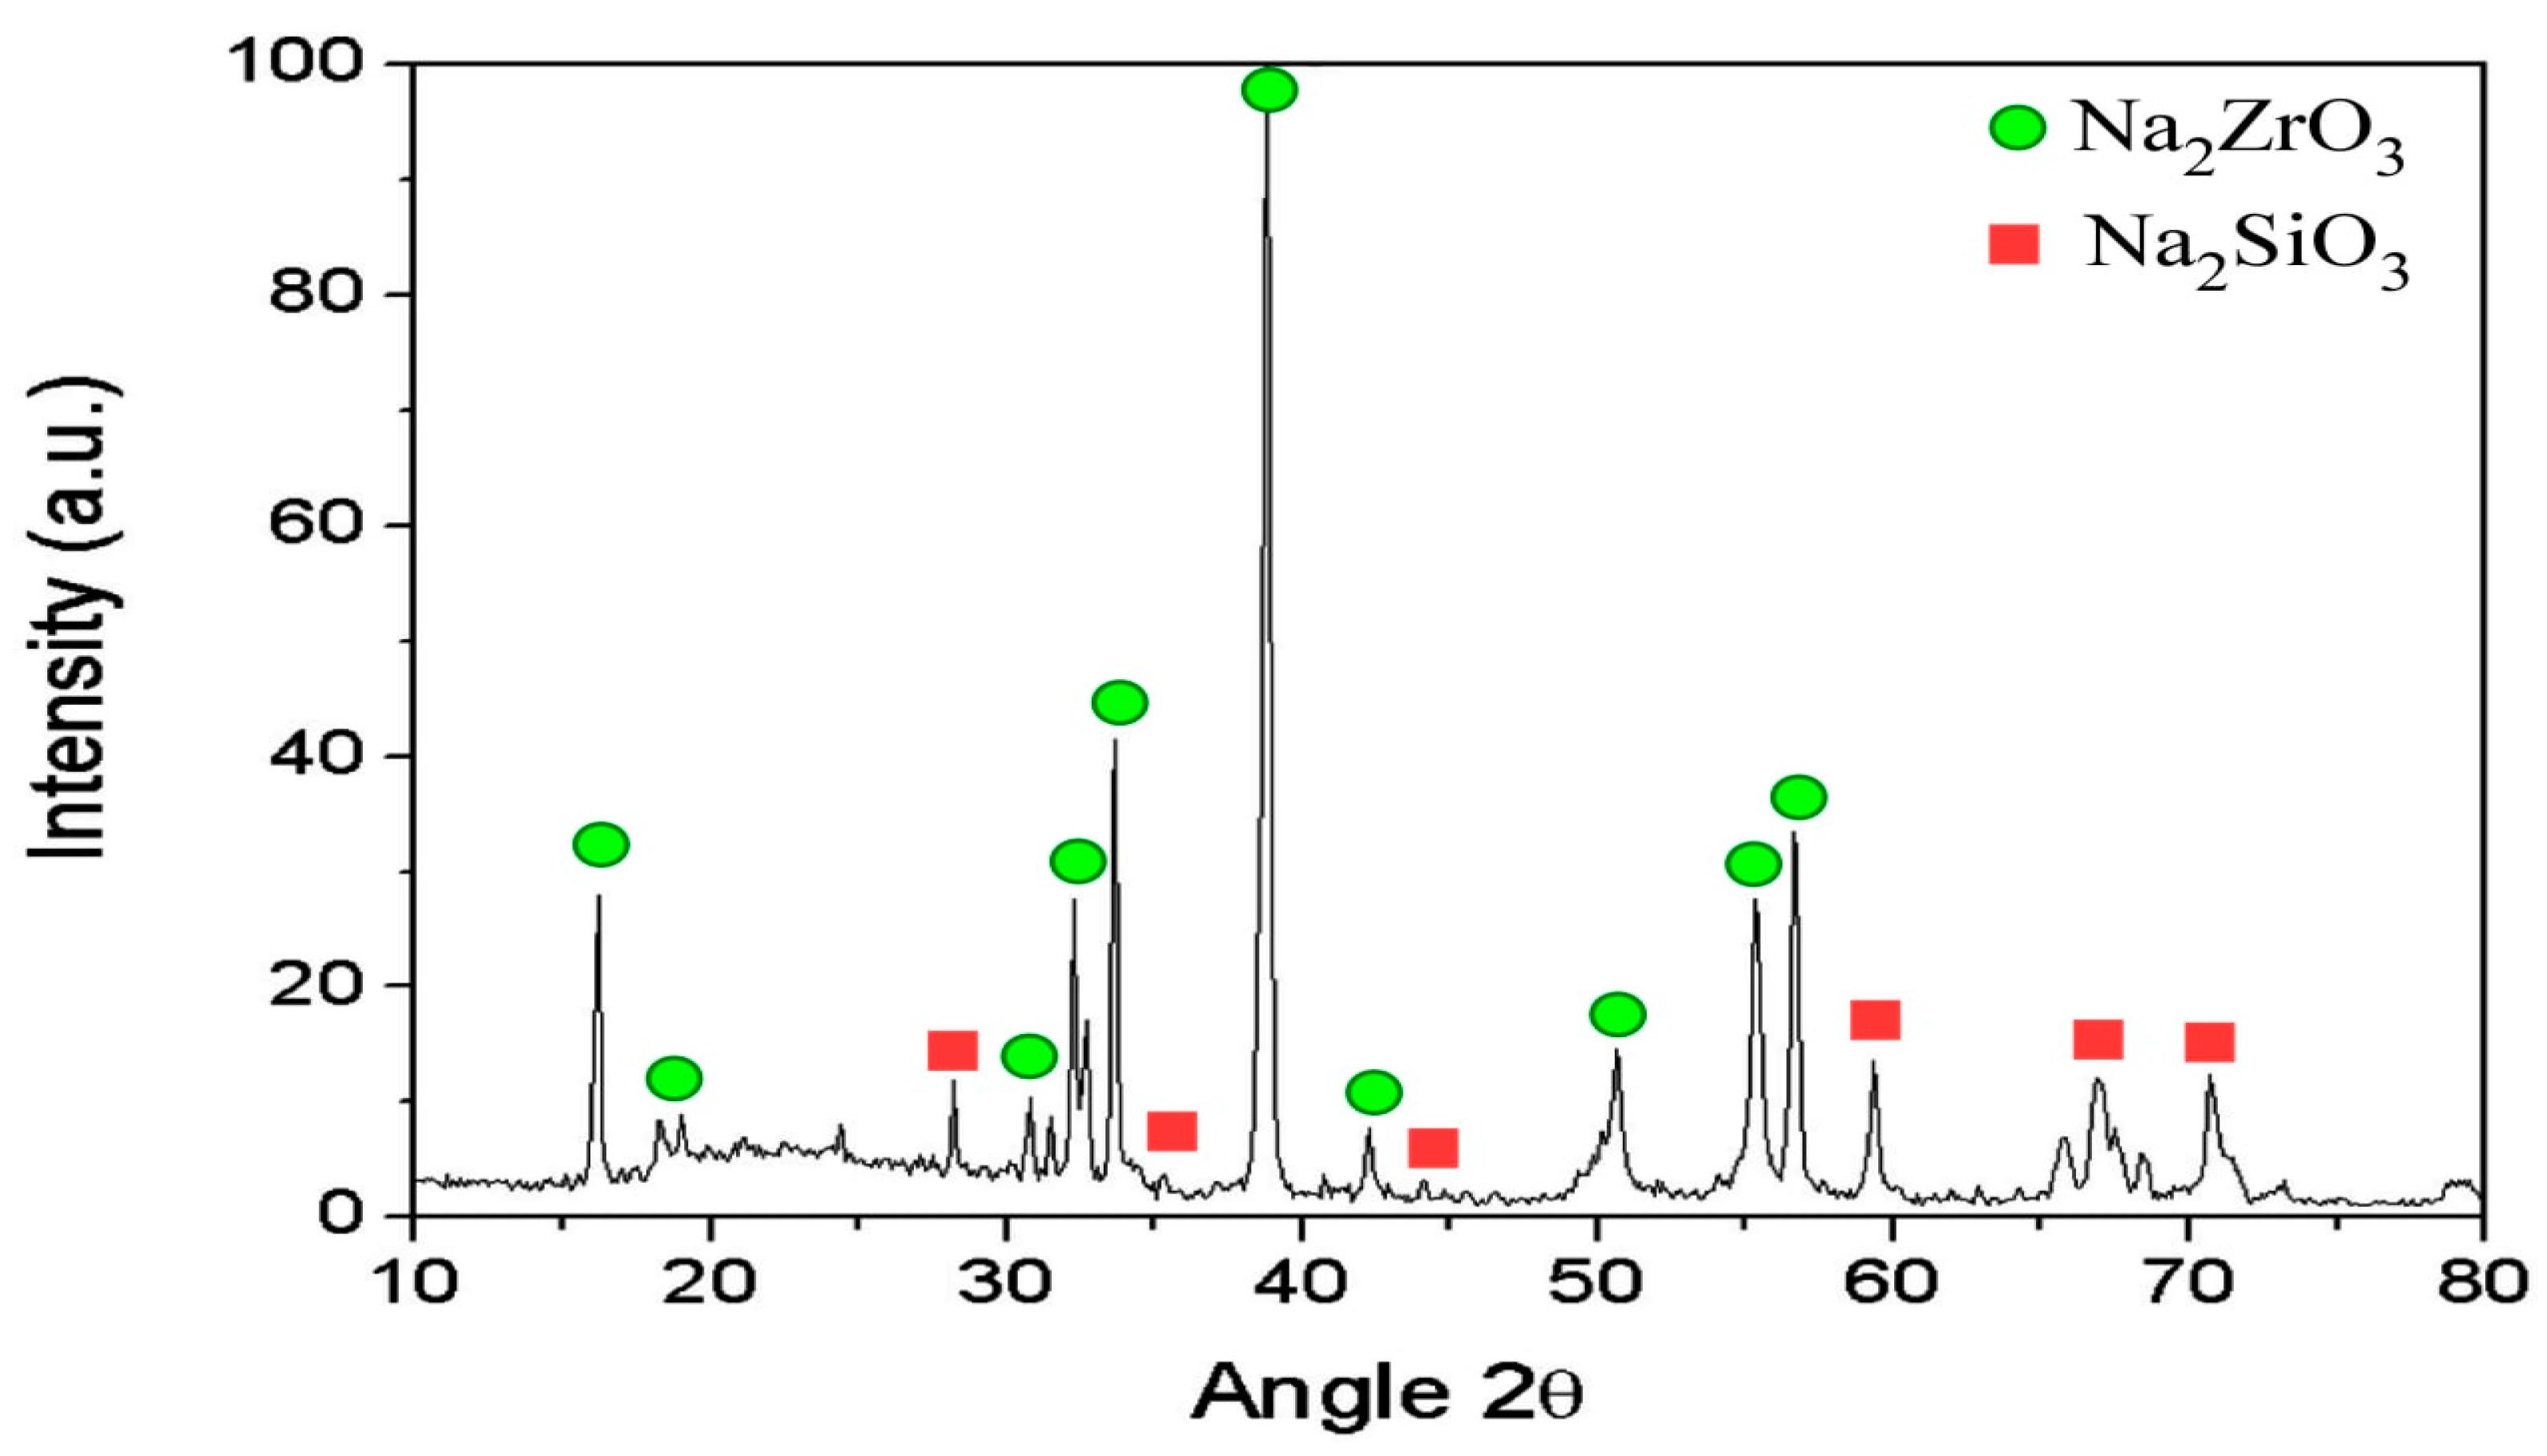
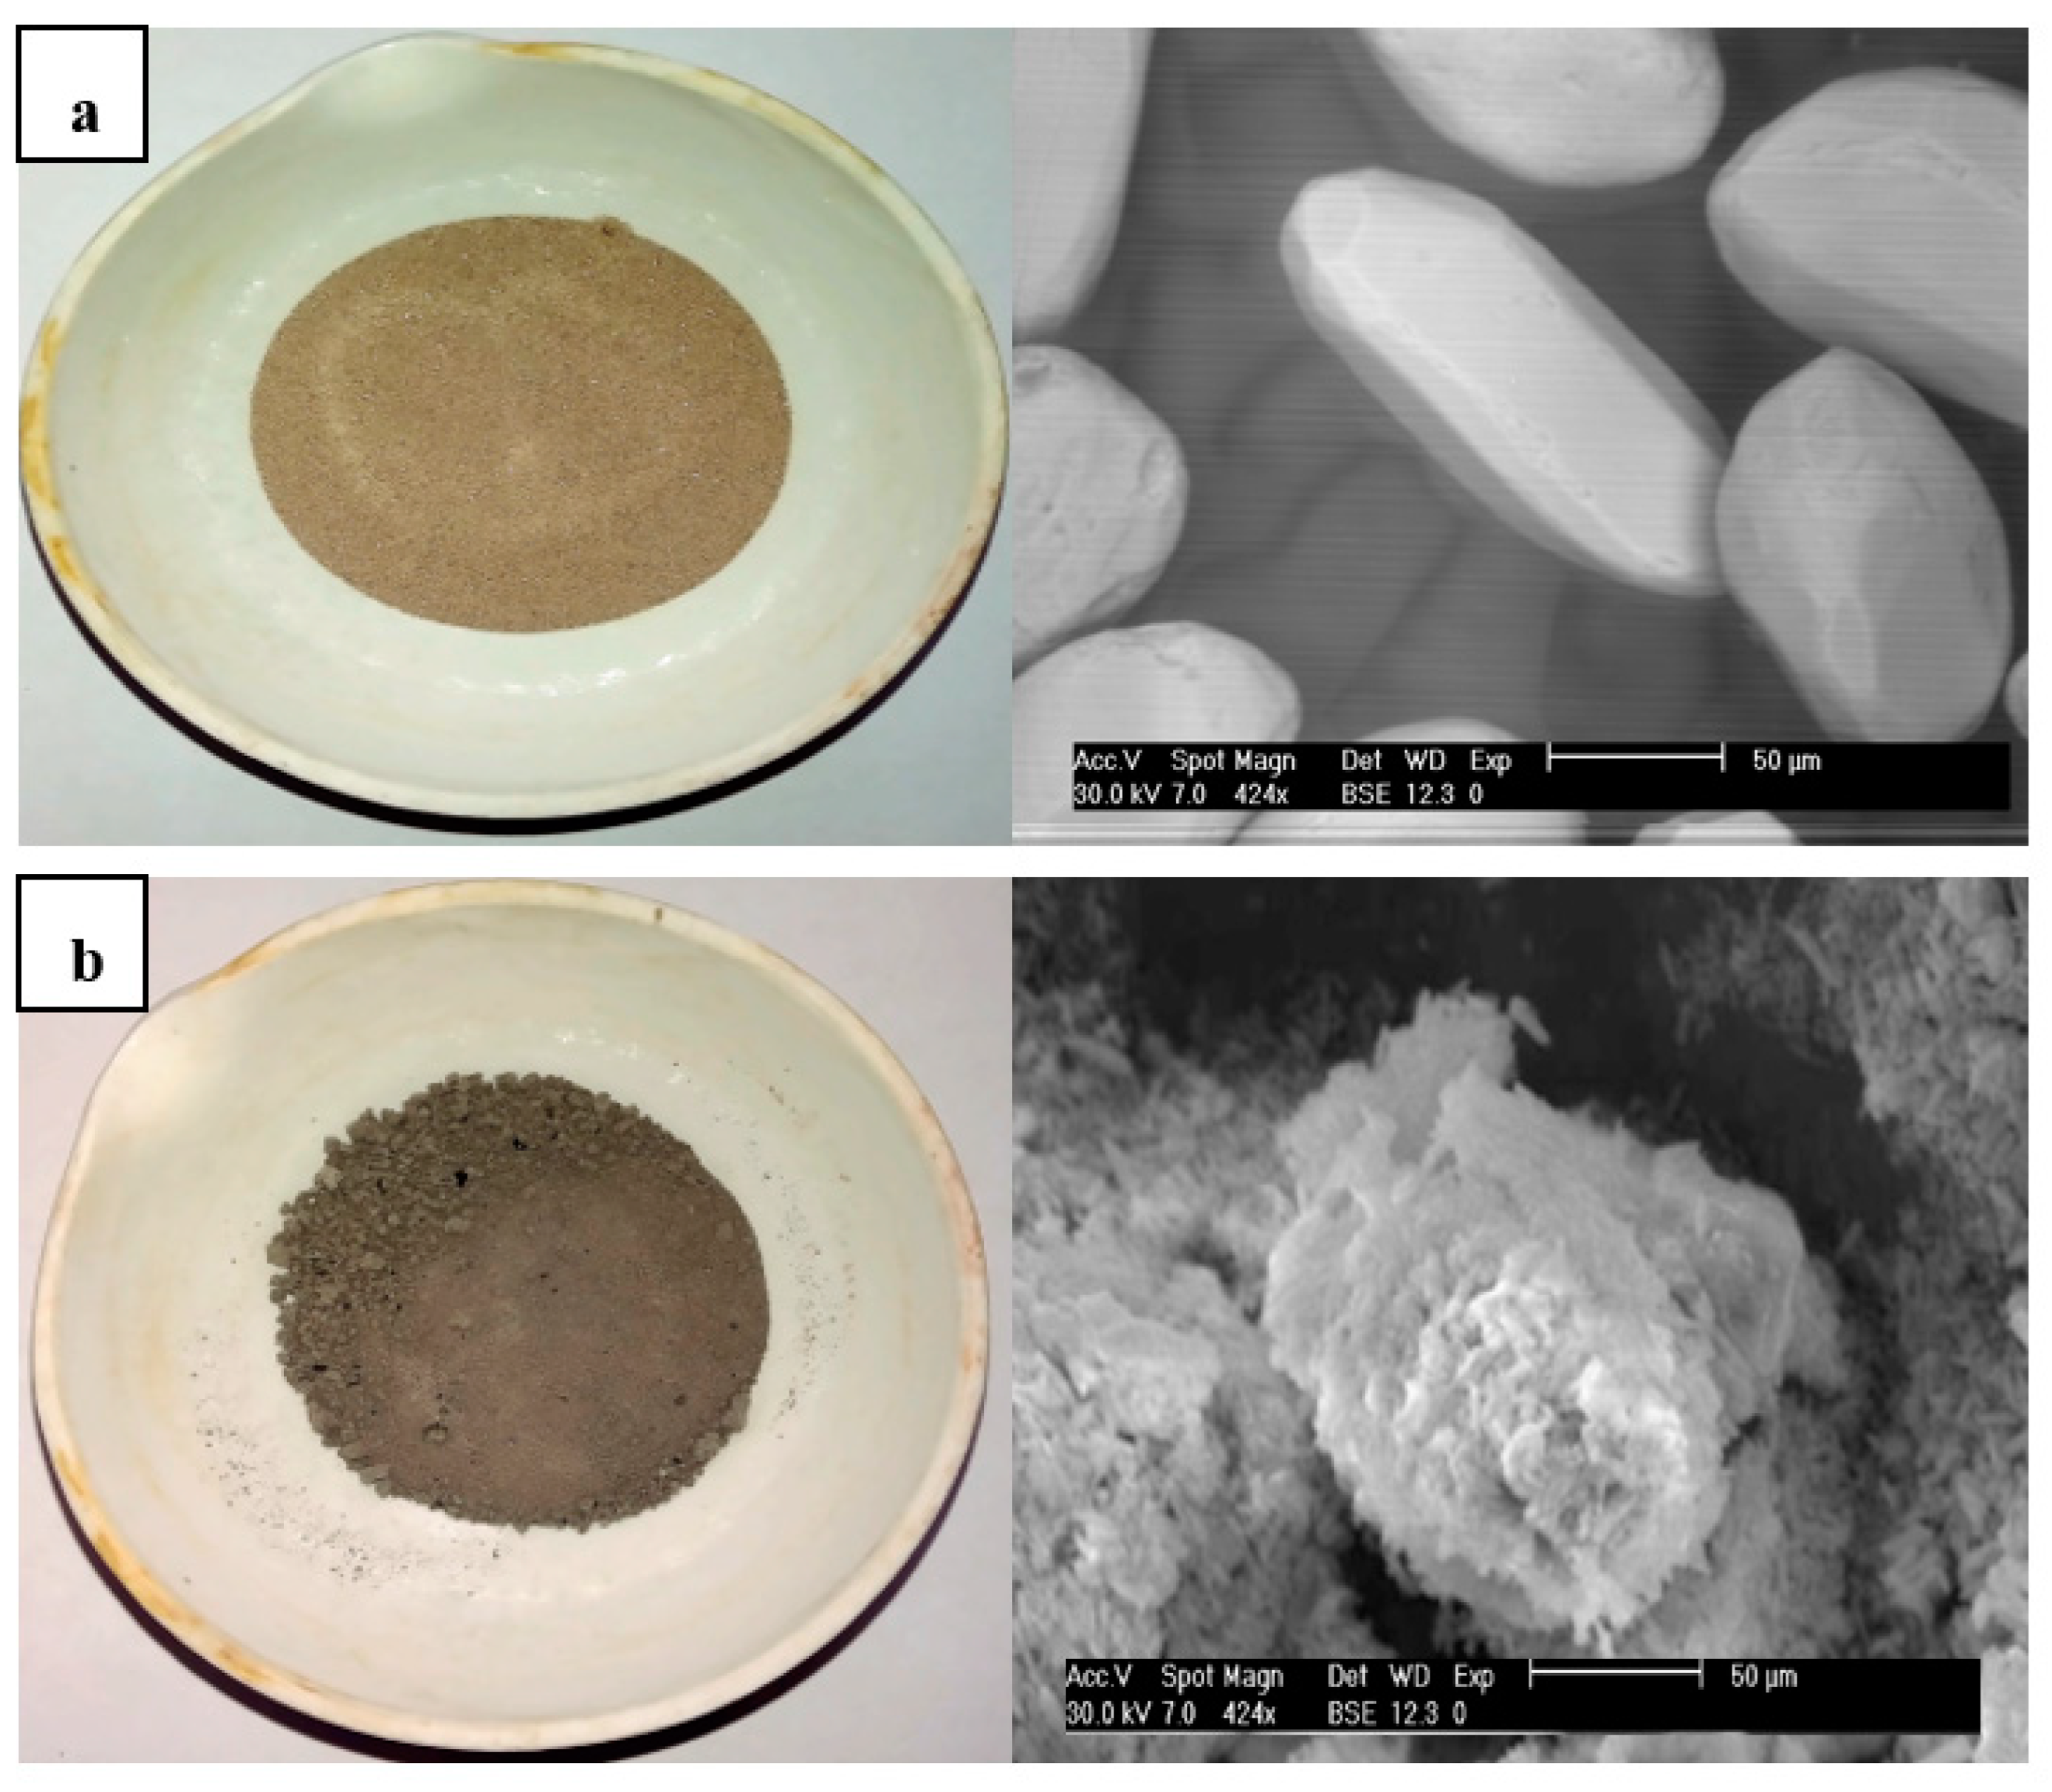
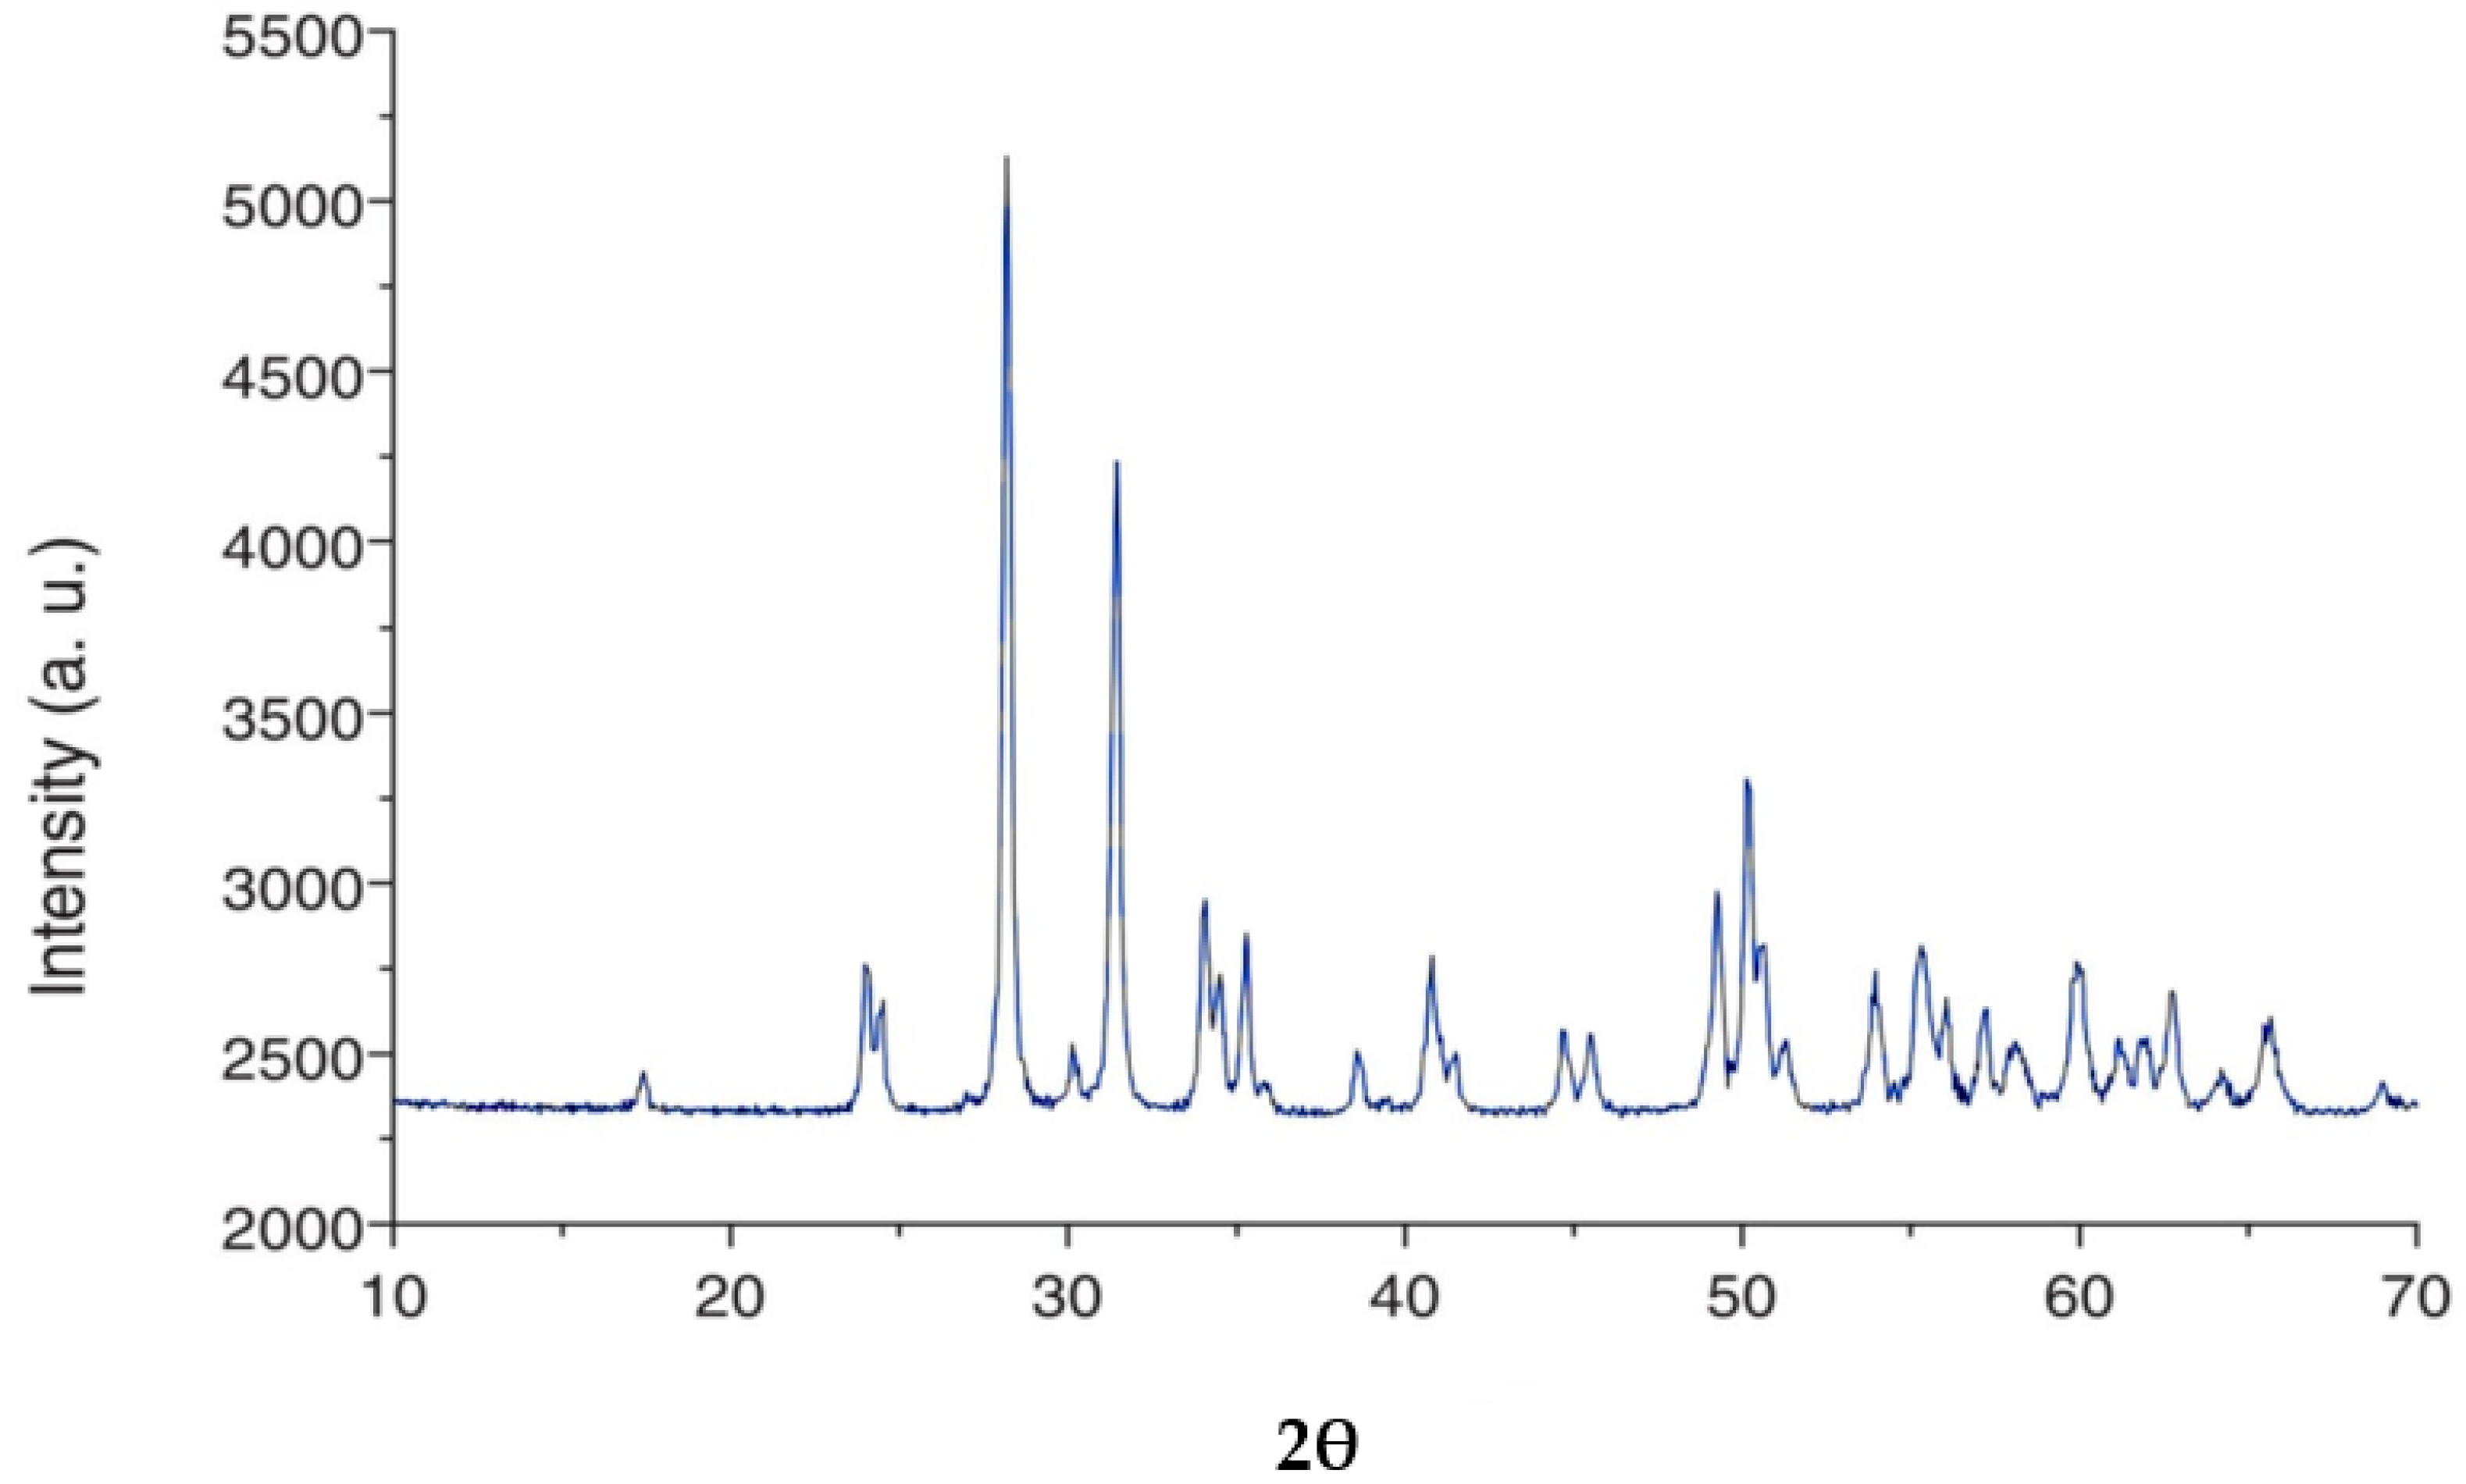
3.3.9. Characterization and Mineralogy of Zircon Concentrate Sample

The mineralogical constituents of the Egyptian black sands include two main groups: the gangue group, which is represented mainly by quartz, feldspars, amphiboles, pyroxenes, epidote, micas, etc., and the economic minerals group. The latter group comprises ilmenite and its alteration product leucoxene, magnetite, garnet, Zircon, rutile and monazite, together with other rare economic minerals such as cassiterite, thorite, uranothorite, xenotime and many other elements such as gold, silver, copper, lead, platinum, etc. As an accessory mineral (1 wt% of the total mass of the rock), Zircon (zirconium silicate, ZrSiO4) can be found in the majority of igneous rocks and some metamorphic rocks. In addition to being a component of artificial and natural beach sand, its great hardness means that it is also present as alluvial grains in some sedimentary rocks. Different zircon grains include euhedral crystals (short or long prismatic bipyramidal crystals, octahedral crystals, rhombic dodecahedron crystals) and irregular, spherical, ovoid and elongated grains. The mineral breaks with a conchoidal fracture, and there is no clear cleavage. It comes in a wide range of colors, including clear, red, brown, yellow, grey, pink and green. About 85 weight percent of zircon concentration is made up of colorless Zircon. About 10% of the weight comprises zircon grains ranging in color from yellowish to dark, while the remaining 5% is made up of orange, red, brown, pink and green zircon variations. Figure 11 shows the location of various black sand deposits along the Egyptian coast’s northern coast.
In thin sections, zircon grains exhibit a color range from colorless to pale brown. They also exhibit a number of optical properties unique to the mineral. It shows itself as low pleochroism, high relief, acute extinction and considerable birefringence. Metamict Zircon has cracks and inclusions. It has been discovered that certain zircon grains are zonal and even twinned. Zircon forms in the tetragonal system and is optically positive. Grain impurities of minerals such as rutile, monazite, garnet, hornblende, quartz, epidote and others are often found in Zircon.
The chemical and mineralogical structure of the concentrate of Zircon is tabulated in Table S3. It was detected that the zircon content of the concentrate is approximately 90%, and the remainder is 10%, including the associated mineral impurities after the upgrading process (physical separation), using shaking tables and magnetic separation to obtain high-grade zircon sand with a ZrO2 content of 60.02%, an SiO2 content of 37%, an HfO2 content of 1.33% and remaining impurities of 1.48%. The XRD proof of identity based upon Figure 12 illustrates that Egyptian zircon concentrate contains Zircon in the form of zirconium silicate (ZrSiO4) with reference code ICDD 01-075-1590, rutile (TiO2), with reference code ICSD 98-006-9331, and silica (SiO2), with reference code ICDD 01-083-2471. It was indicated by the highest intensity of Zircon (ZrSiO4). The highest compound of zircon concentrate was zirconium silicate (ZrSiO4), which demonstrates that it mainly consists of ZrSiO4. The SEM-EDX pattern of Egyptian Zircon sand is shown in Figure 13.

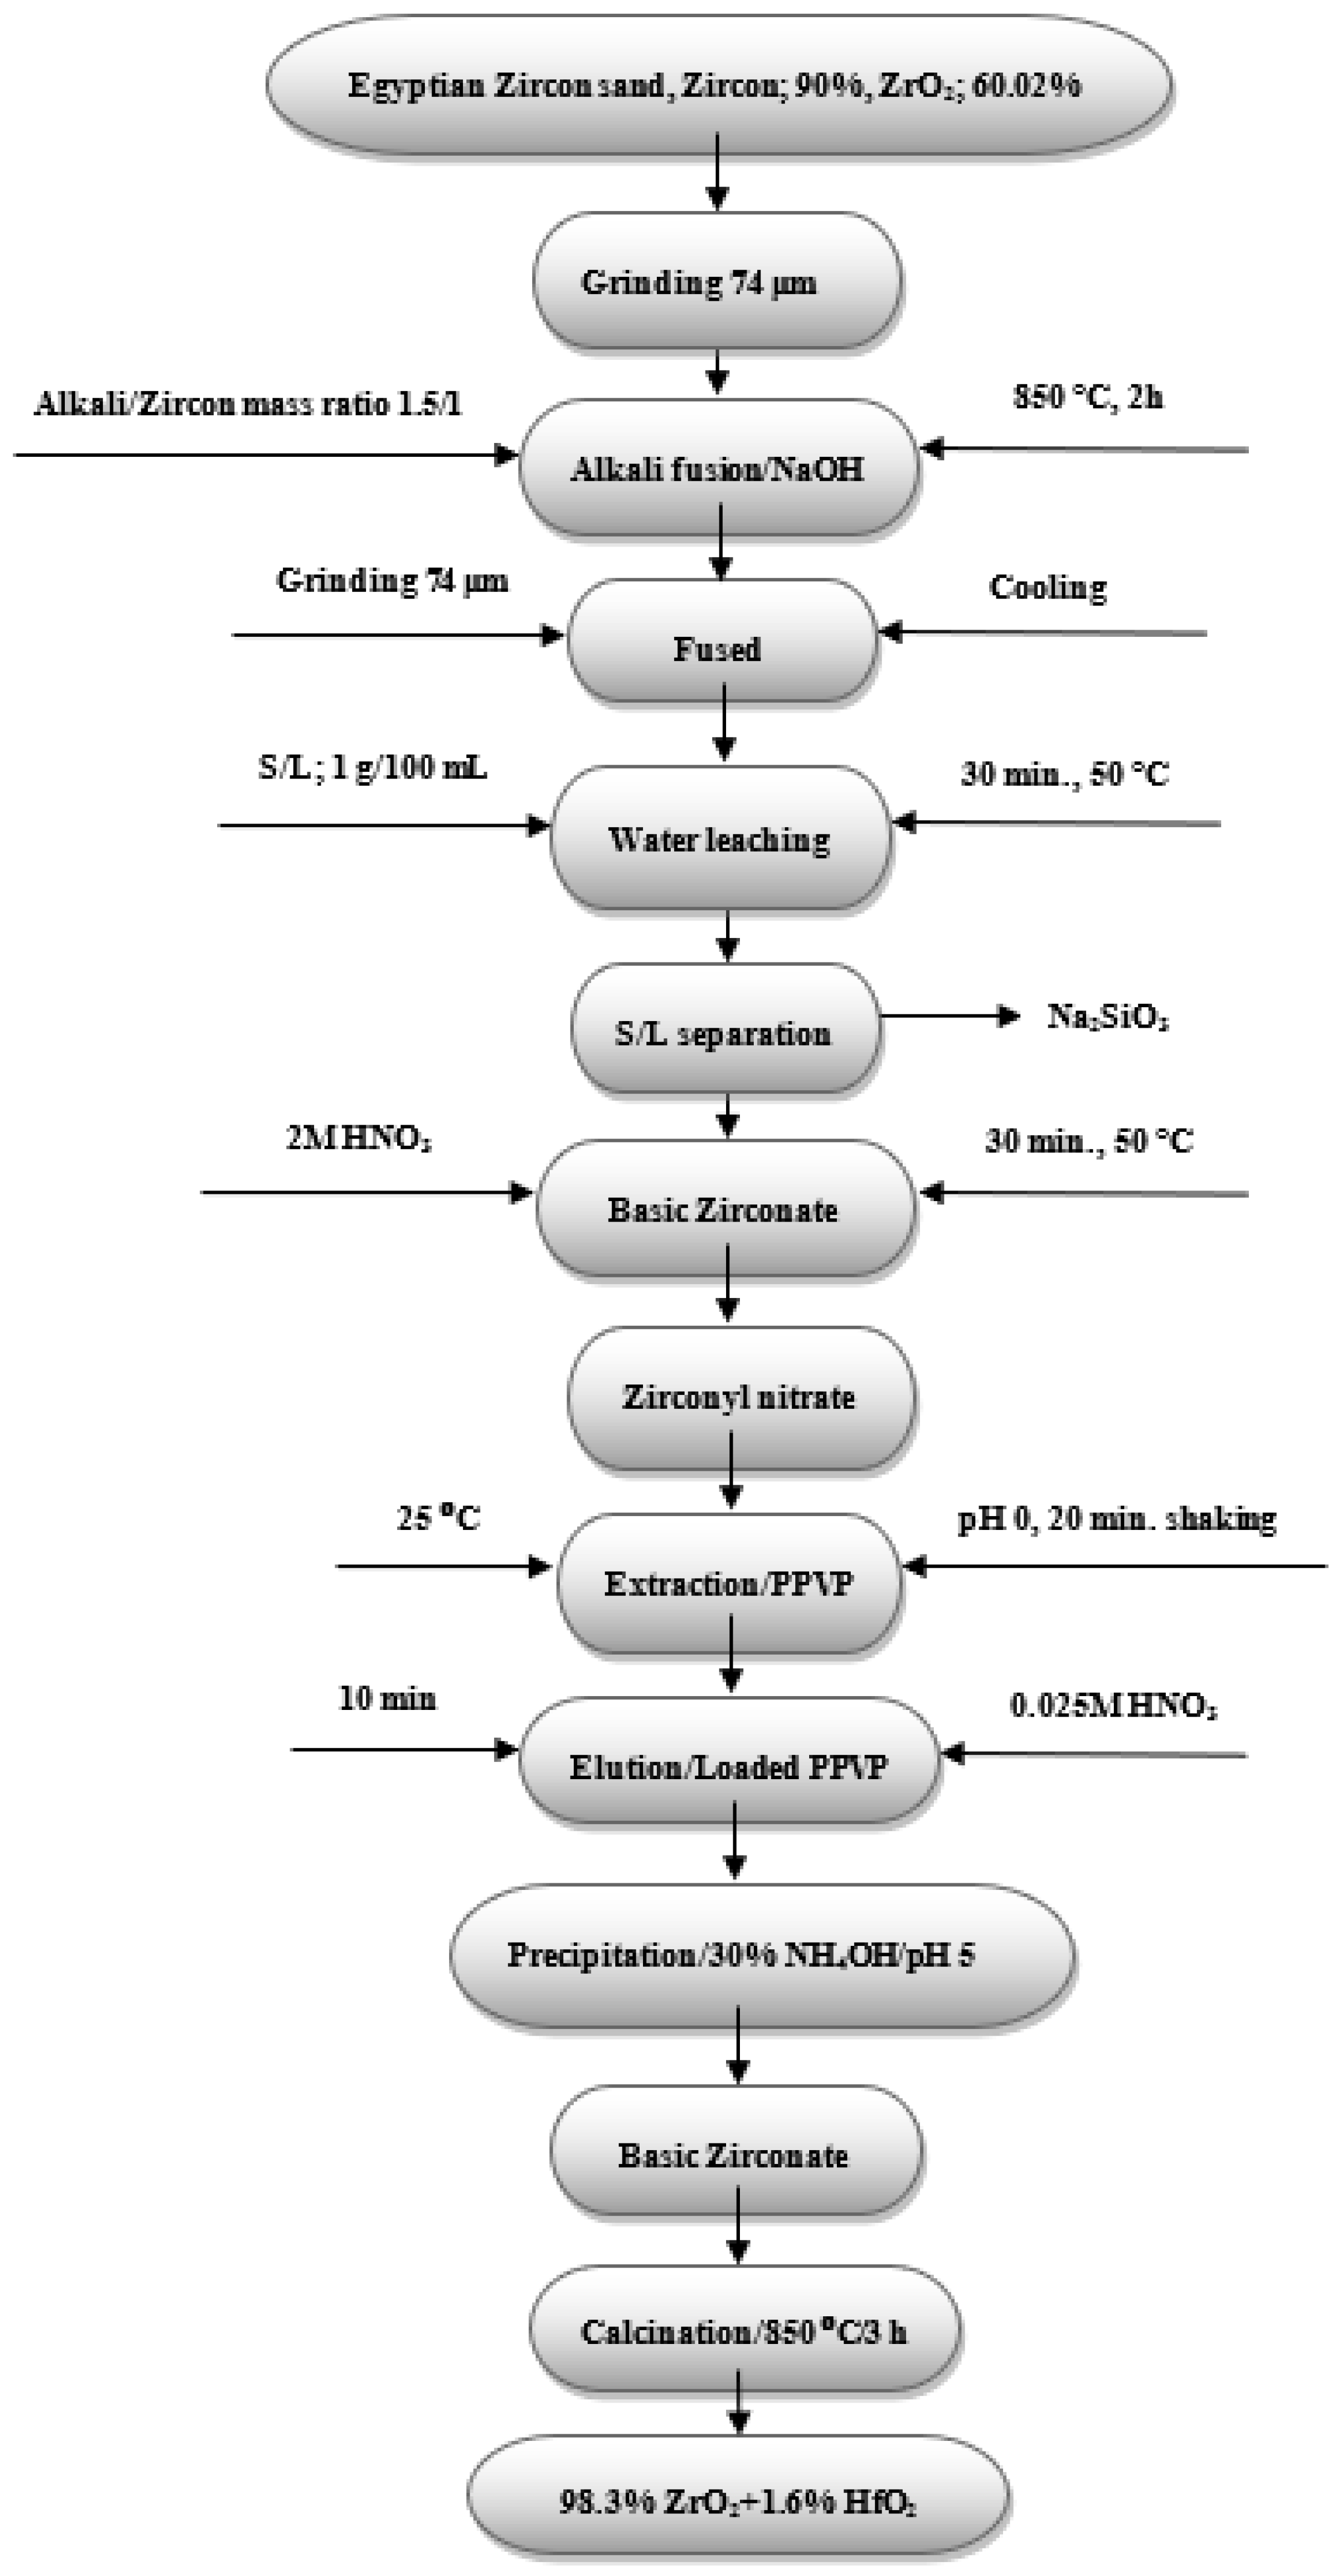
3.3.10. Dissolution of Zircon Sand

Alkali fusion leaching technology uses sodium hydroxide flux to liberate Zirconium from Egyptian zircon sand as sodium zirconate, followed by water leaching. First, zircon sand was grinded and sieved to a 74 μm grain size. The fusion process was optimized through 2 h of fusion time in an electric oven using NaOH flux with an alkali/zircon mass ratio of 1.5/1 of the stoichiometric amount of zircon sand at 850 °C. After the alkali fusion step and cooling, the resulting fused product was grinded and sieved to a 74 μm grain size and then subjected to water leaching at 50 °C for 30 min., with a solid-to-liquid phase ratio of 1 g/100 mL. After water leaching, basic zirconate precipitate is formed, which is filtered off. The water leaching step is very crucial, as soluble sodium silicate and many impurities could be disposed. After solid/liquid separation, a small amount of the basic zirconate precipitate is calcined for analysis at 850 °C to form zirconia with a chemical composition of: ZrO2: 96.8%, HfO2: 1.55%, Al2O3: 0.42%, Fe2O3: 0.11%, SiO2: 0.63%, CaO: 0.2%, MgO: 0.01%, Na2O: 0.11%, TiO2: 0.11% and RE2O3: 0.02%. The basic zirconate precipitate formed was collected and subjected to solubilization in 2 mol/L nitric acid at 50 °C for 30 min. to form soluble zirconyl nitrate solution, which could be extracted by PPVP. Alkali fusion technology’s efficiency of zirconium leaching was found to attain 99% with the latter optimized leaching factors. The mechanism of zircon alkali fusion followed by water leaching is illustrated through the following equations [7]:
Z r S i O 4 + 2 N a O H N a 2 Z r S i O 5 + H 2 O
Z r S i O 4 + 4 N a O H N a 2 Z r O 3 + N a 2 S i O 3 + 2 H 2 O
Z r S i O 4 + 6 N a O H N a 2 Z r O 3 + N a 4 S i O 4 + 3 H 2 O
N a 2 Z r O 3 + 2 H 2 O Z r O ( O H ) 2 + 2 N a O H
It was found that sodium zirconium silicate could only be formed in the case of the deficiency of the sodium hydroxide flux, but on the contrary, a 1.5/1 alkali/zircon mass ratio was found to be efficient for the consumption of zirconium silicate and the formation of sodium silicate, which is soluble in water, and a predominant sodium zirconate, which is hydrolyzed to a basic zirconate precipitate [12]. The XRD of the fused product is illustrated in Figure 14.
Visually, the transition from brown to dark-grey in the zircon concentration before and after alkali fusion demonstrates the intense caustic environment. The underlying visual structure became more permeable and brittle. The fusion product is very friable and caustic and has a porous structure. ZrSiO4 crystals with the maximum intensity are seen when they develop in zircon concentrates, as seen in Figure 14. Figure 15 is a scanning electron micrograph showing how the zircon concentrate’s prismatic crystals transformed into an asymmetrical and porous structure during the alkali fusion process. Zircon particles underwent a solid–liquid interaction with the molten NaOH during the alkali fusion process. The crystalline zircon concentration was destroyed due to a solid–liquid interaction produced by molten NaOH [14].

3.3.11. Application: Zirconium Recovery from Egyptian Zircon sand Using PPVP Composite

The latter optimized data make it possible to use PPVP composite to extract zirconium ions from nitrate liquor. Consequently, it was examined for this reason on the before-prepared leach liquor from the later-prepared zirconia (ZrO2; 96.8%) to get rid of many impurities and to prepare high-purity zirconia. The practical experiment has been realized under the earlier-determined best controlling factors (pH: 0, shaking time: 20 min., temp.: 25 °C, 2M HNO3) by shaking 1L of the leach liquor (1.3 g of 96.8% ZrO2 ≈ 1000 mg/L Zr) with 20 g of PPVP. The extraction experiment was replicated until PPVP saturation. The attained data have shown that PPVP has achieved 98% zirconium ions extraction efficiency. Additionally, it has also been confirmed that the extracted zirconium ions upon PPVP can be simply eluted by 250 mL of 0.025M HNO3 within 10 min. The eluted zirconium solution is adjusted to pH 5 by 30% NH4OH to obtain the basic zirconate precipitate, which was filtered and calcined at 850 °C for 3 h to obtain highly pure zirconia with a minimum number of impurities. The main chemical composition of the highly pure zirconia was registered as ZrO2: 98.3% and HfO2: 1.6% and a very low concentration of impurities on the ppm scale.
To assess the zirconium content and the associated metal ion impurities, the zirconia concentrate is characterized using XRD and ICP-OES analysis. The results are shown in both Figure 16 and Table S4. From the obtained data, it can be determined that the zirconium content in the zirconia concentrate produced by PPVP is 72.77%, attaining a purity of 98.29%. Figure 17 presents a schematic flow chart that clarifies Zirconium’s recovery from Egyptian zircon sand.

4. Conclusions

A productive synthesis of partially phosphorylated polyvinyl phosphate derivative (PPVP) composite is presented, which is applicable to zirconium ions extraction from Egyptian Zircon sand. Characterizations were conducted, successfully using numerous practice tools such as FT-IR, XPS, BET, EDX, TGA, 1H-NMR, 13C-NMR, GC-MS, XRD and ICP-OES. The batch extraction technique was optimized by an adequate volume of 50 mL solution assessing 500 mg/L zirconium ions, agitated with 0.1 g PPVP at pH 0 for 20 min. at ambient temp. According to these optimum controlling factors, PPVP achieved the greatest uptake of 195 mg/g at 25 °C from an economic point of view. Linear regression analysis (slope analysis) comprising the plot of log D against pH gives a straight line with a slope of −0.56, which specifies that no hydrogen ions were released in the solution, which means that the resembling solvating mechanism governs the extraction process rather than the cation exchange mechanism. The stability constant (β) of the PPVP-Zr complex was calculated at pH 0–1 (log β = 0.3645), and it was found to be equal to 2.314. Additionally, the slope analysis indicates that nearly one nitrate ion is bonded to PPVP-Zr. The collected kinetic modeling data fit with the pseudo-second-order kinetic model, which better explains the concerning extraction operation with a theoretical uptake equal to 204.08 mg/g, which is quite close to the experimental value of 195 mg/g. In distribution isotherm modeling, the Langmuir isotherm model is better suited to comprehend the retention mechanism, giving an uptake value of 204.06 mg/g, which is also closest to the practical one. Thermodynamic profiles reveal that the extraction process was predicted as an exothermic, spontaneous and advantageous extraction at low temperatures; the thermodynamic parameters ΔS (−0.03 kJ/mol), ΔH (−12.22 kJ/mol) and ΔG were also considered. As the temperature rises, ∆G values rise from −2.948 kJ/mol at 298 K to −1.941 kJ/mol at 338 K. Zirconium ions could be eluted from the loaded PPVP by 0.025M HNO3 with a 99% efficiency. It was found that zirconium ions reveal a good separation factor (S.F.) towards some co-ions such as Na+, K+, Si4+, Al3+, Ca2+ and Mg2+, but elements such as Hf4+ (28.82), Fe3+ (10.64), Ti4+ (28.82), V5+ (86.46) and U6+ (68.17) can somewhat interfere. A successful Alkali fusion technique with NaOH flux followed by the extraction with PPVP is used to obtain a high-purity zirconia concentrate with a zircon content of 72.77% and a purity of 98.29%.

Supplementary Materials

The following supporting information can be downloaded at: https://www.mdpi.com/article/10.3390/separations9110382/s1, Figure S1: SEM-EDX of (a) PVA (b) PPVA (c) PPVP (d) PPVP-Zr after chelation; Figure S2: Speciation diagram for zirconium ions in nitrate medium at different pH using HYDRA-MEDUSA software; Figure S3: (a)The effect of nitrate ions concentration, on zirconium uptake by PPVP (b) The slope regression analysis diagram for zirconium ions uptake by PPVP at different nitrate ions concentration (conditions: V: 50 mL, Zr concentration: 500 mg/L, m: 0.1 g, T: 25ºC, shaking time: 20 min.); Table S1: Thermal properties of PVA, PPVA, PPVP and PPVP-Zr samples; Table S2: The thermodynamic indices of zirconium ions extraction upon PPVP; Table S3: Mineralogical and chemical composition of zircon concentrate after physical separation; Table S4: ICP-OES characterization of highly pure zirconia concentrate produced by PPVP.

Author Contributions

Conceptualization, A.E. and E.M.E.-S.; Data curation, H.M.H.Z., A.R.S. and M.A.G.; Formal analysis, H.A.A., E.M.E.-S. and H.A.I.; Funding acquisition, A.E.; Investigation, A.R.S., A.A.G., A.A.A. and E.M.E.-S.; Methodology, A.A.G., K.F.A., S.A.M.I., S.A.Z. and M.A.G.; Project administration, A.A.G. and S.A.Z.; Resources, K.F.A. and A.A.A.; Software, H.M.H.Z.; Supervision, H.M.H.Z.; Validation, K.A.; Visualization, A.E., K.A. and B.M.A.; Writing—original draft, A.R.S., K.A., A.E., H.A.A. and H.A.I.; Writing—review & editing, A.E., H.M.H.Z., S.A.M.I., S.A.Z., E.M.E.-S. and B.M.A. All authors have read and agreed to the published version of the manuscript.

Funding

The authors acknowledge the support of Dunarea de Jos University of Galati, Romania, through the grant no. RF 3621/2021.

Institutional Review Board Statement

Not applicable.

Informed Consent Statement

Not applicable.

Data Availability Statement

All data in the manuscript.

Conflicts of Interest

The authors declare no conflict of interest.

References

  1. Patnaik, P. Handbook of Inorganic Chemicals; McGraw-Hill Companies, Inc.: New York, NY, USA, 2003; p. 1086. ISBN 0-07-049439-8. [Google Scholar]
  2. Taftazani, A.; Rozana, K.; Djati, F.K. Synthesis and characterization of TENORM-free nano zirconia from zircon sand. J. Indian Chem. Soc. 2022, 99, 100678. [Google Scholar] [CrossRef]
  3. Samin, H.P.; Kharistya, R.S. The processing and validation of zircon sand concentrate process into zircon opacifier. AIP Conf. Proc. 2020, 2296, 020073. [Google Scholar] [CrossRef]
  4. Nur, S.A.; Axl, B.G.V.; Nur, A.F.; Suminar, P. Synthesis of a high-purity zircon powder with variations of HCI concentration and heating temperature. AIP Conf. Proc. 2020, 2296, 020124. [Google Scholar] [CrossRef]
  5. Ali, A.H. Production of highly purified zirconium oxide from zircon mineral leach liquor using bis-(2-ethylhexyl) phosphate as a promising extractant. Chem. Pap. 2022, 76, 6723–6734. [Google Scholar] [CrossRef]
  6. Taghizadeh, M.; Ghasemzadeh, R.; Ashrafizadeh, S.N.; Saberyan, K.; Ghannadi, M.M. Selective zirconium stripping of a loaded CYANEX-272 using Taguchi orthogonal array design. Miner. Eng. 2007, 20, 1401–1403. [Google Scholar] [CrossRef]
  7. Song, J.; Fan, J.F.; Liu, J.C.; Liu, R.; Qu, J.K.; Qi, T. A two-step zircon decomposition method to produce zirconium oxychloride: Alkali fusion and water leaching. Rare Met. 2020, 39, 448–454. [Google Scholar] [CrossRef]
  8. Xu, L.; Xiao, Y.; Sandwijk, A.V.; Xu, Q.; Yang, Y. Production of nuclear grade zirconium: A review. J. Nucl. Mater. 2015, 466, 21–28. [Google Scholar] [CrossRef]
  9. Bidaye, A.C.; Venkatachalam, S.; Gupta, C.K. Kinetic studies on the chlorination of Zircon, High Temp. Mater. Process. 2002, 21, 1–10. [Google Scholar] [CrossRef]
  10. Bidaye, A.C.; Venkatachalam, S.; Gupta, C.K. Studies on the chlorination of Zircon: Part I static bed investigation, Metall. Mater. Trans. B 1999, 30, 205–213. [Google Scholar] [CrossRef]
  11. Donald, V. Zirconium Chlorination Behavior: A Literature Review. In EPD Congress 2011; John Wiley & Sons, Inc.: Hoboken, NJ, USA, 2011. [Google Scholar] [CrossRef]
  12. Abdel-Rehim, A.M. A new technique for extracting Zirconium form Egyptian zircon concentrate. Int. J. Miner. Process. 2005, 76, 234–243. [Google Scholar] [CrossRef]
  13. Biswas, R.K.; Habib, M.A.; Karmakar, A.K.; Islam, M.R. A novel method for processing of Bangladeshi Zircon: Part I: Baking, and fusion with NaOH. Hydrometallurgy 2010, 103, 124–129. [Google Scholar] [CrossRef]
  14. Da Silva, R.J.F.; Dutra, A.J.B.; Afonso, J.C. Alkali fusion followed by a two-step leaching of brazilian zircon concentrate. Hydrometallurgy 2012, 117, 93–100. [Google Scholar] [CrossRef]
  15. Abdelkader, A.M.; Daher, A.; El-Kashef, E. Novel decomposition method for zircon. J. Alloys Compd. 2008, 460, 577–580. [Google Scholar] [CrossRef]
  16. Ozel, E.; Turan, S. Production of colored zircon pigments from Zircon. J. Eur. Ceram. Soc. 2007, 27, 1751–1757. [Google Scholar] [CrossRef]
  17. Zhang, J.; Wang, L.; Jiang, D. Decomposition process of zircon sand concentrate with CaO-NaOH. Rare Met. 2012, 31, 410–414. [Google Scholar] [CrossRef]
  18. El-Barawy, K.A.; El-Tawil, S.Z.; Francis, A.A. Production of zirconia from Zircon by thermal reaction with calcium oxide. J. Ceram. Soc. Jpn. 1999, 107, 97–102. [Google Scholar] [CrossRef] [Green Version]
  19. El-Tawil, S.Z.; El-Barawy, K.A.; Francis, A.A. Cubic zirconia from zircon sand by firing with CaO/MgO mixture. J. Ceram. Soc. Jpn. 1999, 107, 193–198. [Google Scholar] [CrossRef] [Green Version]
  20. Welham, N.J. New route for the extraction of crude zirconia from Zircon. J. Am Ceram. Soc. 2002, 85, 2217–2221. [Google Scholar] [CrossRef]
  21. Kostic, Z.G.; Stefanovic, P.L.; Pavlovic, P.B.; Pavlovic, Z.N.; Živkovic, N.V. Optimal thermal plasma processes for zirconium carbide powder production from Zircon concentrates. Ceram Int. 2001, 27, 547–557. [Google Scholar] [CrossRef]
  22. Yuhelda, D.A.; Enggan, P.N. Processing zirconia through zircon sand smelting with NaOH as a flux. Indones. Min. J. 2016, 19, 39–49. [Google Scholar] [CrossRef] [Green Version]
  23. Aziz, I.A.; Jalhom, M.G.; Kheriallah, M.A. Extraction of Zirconium From Iraqi Bauxite Ore. Eng. Technol. J. 2020, 38, 1421–1429. [Google Scholar] [CrossRef]
  24. Yustanti, E.; Ode, F.A.F.; Sulistiyono, E. Primary study of KOH alkali fusion—Nitric acid leaching process in extraction of West Kalimantan zircon concentrate. IOP Conf. Ser. Mater. Sci. Eng. 2020, 763, 012065. [Google Scholar] [CrossRef]
  25. Ma, Y.; Stopic, S.; Wang, X.; Forsberg, K.; Friedrich, B. Basic Sulfate Precipitation of Zirconium from Sulfuric Acid Leach Solution. Metals 2020, 10, 1099. [Google Scholar] [CrossRef]
  26. Abd El-Hamid, A.M.; Zahran, M.A.; Khalid, F.M.; Mahmoud, A.H. Leaching of hafnium, Zirconium, uranium and other nuclear economic elements from petroleum ash. RSC Adv. 2014, 4, 12506–12513. [Google Scholar] [CrossRef]
  27. Atia, B.M.; Sakr, A.K.; Gado, M.A.; El-Gendy, H.S.; Abdelazeem, N.M.; El-Sheikh, E.M.; Hanfi, M.Y.; Sayyed, M.I.; Al-Otaibi, J.S.; Cheira, M.F. Synthesis of a New Chelating Iminophosphorane Derivative (Phosphazene) for U(VI) Recovery. Polymers 2022, 14, 1687. [Google Scholar] [CrossRef] [PubMed]
  28. Wang, L.Y.; Lee, M.S. A review on the aqueous chemistry of Zr(IV) and Hf(IV) and their separation by solvent extraction. J. Ind. Eng. Chem. 2016, 39, 1–9. [Google Scholar] [CrossRef]
  29. Banda, R.; Lee, M.S. Solvent Extraction for the Separation of Zr and Hf from Aqueous Solutions. Sep. Purif. Rev. 2015, 44, 199–215. [Google Scholar] [CrossRef]
  30. Janúbia, C.B.S.; Amaral, C.A.M. Equilibrium of Zirconium and hafnium in the process of extraction with TBP in nitric medium—Influence in the Zr/Hf separation. Miner. Eng. 2020, 146, 106138. [Google Scholar] [CrossRef]
  31. Amaral, J.C.; Souza, A.L.; Morais, C.A. Liquid–liquid separation of Zirconium and hafnium from nitric liquor in order to obtain nuclear zirconium oxide using TBP as extractant. Chem. Eng. Commun. 2020, 207, 73–83. [Google Scholar] [CrossRef]
  32. Amaral, J.C.B.; de Morais, C.A. Study of Zirconium and Hafnium Separation by Solvent Extraction Technique from Nitric and Hydrochloric Solutions with Acid, Basic and Neutral Extractants. World J. Eng. Technol. 2016, 4, 138–150. [Google Scholar] [CrossRef] [Green Version]
  33. Sadigzadeh, A.; Chehrenama, S.; Shokri, H. Solvent extraction of Zirconium from nitric-hydrochloric acid solutions using TBP. J. Theor. Appl. Phys. 2009, 3, 20–26. [Google Scholar]
  34. Taghizadeh, M.; Ghanadi, M.; Zolfonoun, E. Separation of Zirconium and hafnium by solvent extraction using mixture of TBP and cyanex 923. J. Nucl. Mater. 2011, 412, 334–337. [Google Scholar] [CrossRef]
  35. Taghizadeh, M.; Ghasemzadeh, R.; Ashrafizadeh, S.N.; Saberyan, K.; Maragheh, M.G. Determination of optimum process conditions for the extraction and separation of Zirconium and hafnium by solvent extraction. Hydrometallurgy 2008, 90, 115–120. [Google Scholar] [CrossRef]
  36. Wang, L.Y.; Lee, H.Y.; Lee, M.S. Solvent extraction of Zirconium and hafnium from hydrochloric acid solutions using acidic organophosphorus extractants and their mixtures with TOPO. Mater. Trans. 2013, 54, 1460–1466. [Google Scholar] [CrossRef] [Green Version]
  37. Pandey, G.; Mukhopadhyay, S.; Renjith, A.U.; Joshi, J.M.; Shenoy, K.T. Recovery of Hf and Zr from slurry waste of zirconium purification plant using solvent extraction. Hydrometallurgy 2016, 163, 61–68. [Google Scholar] [CrossRef]
  38. Yadollahi, A.; Saberyan, K.; Torab-Mostaedi, M.; Charkhi, A.; Pourjavid, M.R. Solvent extraction separation of Zirconium and hafnium from nitric acid solutions using mixture of Cyanex-272 and TBP. Radiochim. Acta 2018, 106, 675–684. [Google Scholar] [CrossRef]
  39. Xu, Z.; Wang, L.; Wu, M.; Xu, Y.; Chi, R.; Li, P.; Zhao, J. Separation of Zirconium and hafnium by solvent extraction using mixture of DIBK and P204. Hydrometallurgy 2015, 165, 275–281. [Google Scholar] [CrossRef]
  40. Biswas, R.K.; Hayat, M.A. Solvent extraction of Zirconium (IV) from chloride media by D2EHPA in kerosene. Hydrometallurgy 2002, 63, 149–158. [Google Scholar] [CrossRef]
  41. Juang, R.S.; Lo, R.H. Equilibrium studies of the extraction of Zirconium(IV) from sulfuric acid solutions with di(2-ethylhexyl)phosphoric acid. J. Chem. Technol. Biotechnol. 1993, 58, 261–269. [Google Scholar] [CrossRef]
  42. Reddy, B.R.; Kumar, J.R.; Raja, K.P.; Reddy, A.V. Solvent extraction of Hf(IV) from acidic chloride solutions using Cyanex 302. Miner. Eng. 2004, 17, 939–942. [Google Scholar] [CrossRef]
  43. Kumar, J.R.; Reddy, B.R.; Reddy, K.R.; Reddy, A.V. Liquid-liquid extraction of tetravalent hafnium from acidic chloride solutions using bis(2,4,-trimethylpentyl) dithiophosphonic acid (Cyanex 301). Sep. Sci. Technol. 2007, 42, 865–877. [Google Scholar] [CrossRef]
  44. Reddy, B.R.; Kumar, J.R.; Reddy, A.V. Solvent extraction of Zirconium (IV) from acidic chloride solutions using the thio-substituted organo-phosphorous acids Cyanex 301 and 302. J. Chem. Technol. Biotechnol. 2004, 79, 1301–1307. [Google Scholar] [CrossRef]
  45. Reddy, B.R.; Kumar, J.R.; Reddy, A.V. Solvent extraction of Zr(IV) from acid chloride solutions using LIX 84-IC. Hydrometallurgy 2004, 74, 173–177. [Google Scholar] [CrossRef]
  46. Reddy, B.R.; Kumar, J.R. Studies on liquid-liquid extraction of tetravalent hafnium from weakly hydrochloric acid solutions by LIX 84-IC. Sep. Purif. Technol. 2005, 42, 169–174. [Google Scholar] [CrossRef]
  47. Wang, L.Y.; Lee, M.S. Separation of Zirconium and hafnium from nitric acid solutions with LIX 63, PC 88A and their mixture by solvent extraction. Hydrometallurgy 2014, 150, 153–160. [Google Scholar] [CrossRef]
  48. Lee, H.W.; Kim, S.G.; Oh, J.K. Stoichiometric relation for extraction of Zirconium and hafnium from acidic chloride solutions with Versatic acid 10. Hydrometallurgy 2004, 73, 91–97. [Google Scholar] [CrossRef]
  49. El-Hefny, N.E.; El-Nadi, Y.A.; Daoud, J.A. Effect of diluents on the extraction of Zirconium from nitrate medium by thenoyltrifluoroacetone. Solvent Extr. Ion Exch. 2006, 24, 703–717. [Google Scholar] [CrossRef]
  50. Katsuta, S.; Yanagihara, H. Extraction of Zirconium(IV) and Hafnium(IV) with acetylacetone in the presence of 3,5-dichlorophenol: Remarkable hydrogen-bond acceptor ability of tetrakis (acetylacetanato) chelates. Solvent Extr. Ion Exch. 1997, 15, 577–589. [Google Scholar] [CrossRef]
  51. Saleh, A.S.H. Solvent extraction of Zr(IV) and Hf(IV) with N,N,N′,N′-tertraoctyldiglycolamide. J. Radioanal. Nucl. Chem. 2012, 292, 1109–1114. [Google Scholar] [CrossRef]
  52. Prathibha, T.; Suneesh, A.S.; Chandra, S.; Sriram, S.; Ramanathan, N. Selective removal of Zr (IV) from simulated High-Level liquid waste of metallic fuel reprocessing using hydroxyacetamide Extractant: Insights from solvent extraction and density functional theory computations. Polyhedron 2021, 208, 115410. [Google Scholar] [CrossRef]
  53. Rajmane, M.M.; Sargar, B.M.; Mahamuni, S.V.; Anuse, M.A. Solvent extraction separation of zirconium(IV) from succinate media with N-n-octylaniline. J. Serb. Chem. Soc. 2006, 71, 223–234. [Google Scholar] [CrossRef]
  54. Banda, R.; Lee, H.W.; Lee, M.S. Separation of Zr from Hf in hydrochloric acid solution using amine based extractants. Ind. Eng. Chem. Res. 2012, 51, 9652–9660. [Google Scholar] [CrossRef]
  55. Karve, M.A.; Khopkar, S.M. Application of liquid anion exchangers for the separation of Zirconium and Hafnium. Anal. Sci. 1992, 8, 237–241. [Google Scholar] [CrossRef] [Green Version]
  56. Vibhute, C.P.; Khopkar, S.M. Liquid/liquid extraction of separation of hafnium with Amberlite LA-1 from Zirconium and other elements in citric acid solutions. Anal. Chim. Acta 1987, 193, 387–392. [Google Scholar] [CrossRef]
  57. Mishra, P.K.; Chakravortty, V.; Dash, K.C.; Das, N.R.; Bhattacharyya, S.N. Extraction of Zirconium(IV) from HCl solutions by mixture Aliquat-336 and Alamine 336 with TBP. J. Radioanal. Nucl. Chem. 1989, 134, 259–264. [Google Scholar] [CrossRef]
  58. Mishra, P.K.; Chakravortty, V.; Dash, K.C.; Das, N.R.; Bhattacharyya, S.N. Solvent extractions of Zirconium and niobium from HCl solutions by Aliquat 336 and DOSO mixtures. J. Radioanal. Nucl. Chem. 1989, 131, 281–287. [Google Scholar] [CrossRef]
  59. Mishra, P.K.; Chakravortty, V.; Dash, K.C.; Das, N.R.; Bhattacharyya, S.N. Extraction and separation of Zr, Nb and Hf by Aliquat 336 and its mixture with TOPO from acidic thiocyanate media. J. Radioanal. Nucl. Chem. 1992, 162, 289–298. [Google Scholar] [CrossRef]
  60. Biswas, S.; Basu, S. Extraction of Zirconium(IV) from hydrochloric acid solutions by tri-octylamine and neutral donors. J. Radioanal. Nucl. Chem. 1999, 242, 253–258. [Google Scholar] [CrossRef]
  61. El-Yamani, I.S.; Farah, M.Y.; Abd El-Aleim, F.A. Co-extraction and separation of Zirconium and hafnium by long-chain amines from sulfate media. Talanta 1978, 25, 523–525. [Google Scholar] [CrossRef]
  62. Banda, R.; Lee, H.W.; Lee, M.S. Separation of Zr and Hf from strong hydrochloric acid solution by solvent extraction with TEHA. J. Radioanal. Nucl. Chem. 2013, 295, 1537–1543. [Google Scholar] [CrossRef]
  63. El-Yamani, I.S.; Farah, M.Y.; Abd El-Aleim, F.A. Studies on extraction of Zirconium by quaternary ammonium halides from hydrochloric acid media and its separation from hafnium. Talanta 1978, 25, 714–716. [Google Scholar] [CrossRef]
  64. Awada, H.; Daneault, C. Chemical Modification of Poly(Vinyl Alcohol) in Water. Appl. Sci. 2015, 5, 840–850. [Google Scholar] [CrossRef]
  65. Shi, R.; Bi, J.; Zhang, Z.; Zhu, A.; Chen, D.; Zhou, X.; Zhang, L.; Tian, W. The effect of citric acid on the structural properties and cytotoxicity of the polyvinyl alcohol/starch films when molding at high temperature. Carbohydr. Polym. 2008, 74, 763–770. [Google Scholar] [CrossRef]
  66. Rescignanoa, N.; Fortunati, E.; Montesano, S.; Emiliani, C.; Kenny, J.M.; Martino, S.; Armentano, I. PVA bio-nanocomposites: A new take-off using cellulose nanocrystals and PLGA nanoparticles. Carbohydr. Polym. 2014, 99, 47–58. [Google Scholar] [CrossRef] [PubMed] [Green Version]
  67. Gaina, C.; Ursache, O.; Gaina, V.; Ionita, D. Study on the Chemical Modification of Poly(Vinyl Alcohol) with 4-Maleimidophenyl Isocyanate. Polym. Plast. Technol. Eng. 2012, 51, 65–70. [Google Scholar] [CrossRef]
  68. Saat, A.M.; Johan, M.R. Effect of Phosphoric Acid Concentration on the Optical Properties of Partially Phosphorylated PVA Complexes. Int. J. Polym. Sci. 2014, 2014, 495875. [Google Scholar] [CrossRef] [Green Version]
  69. Saat, A.M.; Johan, M.R. Enhanced thermal and structural properties of partially phosphorylated polyvinyl alcohol—Aluminum phosphate (PPVA-AlpO4) nano-composites with aluminium nitrate source, Advanced Materials for Sustainability and Growth. AIP Conf. Proc. 2017, 1901, 130011-1–130011-8. [Google Scholar] [CrossRef]
  70. Muller, J.; Prelot, B.; Zajac, J.; Monge, S. Synthesis and study of sorption properties of polyvinyl alcohol (PVA)-based hybrid materials. React. Funct. Polym. 2019, 144, 104364. [Google Scholar] [CrossRef]
  71. Liu, Y.L.; Chiu, Y.C. Novel approach to the chemical modification of poly(vinyl alcohol): Phosphorylation. J. Polym. Sci. Part A Polym. Chem. 2003, 41, 1107–1113. [Google Scholar] [CrossRef]
  72. Crispim, E.G.; Piai, J.F.; Schüquel, I.T.A.; Rubira, A.F.; Muniz, E.C. Functionalization of poly(vinyl alcohol) by addition of methacryloyl groups: Characterization by FTIR and NMR and optimization of reaction conditions by RSM. e-Polymers 2006, 6, 1–18. [Google Scholar] [CrossRef]
  73. Ferreira, F.B.N.; Rocha, A.M.; Zille, A.; Marques, A.D.; Fangueiro, R. Polyester-Polyvinylalcohol Hydrophilization Strategies. Mater. Sci. Forum 2022, 1063, 173–180. [Google Scholar] [CrossRef]
  74. Xiao, M.; Chery, J.; Frey, M.W. Functionalization of Electrospun Poly(vinyl alcohol) (PVA) Nanofiber Membranes for Selective Chemical Capture. ACS Appl. Nano Mater. 2018, 1, 722–729. [Google Scholar] [CrossRef]
  75. Joseph, P.; McNally, S.T. Reactive modifications of some chain- and step-growth polymers with phosphorus-containing compounds: Effects on flame retardance—A review. Polym. Adv. Technol. 2011, 22, 395–406. [Google Scholar] [CrossRef]
  76. Ren, Y.; Tian, T.; Jiang, L.; Liu, X.; Han, Z. Polyvinyl Alcohol Reinforced Flame-Retardant Polyacrylonitrile Composite Fiber Prepared by Boric Acid Cross-Linking and Phosphorylation. Materials 2018, 11, 2391. [Google Scholar] [CrossRef] [Green Version]
  77. Prajapati, G.K.; Roshan, R.; Gupta, P.N. Effect of plasticizer on ionic transport and dielectric properties of PVA–H3PO4 proton conducting polymeric electrolytes. J. Phys. Chem. Solids 2010, 71, 1717–1723. [Google Scholar] [CrossRef]
  78. Sheha, E.; Nasr, M.; El-Mansy, M.K. Characterization of poly (vinyl alcohol)/poly(3,4-ethylenedioxythiophene) poly(styrenesulfonate) polymer blend: Structure, optical absorption, electrical and dielectric properties. Phys. Scr. 2013, 88, 035701. [Google Scholar] [CrossRef]
  79. An, Y.; Ushida, T.; Suzuki, M.; Koyama, T.; Hanabusa, K.; Shirai, H. Complex-Formation of Partially Phosphorylated Poly(Vinyl Alcohol), with Metal-Ions in Aqueous-Solution. Polymer 1996, 37, 3097–3100. [Google Scholar] [CrossRef]
  80. Chen, X.; Huang, R.; Pelton, R. The Reinforcement of Calcium Carbonate Filled Papers with Phosphorus-Containing Polymers. Ind. Eng. Chem. Res. 2005, 44, 2078–2085. [Google Scholar] [CrossRef]
  81. Somani, P.R.; Viswanath, A.K.; Aiyer, R.C.; Radhakrishnan, S. Novel dye+solid polymer electrolyte material for optical humidity sensing. Org. Electron. 2001, 2, 83–88. [Google Scholar] [CrossRef]
  82. Yu, Q.; Carlsen, P. Synthesis of Polynucleotide Analogs Containing a Polyvinyl Alcohol Backbone. Molecules 2008, 13, 701–715. [Google Scholar] [CrossRef]
  83. Susilawati, S.; Prayogi, S.; Arif, M.F.; Ismail, N.M.; Bilad, M.R.; Asy’ari, M. Optical Properties and Conductivity of PVA–H3PO4 (Polyvinyl Alcohol–Phosphoric Acid) Film Blend Irradiated by γ-Rays. Polymers 2021, 13, 1065. [Google Scholar] [CrossRef] [PubMed]
  84. Mohapatra, S.; Pramanik, N.; Ghosh, S.K.; Pramanik, P. Synthesis and characterization of ultrafine poly(vinylalcohol phosphate) coated magnetite nanoparticles. J. Nanosci. Nanotechnol. 2006, 6, 823–829. [Google Scholar] [CrossRef] [PubMed]
  85. Cheng, K.L. Analytical applications of xylenol orange-I: Determination of traces of Zirconium. Talanta 1959, 2, 61–66. [Google Scholar] [CrossRef]
  86. Okai, T. Determination of Zirconium in Carbonate Rock Reference Materials with Xylenol Orange Spectrophotometric Method. Geostand. Newsl. 1997, 21, 97–99. [Google Scholar] [CrossRef]
  87. Ibrahium, H.A.; Awwad, N.S.; Gado, M.A.; Hassanin, M.A.; Nayl, A.A.; Atia, B.M. Physico-Chemical Aspects on Uranium and Molybdenum Extraction from Aqueous Solution by Synthesized Phosphinimine Derivative Chelating Agent. J. Inorg. Organomet. Polym. Mater. 2022, 32, 3640–3657. [Google Scholar] [CrossRef]
  88. Tang, P. Boric acid catalyzed amide formation from carboxylic acids and amines: N-Benzyl-4-phenylbutyramide. Org. Synth. 2005, 81, 262–272. [Google Scholar] [CrossRef]
  89. Das, R.S.; Warkhade, S.K.; Kumar, A.; Wankhade, A.V. Graphene oxide-based zirconium oxide nanocomposite for enhanced visible light-driven photocatalytic activity. Res. Chem. Intermed. 2019, 45, 1689–1705. [Google Scholar] [CrossRef]
  90. Ren, Y.L.; Huo, T.G.; Qin, Y.W.; Liu, X.H. Preparation of flame retardant polyacry-lonitrile fabric based on sol-gel and layer-by-layer assembly. Materials 2018, 11, 483. [Google Scholar] [CrossRef] [Green Version]
  91. Gillani, Q.F.; Ahmad, F.; Abdul Mutalib, M.I.; Megat-Yusoff, P.S.M.; Ullah, S.; Messet, P.J.; Zia-ul-Mustafa, M. Thermal degradation and pyrolysis analysis of zinc borate reinforced intumescent fire retardant coatings. Prog. Org. Coat. 2018, 123, 82–98. [Google Scholar] [CrossRef]
  92. Ren, Y.L.; Zhang, Y.; Zhao, J.Y.; Wang, X.L.; Zeng, Q.; Gu, Y.T. Phosphorus-doped organic-inorganic hybrid silicon coating for improving fire retardancy of polyacrylonitrile fabric. J. Sol. Gel. Sci. Technol. 2017, 82, 280–288. [Google Scholar] [CrossRef]
  93. Ren, Y.L.; Zhang, Y.; Gu, Y.T.; Zeng, Q. Flame retardant polyacrylonitrile fabrics prepared by organicinorganic hybrid silica coating via sol-gel technique. Prog. Org. Coat. 2017, 112, 225–233. [Google Scholar] [CrossRef]
  94. Wang, S.; Zhou, S.; Huang, J.; Zhao, G.; Liu, Y. Attaching ZrO2 nanoparticles onto the surface of graphene oxide via electrostatic self-assembly for enhanced mechanical and tribological performance of phenolic resin composites. J. Mater. Sci. 2019, 54, 8247–8261. [Google Scholar] [CrossRef]
  95. Adair, J.H.; Krarup, H.G.; Venigalla, S.; Tsukada, T. A Review of the Aqueous Chemistry of the Zirconium—Water System to 200 °C. MRS Online Proc. Libr. 1996, 432, 101–112. [Google Scholar] [CrossRef]
  96. Ibrahium, H.A.; Atia, B.M.; Awwad, N.S.; Nayl, A.A.; Radwan, H.A.; Gado, M.A. Efficient preparation of phosphazene chitosan derivatives and its applications for the adsorption of molybdenum from spent hydrodesulfurization catalyst. J. Dispers. Sci. Technol. 2022, 1–16. [Google Scholar] [CrossRef]
  97. Ibrahium, H.A.; Gado, M.A.; Ali, H.E.; Fathy, W.M.; Atia, B.M.; Awwad, N.S. Synthesis of chelating N-hydroxyl amine derivative and its application for vanadium separation from Abu Zeneima ferruginous siltstone ore, Southwestern Sinai, Egypt. Int. J. Environ. Anal. Chem. 2021, 1–23. [Google Scholar] [CrossRef]
  98. Langmuir, I. The adsorption of gases on plane surfaces of glass, mica and platinum. Am. Chem. Soc. 1918, 40, 1361–1368. [Google Scholar] [CrossRef] [Green Version]
  99. Atia, B.M.; Khawassek, Y.M.; Hussein, G.M.; Gado, M.A.; El-Sheify, M.A.; Cheira, M.F. One-pot synthesis of pyridine dicarboxamide derivative and its application for uranium separation from acidic medium. J. Environ. Chem. Eng. 2021, 9, 105726. [Google Scholar] [CrossRef]
  100. Freundlich, H. Adsorption in solution. Phys. Chem. Soc. 1906, 40, 1361–1368. [Google Scholar]
  101. Gado, M.A.; Atia, B.M.; Cheira, M.F.; Elawady, M.E.; Demerdash, M. Highly efficient adsorption of uranyl ions using hydroxamic acid-functionalized graphene oxide. Radiochim. Acta 2021, 109, 743–757. [Google Scholar] [CrossRef]
  102. Atia, B.M.; Gado, M.A.; Abd El-Magied, M.O.; Elshehy, E.A. Highly efficient extraction of uranyl ions from aqueous solutions using multi-chelators functionalized graphene oxide. Sep. Sci. Technol. 2020, 55, 2746–2757. [Google Scholar] [CrossRef]
Scheme 1. Synthesis of partially phosphorylated polyvinyl phosphate (PPVP) composite.
Separations 09 00382 sch001aSeparations 09 00382 sch001b
Figure 1. FTIR spectra of (a) unmodified PVA; (b) PPVA; (c) PPVP and (d) PPVP-Zr after chelation.
Separations 09 00382 g001
Figure 2. XPS spectra of (a) PVA (b) PPVA (c) PPVP and (d) PPVP-Zr.
Separations 09 00382 g002
Figure 3. Thermogram of PVA, PPVA, PPVP and PPVP-Zr in N2 atmosphere.
Separations 09 00382 g003
Figure 4. Characterization of the PPVP composite by 1H-NMR spectrometry.
Separations 09 00382 g004
Figure 5. Characterization of PPVP composite by 13C-NMR spectrometry.
Separations 09 00382 g005
Figure 6. Characterization of PPVP composite by Mass Spectrometry.
Separations 09 00382 g006
Figure 7. (a) The effect of pH on zirconium retention by the PPVP composite. (b) The slope regression analysis diagram for zirconium ions retention by PPVP at different pH values. (Conditions: V: 50 mL, Zr concentration: 500 mg/L, m: 0.1 g, T: 25 °C, shaking time: 10 min).
Separations 09 00382 g007
Figure 8. (a) Effect of shaking time on zirconium ions uptake by PPVP. (b) Pseudo-first-order modeling. (c) Pseudo-second-order modeling. (d) Intra-particle diffusion modeling. (Conditions: V: 50 mL, Zr concentration: 500 mg/L, m: 0.1 g, T: 25 °C, pH: 0).
Separations 09 00382 g008
Figure 9. (a) Influence of initial zirconium ions concentration upon zirconium uptake by PPVP. (b) Langmuir isotherm modeling. (c) Freundlich isotherm modeling. (d) Effect of PPVP dose on Zr uptake. (Conditions: V: 50 mL, shaking time: 20 min, m: 0.1 g, T: 25 °C, pH: 0).
Separations 09 00382 g009
Figure 10. (a) The effect of temperature on zirconium ions uptake by PPVP. (b) The effect of temperature on the partition coefficient of zirconium ions using PPVP.
Separations 09 00382 g010
Figure 11. Distribution of the black sand deposits in the northern coastal zone of Egypt.
Separations 09 00382 g011
Figure 12. XRD diffractogram of the Egyptian Zircon concentrate.
Separations 09 00382 g012
Figure 13. SEM-EDX of the Egyptian Zircon concentrate.
Separations 09 00382 g013
Figure 14. XRD diffractogram of the fused products from ZrSiO4.
Separations 09 00382 g014
Figure 15. Microstructure of (a) zircon concentrate. (b) Fused products after NaOH alkali fusion.
Separations 09 00382 g015
Figure 16. XRD diffractogram of highly pure ZrO2 from Egyptian Zircon sand.
Separations 09 00382 g016
Figure 17. A flow chart with zirconium mass balance for the preparation of highly pure ZrO2 from Egyptian Zircon sand using PPVP composite.
Separations 09 00382 g017
Table 1. Chemical composition of PVA, PPVA, PPVP and PPVP-Zr.
SampleC1S, %O1S, %N1S, %P2P, %B1S, %Zr3d, %
PVA54.536.35----
PPVA19.347.46-231.5-
PPVP71.385.655.42--
PPVP-Zr61.754.834.224.68-10.77
Table 2. The pore volume, surface area (SBET) and pore size of PVA, PPVA and PPVP.
SamplePore Volume,
cc⋅g−1
SBET, m2⋅g−1Pore Size, nm
PVA0.039.259.1
PPVA0.0512.0311.33
PPVP0.0617.4816.01
Table 3. The effect of co-ions on zirconium ions extraction efficiency using PPVP. (Conditions: V: 50 mL, Zr concentration: 500 mg/L, m: 0.1 g, T: 25 °C, shaking time: 20 min., pH: 0).
Co-IonsFeed Soln.mg/LRaffinate,
mg/L
S.F *Co-IonsFeed Soln.mg/LRaffinate,
mg/L
S.F *
Zr4+500110-Fe3+100075010.64
Na+100010003545Ti4+100089028.82
K+100010003545Ca2+100093047.26
Si4+100010003545Mg2+100095068.17
Al3+100010003545V5+100096086.46
Mn2+100085020.14Hf4+10001002.54
U6+100095068.17Th4+100089028.82
* Separation factor (S.F):the partition coefficient of zirconium ions (DZr) over the partition coefficient of co-ions (DM).
Table 4. Effect of eluting agent’s concentration on zirconium ions elution from PPVP/Zr.
Acid Conc., (M)Elution Efficiency, (%)
HNO3HClH2SO4
0.025999999
0.0595.69597
0.186.68885
0.5727269
1636260
2495552
Publisher’s Note: MDPI stays neutral with regard to jurisdictional claims in published maps and institutional affiliations.

