Abstract
An in-line monitoring method for the elution process of Ginkgo biloba L. leaves using visible and near-infrared spectroscopy in conjunction with multivariate statistical process control (MSPC) was established. Experiments, including normal operating batches and abnormal ones, were designed and carried out. The MSPC model for the elution process was developed and validated. The abnormalities were detected successfully by the control charts of principal component scores, Hotelling T2, or DModX (distance to the model). The results suggested that the established method can be used for the in-line monitoring and batch-to-batch consistency evaluation of the elution process.
1. Introduction
Botanical drugs are widely used around the world. Different from chemical drugs, the raw materials of botanical drugs are from natural products with complicated components. Therefore, taking only one or a few indicators as the quality indices is not suitable during process monitoring for botanical drug production, and more comprehensive information of the in-process materials should be taken into consideration [1,2,3]. Visible-near infrared (Vis-NIR) spectroscopy is increasingly widely used in the food industry, chemical engineering, and process analysis of the pharmaceutical process [4,5,6]. Traditionally, the application of the spectral analysis technique includes the establishment, optimization, validation, and maintenance of the calibration models [7,8], which are complex, time-consuming, and require professionals to operate. To overcome these disadvantages, there is an urgent need to develop new process analytical technology for the pharmaceutical process.
Multivariate statistical process control (MSPC) is a process control technology tool for monitoring the process performance using multidimensional data collected from the processes. The data can be process parameters, such as pH, temperature, pressure, etc., and can also be spectra of the materials in process. In a previous study [9,10,11], we applied the technique to the manufacturing process of traditional Chinese medicine, which uses herbal medicines as raw materials. Several NIR spectroscopy-based process trajectories have been developed for monitoring pharmaceutical processes [12]. They can correctly identify the normal operation condition (NOC) batches and abnormal operation condition (AOC) batches and can also be used for the consistency evaluation of different manufacturing processes [13,14,15,16].
Ginkgo biloba L. preparation is widely used for its potential effects on memory and cognition, and in the treatment of many cardiovascular diseases [17,18,19]. In the production process of Ginkgo preparation, column chromatography is a widely used technique for its separation and purification. However, due to the lack of on-line monitoring means, column chromatography techniques are always operated based on operator skills, and it is difficult to reduce the batch-to-batch variability, which ultimately affects the consistency of the product quality. This is a technical problem to be solved urgently in the column chromatography technique of Ginkgo biloba L. extract [20].
In the present study, Vis-NIR spectroscopy-based process trajectories were developed for the monitoring and control of the column chromatographic processes of Ginkgo biloba L. leaves extract. The in-line spectra of liquid materials were collected in the production process and, combined with the MSPC method, key information that can reflect the status of the production process was extracted. Principal component (PC) scores and Hotelling T2 and DModX (distance to the model) control charts were quickly and effectively built and used for the real-time monitoring of the production process. The presented method provides a promising tool for the recognition of abnormal batches and the consistency evaluation of different batches for the column chromatographic processes of Ginkgo biloba L. leaves extract, and it can also be consulted for solving similar problems.
2. Materials and Methods
2.1. Experimental Design of NOC and AOC Batches
Experimental apparatus and experimental procedures were described in part I [21], and detailed operating conditions are listed in Table 1. Eleven batches of column chromatography processes of Ginkgo biloba L. leaves extracts were designed and executed, which included six NOC batches (batch 1–6) and five AOC batches (batch 7–11). Five NOC batches were used to develop the MSPC models and the AOC batches were used to investigate the prediction performance of the models. The five AOC batches covered common problems that often occurred in practical production. Batch 7 gives a low loading sample, whereas batch 8 gives a high one. Batches 9 and 10 were designed to simulate the case of abnormal elution solvent. In the elution solvent of batch 9, the concentration of ethanol is low, whereas it is high in batch 10. In batch 11, the elution flow rate is low, which is used to simulate the blocking of the chromatography column.

Table 1.
Experimental design of the column chromatographic processes of Ginkgo biloba.
2.2. In-Line Spectra Acquisition
The in-line Vis-NIR spectra were collected as described in part I with a Sartorius X-One Vis-NIR spectrometer [22]. For every batch, a matrix composed of spectral data at different time-points was obtained. The original spectrogram of eluent of batch 1 is shown in Figure 1.
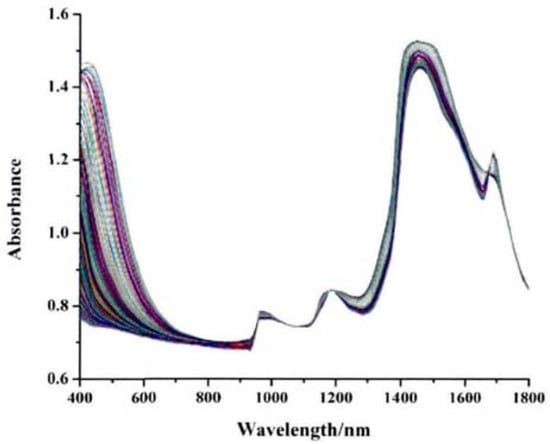
Figure 1.
In-line original spectrogram of eluent of batch 1.
2.3. Data Processing
Five NOC batches were selected as calibration set randomly in order to establish the MSPC models. The remaining one batch of normal operation (batch 4) and other five AOC batches were used as a validation set for model evaluation.
2.4. Unfolding of the Batch Data
Principal component analysis (PCA), partial least squares (PLS), and other multivariate projection algorithms were applied for the two-dimensional data analysis. However, the data of batch production process are composed of 3 dimensions: batch No., time, and process variables. Single-batch data are composed of a dimension of sampling points and a dimension of process variables, which are ordered by time to form an independent two-dimensional data block, whereas multi-batch process data make up a 3D data matrix X (I(nt), where I is the experimental batch, J represents the process time, and K represents the number of process variables (spectral variables) [23,24], as shown in Figure 2.
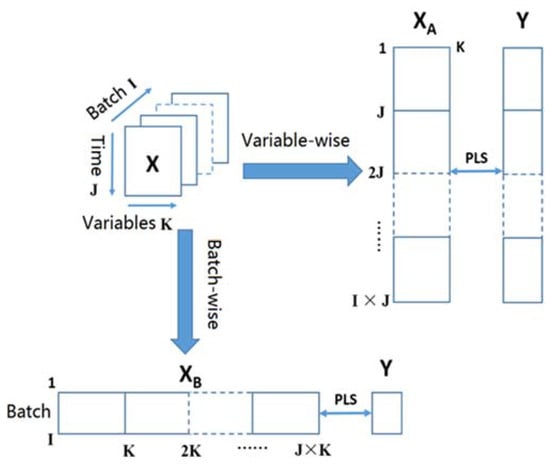
Figure 2.
Two different ways to unfold 3-D spectral data.
The 3D data matrix should unfold in two ways, named “variable-wise” or “batchwise”, before the multiway principal component analysis (MPCA) or multiway partial least squares (MPLS) analysis. In the batchwise method, the data of the time and process variable dimensions are combined as one, and the 3D data matrix is decomposed into 2D matrix XB (I(e), in which, every row includes all data of a batch. However, this method cannot monitor the technical process at each time point, and can only be used to analyze the whole batch, which is the limitation of the batchwise method [25]. On the other hand, in the variable-wise method, the data of time and batch dimensions are combined, and two-dimensional matrices XA (K(d) are constituted, in which, each time point corresponds to a Y value, respectively. In this way, the matrix can be used to monitor the whole process of a batch at each time-point.
2.5. Multivariate Statistical Process Control Charts
The control charts, including PC scores, Hotelling T2, DModX, or SPE, are important tools for the MSPC model. The PC scores trajectory reflects the change trend of the main components with time. If the used PCs can explain the information of the process variables enough, the change trend of the process can be visualized with the PC scores trajectory [26]. However, if too many principal components are taken into account, the monitoring will be more complex. Therefore, in the actual application, only the first principal component is often used. In the MPLS and MPCA method, the control limits of PC scores are different from those of PCA and PLS, which are determined by the average value and standard deviation of the modeling data. In the MPLS and MPCA methods, the control limits of PC scores were determined according to the average values and standard deviations at the same time point of different batches [27].
Hotelling T2 statistic is always used to determine how similar new observations are to the historical data collected under normal conditions. The control limit of Hotelling T2 statistic can be determined using the F distribution [28]. Hotelling T2 can be described as
where A represents the number of the selected PCs; λA−1 and TK represent the diagonal matrix composed of the eigenvalues corresponding to the first A PCs and the score vector of the Kth PC, respectively [29].
TK2 = TKλA−1TKT,
SPE statistic, also known as Q statistic, is the sum of squares of model residuals, representing changes in sampling points that are not explained by the model. There are N sampling points, Xn (1 × K), and the calculation formula of SPE statistics is
where en is the residual term of sampling point xn, xnk is the observed value of the kth variable of sampling point xn, and is the model predictive value of the kth variable of sampling point xn.
In SIMCA software (Stockholm, Sweden), DModX statistics replace SPE statistics for analysis. DModX is the distance of a given observation to the model plane. DModX statistic and its control limit can be determined according to the formula found in reference [16]. DModX can be described as
where xn, en, and XnK represent the process variable, residual vector of xn, and estimate of xn. The control limit of DModX statistic is calculated as
DModXlim = Dcal ± 3SD,
In Equation (4), Dcal and SD represent the mean value and the standard deviation of the standardized DModX values, respectively [29].
All of the computations were performed using SIMCA-P (V12.0.1, Umetrics, Umea, Sweden) software package.
3. Results and Discussion
3.1. Spectral Data Pretreatment
The PC score was performed on the original spectra of batch 2, and Figure 3A shows the trajectories of the first two PC scores, in which, there are obvious spectral fluctuations at approximately 180 min, which may be caused by a baseline drift. In comparison with the first derivative, Savitzky–Golay (SG) smoothing, SNV, MSC, and other pretreatment methods, the 2nd derivative can eliminate the baseline drift effectively, which can be seen from the PC score diagram after pretreatment (Figure 3B).
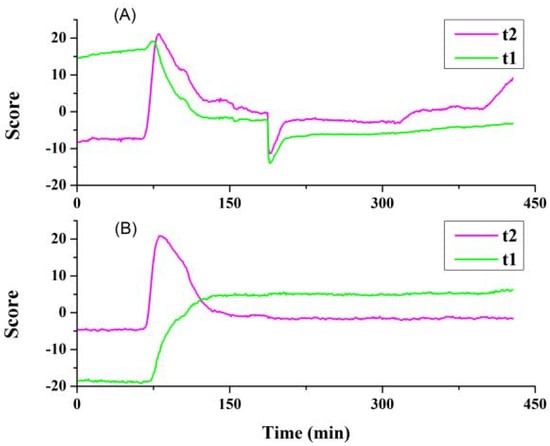
Figure 3.
The first 2 PC scores variation trend during the chromatographic process of batch 2 raw spectral data; ((A)—Track map of the first 2 PC scores; (B)—Second derivative spectral data).
3.2. PCA of the NOC Batches
Seen from the in-line spectra of the elution process in part I, the whole band spectra have obvious fluctuations in the elution process. To monitor the whole elution process more comprehensively, whole band spectra were selected for subsequent modeling. To understand the change in trend of the elution process and analyze the batch process consistency more clearly, 3D data of the five NOC batches were unfolded with the variable-wise method according to the description in the “Unfolding of the batch data” section, and the data were pretreated with the second derivative before the MPLS analysis.
The PCA results of the NOC batches are shown in Figure 4, where the blue points represent the starting points of every batch, the green points are the endpoints, and the color changes according to the time sequence of every batch. As seen from Figure 4, along with the process of elution, the PC scores of the in-line spectra showed an obvious trend, and different batches had similar trajectories. The elution process can be divided into four stages. At the beginning of the elution, the elution solvent (70% ethanol) needed a certain time from entering into the column to flow out of the column, so the spectra were in a relatively stable stage. After 60 min, the solvent began to gradually change from water to 70% ethanol, and a large amount of active components were eluted out simultaneously. The spectra in this stage changed greatly. After the elution solvent converted into 70% ethanol completely, the main changes in the spectra were caused by changes in the chemical substance contents in the elution liquid, which were relatively small; and when the elution process reached the end-point, the score was concentrated in a small space, and the spectra changed slightly.
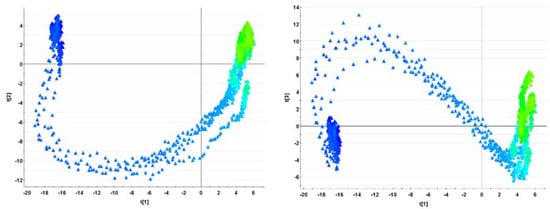
Figure 4.
The spectral principal component score trajectories of the 5 NOC batches.
3.3. MPCA of the NOC Batches
To investigate the overall fluctuation in the batches, the process spectra cubes were unfolded in a batchwise way according to the description in the “Unfolding of the batch data” section, and the PCA model was established using the NOC batches. The cross-validation results indicated that the best PC number is 2, with which, the cumulative contribution rate of variance reached 60.5%. The PC score, Hotelling T2, and DModX control charts are shown in Figure 5, from which, it can be concluded that all three statistics of the NOC batches were within the control limits. For the AOC batches, the DModX values were all beyond the control limit, whereas the PC scores and Hotelling T2 statistics of batches 7, 8, and 11 were normal, which may be due to the model variance accumulation rate not being high enough to detect the abnormal sensitively. The results indicate that the DModX control chart can monitor the abnormal part, which was not explained by the model and is complementary to the PC scores and Hotelling T2 control charts; therefore, a comprehensive analysis of the three control charts is needed for a new batch.
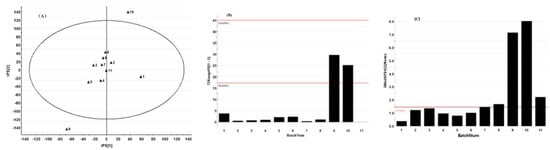
Figure 5.
Three PCA model statistics of the 11 batches of column chromatographic processes ((A)—PC1; (B)—Hotelling T2; (C)—DModX).
Although the PCA model can identify the AOC batches with abnormal initial materials or technical parameters, it can only be used to analyze the whole batch after it finishes and cannot be used to monitor the process synchronously [15]. For this reason, a more convenient and effective method should be developed.
3.4. Establishment of the MSPC Model
The modeling waveband (400–1800 nm) includes 141 wavelength points; therefore, the 3D matrix of the process spectral data (5 × 420 × 141) can be unfolded into a 2D matrix with 5 × 420 rows and 141 columns in the variable-wise way. The validation batches were also unfolded in the same way.
After unfolding the 3D matrix, the MPLS model of the five NOC batches, which take the spectral data matrix as X and the time vector as Y, was established. According to the cross-validation results, three latent variables were used in the model, which explains the 74.4% variance. The obtained PC1, Hotelling T2, and DModX control charts (see Figure 6) can be used for the real-time monitoring of new batches.
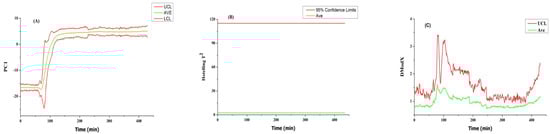
Figure 6.
Three control charts of MSPC models for the column chromatographic processes of Ginkgo biloba ((A)—PC1; (B)—Hotelling T2; (C)—DModX).
3.5. Validation of the Established MSPC Model
3.5.1. NOC Batch
To examine whether the process monitoring model will give a false alarm, Batch 4 (an NOC batch) was used for verification. The process control charts are shown in Figure 7, from which, it can be concluded that, for a randomly selected normal validation batch, in the three control charts, the trajectories are all within the control ranges, which indicates that the overall operation of the batch is in normal conditions, and the quality of intermediates can be considered in the acceptable range.
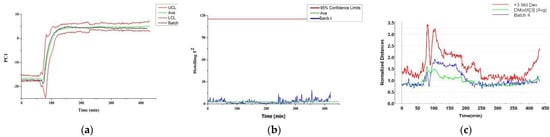
Figure 7.
Three control charts of the batch 4 column chromatographic processes of Ginkgo biloba ((a)—PC1; (b)—Hotelling T2; (c)—DModX).
3.5.2. AOC Batches with Abnormal Starting Materials
Batches 7 and 8 were used to simulate the AOC batches by changing the volume of the starting materials. As seen from the PC1 score trajectory (Figure 8), the two batches deviated from the normal range at the beginning stage of the elution. However, after 60 min, the elution solvent gradually changed from water to an ethanol solution, and the spectra fluctuated greatly, so the abnormality of the starting material was masked. Two hours later, the whole solvent system was replaced by 70% ethanol, and the anomalies in the elution were mainly caused by the different contents of the chemical substances. After 200 min, the abnormality could still be observed in the first PC score and DModX control charts. The Hotelling T2 trajectories lie within the 95% confidence limits during the entire process. However, compared with the NOC batch, the values are significantly larger.
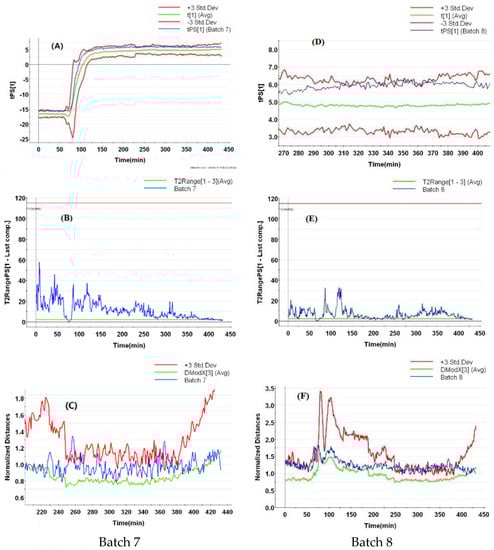
Figure 8.
The control charts of batch 7 and batch 8 with abnormal initial materials ((A,D)—PC1; (B,E)—Hotelling T2; (C,F)—DModX).
3.5.3. AOC Batches with Abnormal Ethanol Concentrations
Figure 9 shows the process control charts of two AOC batches with abnormal ethanol concentrations. From PC1 and Hotelling T2 control charts, no obvious anomaly can be found. In the first 60 min, as the eluent liquid is the solvent of the starting materials, both trajectories laid in the normal range. However, the solvent changed after 60 min, which resulted in the process trajectories changing; this phenomenon is fully reflected in both PC1 and Hotelling T2 control charts.
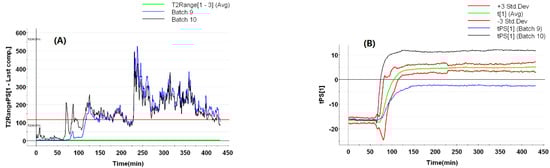
Figure 9.
The control charts of batch 7 and batch 8 with abnormal ethanol concentrations ((A)—PC1; (B)—Hotelling T2).
3.5.4. AOC Batches with Abnormal Flow Rates
The chromatography column will be blocked if the raw solution is insufficiently flitted, the concentration is too high, or the column is polluted by the irreversible adsorption of lipids, polysaccharides, and other impurities after repeated use. The blockage is a gradual process, in which, the elution rate will slow down. During this process, if the abnormal flow rate can be effectively monitored, complete blockage can be avoided through the refreshing of the resin, which will also increase the service life of the resin.
Batch 11 was used to simulate the blockage fault of column by reducing the flow rate of the elution solvent; the process monitoring charts of the batch are shown in Figure 10. As seen from the DModX chart, the effect of the flow rate on the process gradually increased with time. The anomaly was not obvious at the beginning of the elution, but it was quite obvious after 2–3 h. However, after 6 h, the elution process approached the end-point, and the chemical contents and the spectra were no longer changed; therefore, the DModX returned to a normal level. The Hotelling T2 values are larger than average during the entire process, which indicates that the process is in an abnormal state.
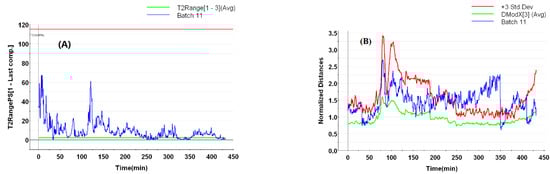
Figure 10.
The control charts of batch 11 with abnormal flow rate of elution solvent ((A)—Hotelling T2; (B)—DModX).
4. Discussion
The ingredients contained in plant medicines are complex. The target compound needs to be separated and purified by chemical means [30,31], and column chromatography technology is a traditional and very effective method for separating natural products [32]. However, because the slogan of green environmental protection goes hand in hand with the policy of eliminating outdated technologies, column chromatography has had to face a series of challenges in recent years, and the process of column chromatography needs to be monitored and controlled in order to avoid consuming too much time and solvent [33]. As one of the important means of process analysis technology (PAT), NIRs are often used to monitor the key quality and performance characteristics of raw materials, intermediates, and processes in real time [34].
5. Conclusions
In this study, a Vis-NIR spectroscopy-based MSPC method was developed for the in-line monitoring and control of the column chromatographic processes of Ginkgo biloba. The established model can provide effective supervision for the process and reflect the running state of the process accurately. The PC score, Hotelling T2, and DModX trajectories control charts were mutually supplemented. A combined use of the three statistics will help to obtain more accurate results. It is undeniable that there were still problems that can be improved in this study: the number of batches used for calibration and verification was small, and the more data used to establish the calibration set, the higher the accuracy. This is where we need to improve.
Author Contributions
Conceptualization, W.L., X.W., X.Y. and H.Q.; methodology, X.Y. and X.W.; software, H.C., X.W. and X.Y.; validation, X.Y. and H.Q.; formal analysis, W.L. and H.C.; investigation, W.L. and H.Q; resources, W.L., X.Y. and H.Q.; data curation, W.L. and X.W.; writing—original draft preparation, W.L., H.C. and H.Q.; writing—review and editing, W.L., H.C. and X.W.; visualization, W.L. and H.Q.; supervision, W.L. and H.Q; project administration, W.L., H.C., X.W., X.Y. and H.Q.; funding acquisition, W.L. and H.Q. All authors have read and agreed to the published version of the manuscript.
Funding
This study was supported by the Key R & D Project of the Zhejiang Science and Technology Program (2018C03075), Hebei Industrial Innovation and Entrepreneurship Team (No. 215A2501D), Wuhan Science and Technology Project (No. 2020020602012116), the Key Project from National Project for Standardization of Chinese Materia Medica (ZYBZH-C-JIN-43) and the National S&T Major Project of China (No. 2018ZX09201011).
Data Availability Statement
Data are contained within the article.
Conflicts of Interest
The authors declare no conflict of interest.
References
- Food and Drug Administration. Guidance for Industry: PAT—A Framework for Innovative Pharmaceutical Development, Manufacturing and Quality Assurance; Food and Drug Administration: Washington, DC, USA, 2004.
- Food and Drug Administration. Guidance for Industry: Botanical Drug Products; Food and Drug Administration: Washington, DC, USA, 2004.
- Food and Drug Administration. Botanical Drug Development Guidance for Industry; Food and Drug Administration: Washington, DC, USA, 2015.
- Biagi, D.; Nencioni, P.; Valleri, M.; Calamassi, N.; Mura, P. Development of a Near Infrared Spectroscopy method for the in-line quantitative bilastine drug determination during pharmaceutical powders blending. J. Pharm. Biom. Anal. 2021, 204, 114277. [Google Scholar] [CrossRef] [PubMed]
- Khatiwada, B.P.; Subedi, P.P.; Hayes, C.; Jnr, L.C.C.C.; Walsh, K.B. Assessment of internal flesh browning in intact apple using visible-short wave near infrared spectroscopy. Postharvest Biol. Technol. 2016, 120, 103–111. [Google Scholar] [CrossRef]
- Cecchini, C.; Antonucci, F.; Costa, C.; Marti, A.; Menesatti, P. Application of near-infrared handheld spectrometers to predict semolina quality. J. Sci. Food. Agric. 2021, 101, 151–157. [Google Scholar] [CrossRef]
- Wang, P.; Zhang, H.; Yang, H. Rapid determination of major bioactive isoflavonoid compounds during the extraction process of kudzu (Pueraria lobata) by near-infrared transmission spectroscopy. Spectrochim. Acta A 2015, 137, 1403–1408. [Google Scholar] [CrossRef] [PubMed]
- Mishra, P.; Herrmann, I.; Angileri, M. Improved prediction of potassium and nitrogen in dried bell pepper leaves with visible and near-infrared spectroscopy utilising wavelength selection techniques. Talanta 2021, 225, 121971. [Google Scholar] [CrossRef]
- Giannuzzi, D.; Mota, L.F.M.; Pegolo, S.; Gallo, L.; Schiavon, S.; Tagliapietra, F.; Katz, G.; Fainboym, D.; Minuti, A.; Trevisi, E.; et al. In-line near-infrared analysis of milk coupled with machine learning methods for the daily prediction of blood metabolic profile in dairy cattle. Sci. Rep. 2022, 12, 8058. [Google Scholar] [CrossRef]
- Assi, S.; Arafat, B.; Lawson-Wood, K.; Robertson, I. Authentication of Antibiotics Using Portable Near-Infrared Spectroscopy and Multivariate Data Analysis. Appl. Spectrosc. 2021, 75, 434–444. [Google Scholar] [CrossRef]
- Li, W.; Han, H.; Cheng, Z.; Zhang, Y.; Liu, S.; Qu, H. A Feasibility Research on the Monitoring of Traditional Chinese medicine Production Process Using NIR-based Multivariate Process Trajectories. Sens. Actuators B Chem. 2016, 231, 313–323. [Google Scholar] [CrossRef]
- Xue, J.T.; Yang, Q.W.; Li, C.Y.; Liu, X.L.; Niu, B.X. Rapid and simultaneous quality analysis of the three active components in Lonicerae Japonicae Flos by near-infrared spectroscopy. Food. Chem. 2021, 342, 128386. [Google Scholar]
- Wu, H.L.; Chen, G.C.; Zhang, G.B.; Dai, M.H. Application of Multimodal Fusion Technology in Image Analysis of Pretreatment Examination of Patients with Spinal Injury. J. Healthc. Eng. 2022, 2022, 4326638. [Google Scholar] [CrossRef]
- Mishra, V.; Thakur, S.; Patil, A.; Shukla, A. Quality by design (QbD) approaches in current pharmaceutical set-up. Expert Opin. Drug Deliv. 2018, 15, 737–758. [Google Scholar] [CrossRef] [PubMed]
- Mercier, S.M.; Diepenbroek, B.; Wijffels, R.H.; Streefland, M. Multivariate PAT solutions for biopharmaceutical cultivation: Current progress and limitations. Trends Biotechnol. 2014, 32, 329–336. [Google Scholar] [CrossRef] [PubMed]
- Kim, E.J.; Kim, J.H.; Kim, M.S.; Jeong, S.H.; Choi, D.H. Process Analytical Technology Tools for Monitoring Pharmaceutical Unit Operations: A Control Strategy for Continuous Process Verification. Pharmaceutics 2021, 13, 919. [Google Scholar] [CrossRef] [PubMed]
- Liu, L.M.; Wang, Y.T.; Zhang, J.C.; Wang, S.F. Advances in the chemical constituents and chemical analysis of Ginkgo biloba leaf, extract, and phytopharmaceuticals. J. Pharm. Biomed. Anal. 2021, 193, 113704. [Google Scholar] [CrossRef]
- Noor-E-Tabassum; Das, R.; Lami, M.S.; Chakraborty, A.J.; Mitra, S.; Tallei, T.E.; Idroes, R.; Mohamed, A.A.; Hossain, M.J.; Dhama, K.; et al. Ginkgo biloba: A Treasure of Functional Phytochemicals with Multimedicinal Applications. Evid. Based Complement. Altern. Med. 2022, 2022, 8288818. [Google Scholar] [CrossRef]
- Liu, Y.X.; Xin, H.W.; Zhang, Y.C.; Che, F.; Shen, N.; Cui, Y. Leaves, seeds and exocarp of Ginkgo biloba L. (Ginkgoaceae): A Comprehensive Review of Traditional Uses, phytochemistry, pharmacology, resource utilization and toxicity. J. Ethnopharmacol. 2022, 298, 115645. [Google Scholar] [CrossRef]
- Blumberg, L.M. Practical limits to column performance in liquid chromatography-Optimal operations. J. Chromatogr. A 2020, 1629, 461482. [Google Scholar] [CrossRef]
- Li, W.; Yan, X.; Chen, H.; Qu, H. In-line Vis-NIR spectral analysis for the column chromatographic processes of Ginkgo biloba part I: End-point determination of the elution process. Chemom. Intell. Lab. Syst. 2018, 172, 159–166. [Google Scholar] [CrossRef]
- Kim, B.; Woo, Y.A. Optimization of in-line near-infrared measurement for practical real time monitoring of coating weight gain using design of experiments. Drug Dev. Ind. Pharm. 2021, 47, 72–82. [Google Scholar] [CrossRef]
- Zhang, D.J.; Sun, L.L.; Mao, B.B.; Zhao, D.S.; Cui, Y.L.; Sun, L.; Zhang, Y.X.; Zhao, X.; Zhao, P.; Zhang, X.L. Analysis of chemical variations between raw and wine-processed Ligustri Lucidi Fructus by ultra-high-performance liquid chromatography-Q-Exactive Orbitrap/MS combined with multivariate statistical analysis approach. Biomed. Chromatogr. 2021, 35, e5025. [Google Scholar] [CrossRef]
- Eriksson, L.; Johansson, E.; Kettaneh-Wold, N. Multi-and Megavariate Data Analysis: Principles and Applications; Umetrics: Umea, Sweden, 2006. [Google Scholar]
- Sheng, X.C.; Xiong, W.L. Soft sensor design based on phase partition ensemble of LSSVR models for nonlinear batch processes. Math. Biosci. Eng. 2019, 17, 1901–1921. [Google Scholar] [CrossRef] [PubMed]
- Feng, H.M.; Li, S.N.; Hu, Y.F.; Zeng, X.Y.; Qiu, P.; Li, Y.X.; Li, W.L.; Li, Z. Quality assessment of Succus Bambusae oral liquids based on gas chromatography/mass spectrometry fingerprints and chemometrics. Rapid Commun. Mass Spectrom. 2021, 35, e9200. [Google Scholar] [CrossRef] [PubMed]
- Clavaud, M.; Lema-Martinez, C.; Roggo, Y.; Bigalke, M.; Guillemain, A.; Hubert, P.; Ziemons, E.; Allmendinger, A. Near-Infrared Spectroscopy to Determine Residual Moisture in Freeze-Dried Products: Model Generation by Statistical Design of Experiments. J. Pharm. Sci. 2020, 109, 719–729. [Google Scholar] [CrossRef] [PubMed]
- Oliveira, R.R.; Avila, C.; Bourne, R.; Muller, F.; Juan, A. Data fusion strategies to combine sensor and multivariate model outputs for multivariate statistical process control. Anal. Bioanal. Chem. 2020, 412, 2151–2163. [Google Scholar] [CrossRef] [PubMed]
- Wu, S.J.; Cui, T.C.; Zhang, Z.Y.; Li, Z.; Yang, M.; Zang, Z.Z.; Li, W.L. Real-time monitoring of the column chromatographic process of Phellodendri Chinensis Cortex part II: Multivariate statistical process control based on nearinfrared spectroscopy. New J. Chem. 2022, 46, 10690–10699. [Google Scholar] [CrossRef]
- Wang, X.J.; Xie, Q.; Liu, Y.; Jiang, S.; Li, W.; Li, B.; Wang, W.; Liu, C.X. Panax japonicus and chikusetsusaponins: A review of diverse biological activities and pharmacology mechanism. Chin. Herb. Med. 2021, 13, 64–77. [Google Scholar] [CrossRef] [PubMed]
- Zhang, L.; Jia, Y.Z.; Li, B.; Peng, C.Y.; Yang, Y.P.; Wang, W.; Liu, C.X. A review of lignans from genus Kadsura and their spectrum characteristics. Chin. Herb. Med. 2021, 13, 157–166. [Google Scholar] [CrossRef]
- Wang, N.N.; Chen, T.; Yang, X.; Shen, C.; Li, H.M.; Wang, S.; Zhao, J.Y.; Chen, J.L.; Chen, Z.; Li, Y.L. A practicable strategy for enrichment and separation of four minor flavonoids including two isomers from barley seedlings by macroporous resin column chromatography, medium-pressure LC, and high-speed countercurrent chromatography. J. Sep. Sci. 2019, 42, 1717–1724. [Google Scholar] [CrossRef]
- Wang, R.; Li, W.; Chen, Z. Solid phase microextraction with poly(deep eutectic solvent) monolithic column online coupled to HPLC for determination of non-steroidal anti-inflammatory drugs. Anal. Chim. Acta 2018, 1018, 111–118. [Google Scholar] [CrossRef]
- Choudhary, S.; Herdt, D.; Spoor, E.; García Molina, J.F.; Nachtmann, M.; Rädle, M. Incremental Learning in Modelling Process Analysis Technology (PAT)—An Important Tool in the Measuring and Control Circuit on the Way to the Smart Factory. Sensors 2021, 21, 3144. [Google Scholar] [CrossRef]


Publisher’s Note: MDPI stays neutral with regard to jurisdictional claims in published maps and institutional affiliations. |
© 2022 by the authors. Licensee MDPI, Basel, Switzerland. This article is an open access article distributed under the terms and conditions of the Creative Commons Attribution (CC BY) license (https://creativecommons.org/licenses/by/4.0/).