1. Introduction
Melastoma malabathricum, which is locally known as “senduduk”, is a small shrub belonging to the family Melastomaceae. This plant is native to the tropical and temperate regions in Asia, including Malaysia. The use of
M. malabathricum as a medical herb is very popular amongst Malays and Indians. The leaves of
M. malabathcricum are usually chewed or pounded, and applied as a paste on the wounded area to stop bleeding [
1]. According to Sharma et al. [
2], the leaves could also be used to prevent scarring from smallpox, dysentery, diarrhea, and piles. The promising effects of the traditional application have encouraged studies on the chemical and biological activities of this plant nowadays.
Scientifically,
M. malabathricum was prepared as extracts using different types of solvents and tested in various in vitro and in vivo studies to demonstrate its remarkable pharmacological potentials. The plant extracts, regardless of parts of the plant, were found to exhibit anti-inflammatory [
1], antimicrobial [
3], antioxidant [
4], wound healing [
5], antiulcer [
6], anti-hyperlipidemic [
7,
8], and anti-diabetic [
7,
8,
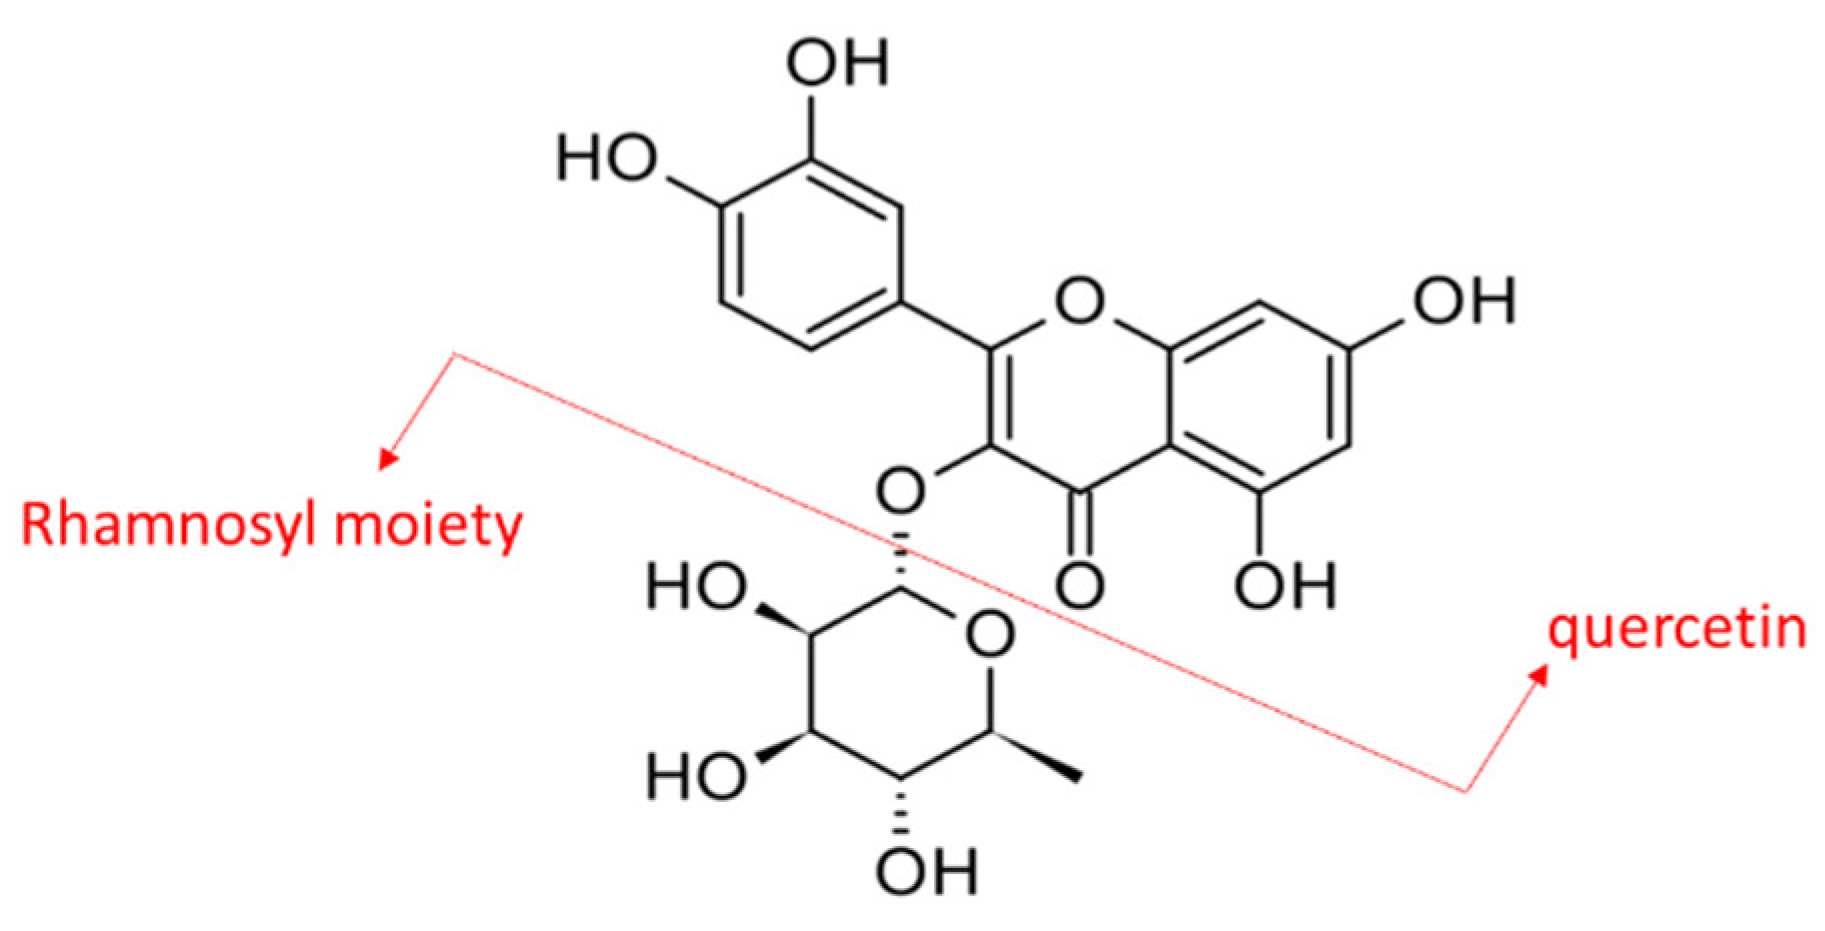
9] activities. However, most studies were focused on the biological activities of crude extract and limited information on the key phytochemical(s) contributing to the reported properties. Previously, quercetrin was reported to be one of the most abundant phytochemicals in
M. malabathricum leaves [
10]. Quercetrin is a glycosylated flavonol and quercetin is its basic chemical structure (
Figure 1).
Fractionation is one of the herbal processing techniques to recover a target compound from a highly complex mixture of crude extract. There are two common fractionation techniques such as column chromatography and solid-phase extraction (SPE). The preconcentration-extraction-based techniques are still in significant use to make analytes available for sensitive measurements [
11]. Among them, SPE is also frequently used to preconcentrate the target compound from plant materials that has been reported in many studies [
12,
13]. A small quantity of target compound from a highly complex phytochemical composition of plant samples could be preconcentrated prior to analytical determination [
14]. Many types of SPE sorbents are also available on the market, and therefore, the selection of sorbent is dependent upon its physical and chemical interaction with the analyte [
15,
16]. A reversed-phase C18 sorbent was found to be effective to isolate quercetin glycosides from plant-based samples [
16,
17]. SPE is widely used because it is a fast process with the minimal usage of solvent volume. The effectiveness of SPE was also dependent on the eluent system because its polarity would directly affect the interaction of the target compound and sorbent [
18]. Methanol was used in the fractionation of quercetin glycosides, which possess intermediate polarity [
16].
The same group of researchers reported the preparation and optimization of crude extract from
M. malabathricum leaves using ultrasound-assisted extraction. The yield of crude extract and quercetrin content was the dependent variables of the optimization [
19]. Further investigation was carried out in the present study. Quercetrin was preconcentrated from the crude extract of
M. malabathricum leaves using SPE. This SPE-based fractionation process was empirically and statistically optimized using the response surface methodology (RSM). To our knowledge, there were no studies on the optimization of quercetrin from
M. malabathricum using RSM. However, there were studies carried out by a research team who used ultrasound-assisted solid-phase microextraction to preconcentrate quercetin (aglycone of quercetrin) from different vegetables and fruits, and the processes were optimized using the central composite design (CCD) of RSM [
20,
21].
In the present study, an empirical method, commonly known as one-factor-at-a-time (OFAT), is a single-factor experimental design, whereby one factor is varied at a time, while fixing other factors. Subsequently, statistical optimization was performed to depict the interaction effects among the input variables [
22]. Both OFAT and RSM were used to optimize the independent variables such as the loading concentration of crude extract, volume of the eluent system, methanol concentration of the eluent system, and pressure of the manifold system to obtain a high yield of fraction and quercetrin content. The innovation of this article is to optimize the yield of quercetrin from
M. malabathricum extract using both OFAT and RSM techniques, as quercetrin is one of the important phytochemicals with remarkable bioactivity of the herb. Process optimization would increase its yield for future bioproduct formulation and development. The antidiabetic property of quercetrin was also simulated in silico using the molecular docking approach and proven experimentally using a calorimetric DPP-IV assay.
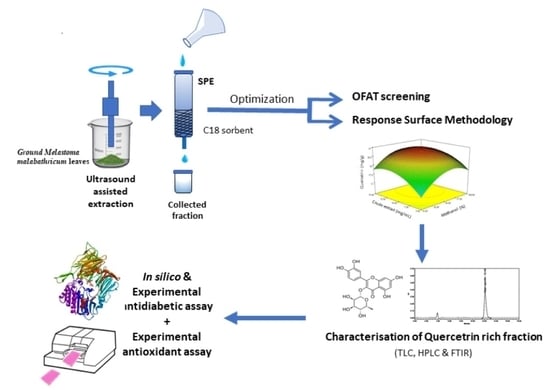
2. Materials and Methods
The experimental works of this study can be divided into three phases: (i) ultrasound-assisted extraction for crude extract from
M. malabathricum leaves, (ii) optimization of solid-phase extraction for high yield of quercetrin, and (iii) characterization of recovered quercetrin.
Figure 2 illustrates the overall flow of the research methodology.
2.1. Ultrasound-Assisted Extraction
The dried and ground leaves of
M. malabathricum (10 g) were extracted in 210 mL of 70% ethanol for 15 min using an ultrasonic probe (Model FB-705, Newtown, CT, USA) operated at 68% amplitude as the optimized operating parameters in the works of Awang et al. [
19]. The particle size of the dried leaves was 0.44–0.45 mm. The temperature of the ultrasound-assisted extraction system was maintained at 28 °C using a temperature-controlled water bath. The supernatant was filtered and dried in vacuo using a rotary evaporator.
2.2. Solid-Phase Extraction
The dried crude extract of
M. malabthricum leaves was reconstituted in methanol (1 mL). The solution was loaded on a prepacked and activated reversed-phase cartridge, Chromabond C18 with the specification of 6 mL/500 mg × 45 µm (Macherey-Nagel, Allentown, PA, USA), for solid-phase extraction (SPE) to fractionate the crude extract into individual fractions. The activation was carried out by eluting the empty cartridge with 10 mL of deionized water followed by 10 mL of methanol. The activated cartridge was attached to a SPE vacuum manifold system. Fractionation was performed by slowly eluting the crude extract solution with an eluent system into tubes at a controlled flow rate under the stipulated pressure in the vacuum manifold system. The compound saturated eluent collected from the outlet of the cartridge was dried and determined for its fraction yield (weight %) and quercetrin content (mg/g), as presented in Equations (1) and (2), respectively.
2.3. Preliminary Screening of Variables in Fractionation
Preliminary experiments were performed using the approach of One-Factor-At-A-Time (OFAT) to determine the range of independent variables such as loading concentration of crude extract (mg/mL), volume of eluent system (mL), methanol concentration (%), and pressure of the manifold system (kPa). Initially, the fractionation was carried out by varying the pressure from 15 to 30 kPa at the fixed loading concentration of crude extract (10 mg/mL) using 30 mL of 70% methanol as the eluent system. The optimum pressure was then selected and fixed at its value for subsequent experiments.
Consequently, the loading concentration of crude extract was varied from 3 to 25 mg/mL at the optimized pressure using 30 mL of 70% methanol. With the optimized pressure and loading concentration of crude extract, the fractionation process was continued using 30 mL of eluent with different concentrations of methanol ranging from 0 to 100% (v/v). Finally, the crude extract solution was fractionated by varying the volume of the eluent system from 6 to 66 mL at the optimized pressure, the loading concentration of crude extract, and the methanol concentration. All experiments were conducted in triplicate. A new cartridge was used for each experiment.
2.4. Optimization of Fractionation for Crude Extract
The variables and their ranges were selected based on the results of OFAT screening for further statistical optimization. The selected variables were methanol concentration, loading concentration of crude extract, and volume of eluent system, which were optimized using the central composite design of the response surface methodology in Design-Expert Version 6.0.4 (Stat-Ease, Inc., Minneapolis, MN, USA). Three level factors of the experimental design produced a total of 17 experiments with three center points for the estimation of curvature and pure error (
Table 1).
2.5. Chemical Characterization of Crude Extract and Fraction
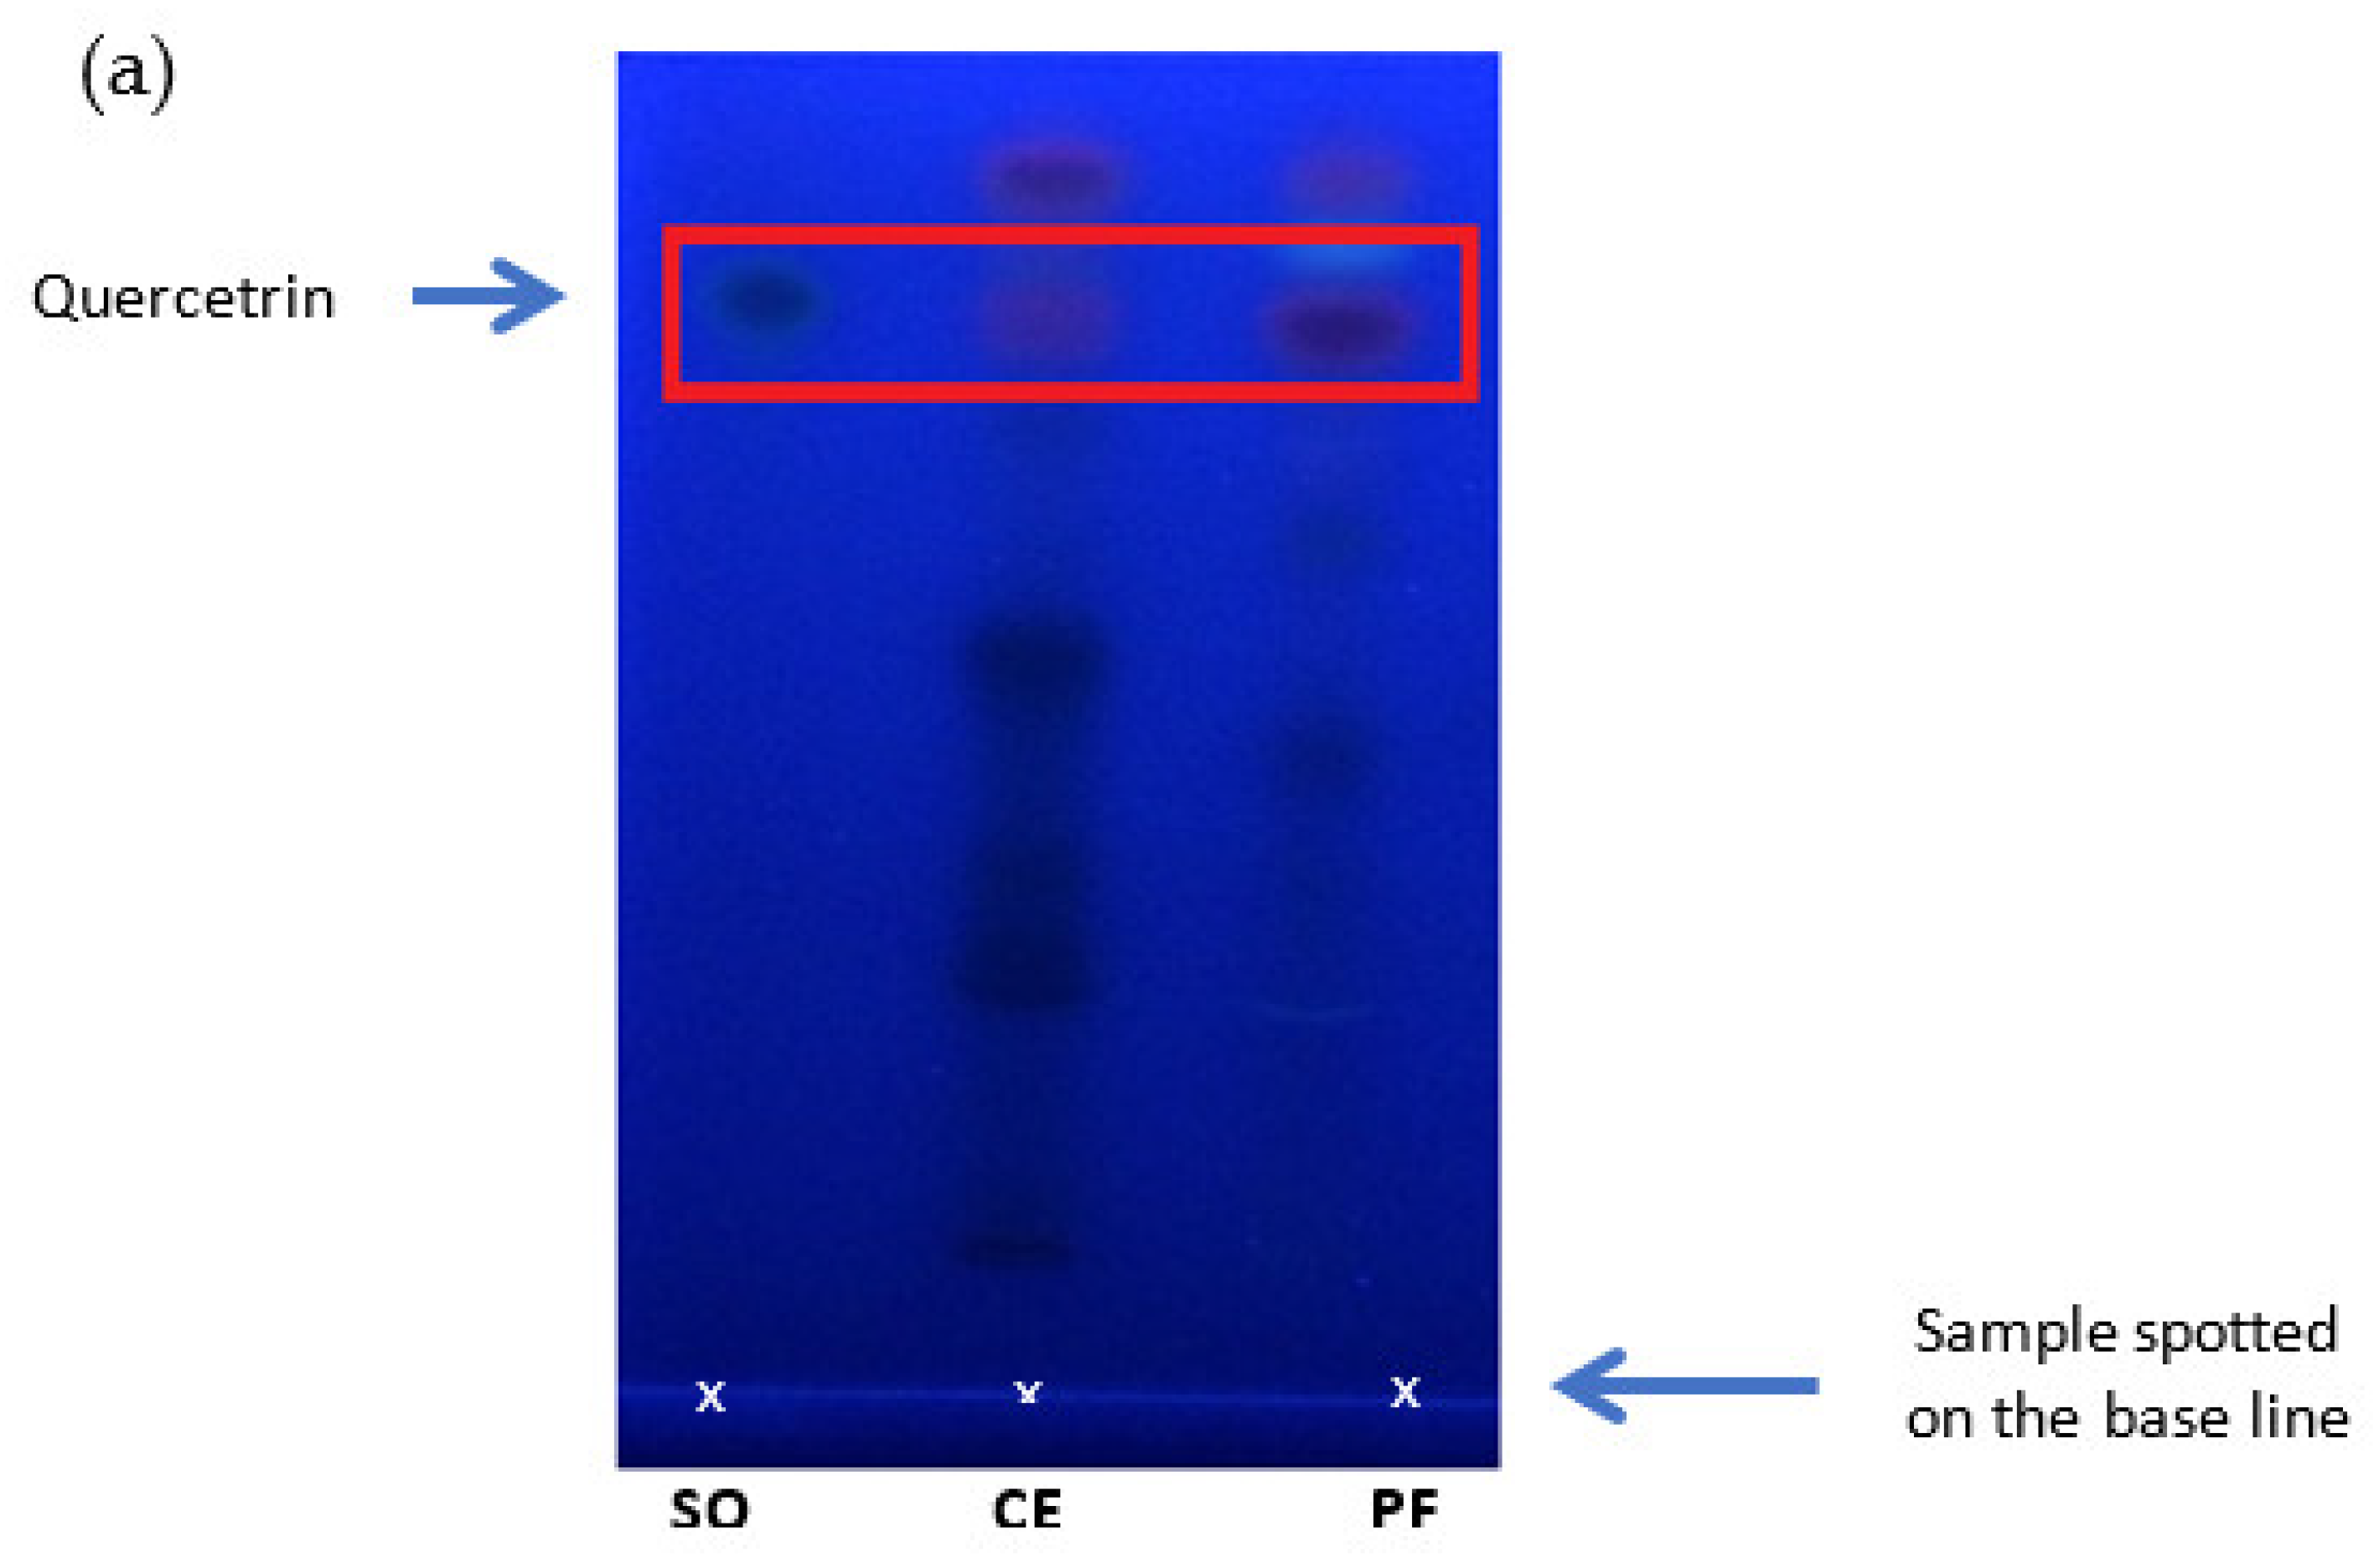
Thin-layer chromatography (TLC) was used to qualitatively analyze the presence of quercetrin in the crude extract and fraction. A silica gel 60 F254-coated TLC plate (5 cm × 7.5 cm, 0.05 mm thickness) was used to separate compounds in samples. A small drop of the reconstituted crude extract and fraction (1 mg/mL) was spotted on the baseline, which was drawn 1 cm above the end of the plate. The standard quercetrin was used as the positive control. The spotted samples were also distanced about 1 cm away from each other. The plate was then put vertically in a solvent-saturated glass chamber. The solvent system used for compound separation consisted of ethyl acetate: glacial acetic acid: formic acid: toluene (20:3:3:5
v/
v). The solvent system was slowly migrated up the plate by capillary action. The movement of the solvent would separate compounds along the plate. The separation was stopped before the solvent reached the other end of the plate. The plate was air-dried and visualized under UV light at 254 nm. The location of quercetrin on the plate was determined based on the retention factor (Rf), which explains the ratio of distance travelled by quercetrin and solvent. The retention factors (Rf) of quercetrin from the crude extract and fraction were determined using Equation (3).
Fourier-Transform Infrared Spectroscopy (FT-IR) was used to analyze the functional groups of quercetrin in samples. A 1 mg/mL sample was placed and pressed on the germanium disk with a constant pressure. Spectra were recorded with the aid of an OMNI-sampler using attenuated total reflectance (ATR). The absorbance was measured at wavenumbers ranging from 4000 cm−1 to 675 cm−1.
Consequently, the quantitative analysis of quercetrin was determined using High-performance liquid chromatography (HPLC). A Waters HPLC system (Model 2690, MA, USA) consisted of a binary pump, a system controller, an automatic sampler, and a photo-diode array detector (Model 966, MA, USA), which was used to separate compounds chromatographically. The column was a C18 reversed-phase column with dimensions of 4.6 mm × 250 mm, 5 µm (Phenomemex, Torrance, CA, USA). The mobile phase that was composed of methanol: acetonitrile: water (40:15:45, v/v/v) with 1.0% acetic acid was flowed in isocratic elution. The flow rate of mobile phase was 1.0 mL/min and the injection volume was 10 µL. Quercetrin (HWI Analytik GmBH, Rülzheim, Germany) was detected at 368 nm.
2.6. Antiradical Assay
The antiradical assay was carried out using the DPPH assay. Radical DPPH is a stable free radical in purple color. It is reduced to yellow complex when reacted with antioxidants. The assay was performed according to the procedures explained by Awang et al. [
19]. The crude extract and fraction were reconstituted in methanol at the concentration of 0.5 mg/mL. A 4.0 mL sample and 1.0 mL DPPH reagent (0.1 mM) were mixed and incubated for 3 min at room temperature. The absorbance of the mixture was measured at 520 nm using a Lambda 2S spectrophotometer (Perkin Elmer, Waltham, MA, USA). The absorbances of the negative control (methanol) and positive control (Trolox) were recorded. All experiments were performed in triplicate. The percentage of inhibition is calculated as in Equation (4).
where AC is the absorbance of the control and A is the absorbance of the sample.
2.7. Anti-Diabetic Activity Using Dipeptidyl Peptidase-IV (DPP-IV)
Antidiabetic assay was carried out using DPP-IV kits. The assay measured the inhibition of DPP-IV after being treated with 1 mg/mL of crude extract and fraction. The progress of the inhibition was then monitored at different concentrations of samples (0–100 μg/mL). DPP-IV was used to cleave the nonfluorescent substract, H-glycyl-prolyl-AMC, to form fluorescent product, 7-amino-4-methyl coumarin (AMC), for measurement at 405 nm. One unit of DPP-IV is the amount of enzyme required to yield 1.0 µmole of AMC per minute at 37 °C [
23]. The calibration curve of AMC was established from 0–50 mM. Sitagliptin was used as a positive control. All experiments were performed in triplicate. The inhibitory activity is expressed in percentage as calculated using Equation (4).
2.8. Simulation Using Molecular Docking
The activity of quercetrin as the DPP-IV inhibitor was evaluated in silico using Autodock (4.2) software. Free energy binding, the inhibition constant, and surface interaction were analyzed to determine the inhibitory activity of quercetrin as a ligand against DPP-IV (protein). Sitagliptin was used as a reference drug.
2.9. Statistical Analysis
The triplicate data were averaged and determined for their standard deviations, which were then plotted in figures as error bars. One-way ANOVA followed by a post hoc Tukey–Kramer test was used to compare the statistical significance of results at 95% confident level.
3. Results and Discussion
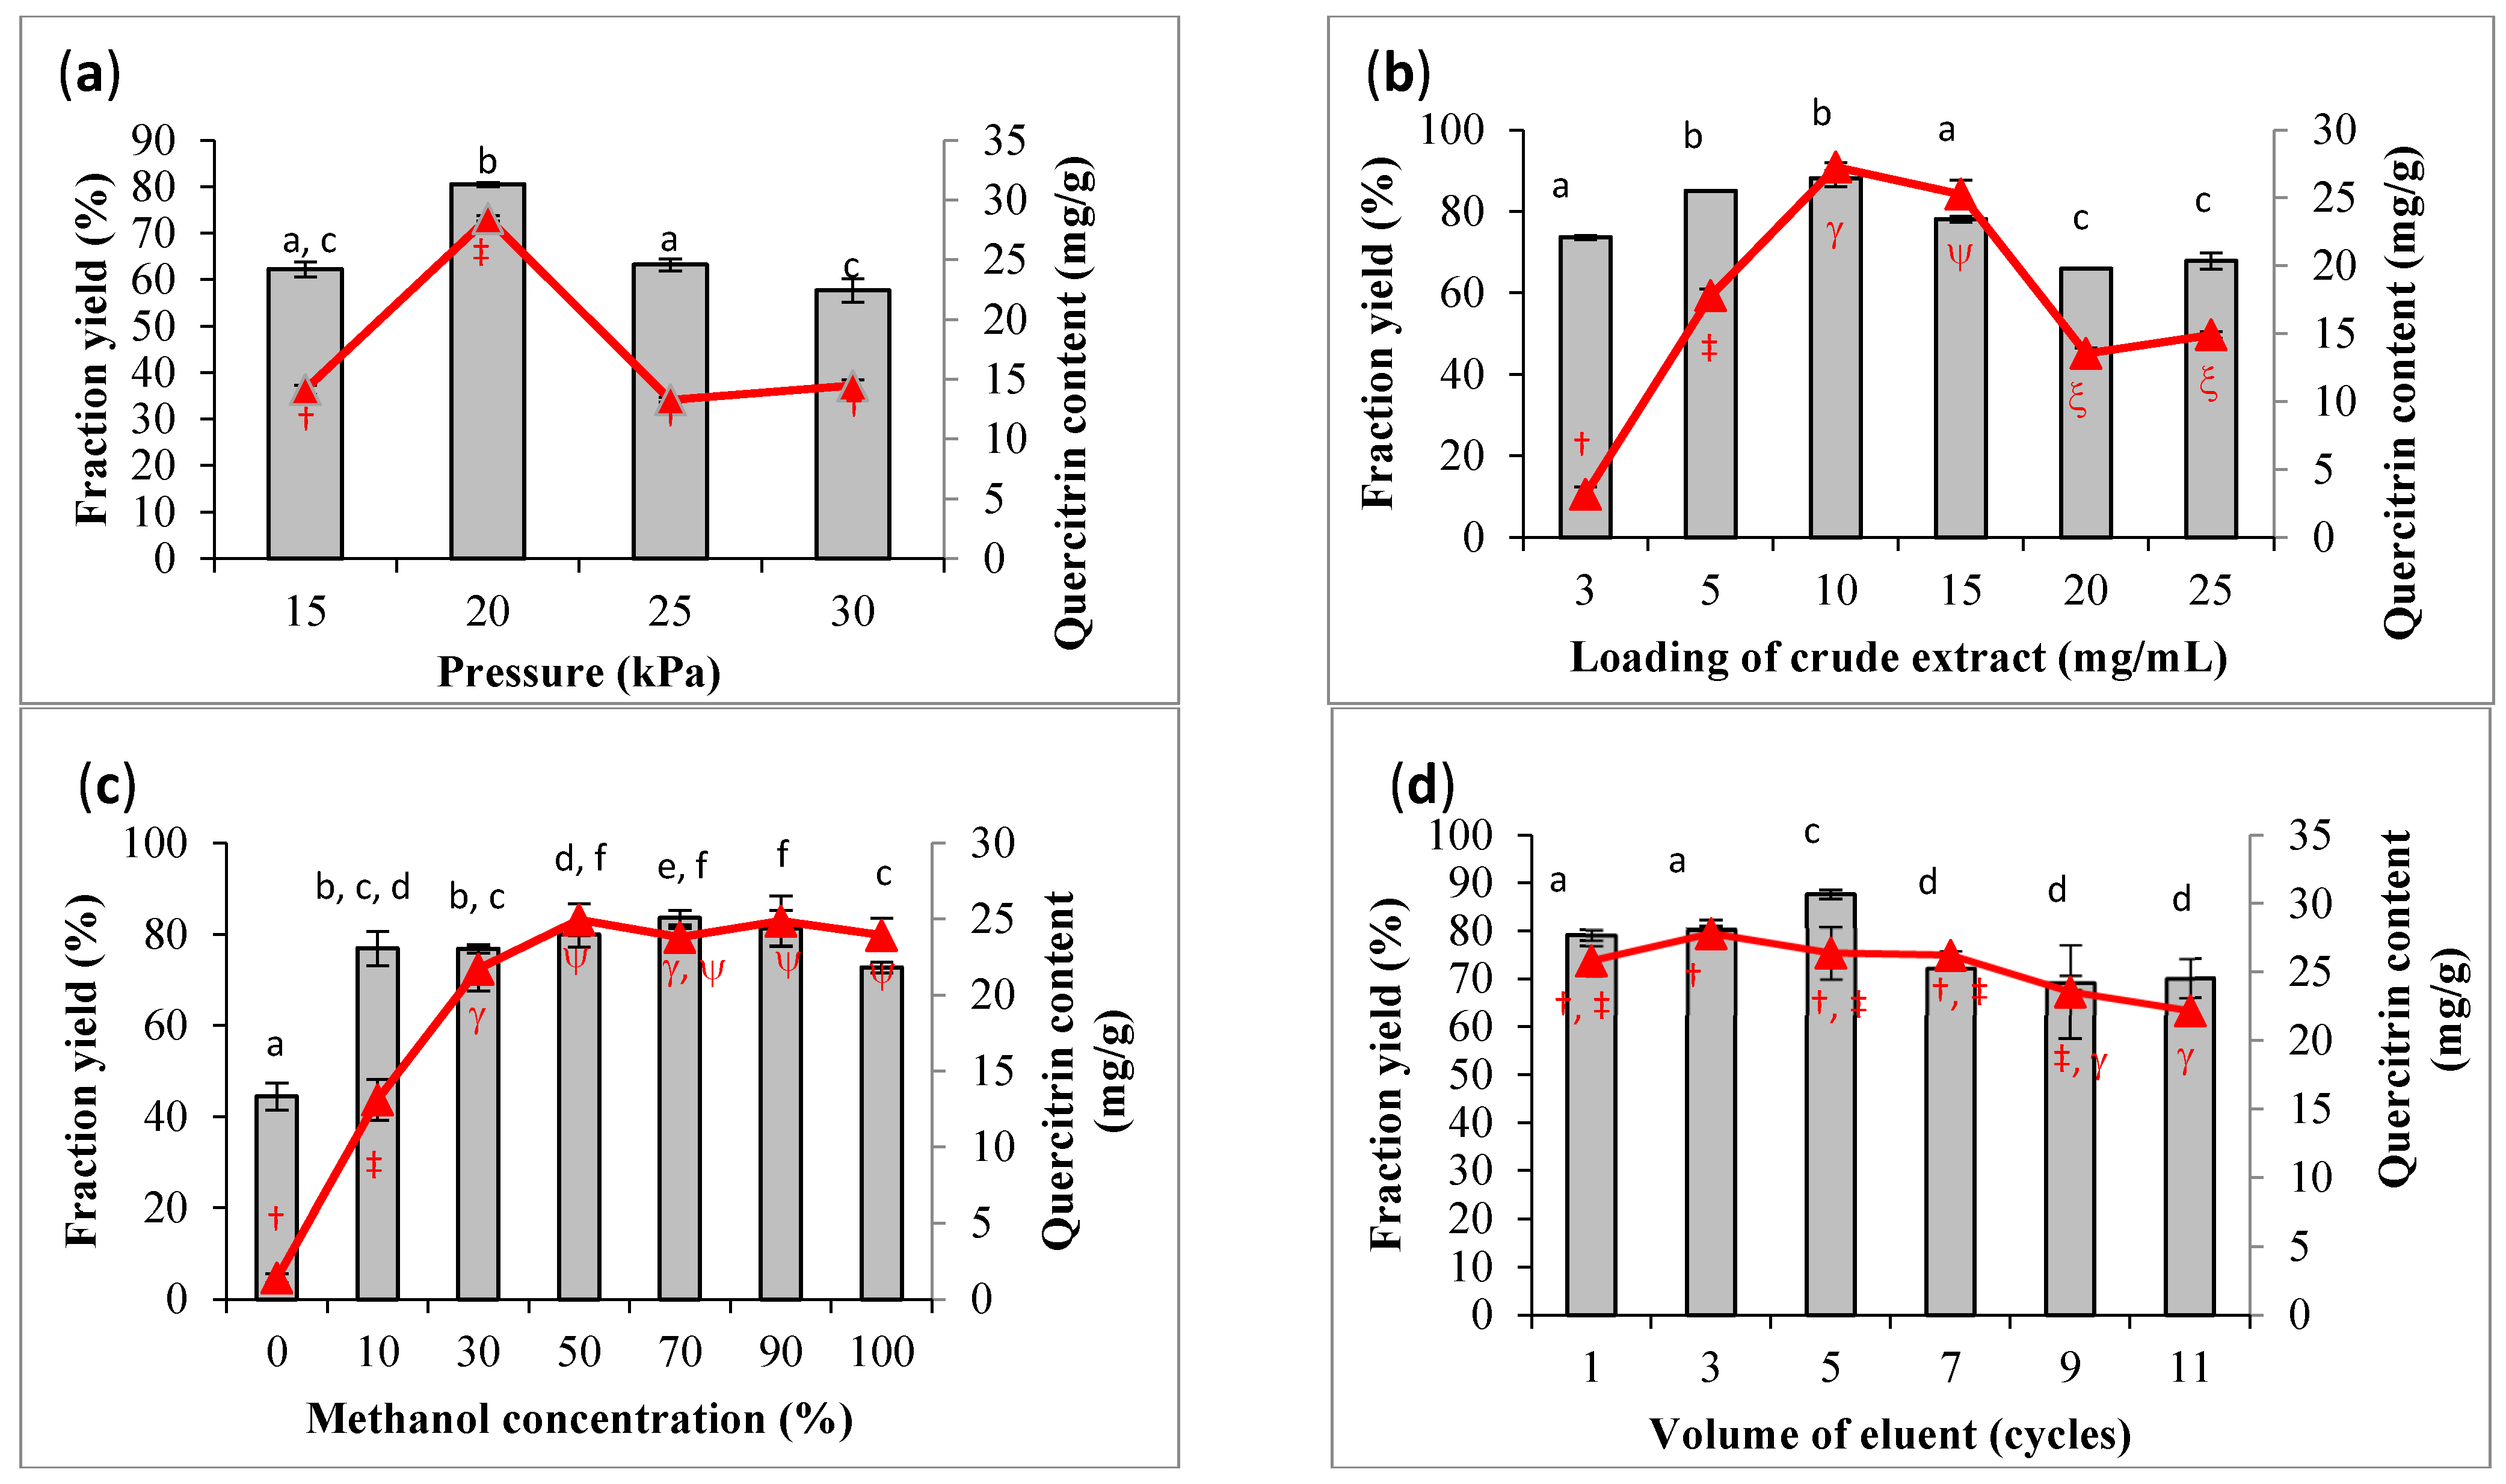
3.1. Effect of Pressure on the Fraction Yield and Quercetrin Content
OFAT screening was carried out prior to optimization. The preliminary screening was used to decide the variables and their ranges for statistical optimization. The optimization aimed to increase the yield of fraction with the highest content of quercetrin. The operating pressure of the SPE manifold system is one of the critical parameters in process optimization.
Figure 3a clearly shows that fractionation could achieve the maximum yield (80.5%) and quercetrin content (28.48 mg/g) at 20 kPa. The content of quercetrin was significantly dropped when the pressure was lower or higher than the optimum value. The vacuum pressure between 15 and 20 kPa was to warrant an intensive interaction between the sample and sorbent, as well as to ensure reproducible flow rate [
24]. Increasing the vacuum pressure more than 20 kPa to the small cartridge would promote a faster flow rate of eluent, which would result in poor separation [
25]. Previous studies applied SPE to recover organic explosives from wastewater at a pressure ≤20 kPa [
26]. Therefore, the flow rate should be well controlled at the optimum value to avoid zone spreading because of the slow flow rate [
27].
3.2. Loading Concentration of Crude Extract on the Fraction Yield and Quercetrin Content
The screening results showed that the yield of fraction and quercetrin content were increased with the increase in sample loading from 3 to 10 mg/mL and declined from 10 to 25 mg/mL (
Figure 3b). With the increase in sample loading, nonpolar substances from the crude extract might occupy the surface of the absorbent and create a hindrance for quercetrin to flow through the cartridge for collection. Hence, the quercetrin content was reduced in the collected fraction after the cartridge achieved saturation. It was also difficult to maintain the required flow rate of eluent at a high concentration of sample loading. Statistical analyses revealed that the yield of fraction was not significantly different between the loading concentration of 5 and 10 mg/mL, and the difference in quercetrin content was also not significant between 10 and 15 mg/mL of sample loading. Therefore, the sample loading would be statistically optimized between 5 and 15 mg/mL to confirm the optimum sample loading for quercetrin recovery.
3.3. Methanol Concentration of Eluent on the Fraction Yield and Quercetrin Content
The eluent composition was also found to affect the yield and quercetrin content in the collected fraction.
Figure 3c shows a significant increment in fraction yield using the eluent system with the increased methanol concentration from 0 to 10%
v/
v. A further increase in methanol concentration did not significantly increase the yield of fraction. On the other hand, the quercetrin content was significantly increased with the use of 0 to 30%
v/
v methanol. There was no significant increment in quercetrin content after the concentration of methanol was increased more than 30%
v/
v. Therefore, the range of eluent composition from 10 to 100%
v/
v methanol was chosen for the subsequent study of optimization.
The eluent composition would affect the van der Waals interaction between the sorbent, mobile phase, and analyte from the crude extract. This would affect the quality of the fraction as different compounds would be recovered from the crude extract. Increasing the methanol concentration would decrease the polarity of the eluent system, and therefore, more relatively non-polar to semi-polar compounds including quercetrin would be eluted out from the SPE cartridge.
3.4. Eluent Volume on the Fraction Yield and Quercetrin Content
The volume of the eluent would cause a small difference in fraction yield between 69.3 and 87.6%, and 27.8 and 22.2 mg/mL for quercetrin content. A slight decrease in fraction yield and quercetrin content was observed after applying a large volume in eluent (>30 mL or >5 cycles) in the fractionation process (
Figure 3d). The decrease in quercetrin could be explained by the elution of other substances from the crude extract, thus lowering the concentration of quercetrin in the fraction. The reversed-phase C18 SPE sorbent was likely to be less selective for quercetrin [
28]. However, there were studies that reported no significant change at high volume of solvent elution for the recovery of phenolic compounds [
29]. Thus, the volume of eluent was set at the range of 6 to 42 mL (1 to 7 cycles) in the subsequent optimization.
Based on the findings of OFAT screening, the pressure of the SPE manifold was fixed at 20 kPa. The other variables such as sample loading (5–15 mg/mL), methanol concentration (10–100% v/v), and eluent volume (6–42 mL) would be statistically optimized in the defined range to obtain a high yield of fraction and quercetrin content from the crude extract of M. malabathricum leaves. Therefore, OFAT screening allows the selection of variables for further optimization at the narrower range. Sorting out significant response variables prior to statistical optimization would be more efficient than direct optimization at a wide range of variables. Even though such an approach of OFAT screening followed by response optimization would have a few more experimental runs, it could produce better results. Response optimization is good for tradeoffs among variables as they are interdependent.
3.5. Optimization for Fractionation of Crude Extract
CCD was used to optimize the independent variables of methanol concentration, loading concentration of crude extract, and eluent volume. The results found that quadratic models were the best fit models for both fraction yield and quercetrin content with high coefficient of determination (R2 > 0.96) and low standard deviations (<4.0). A low predicted residual error sum of square (PRESS) was also observed among the suggested models. The addition of interaction terms in quadratic models did not reduce the adjusted R2 significantly. The difference between R2 and adjusted R2 was small (<0.042). The adjusted R2 would be remarkably reduced compared to R2, if an insignificant term was introduced to the model [
30]. The difference in adjusted R2 and predicted R2 was also <0.13 to explain the goodness of the fit. Kassama et al. [
31] mentioned that statistical parameters such as the significance of regression model, lack of fit, coefficient of determination (R2), and adjusted R2 were sufficient to prove the adequacy and validity of a model.
Table 2 explains the output of ANOVA for both dependent variables such as fraction yield and quercetrin content. The quadratic models were very significant with a
p-value < 0.001. The table also explains that methanol concentration (A) was not a significant variable to influence the yield of fraction, but it significantly affected the quercetrin content in the collected fraction. The interaction of methanol concentration (A) and loading concentration (B), and methanol concentration (A) and eluent volume (C) did not have significant effects on the quercetrin content. Apparently, the quercetrin content appeared to be influenced by the volume of eluent used during fractionation.
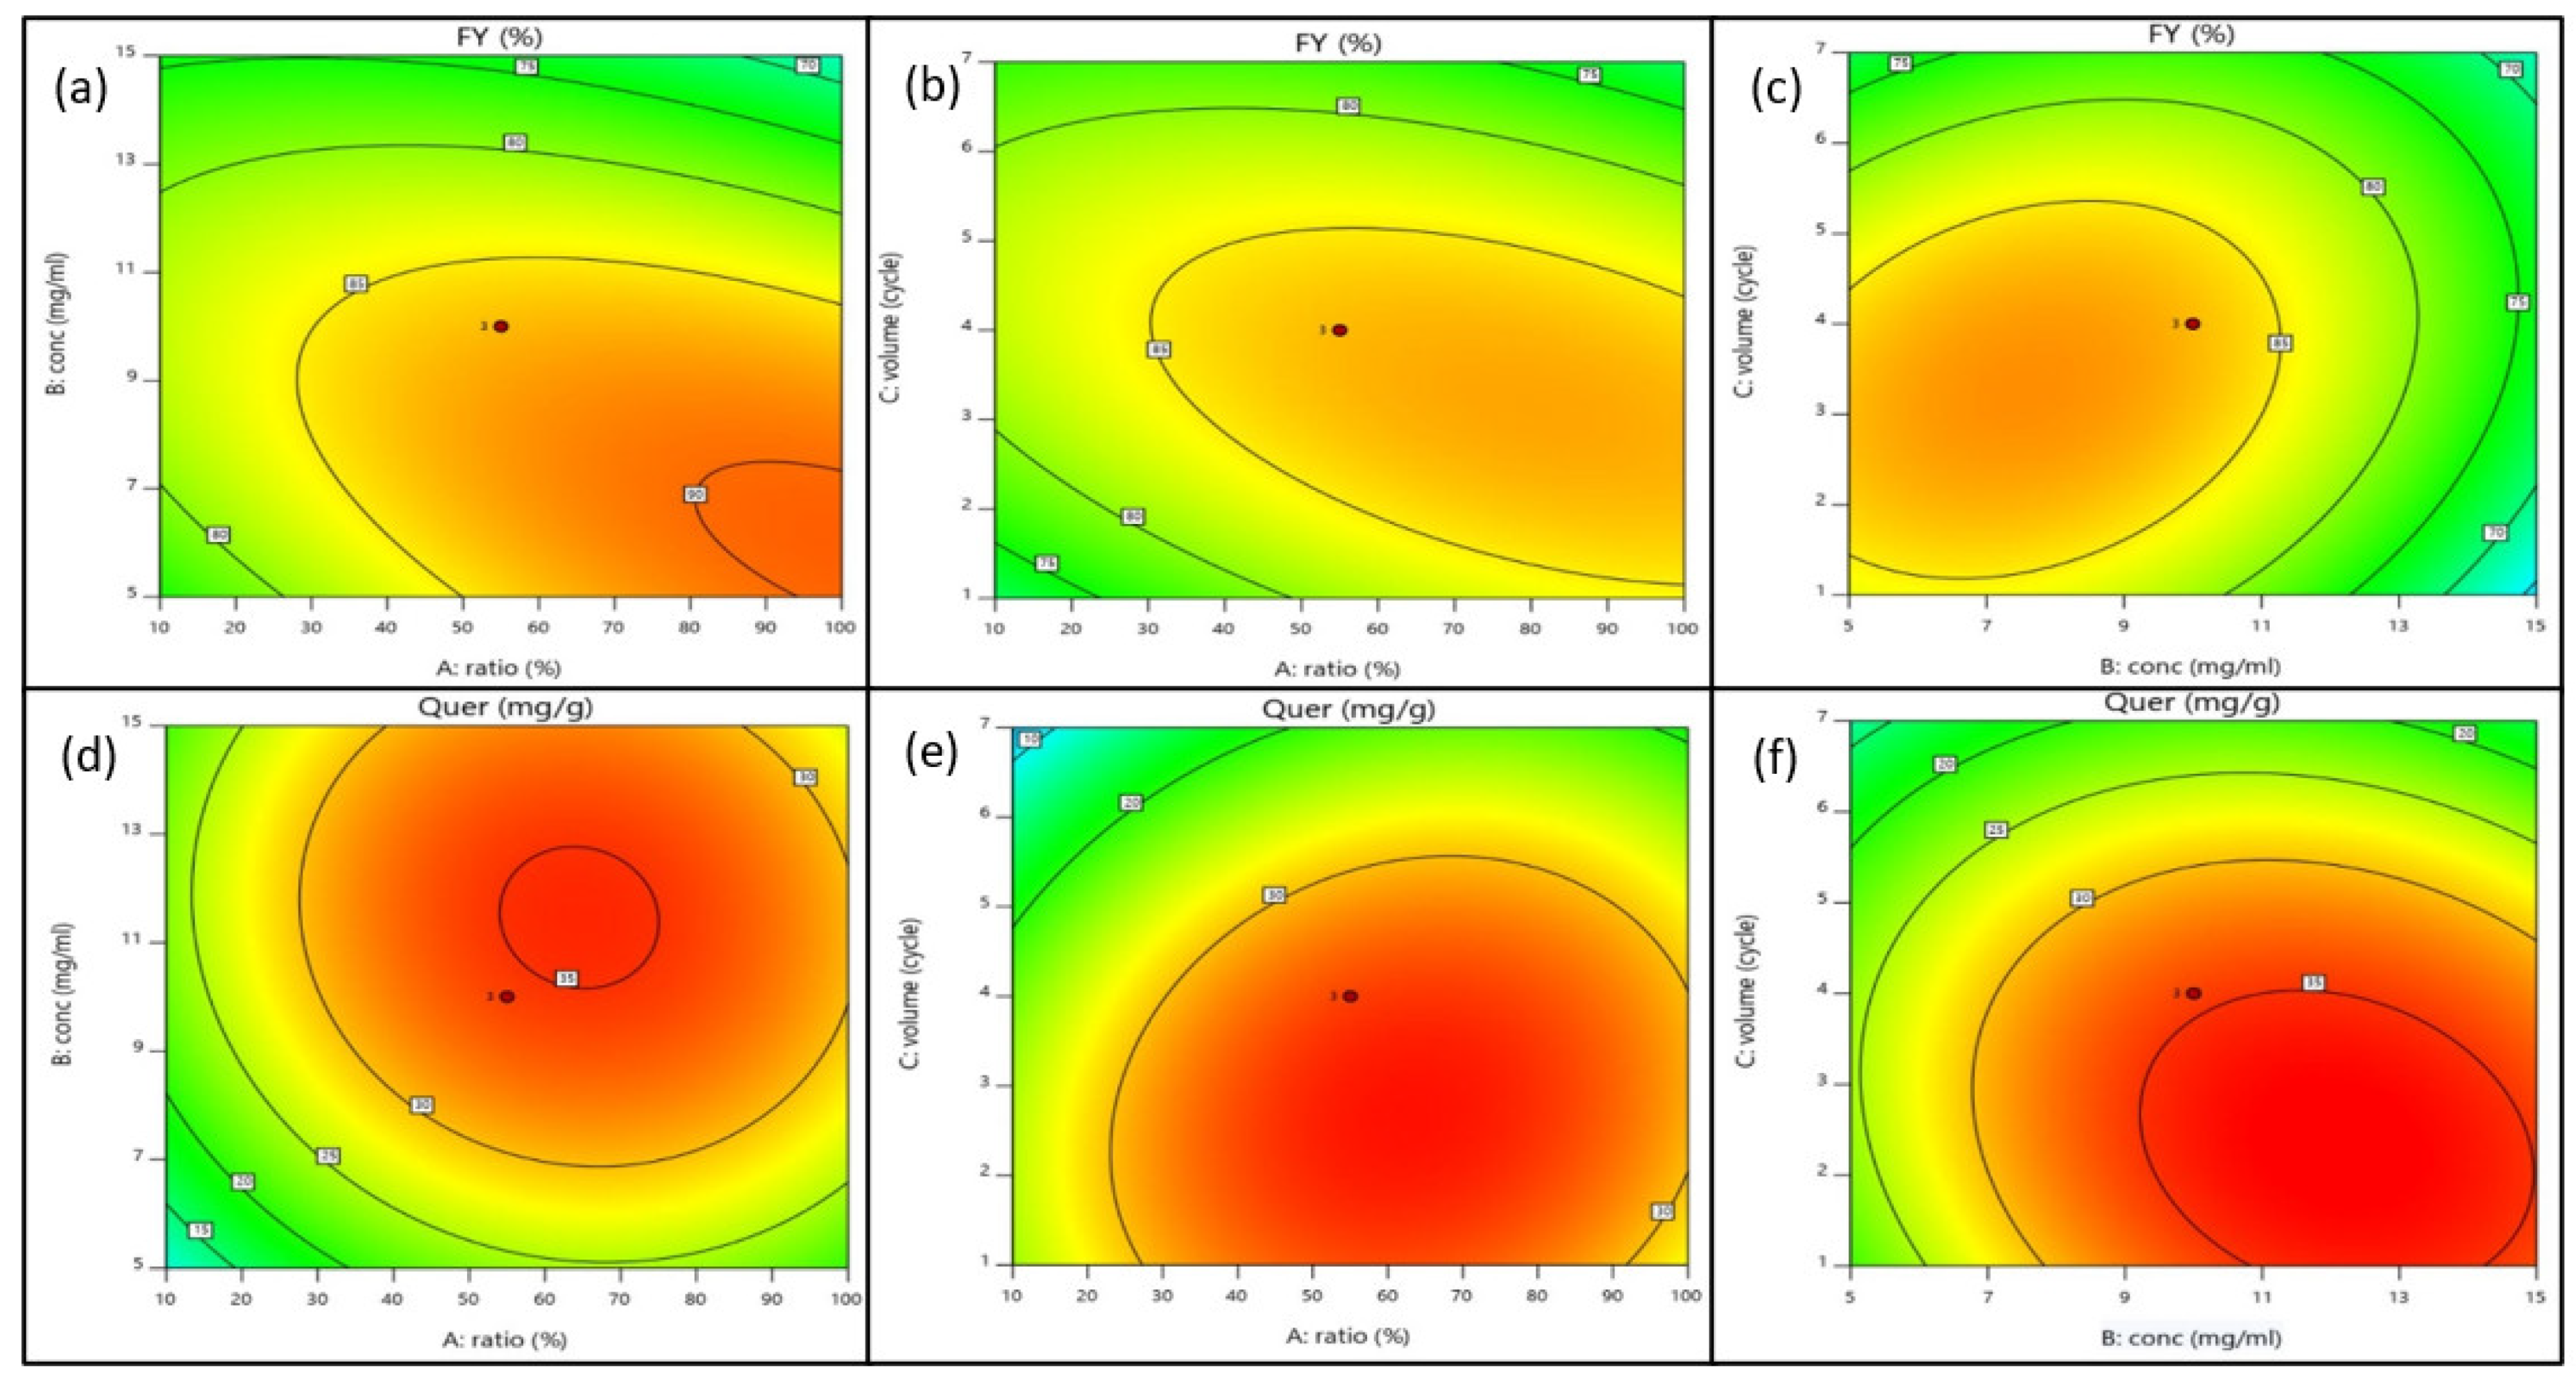
After omitting the insignificant variables, the quadratic models of the fraction yield and quercetrin content can be described as Equations (5) and (6). The response surfaces in relation with the independent variables can be viewed in two-dimensional diagrams, as shown in
Figure 4. The increase in methanol concentration in the eluent system (A) would increase quercetrin content, but not significantly affect the fraction yield. The loading concentration of crude extract (B) would positively affect the fraction yield and quercetrin content. High quercetrin content could be recovered if a higher crude extract was loaded onto the column for fractionation. The increase in eluent volume would elute more compounds into the fraction, thus increasing the fraction yield. The negative coefficient of eluent volume (C) explains its inverse relationship with the quercetrin content as the fraction contained other substances, in addition to quercetrin.
The fraction yield was increased with the increase in sample loading at low methanol concentration. However, the fraction yield was decreased at high methanol concentration. Most probably, the crude extract contained polar compounds that were more effectively eluted by the polar eluent system (low methanol concentration). A similar interaction was also observed for the methanol concentration and eluent volume to produce a high yield of fraction. The fraction yield was found to correlate positively with the interactive term of sample loading and eluent volume (BC). However, the quercetrin content was decreased at high sample loading, and even the saturated SPE cartridge was eluting with a high volume of eluent. Quercetrin was likely blocked due to the mass transfer hindrance along the column. The studies revealed that SPE was reliable and likely for simultaneous extraction and determination for target compound concentration.
Quercetrin content, mg/g (Y2):
3.6. Verification of Suggested Models
The statistical optimization suggests the optimized values for the independent variables as listed in
Table 3. With the optimal values, SPE could produce a high yield of quercetrin-rich fraction. The models were successfully verified because a good agreement between the experimental data and the model predicted values was achieved. There were only small errors, namely 2.7% for fraction yield and 3.1% for quercetrin content. Therefore, the quadratic models could be used to predict the recovery of quercetrin from the fractionation process using SPE.
3.7. Chemical Characterization of Quercetrin-Rich Fraction
HPLC was used to quantify the concentration of quercetrin in the crude extract and its fraction. The chromatograms show that the peak of quercetrin is detected at 12.1 min (
Figure 5). Quercetrin was recovered and concentrated in the fraction after clean up by the SPE cartridge. The result showed about 86.6% of quercetrin could be recovered from the crude extract of
M. malabthricum leaves. The content of quercetrin was increased from 1%
w/
w in crude extract to 4%
w/
w in the fraction after SPE-based fractionation.
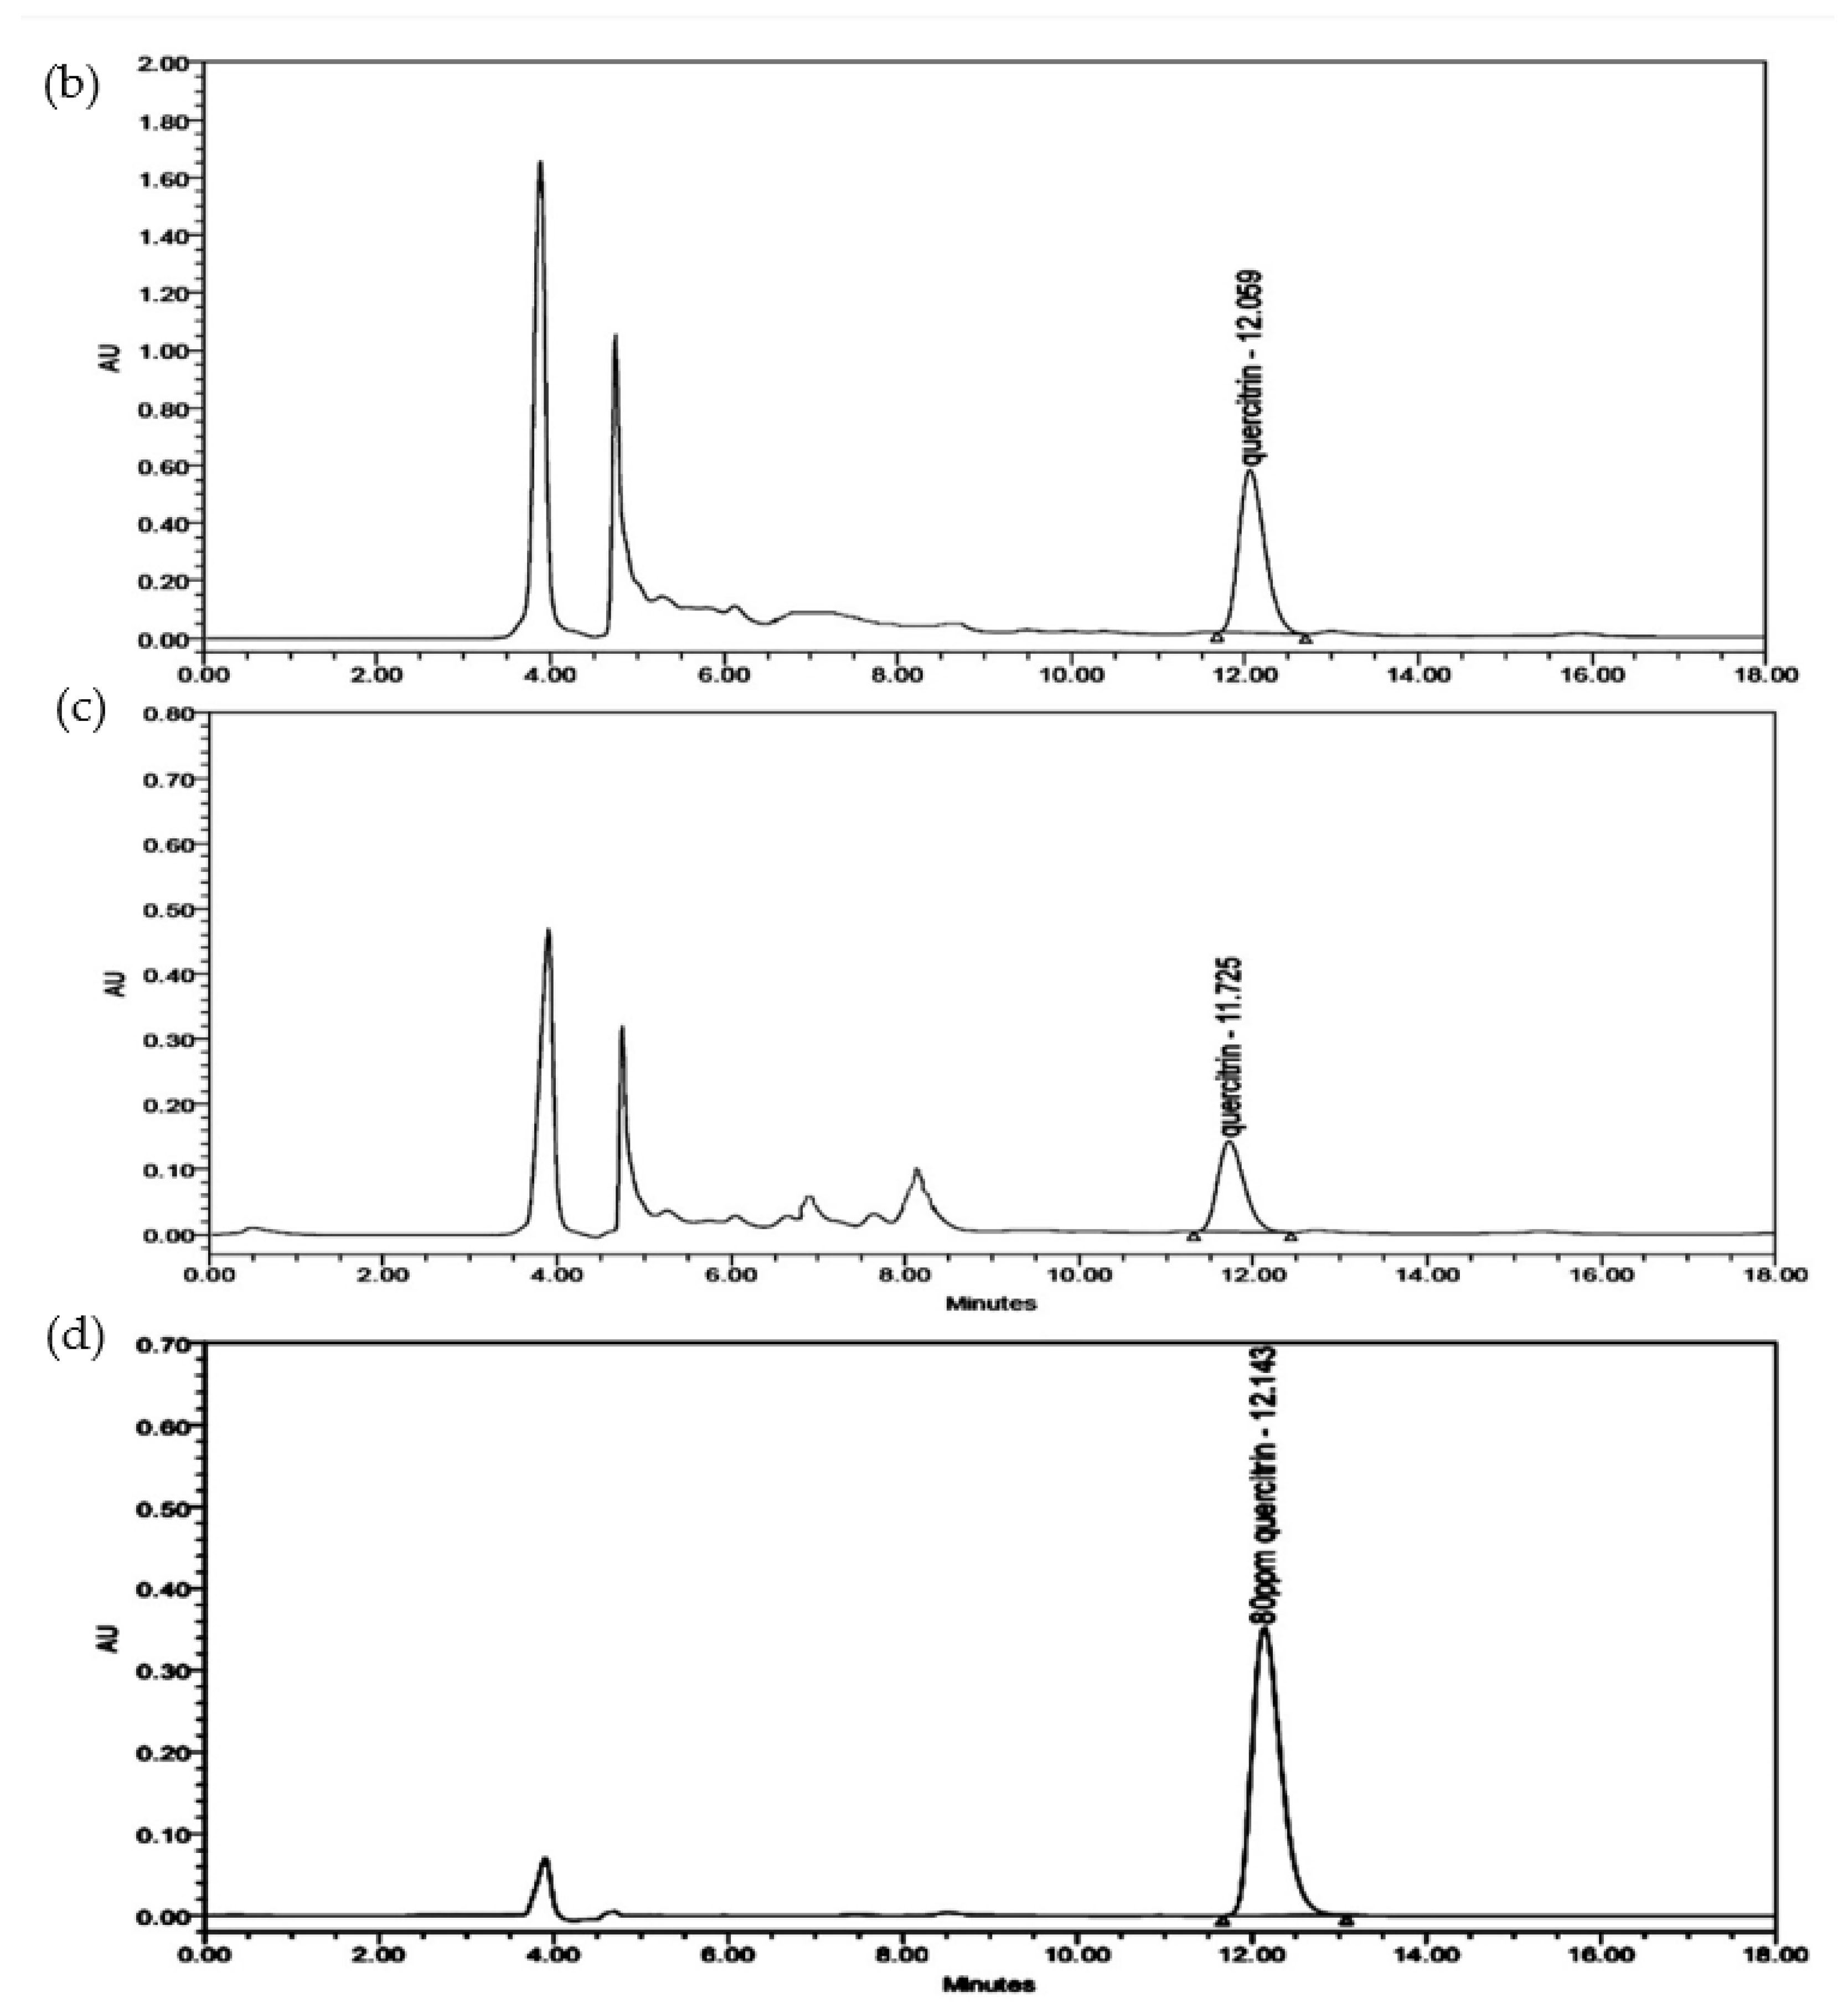
The presence of quercetrin in the fraction could also be proven by matching the detected functional groups to those of standard quercetrin (
Figure 6). The spectrum clearly showed a good match of quercetrin-rich fraction to the spectrum of standard quercetrin, except the loss of a sharp band at 1740 cm
−1 (C=O stretching). The loss was probably due to the strong hydrogen bonding with other constituents in the fraction. The existence of the hydrogen bonding could also be proven from the disappearance of a few bands at 1369.56 cm
−1 (O-H bending) and 1230–1200 cm
−1 (C-O stretching) from the fraction. The other functional groups of quercetrin included the broad band of O-H stretching at 3318.54 cm
−1, O-H bending at 1415.93 cm
−1, C-H stretching at 2943.89 cm
−1 and 2832.48 cm
−1, C-H bending at 1449.33 cm
−1, C=C stretching at 1658.46 cm
−1, and C=C bending at 684.26 cm
−1. C-O stretching consisting of an aliphatic ether (1114.19 cm
−1) and a sharp alkyl aryl ether (1020.86 cm
−1) was also found in the fraction.
3.8. In Silico Simulation of Dipeptidylpepetidase-IV Docking
In silico simulation was performed to predict the antidiabetic property of quercetrin by molecular docking with DPP-IV. The results of the simulation are presented in
Table 4. It is shown that quercetrin had comparable binding energy with sitagliptin. The difference in the binding energy was relatively small, explaining how quercetrin could be a potential lead for diabetic drug development. The low binding energy between the ligand (quercetrin) and target molecule (DPP-IV) explains the stronger interaction, thus promoting antidiabetic activity [
32].
Quercetrin was mostly interacting with the amino acid residues of DPP-IV by hydrogen bonding. The interacting amino acids were negatively charged glutamic acid, positively charged arginine, and highly electronegative aromatic tyrosine and phenylalanine. This was because quercetrin is a glycosylated flavonol with the hydrophilic nature. On the other hand, sitagliptin interacted with the residues with electrostatic bonding as it had strong electronegativity due to the presence of fluorides in the molecular structure. Hence, the molecular action of quercetrin would be different from the inhibitory action exhibited by sitagliptin. The effectiveness of quercetrin to inhibit the active sites of DPP-IV and to exhibit the antidiabetic property was also experimentally proven in the calorimetric DPP-IV assay.
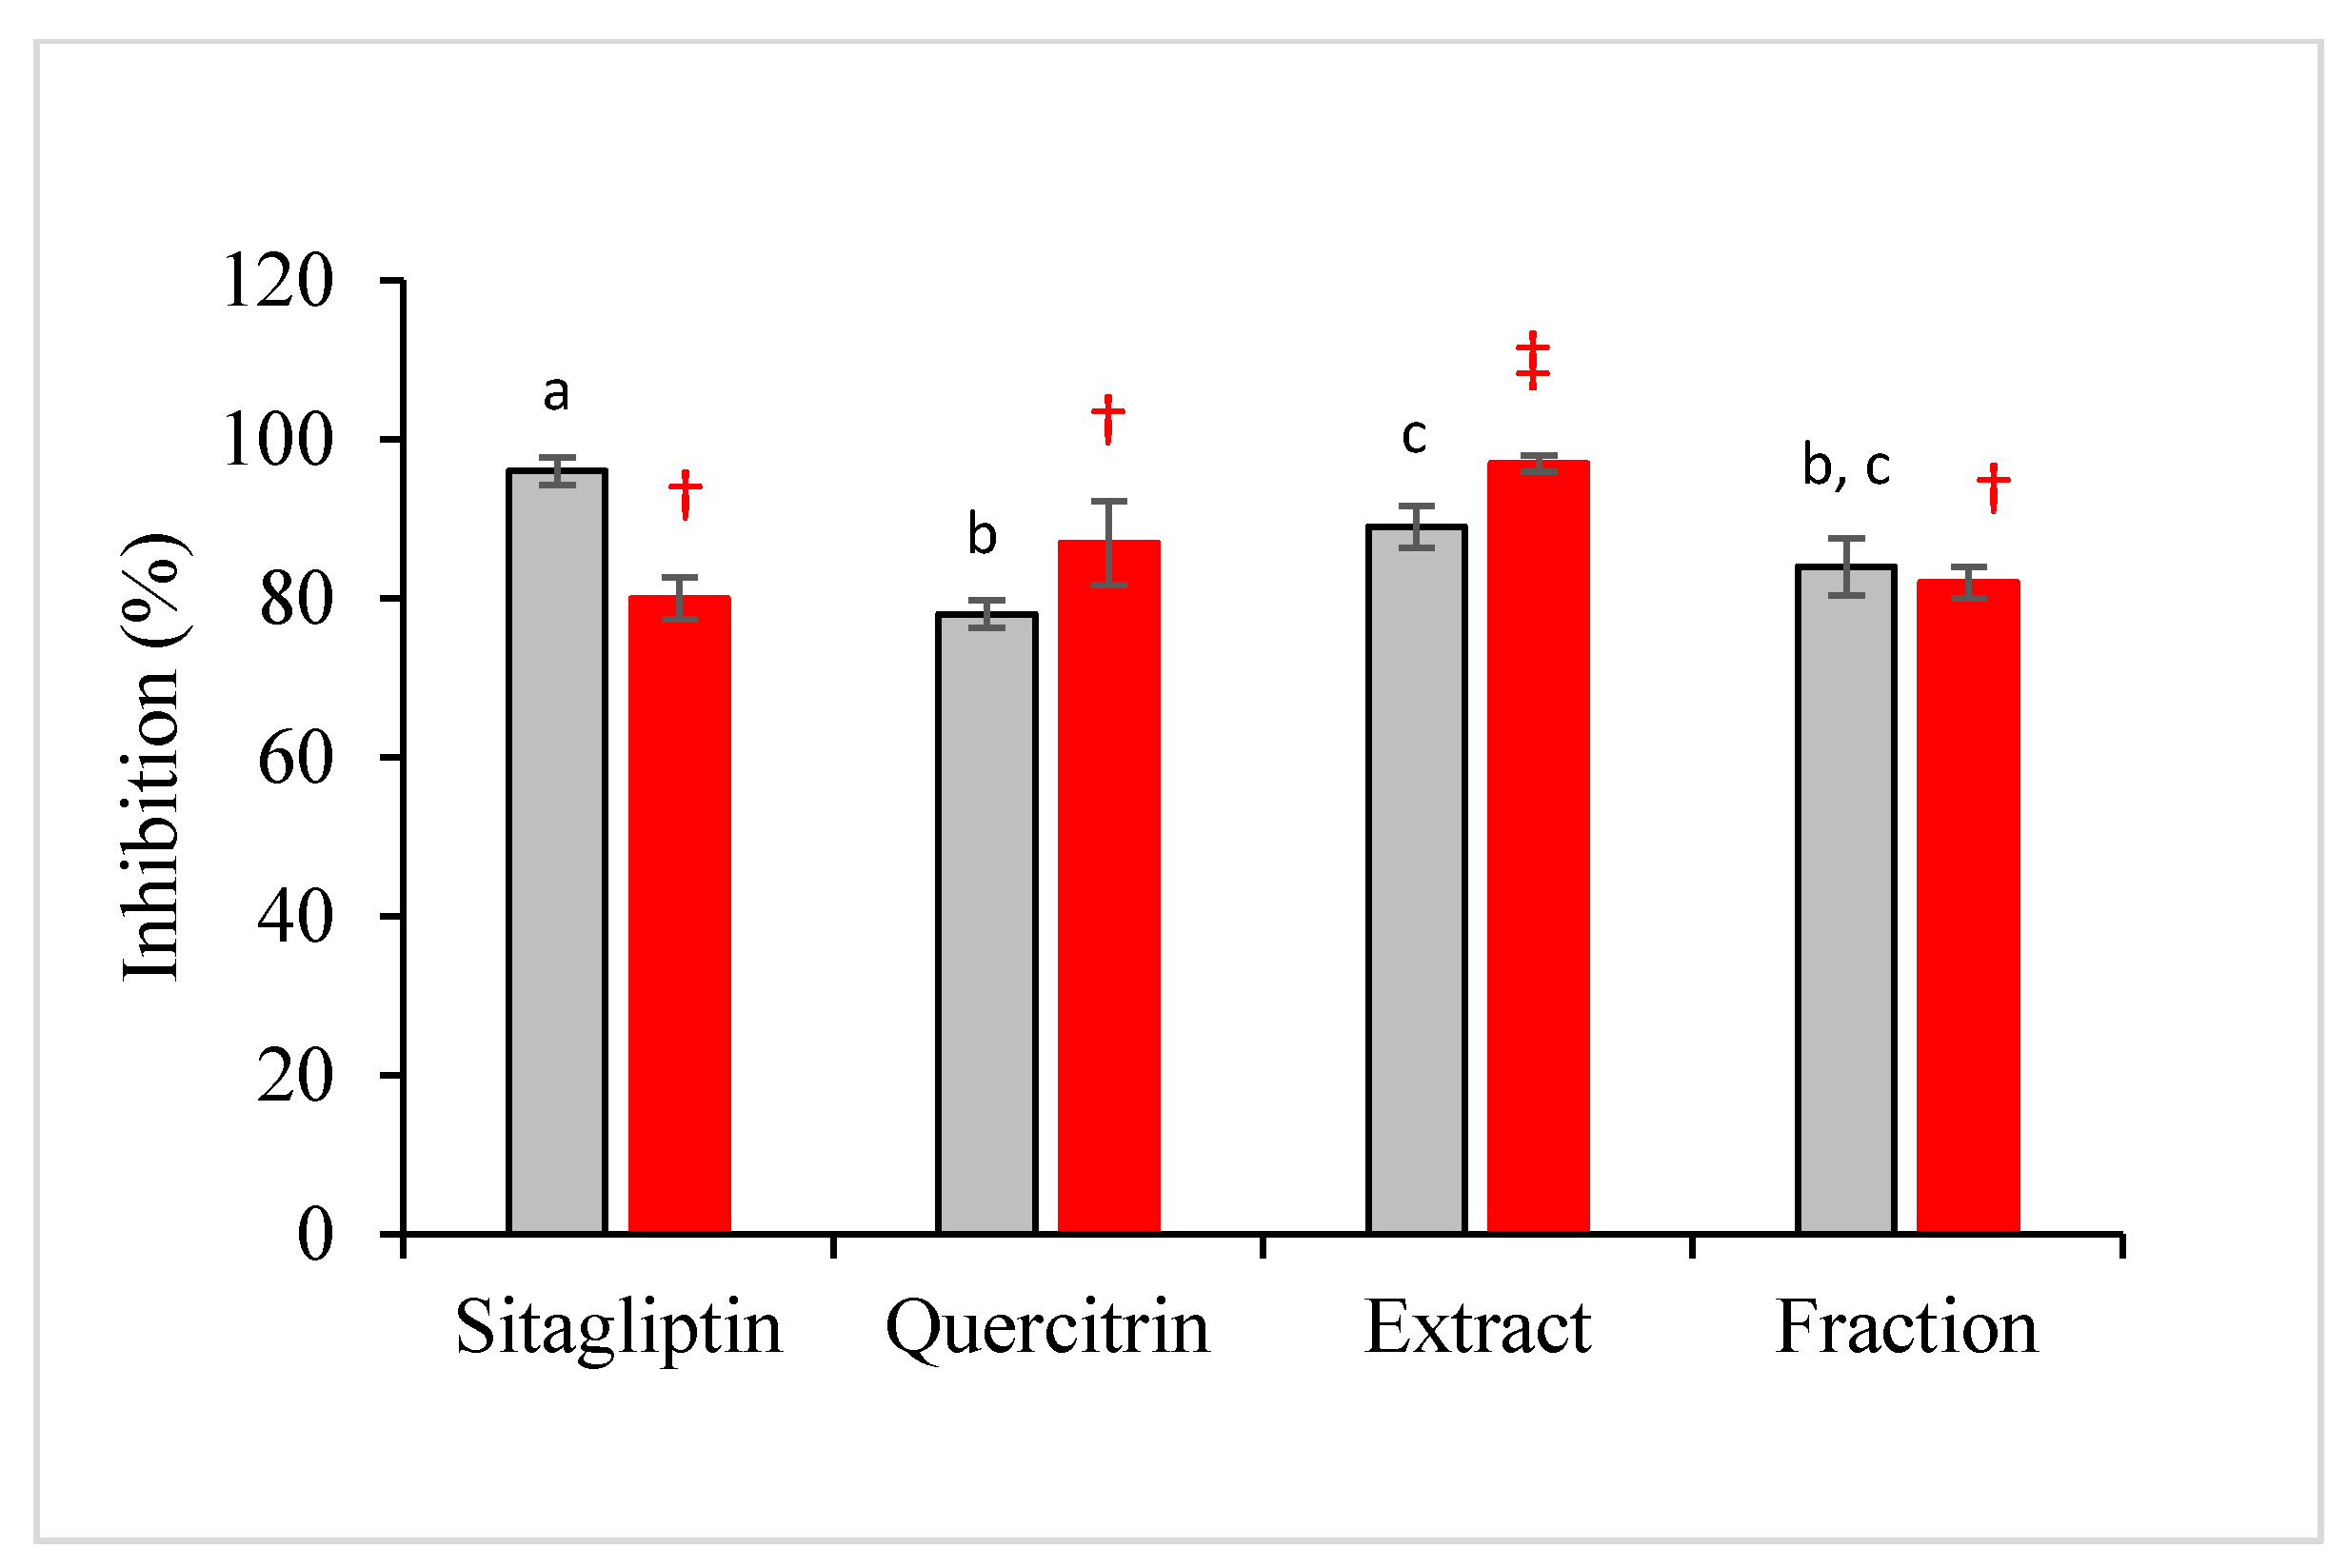
3.9. Anti-Diabetic Activity of Crude Extract and Fraction
The simulation was then experimentally validated using recombinant DPP-IV in a calorimetric assay. The inhibition of DPP-IV has been proven as an effective and safe therapy for the treatment of type II diabetes mellitus since the last decade [
33,
34]. The results showed that the antidiabetic property of
M. malabathricum was mainly contributed by quercetrin and partly attributed to other plant constituents. This can be seen from
Figure 7 in which the inhibition of fraction was not significantly different from standard quercetrin. The performance of crude extract was significantly higher than that of standard quercetrin, but not significantly different from that of the fraction.
In the present study, the antioxidant capacity of samples based on the scavenging activity of radical DPPH was also performed. It is believed that the sample or compound with high antidiabetic property would also exhibit high antioxidative performance. Interestingly, the antioxidant activity of the fraction was not significantly different from the performance of standard quercetrin and standard drug, sitagliptin. Quercetrin that was successfully recovered from the crude extract of M. malabathricum would have a comparable performance with sitagliptin in quenching the radical chains.
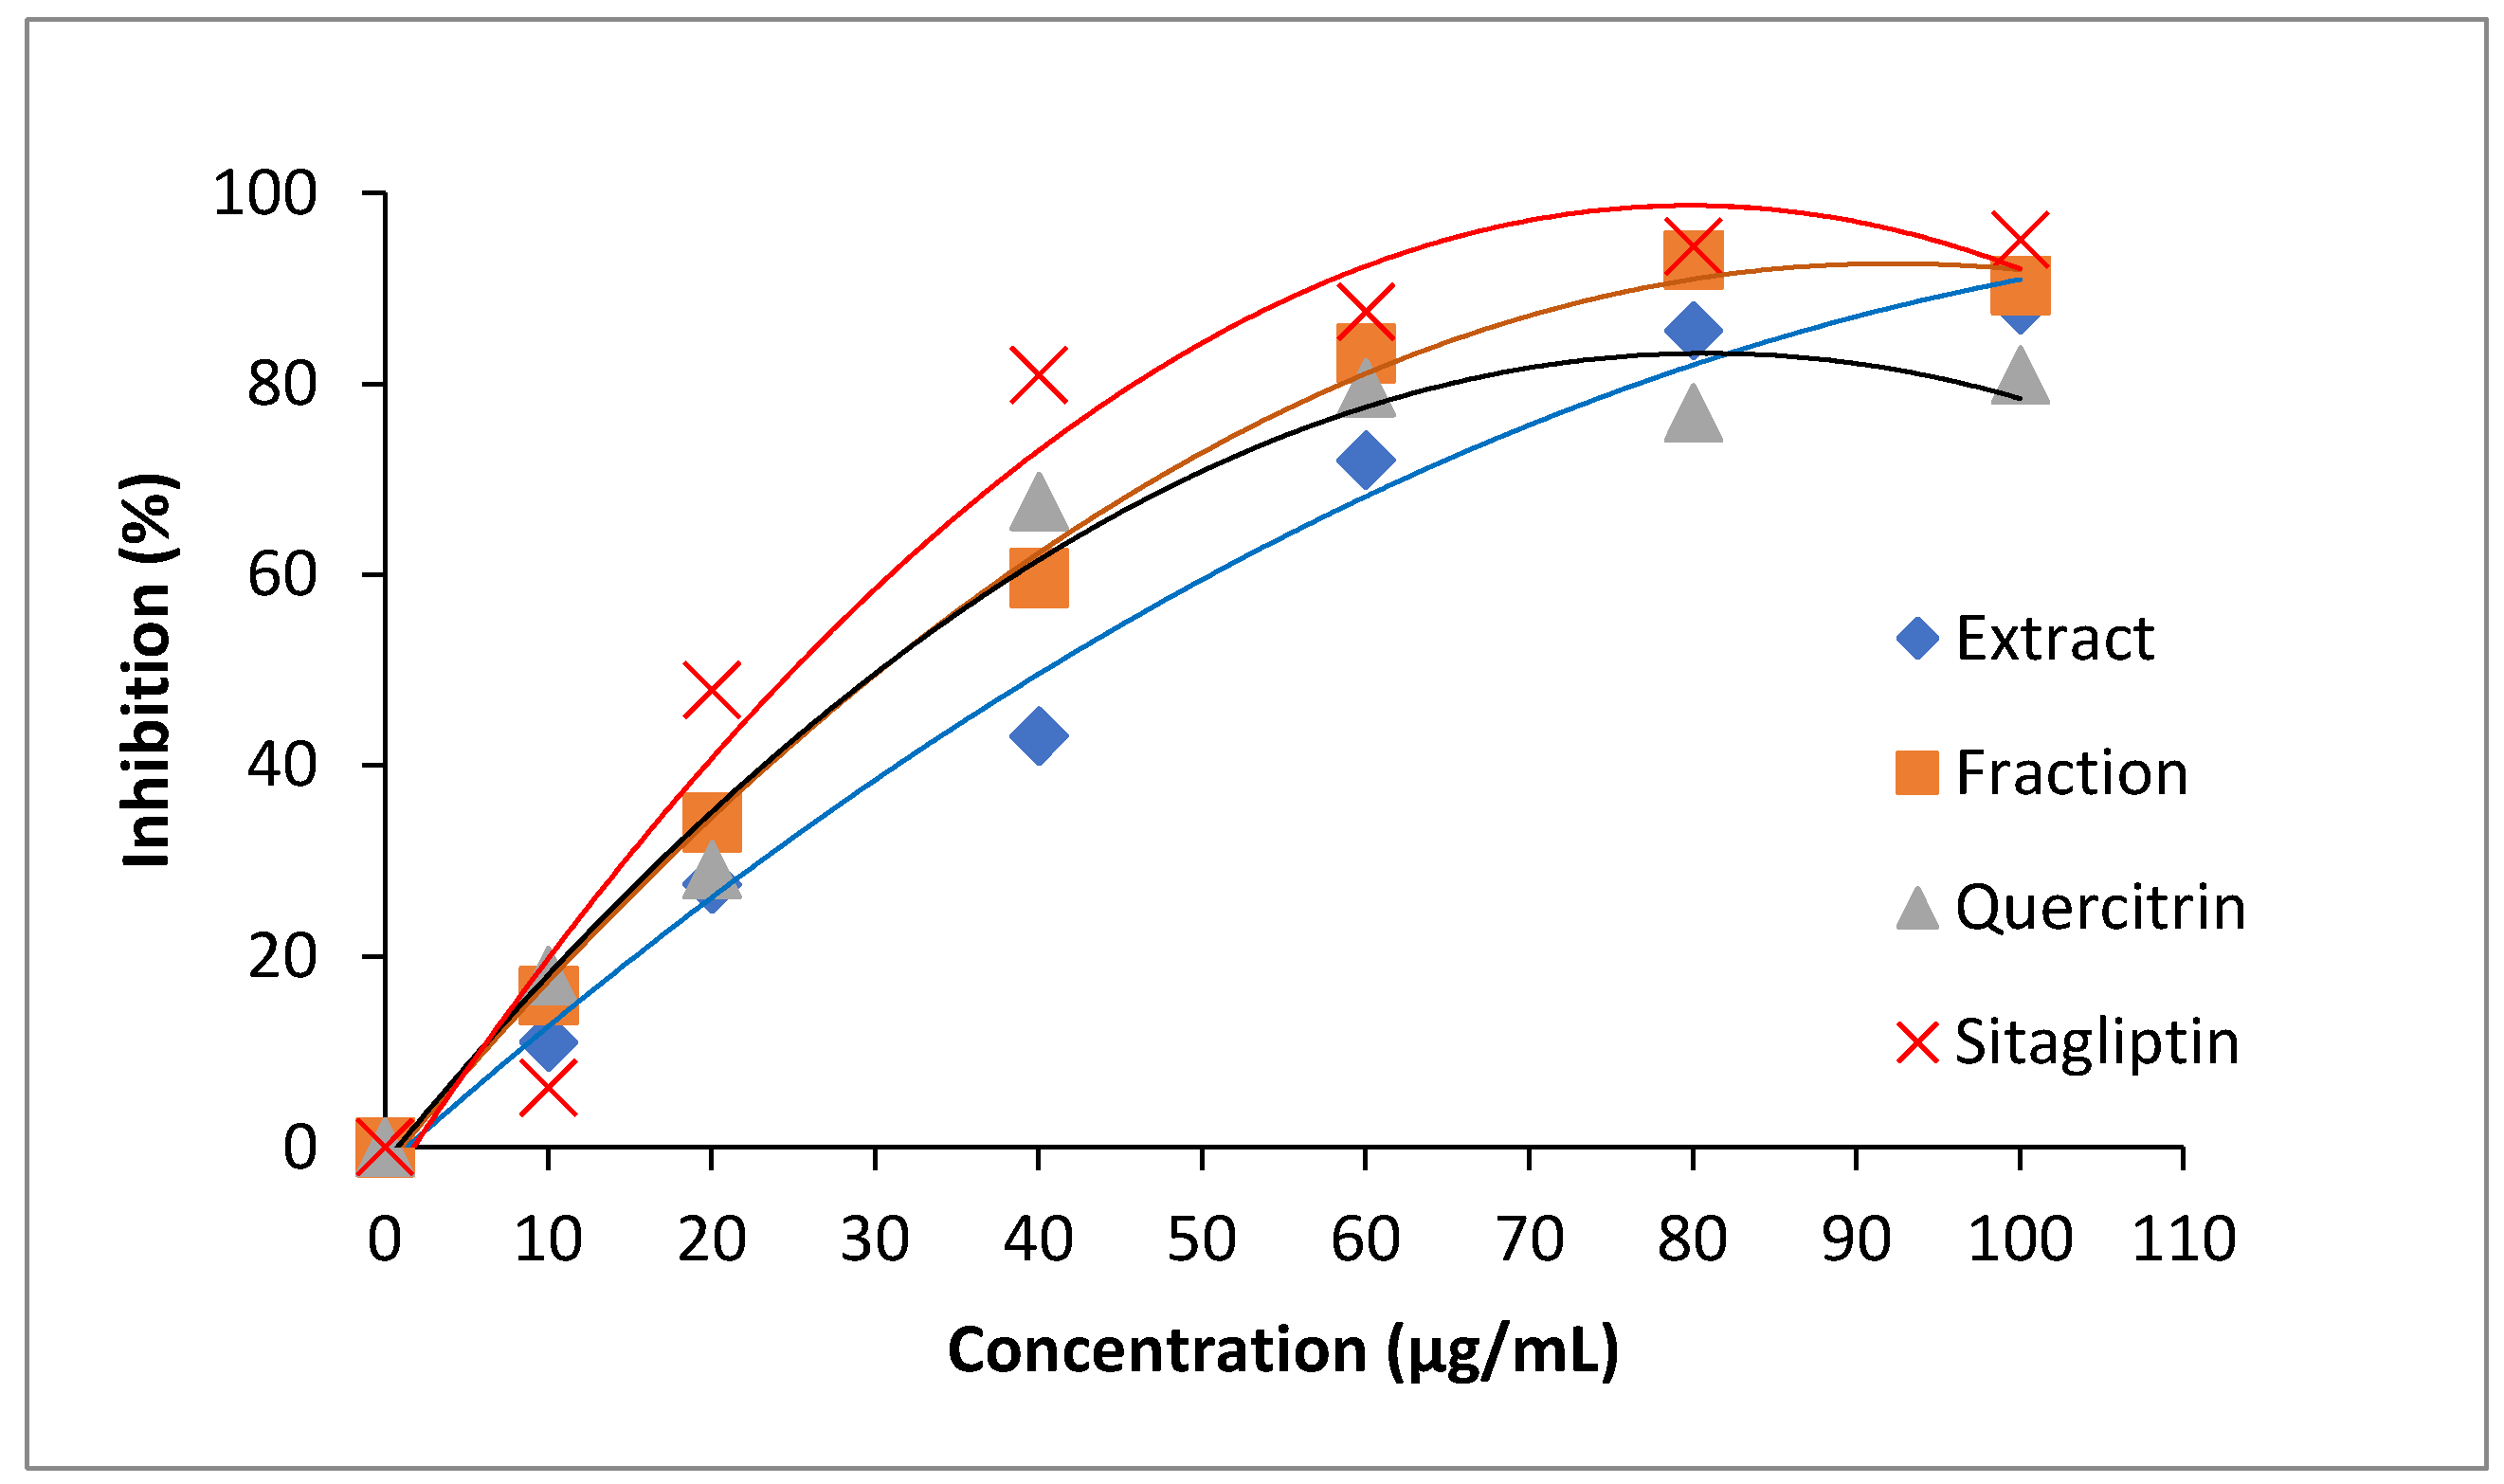
Owing to the small difference in antidiabetic activities, all samples were prepared in different concentrations and monitored for inhibitory progress. A sharp increment in inhibitory action was observed for all samples at the concentration range from 0 to 60 µg/mL (
Figure 8). The inhibitory progress was slowed down after 60 µg/mL. Sitagliptin was found to have the highest increment in antidiabetic activity, whereas the crude extract showed the lowest increment in a concentration-dependent manner. The inhibitory progresses of standard quercetrin and fraction were almost similar at the lower range of concentration (<40 µg/mL). Obviously, the fraction could achieve higher performance than standard quercetrin at the concentration higher than 40 µg/mL.
In the subsequent experiments, the value of IC50 was used to quantitatively compare the performance of samples. The lower IC50 would provide higher antidiabetic activity because a lower concentration of the sample was required to achieve 50% DPP-IV inhibition. Therefore, the antidiabetic activity of crude extract, fraction, quercetrin, and sitagliptin was in ascending order as their IC50 values were found to be 48.25 µg/mL, 30.71 µg/mL, 27.29 µg/mL, and 21.54 µg/mL, respectively. The inhibition of DPP-IV is known to relieve diabetic symptoms. The inhibition would decrease the fasting blood glucose level, increase insulin secretion, and improve oral glucose tolerance tests in animal studies [
35]. The good performance of quercetrin is the antidiabetic property, most probably due to the presence of hydroxyl groups in the basic chemical structure [
36]. Previously, Sarian et al. [
37] also mentioned that the number of hydroxyl groups substantially influenced the activity of anti-diabetes.


