1. Introduction
The contaminants in mine water mainly contain a mixture of water and fine coal dust, which is characterized by high turbidity and fine and uneven solids particle size. It has a suspended and colloidal nature and is difficult to clarify naturally [
1,
2]. Coagulation, flocculation and sedimentation are considered to be the most common processes for particle removal [
3,
4,
5]. Compared with other methods, these processes improved the removal efficiency of suspended solids by charge neutralization and sweeping effects [
6,
7,
8,
9]. For the treatment of mine water, polyaluminum chloride (PACl) and polyacrylamide (PAM) were found to be the most effective coagulant and flocculent, respectively [
10,
11]. Magnetic flocculation (MF) is an effective enhanced flocculation technology applied to water treatment. Under the influence of magnetic seeds, magnetic flocculation enhances the formation of particles and accelerates the sedimentation process [
12,
13]. Suspended solids (SS) and turbidity were used as the two main parameters to evaluate the effluent treatment efficiency [
14,
15].
Colloids (0.01 and 0.1 μm) and small solids (10 and 100 μm) were mainly removed from natural water. Because the sedimentation process mainly removes larger particles, the flocculation efficiency (the aggregation of smaller particles into larger flocs) is very important [
16,
17]. Therefore, it is very important to directly measure and monitor the particle size distribution (PSD) in the process of particle separation and sedimentation [
18,
19,
20]. The on-line particle counter can measure the number of particles and the distribution of particles with different sizes. This device was widely used in the real-time measurement of PSD. Compared with the suspended solids analyzer and turbid meter, the results of the particle counter are more accurate, because it has higher sensitivity to small particles and can provide better particle characterization information at the micro scale [
21,
22,
23]. In water treatment plants, particle counters are increasingly used to monitor water quality [
24,
25,
26,
27].
Coal mine water comes from a variety of sources resulting in different water quality. Even with the same source, water quality varies greatly. Water quality parameters such as the surge volume, solid content and particle size fluctuate widely [
28,
29]. Traditional coal mine water treatment using conventional coagulation–flocculation and sedimentation processes has the disadvantage of a large footprint, long hydraulic residence time and high operating costs.
Menezes investigated coagulation and flocculation in a dynamic separator based on rotary motion to remove silica (500 mg/L) and clay particles (50 mg/L) [
30]. Rosa used flocculation and flotation processes to produce aerated polymeric flocs of emulsified oil dispersions, which were then separated in centrifugal cells [
31]. Puprasert used the micro-bubbles to separate aerated flocs formed by coagulation and flocculation in the hydrocyclone [
32]. However, they do not have a compact system that combines coagulation, flocculation and separation at the same time.
In this study, in response to the difficulty of treating mine water, the cone-plate clarifier process was proposed. The flocculation and separation efficiency can be improved under the action of the cyclonic and gravitational fields in the cone-plate clarifier. The centrifugal force accelerated the collision rate of the flocs. The larger particle moved radially towards the outer wall under centrifugal force and settled to the bottom of the conical part under gravity. The cone-plate increased the settling area of the flocs and the smaller flocs flocculated and settled again at the cone-plate. SS and turbidity at the inlet and outlet were measured to calculate ss and turbidity removal rates. The whole process of the continuous evolution of the floc properties was systematically monitored and analyzed by testing the particle count at 15 points in the cone-plate clarifier, so as to reflect the flocs’ state in the actual flocculation and sedimentation process to the greatest extent. On the basis of the previous studies, the structure of the cone-plate clarifier was further optimized. The influence of the cylinder height, cone-plate insertion depth and cone-plate spacing on the flocculation effect was investigated to maximize the efficiency of the particle separation performance. This results in a shorter hydraulic residence time, a smaller footprint and lower operating costs.
2. Materials and Methods
2.1. Materials and Detecting Equipment
This research focuses on coal mine water that came from a mine in Ningxia, China. The SS value of coal mine water was measured by an SS meter (SS-1Z, Shanghai Haizheng Electronic Technology Co., Ltd., Shanghai, China) and the turbidity value was obtained by a turbidity meter (WGZ-1b, Shanghai Lichen Instrument Technology Co., Ltd., Shanghai, China). The quality of coal mine water is unstable, with SS fluctuating between 300 and 400 mg/L and turbidity varying between 50 and 100 NTU. A particle counter (2200PCX, HACH, Loveland, CO, USA) was used to measure the number of particles with different particle sizes. The experiments were carried out in the coal mine water treatment laboratory. Raw water can be delivered to the experimental equipment by a submersible pump in the coal mine water pool. The rated flow rate of the submersible pump was 1.5 m3/h. According to previous studies, the flow rate through the system is regulated to 0.6 m3/h using a back flow valve.
A large number of coagulants and flocculants have been investigated for the treatment of mine water. After initial screening by tests, several commonly used coagulants and flocculants were initially selected for further detailed study. Three different types of coagulant commonly used in generic water treatment plants were studied: Poly-aluminum chloride (PACl), ferric chloride (FeCl3) and aluminum sulfate (Al2(SO4)3). Three different flocculants were tested: Cationic, anionic and non-ionic polyacrylamide (PAM). Magnetic seeds (Fe3O4) with two different mesh sizes (200 mesh and 300 mesh) have also been studied. An experimental study was carried out on coal mine water in order to evaluate the effectiveness of coagulants and flocculants and to select the most suitable coagulant and flocculant. The following procedures were carried out: Firstly, the screening and selection of suitable coagulants; secondly, optimization of the coagulant dosage; thirdly, determination of suitable flocculants; fourthly, optimization of the flocculant dosage; fifthly, determination of suitable mesh size for Fe3O4, and finally, optimization of Fe3O4.
According to previous studies, in the present experiment, polyaluminum chloride (PACl) was used as the coagulant. Anionic polyacrylamide (PAM) with a molecular weight of 12 million was chosen as the flocculent to form colloidal aggregates. Fe3O4 with a mesh size of 200 was selected as the magnetic seed. The stock solutions were prepared by dissolving the reagents in a deionized solution. The dosage, concentration and addition order of the three chemicals were determined by the beaker test. The concentrations of PACl solutions and PAM solutions were 1% and 3‰, respectively. PACl was first added during the test, and its dosage was 60 mg/L. Then the magnetic seeds were added with a dosage of 40 mg/L. Finally, PAM was injected with a dosage of 6 mg/L. The flow rate of the peristaltic pump was between 0 and 2280 mL/min. The peristaltic pump flow rates were 60 mL/min, 8 mL/min and 20 mL/min for the addition of PACl, the magnetic seed and PAM, respectively.
2.2. Experimental Apparatus and Monitoring System
The coal mine water treatment system was set up as a continuous-flow reactor in this experiment.
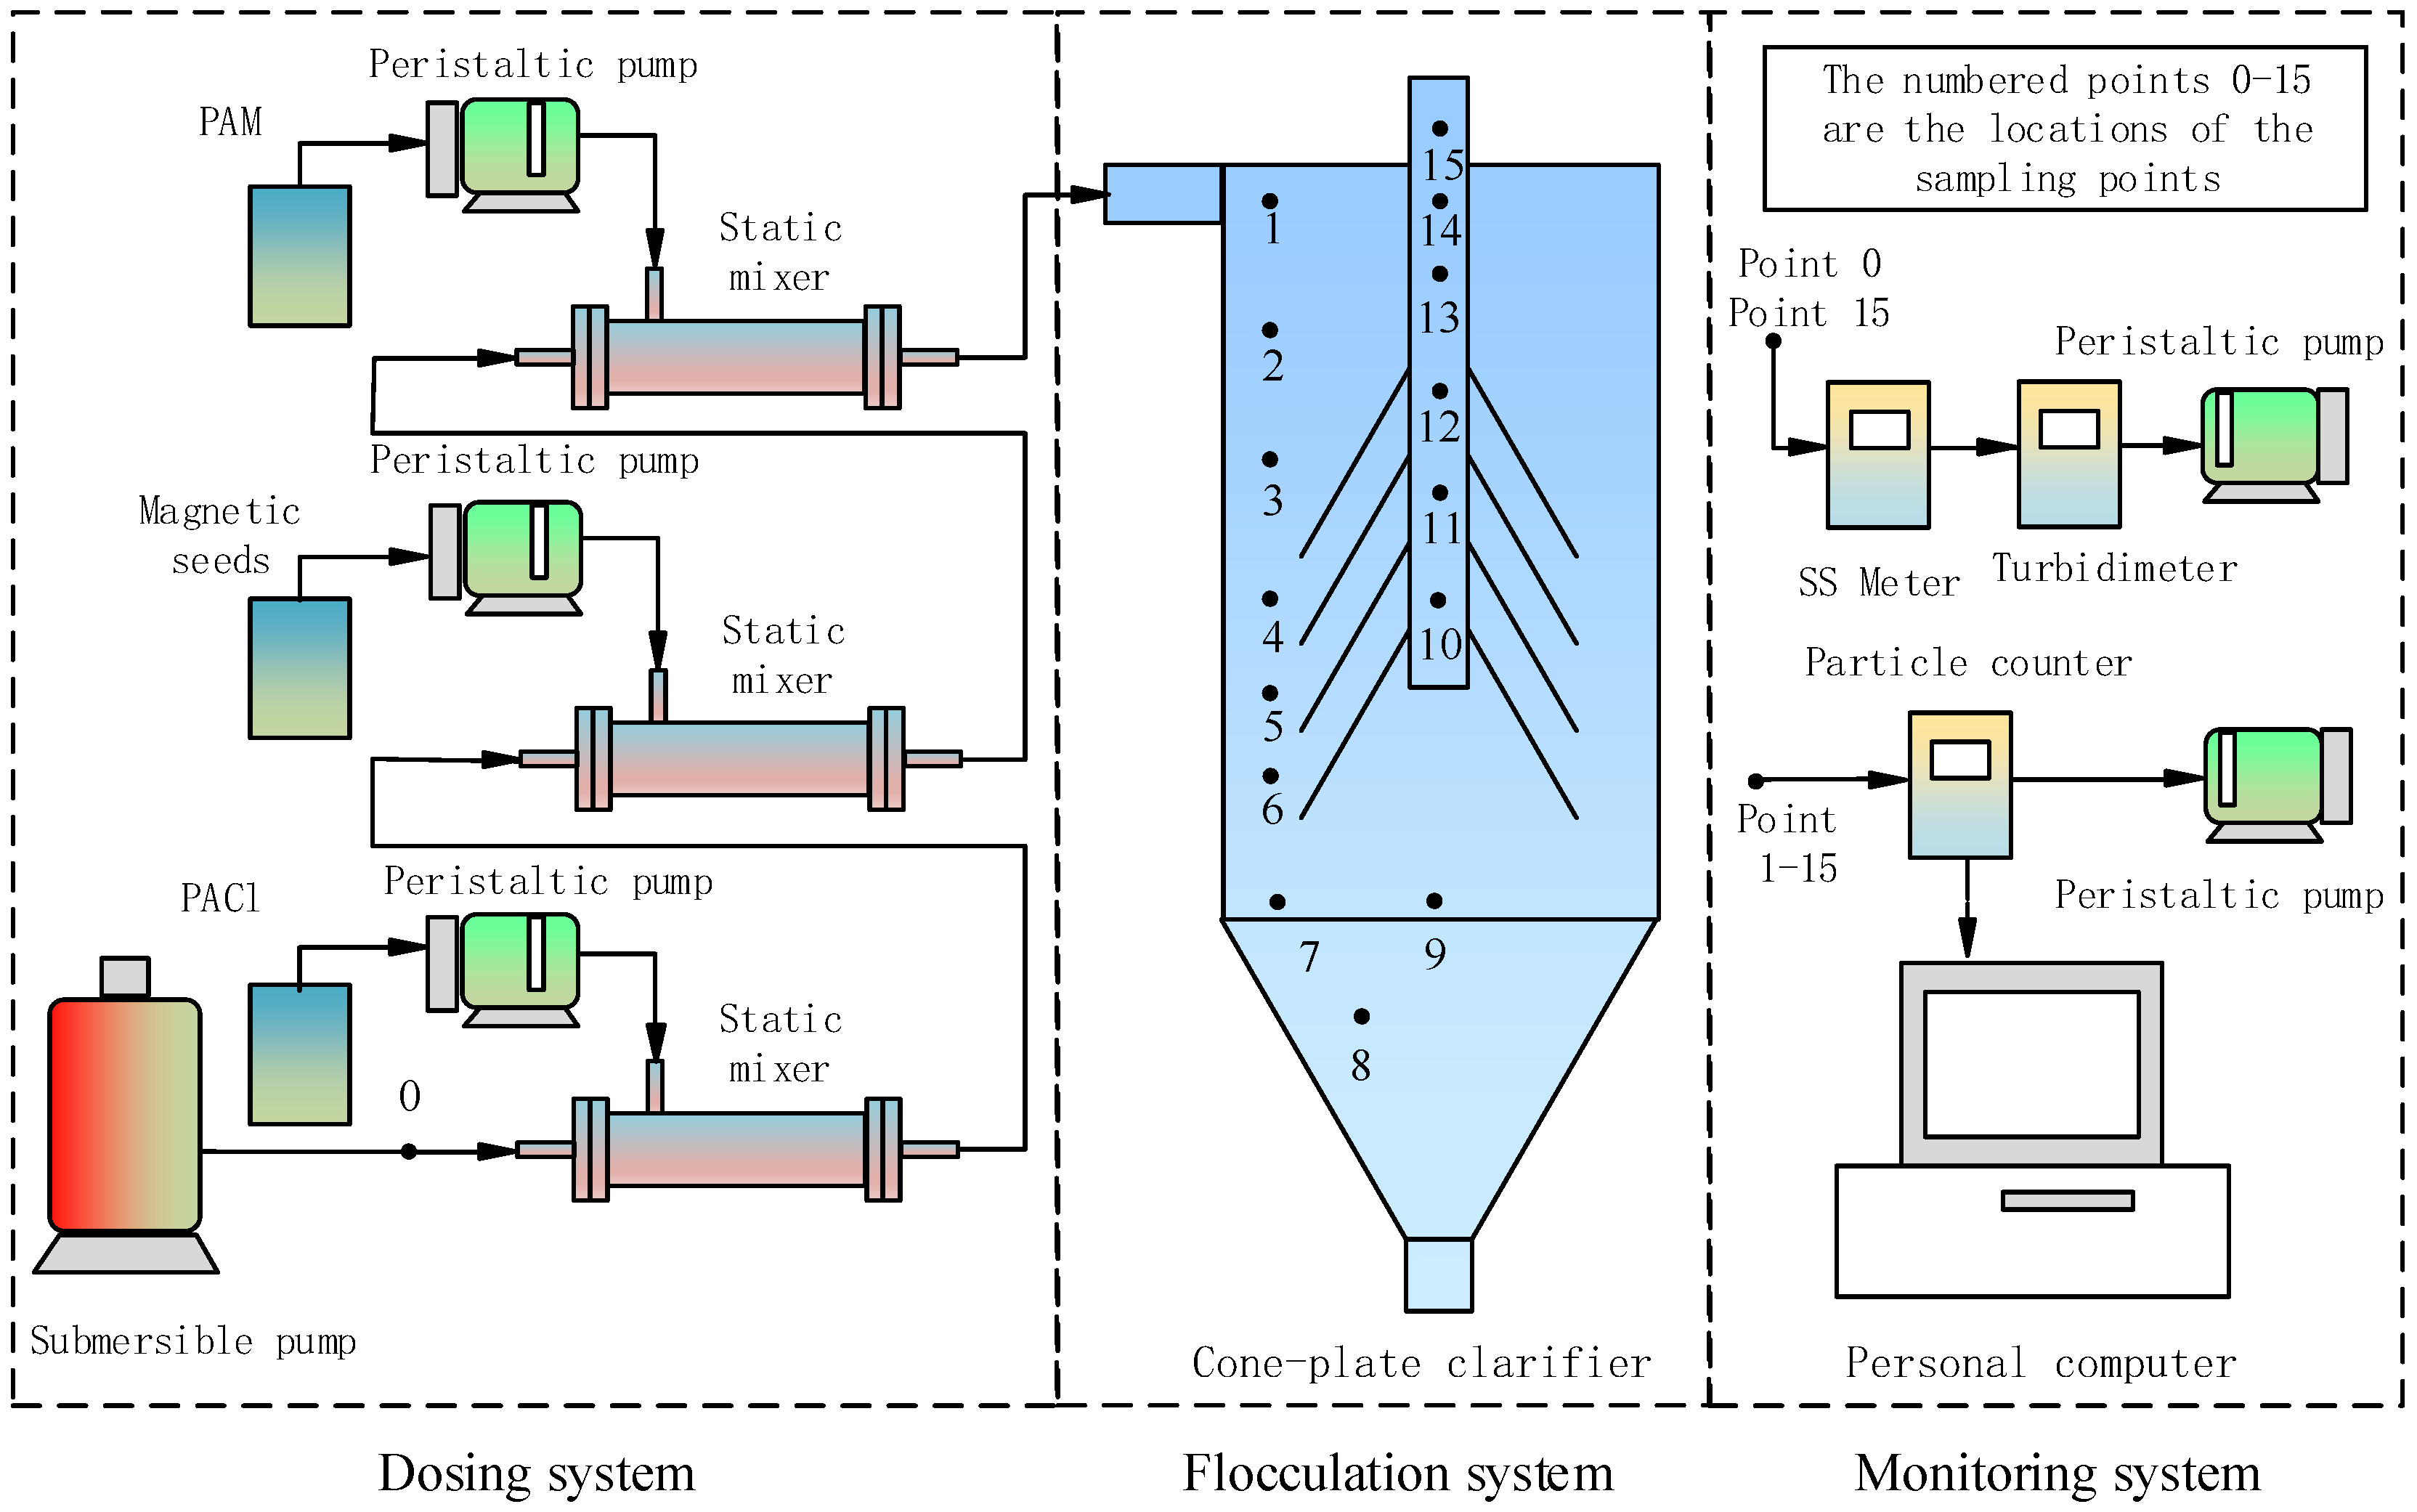
Figure 1 shows the schematic diagram of the system including a dosing system, a flocculation system and a monitoring system.
The dosing system consisted of a submersible pump, a peristaltic pump and a static mixer. The submersible pump was connected to the first static mixer for pumping coal mineral water into the system. The last static mixer was connected to the flocculation system. The peristaltic pump was connected to the static mixer between the submersible pump and the flocculation system to add the stocked chemicals to the system. There was a series connection between static mixers.
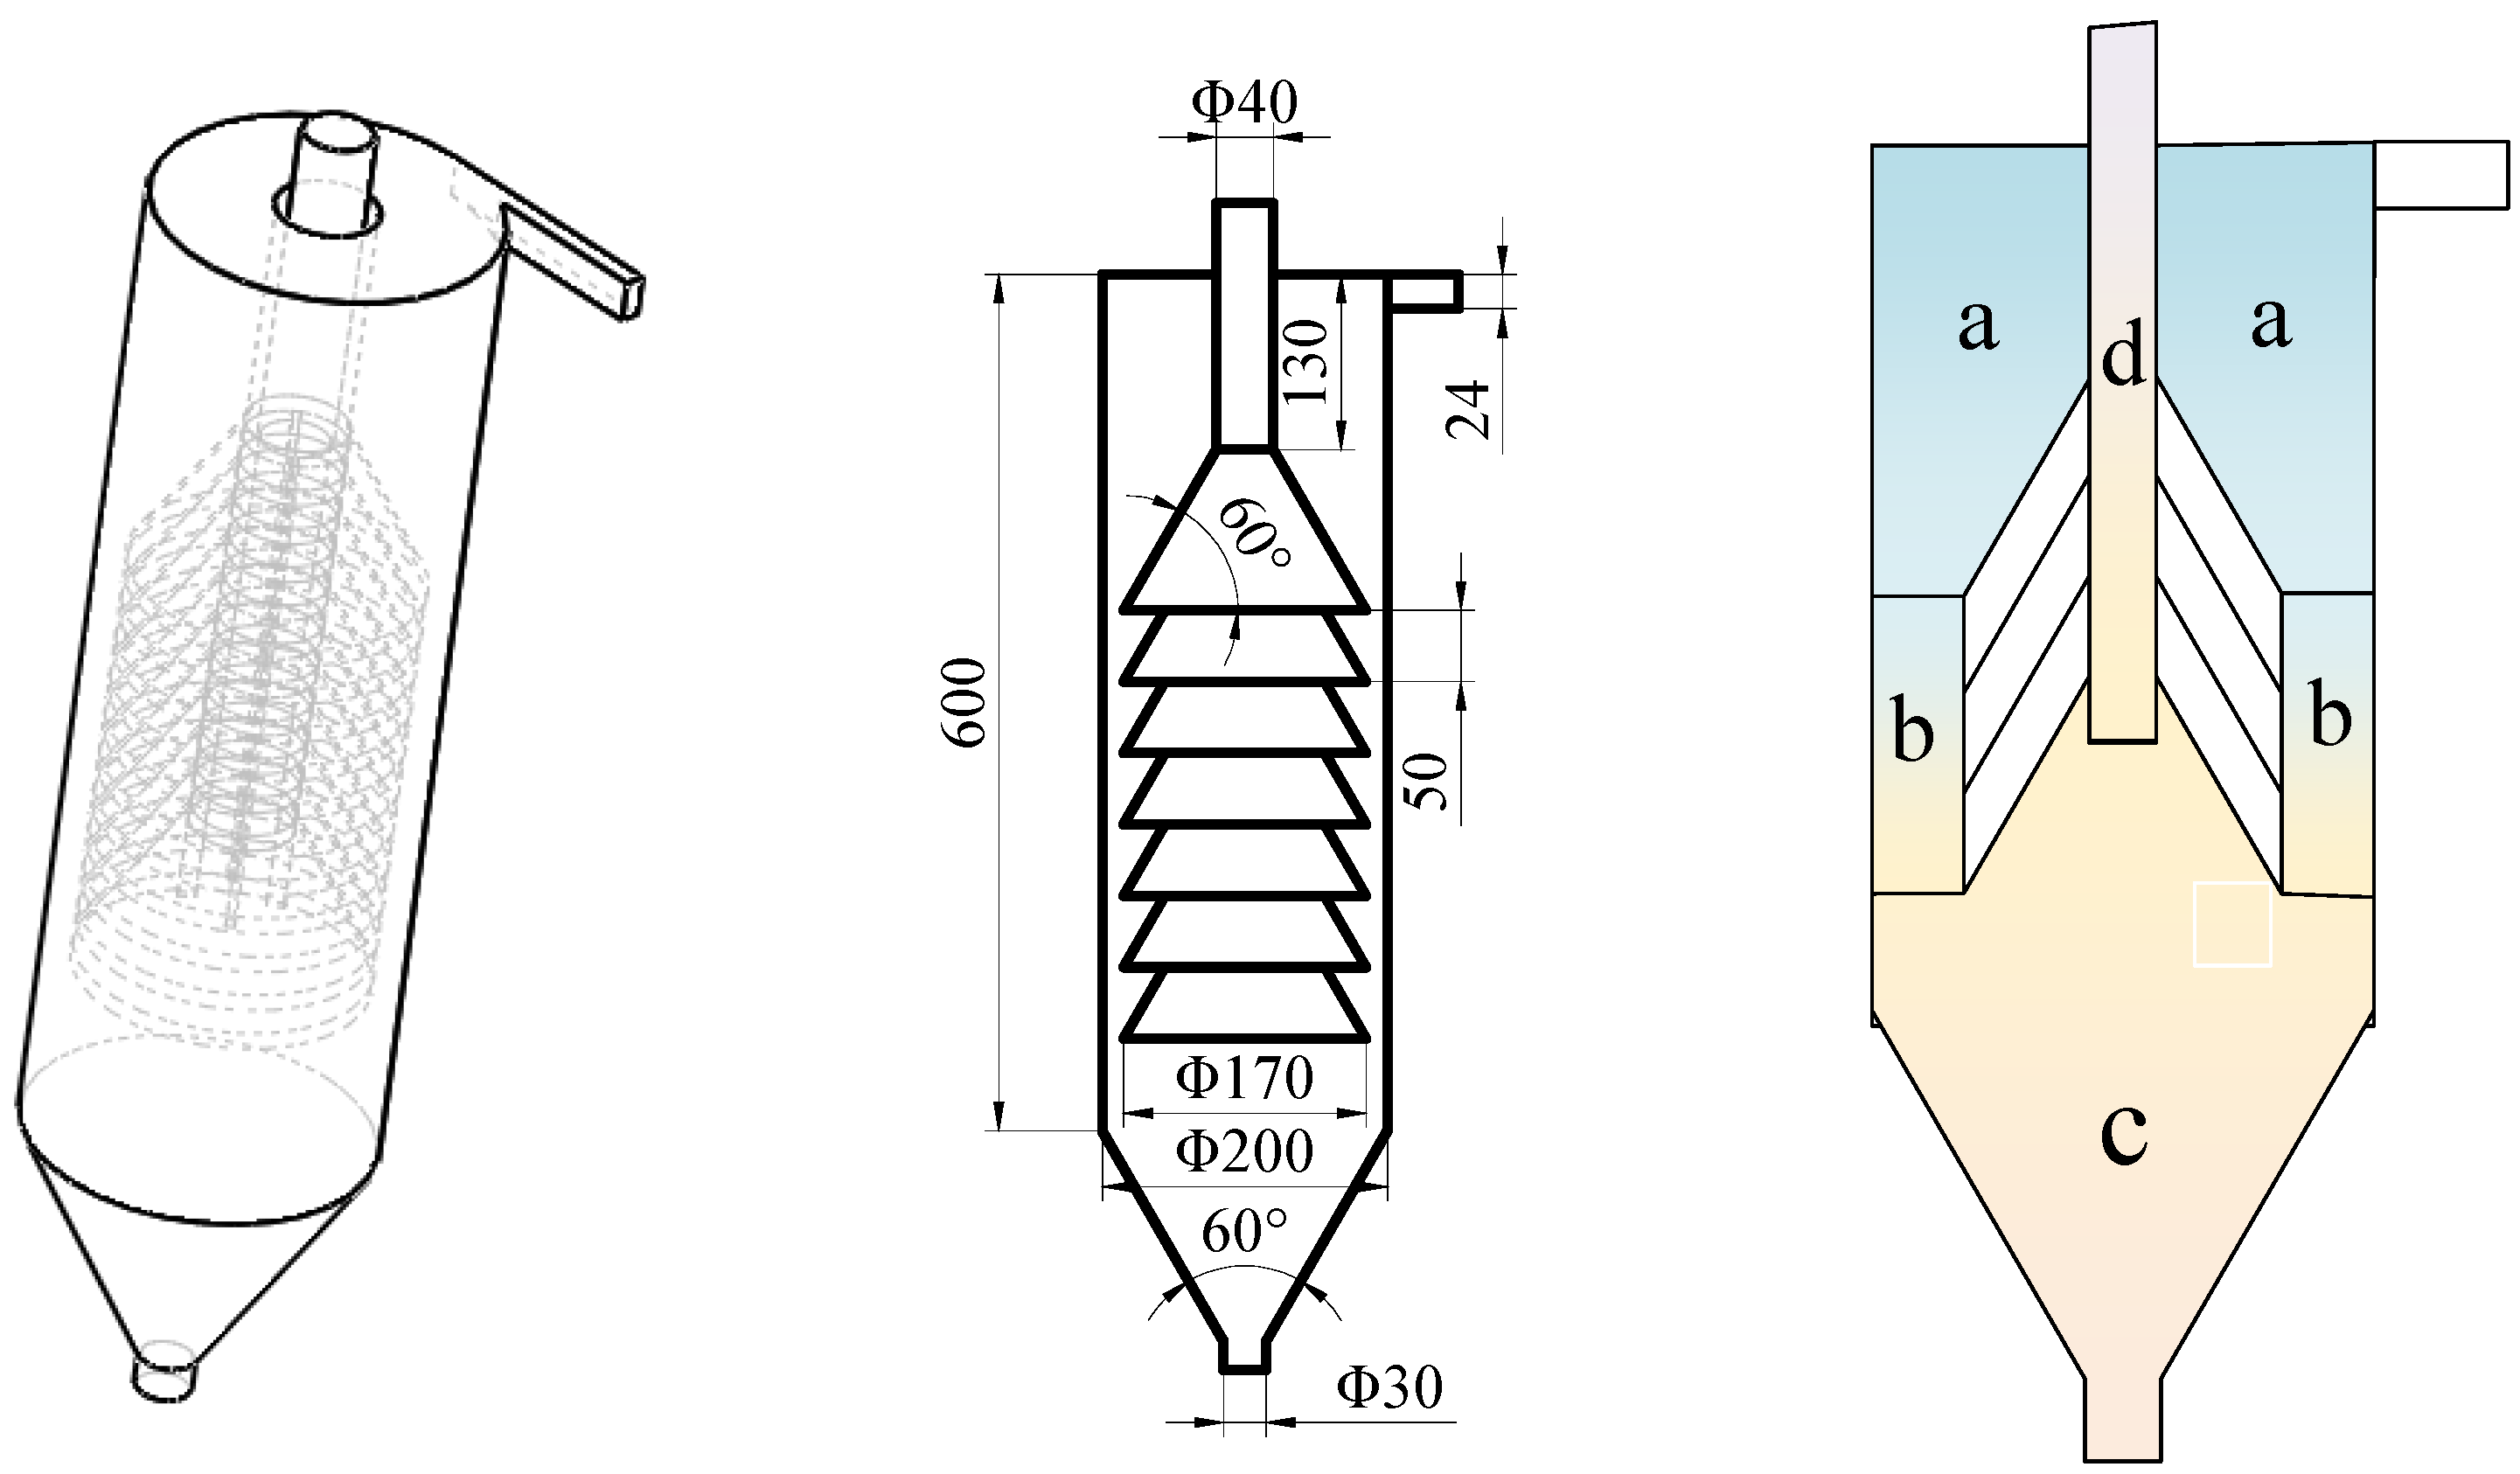
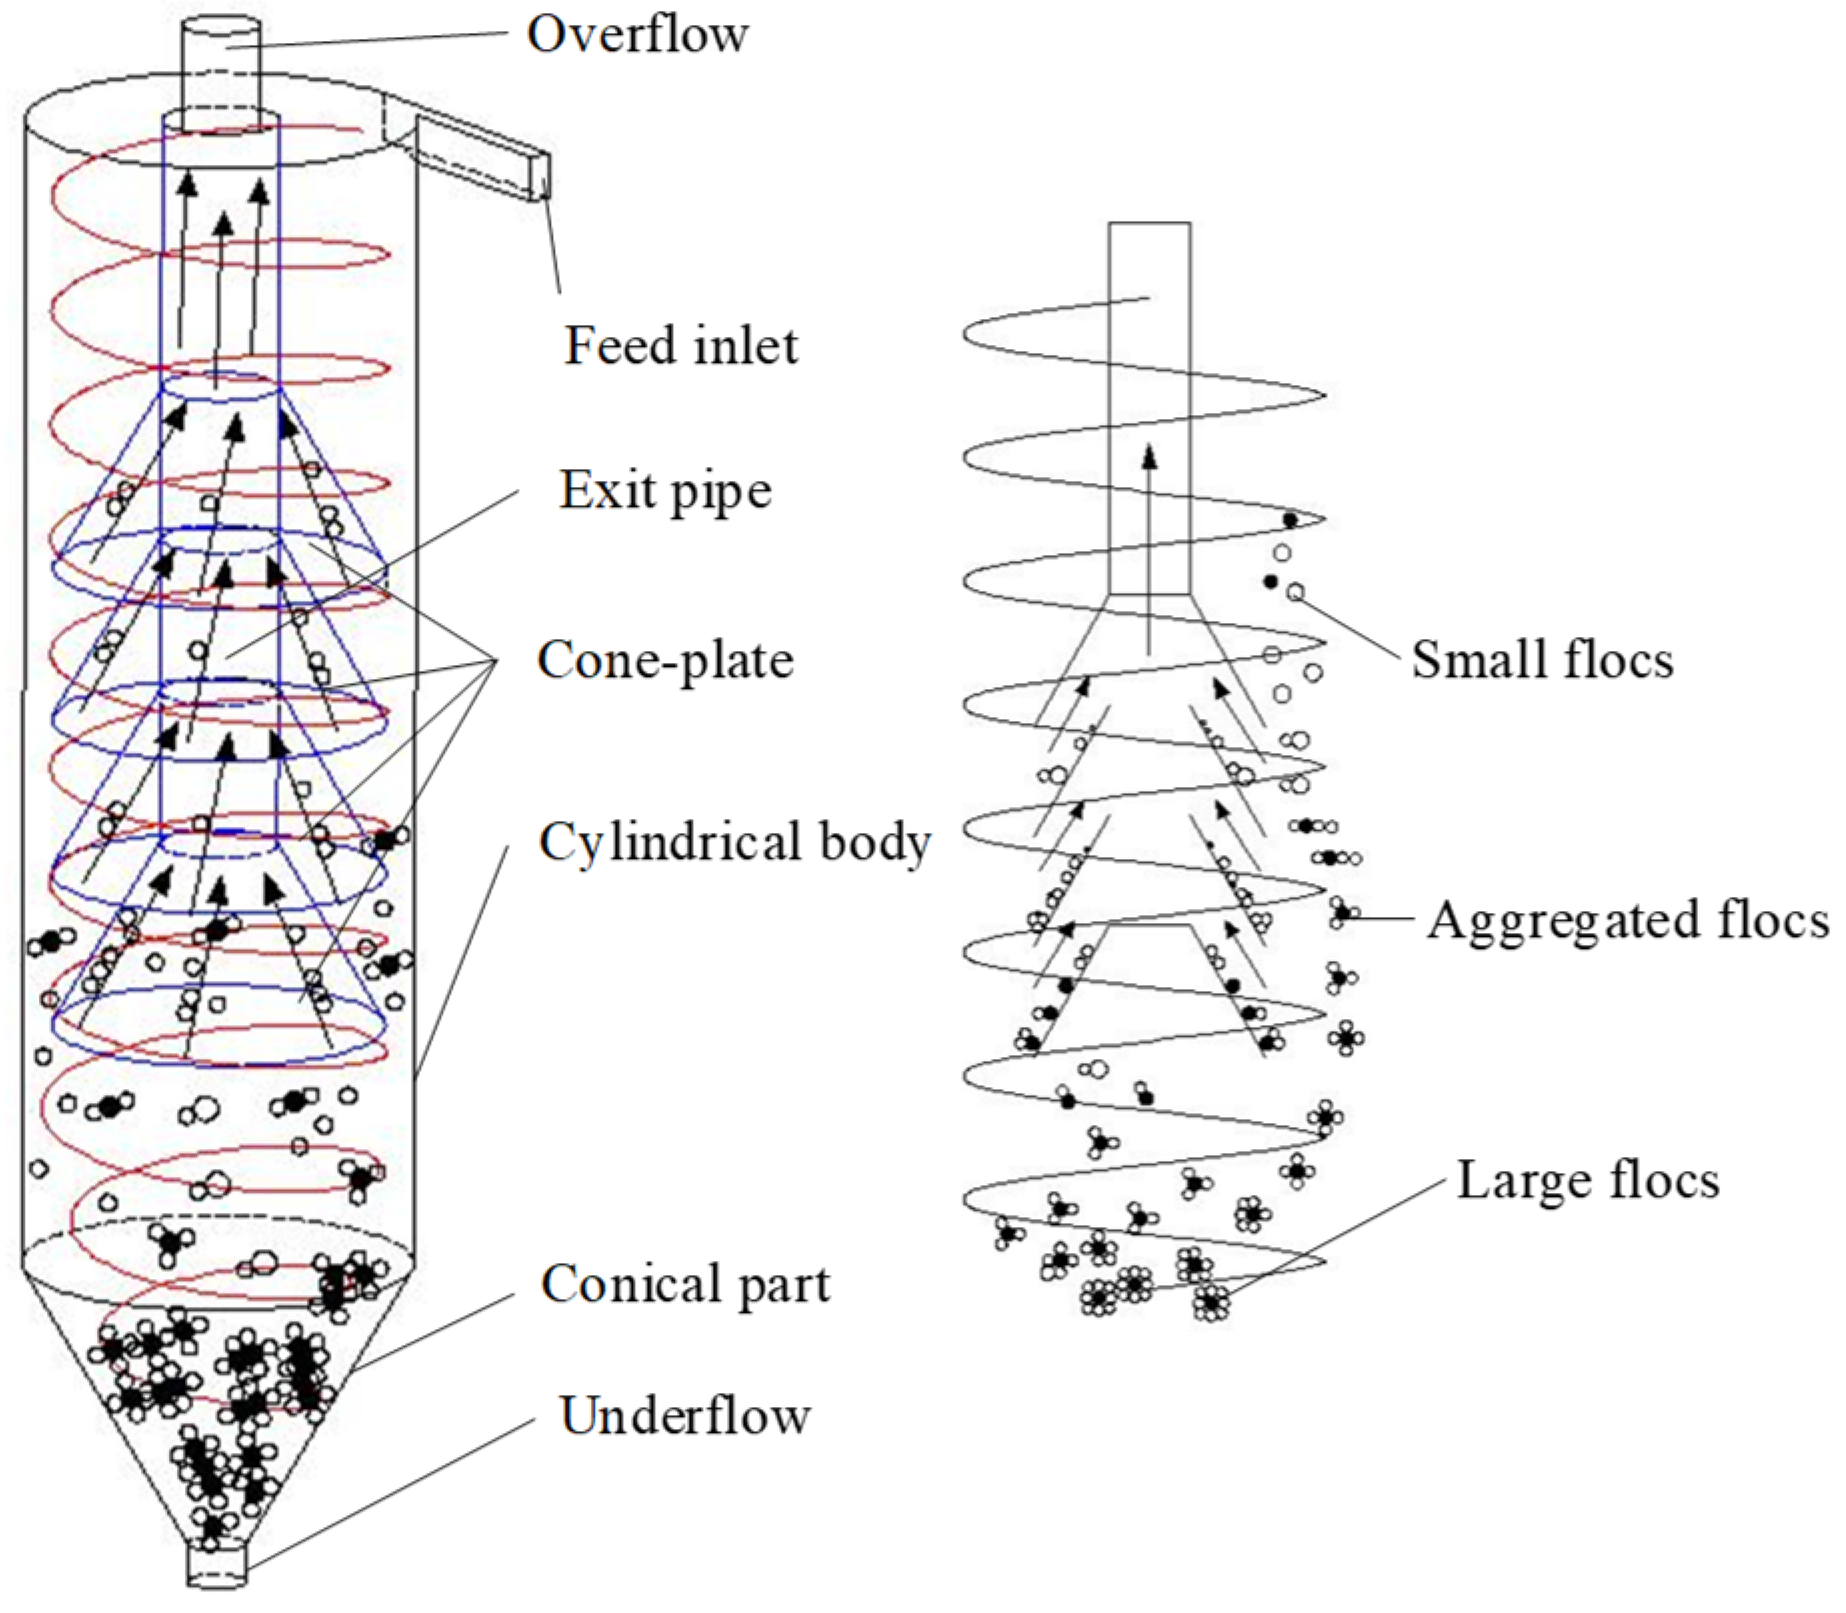
The flocculation system was composed of a cone-plate clarifier. The structure of the cone-plate clarifier is illustrated in
Figure 2. The schematic diagram of the cone-plate clarifier is shown in
Figure 3. It was composed of a cylindrical body, a conical part, a tangential feed inlet, a cone-plate, an exit pipe, an underflow port and an exit pipe. According to the flocculation stage, the cone plate clarifier was divided into four zones: The micro flocculation zone, flocs-growing zone, settlement zone and exit pipe zone. The flow rate of the cone-plate was 0.6 m
3/h and the hydraulic retention time was 7.5 min.
The monitoring system was composed of a particle counter, an SS meter, a turbidity meter and a computer. Samples were taken from sixteen sampling points during the test. Sampling point 0 was set in front of the first static mixer. Fifteen sampling points (Sampling points 1–15) were set up in the cone-plate clarifier. Three sampling points had been set up in each zone. When the dimensions of the device changed, the number of sampling points remained constant and the distance between the sampling points changed. The position of the measurement points was proportional to the geometry of the device. SS and turbidity were measured from sampling point 0 and sampling point 15 to calculate ss and turbidity removal efficiency. The particle count was sampled from sample point 1 to sample point 15 using a particle counter. Particle count monitoring data from all channels were transferred in real time to a computer to measure and monitor the distribution of particles with different particle sizes in the cone-plate clarifier. Therefore, the whole process of continuous evolution of flocs properties in the cone-plate clarifier can be systematically studied. The particle counter was set up with five channels to detect the number of particles with particle sizes of 2–5 μm, 5–10 μm, 10–50 μm, 10–100 μm and 100–500 μm, respectively. For dynamic monitoring, water samples were taken from sampling points 0–15 in the cone-plate clarifier with a peristaltic pump for particle counts. Similarly, water samples were taken from sampling points 0 and 15 with a peristaltic pump for SS and turbidity measurements. The peristaltic pump flow rate was 100 mL/min. The peristaltic pump was placed on the back of the particle counter to reduce flocculation break-up in the sandwich section of the pump.
2.3. Experimental Methods
The coal mine water was first pumped into the static mixer through a submersible pump. PACl was added to the first group of static mixers through the peristaltic pump. After mixing in the static mixer, magnetic seeds were added in the second group of static mixers and PAM was added in the third group of static mixers. After mixing with chemicals, the coal mine water was pumped into the cone-plate clarifier. As the feed inlet of the cone-plate clarifier was tangential to the cylindrical body, the coal mine water flowed through the feed inlet into the cylindrical body creating a cyclone flow field. In the cone-plate clarifier, the water flowed first through the micro flocculation zone and flocs-growing zone, then through the cone-plate or settlement zone into the exit pipe zone, and finally out of the overflow pipe. In the micro flocculation zone, under the action of centrifugal force, the particles collided and aggregated to produce a large number of small-sized flocs rapidly. In the flocs-growing zone, small flocs further grew into flocs of larger particle size. Large-sized flocs settled into the settlement zone by centrifugal force and gravity. Some small flocs entered the cone-plate with the water flow, and further gathered and grew according to the shallow pool principle. When flocs were large enough, they would slide back to the bottom of the settlement zone. Finally, the flocs were discharged intermittently from the underflow port, and the clean water flowed out from the exit pipe.
When the test system was stabilized, the peristaltic pump behind the particle counter, SS meter and turbidimeter was switched on in order to draw test water for testing. The number of particles with different particle sizes was sampled between sampling points 1 and 15. Each of the 15 sampling points in the cone-plate clarifier can be individually fitted with a sampling tube. The peristaltic pump was connected to the sampling tube at each sampling point to take the sample separately. The samples were drawn into the monitoring system by the peristaltic pump. As the water sample passes through the detection channel of the 2200 PCX Particle Counter, the laser beam hits the sample, at which point the particulate matter in the water obscures the light, thus leaving a shadow on the photodetector of the Particle Counter. The detector monitors the quality of the effluent water by detecting the extinction of light. The detected data were transmitted in real time to a computer and the number of particles with particle sizes of 2–5 μm, 5–10 μm, 10–50 μm, 10–100 μm and 100–500 μm was automatically calculated by computer software.
A fixed sampling tube was installed at sampling point 0. The peristaltic pump can also be connected to the sampling tube at sampling point 0. For SS and turbidity measurements, the peristaltic pump was connected to the sampling tube at sampling point 0 and sampling point 15, respectively. SS and turbidity are measured by a SS meter and turbidity meter in series. SS and turbidity removal efficiencies were calculated, and the resulting data were analyzed.
The test continued with the structural parameters being adjusted. The structural parameters of the cone-plate clarifier include the cylinder height, cone-plate insertion depth and cone-plate spacing. This experiment used one device reconstructed for the purposes of the experiment. The cylindrical body consisted of a number of small cylinders with a height of 100 mm. These small cylinders were connected to each other by flanges. The cylinder height was achieved by adjusting the number of small cylinders The insertion depth was achieved by adjusting the position of the cone-plate in the cone-plate clarifier. The cone-plate spacing was achieved by adjusting the distance of the cone-plate on the exit pipe. The range of different parameters is shown in
Table 1.
3. Results and Discussion
3.1. The Effect of Structural Parameters on Particle Size Distribution
3.1.1. Effect of the Cylinder Height
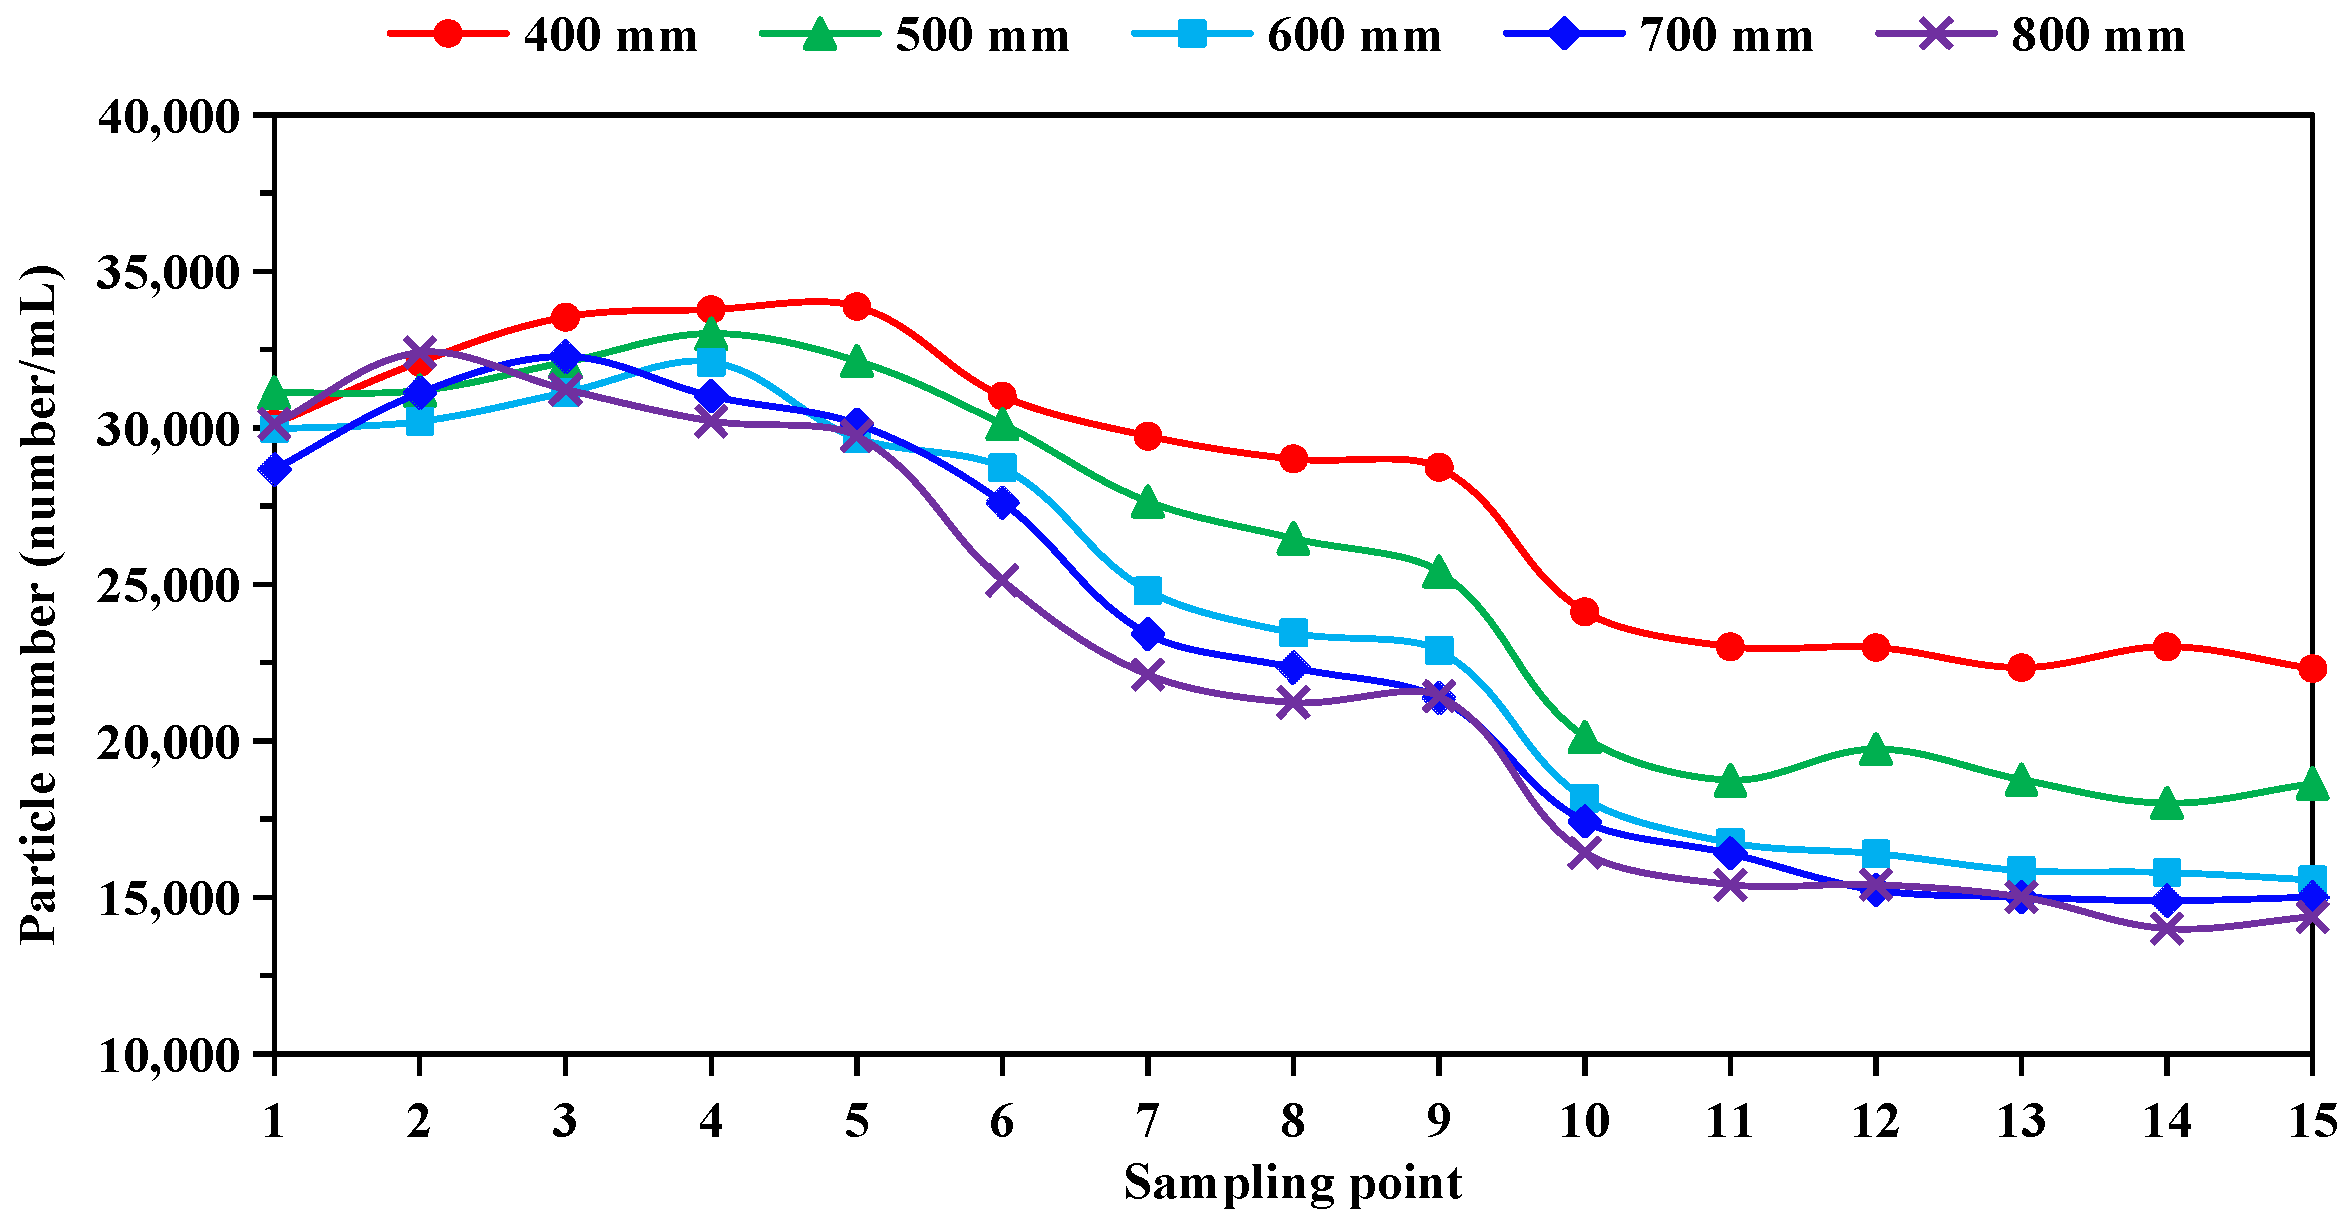
The height of the cylinder is directly related to the flocculation and settling time of the particles. Insufficient cylinder height will result in inadequate flocculation; however, a large cylinder height will take up more space. The height of the cylinder affects the overall height of the equipment, so the cylinder height of the cone-plate clarifier was studied. The particle number distribution of different particle sizes with different cylinder heights is shown in
Figure 4.
As shown in
Figure 4, the number of particles at different cylinder heights increases and then decreases as the number of sampling points increases. This is mainly due to the fact that in the first few sampling points, a large number of flocs with small particle sizes are generated by flocculation, which leads to an increase in the total number of particles. In the latter sampling points, the particle number decreases due to the settling of the flocs. The minimum number of particles was found at sampling point 15, indicating that particles could be effectively removed by the cone-plate clarifier.
When the height of the cylinder is between 400 and 600 mm, the number of particles decreases as the height of the cylinder increases. This indicates that the particle flocculation time is more adequate as the height of the cylinder increases. As a result, the flocculation and settling efficiency of the particles are increased. When the height of the cylinder is between 600 and 800 mm, the number of particles decreases slightly with the increase in the cylinder height. It shows that the particles have been completely flocculated and continuing to increase the height has little effect on the flocculation effect.
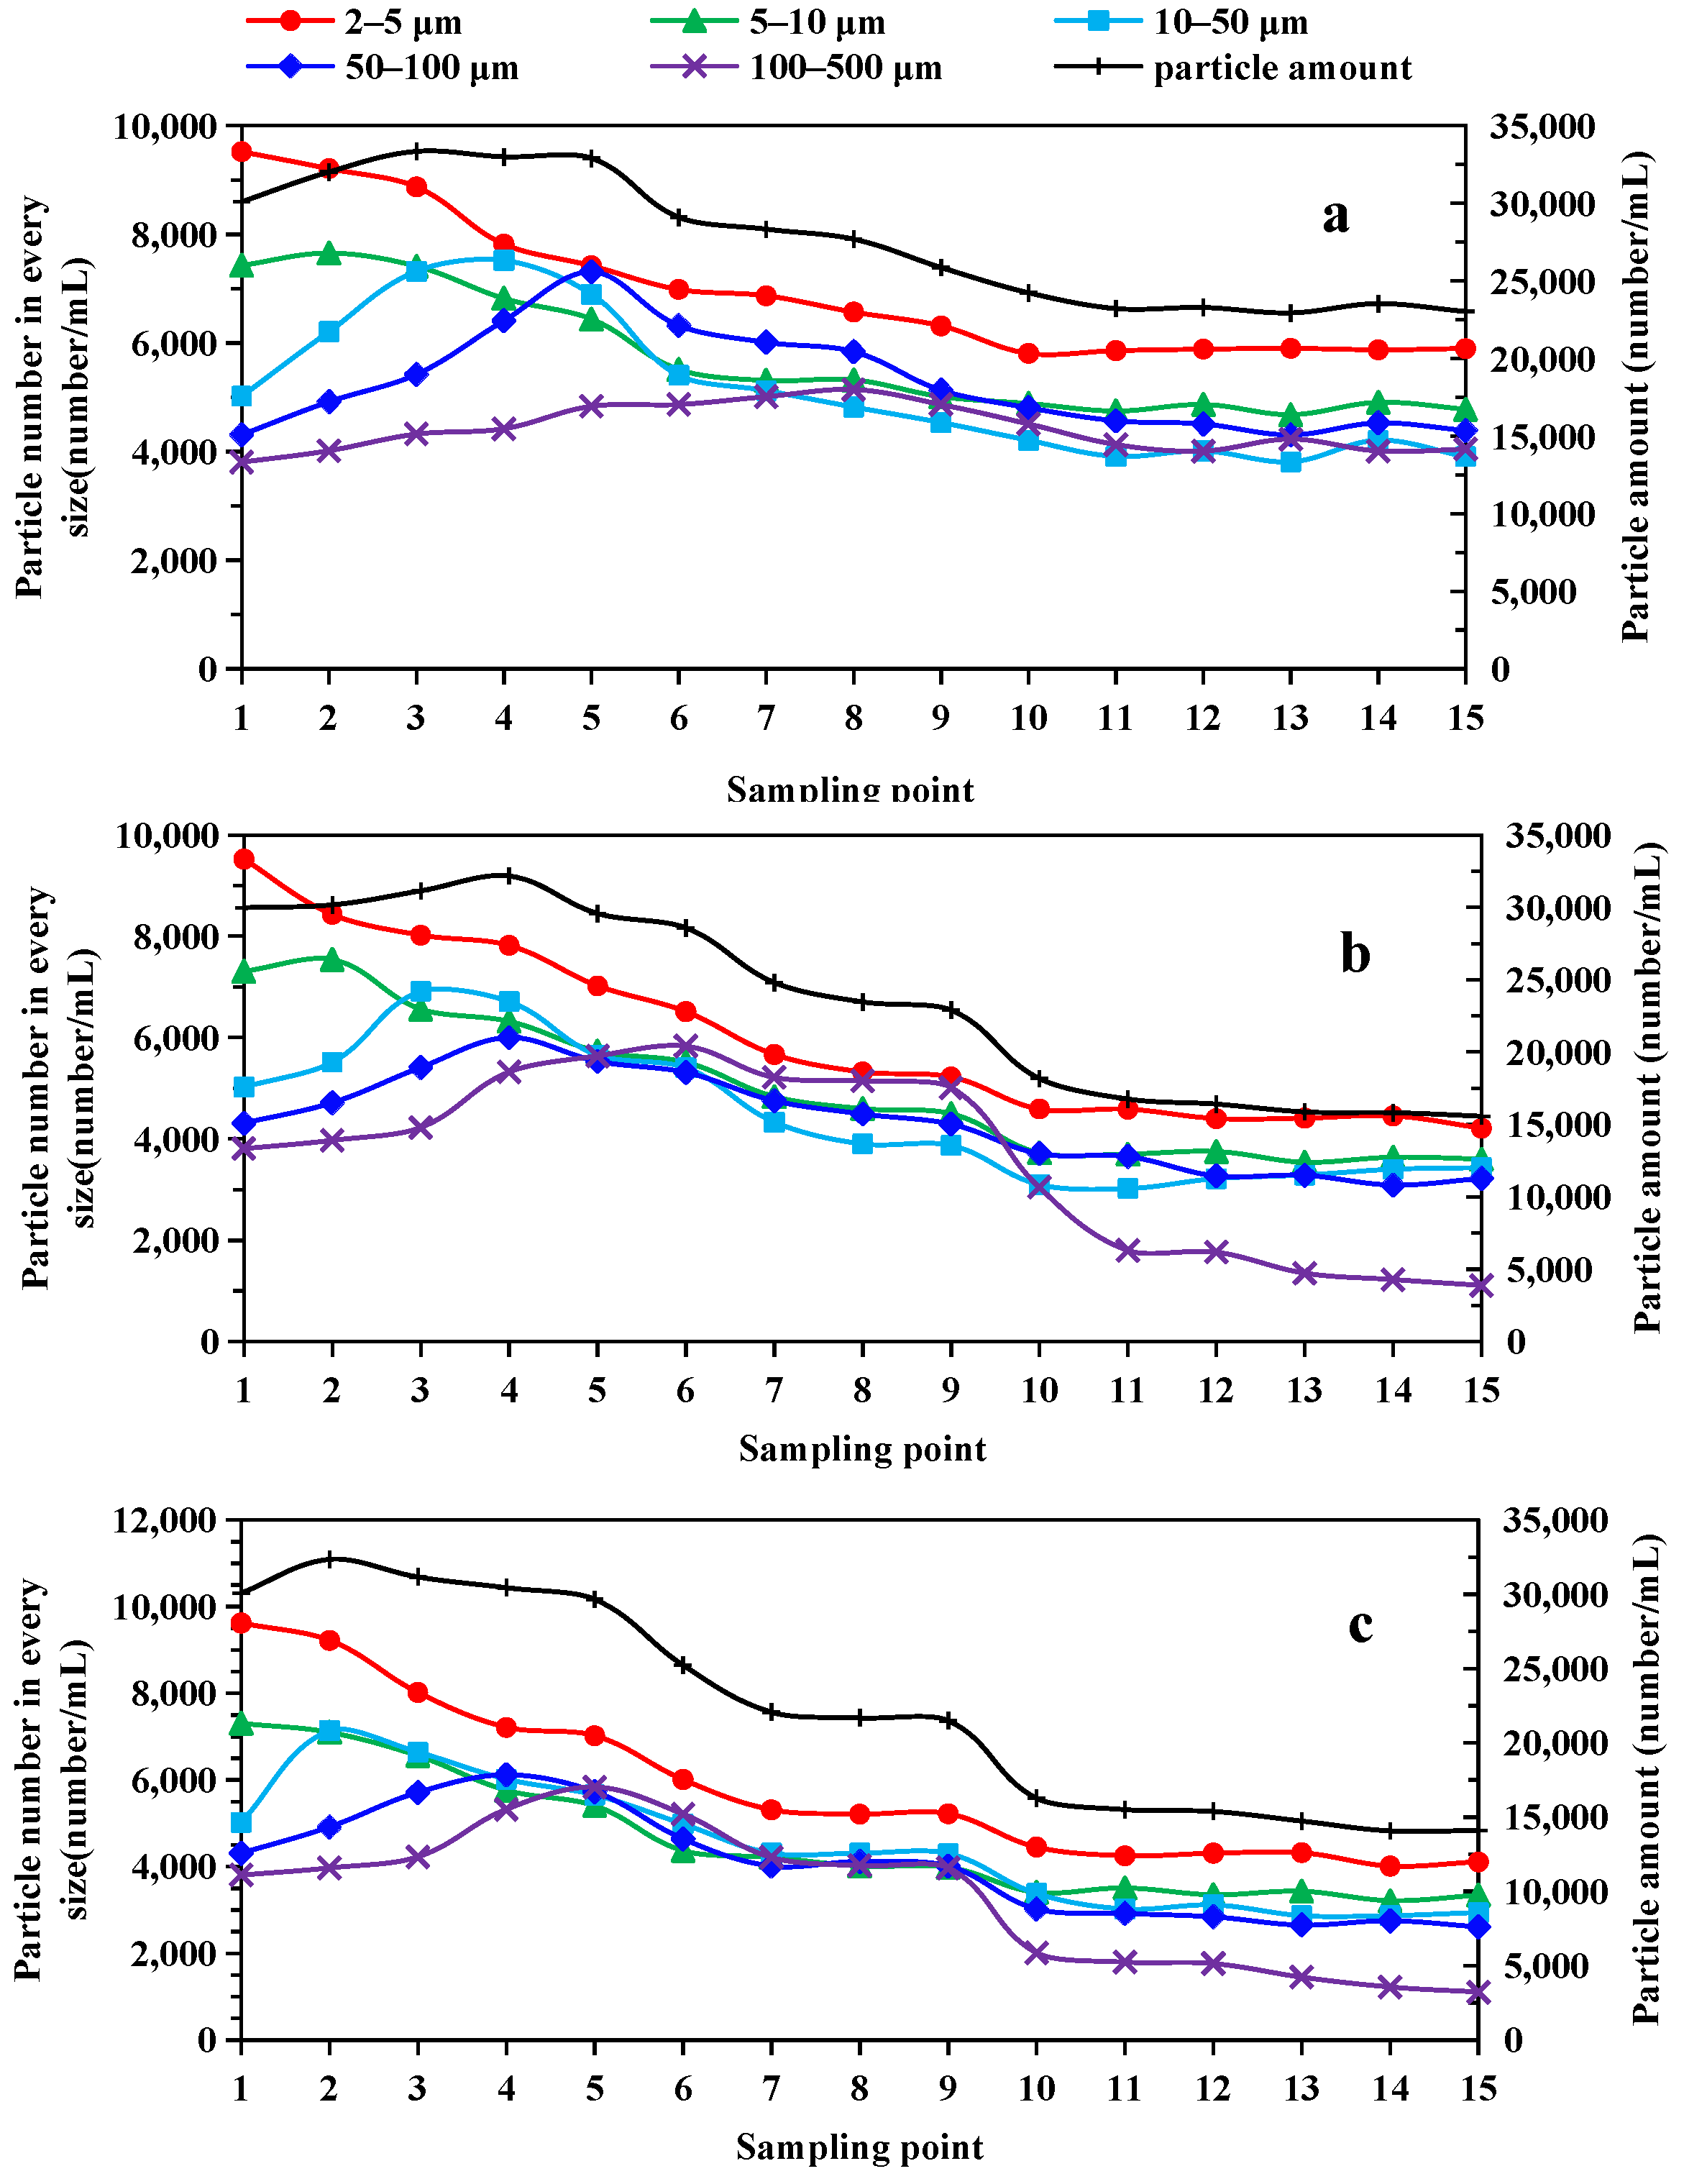
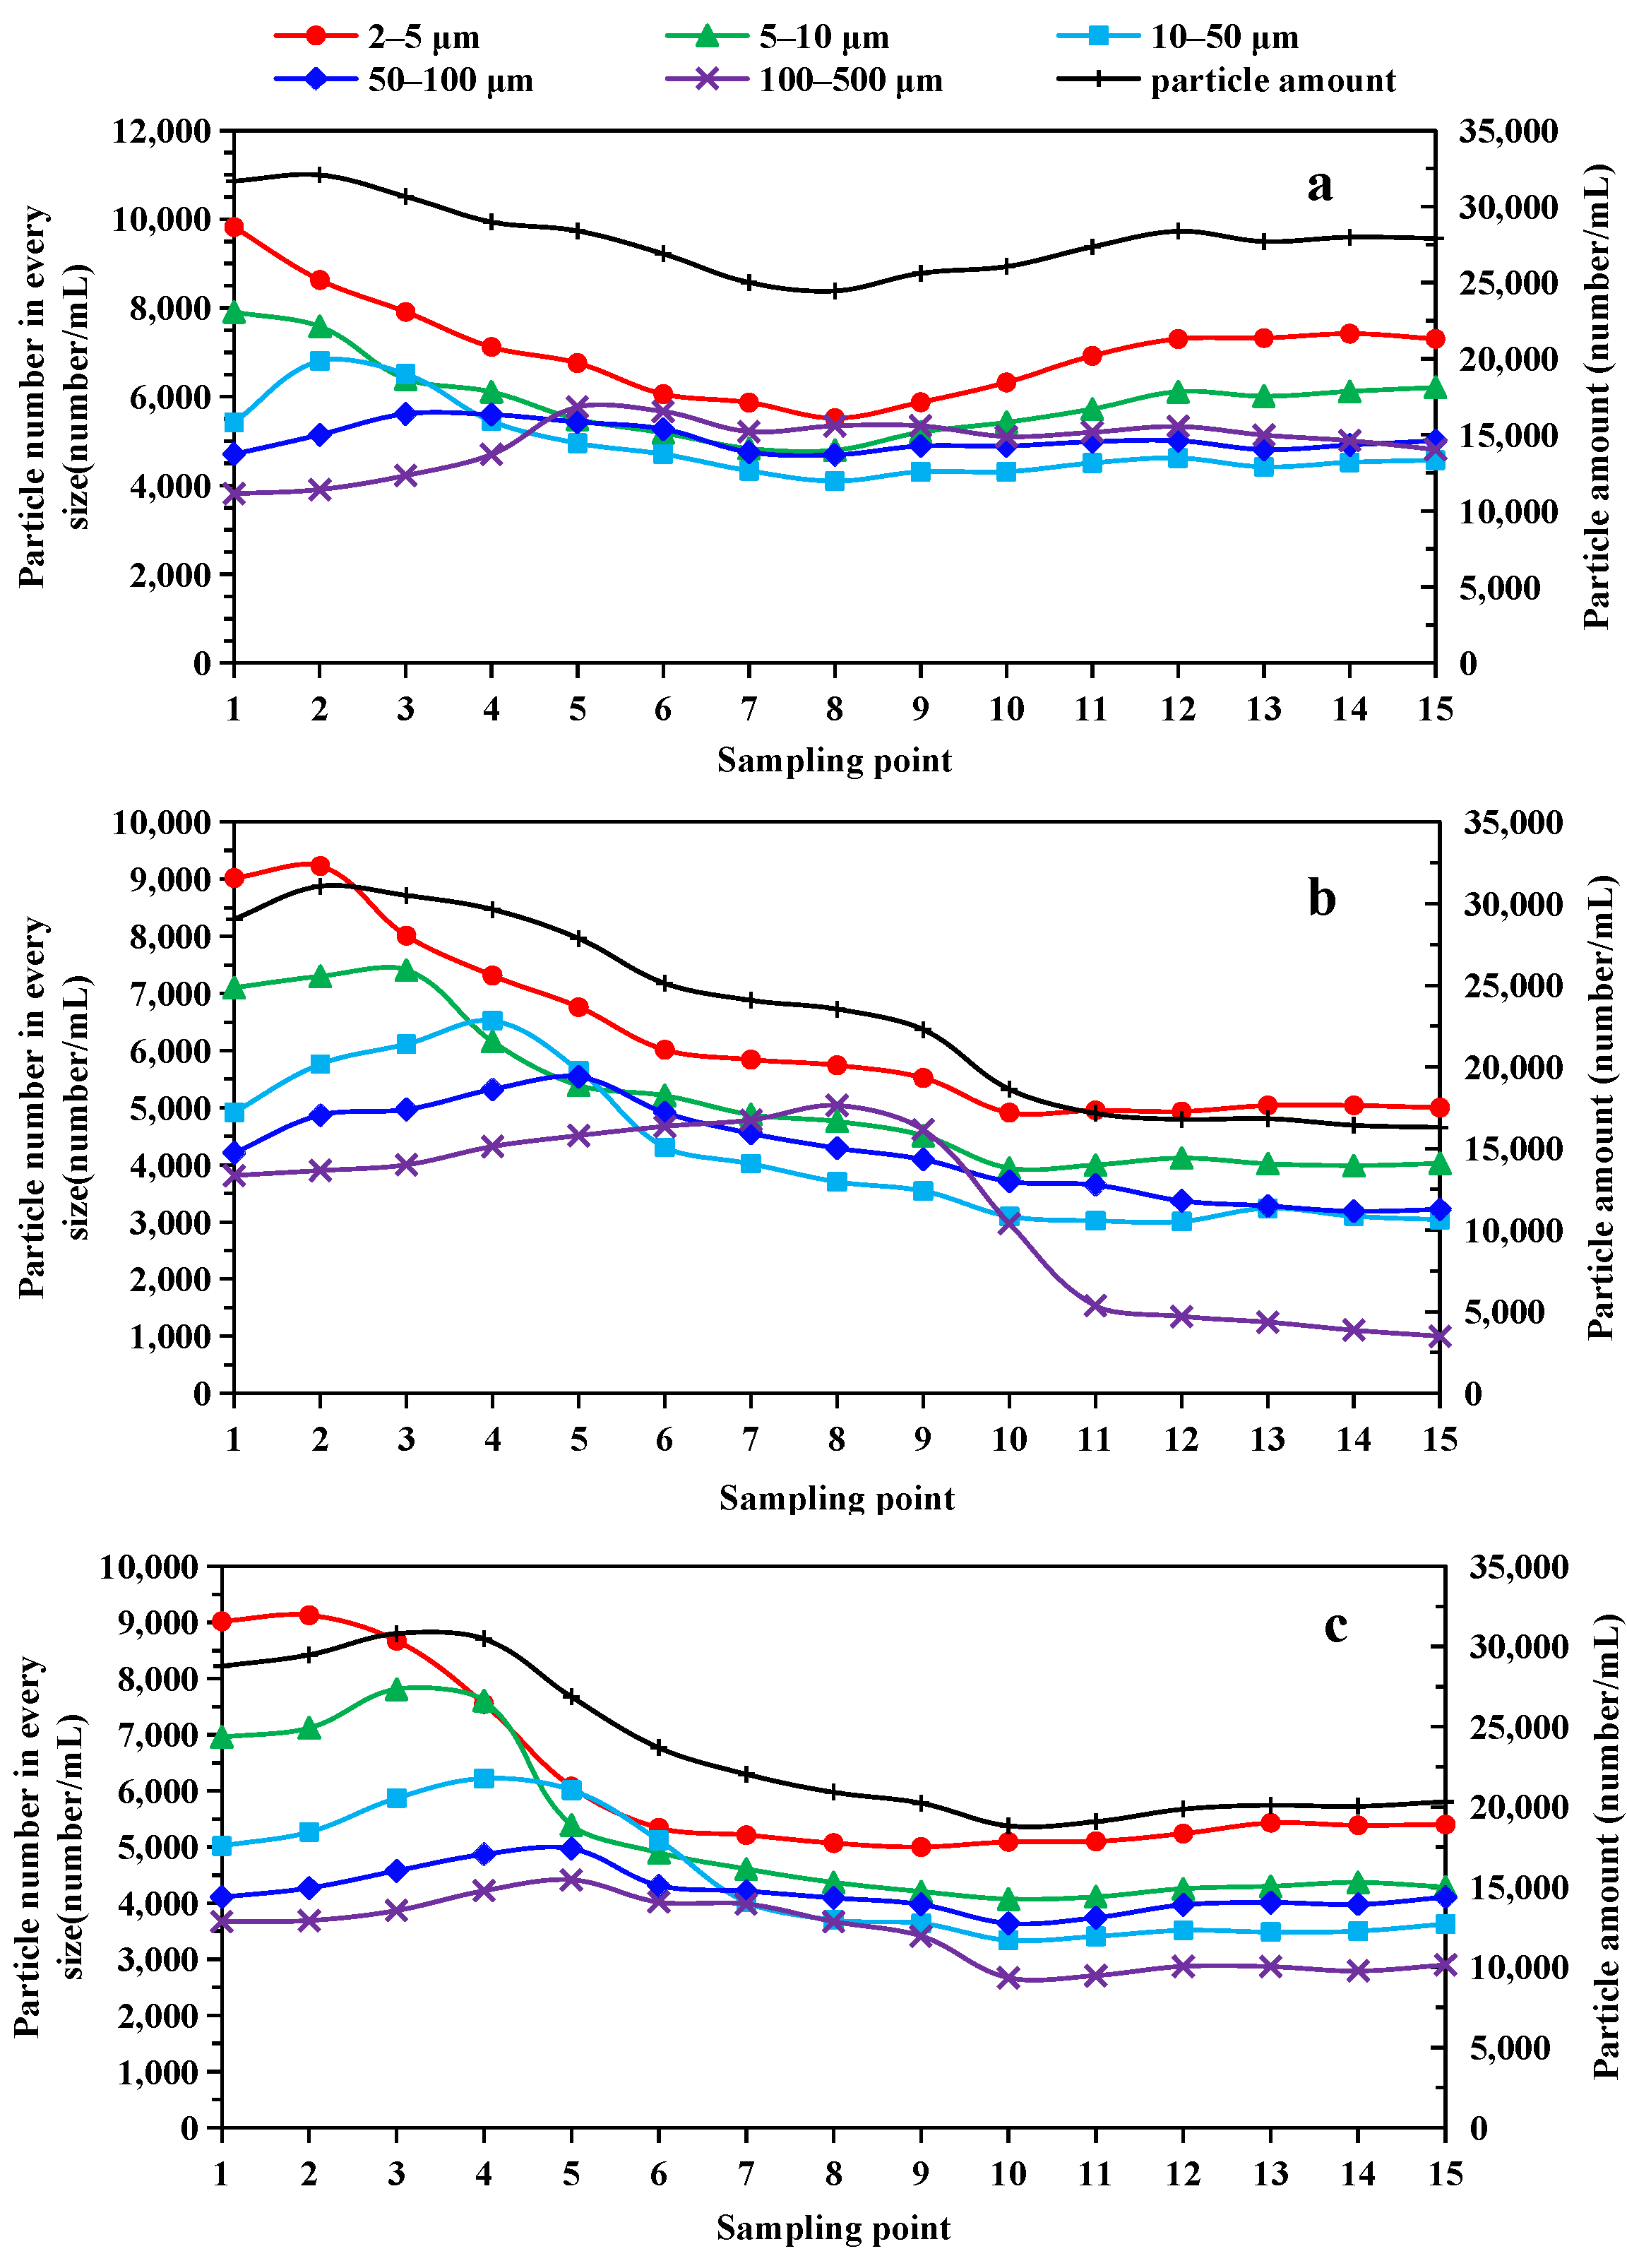
In order to further investigate the effect of cylinder heights on the cone-plate clarifier, the particle number of different particle sizes at different sampling points was studied. As shown in
Figure 5b, the particle number with a particle size of 2–5 μm decreases, and the size of particles above 5 μm increases first and then decreases with the increase in the sampling point number. As the particle size increases, the maximum value of the distribution curve of the particle number with different sizes shifts to the right. This indicates that a large number of small particles collide and flocculate to form a smaller number of large particles. This leads to an increase and then a decrease in the total number of particles as the sampling point number increases.
Comparing the three graphs in
Figure 5b, the peak of the particle number curve for each particle size in
Figure 5a appears later and the number of 10–50 µm particles reaches its peak in the flocs-growing zone at sampling point 4. This indicates that the micro flocculation zone is not high enough, which leads to insufficient flocculation time. The small reduction in the number of particles at sampling point 10 indicates that the height of the settling zone is not high enough to allow sufficient settling. This resulted in a high number of particles of each size at sampling point 15, with a combined particle number of 22,338 mL
−1.
The curve of the number of 10–50 μm particles in
Figure 5b reaches its maximum at sampling point 3. At sampling point 10, the particle number of each size decreases significantly, especially for the particles of 100–500 μm. The lowest number of particles was found at sampling point 15, with a total particle count of 15,566 mL
−1.
In
Figure 5c, the particle size of 10–50 μm reaches the peak at sampling point 2 of the micro flocculation zone, which indicates that the micro flocculation zone is not fully utilized. At sampling point 9 in the settlement zone, the larger the particle size, the smaller the number of particles. This means that the particles in the settlement zone have been stratified, and thus the exit pipe zone is not fully functional. The number of particles at sampling point 15 was slightly reduced to 14,108 mL
−1.
In summary, the cone-plate clarifier can be fully used when the cylinder height is 600 mm, which is the optimal value.
3.1.2. Effect of Cone-Plate Insertion Depth
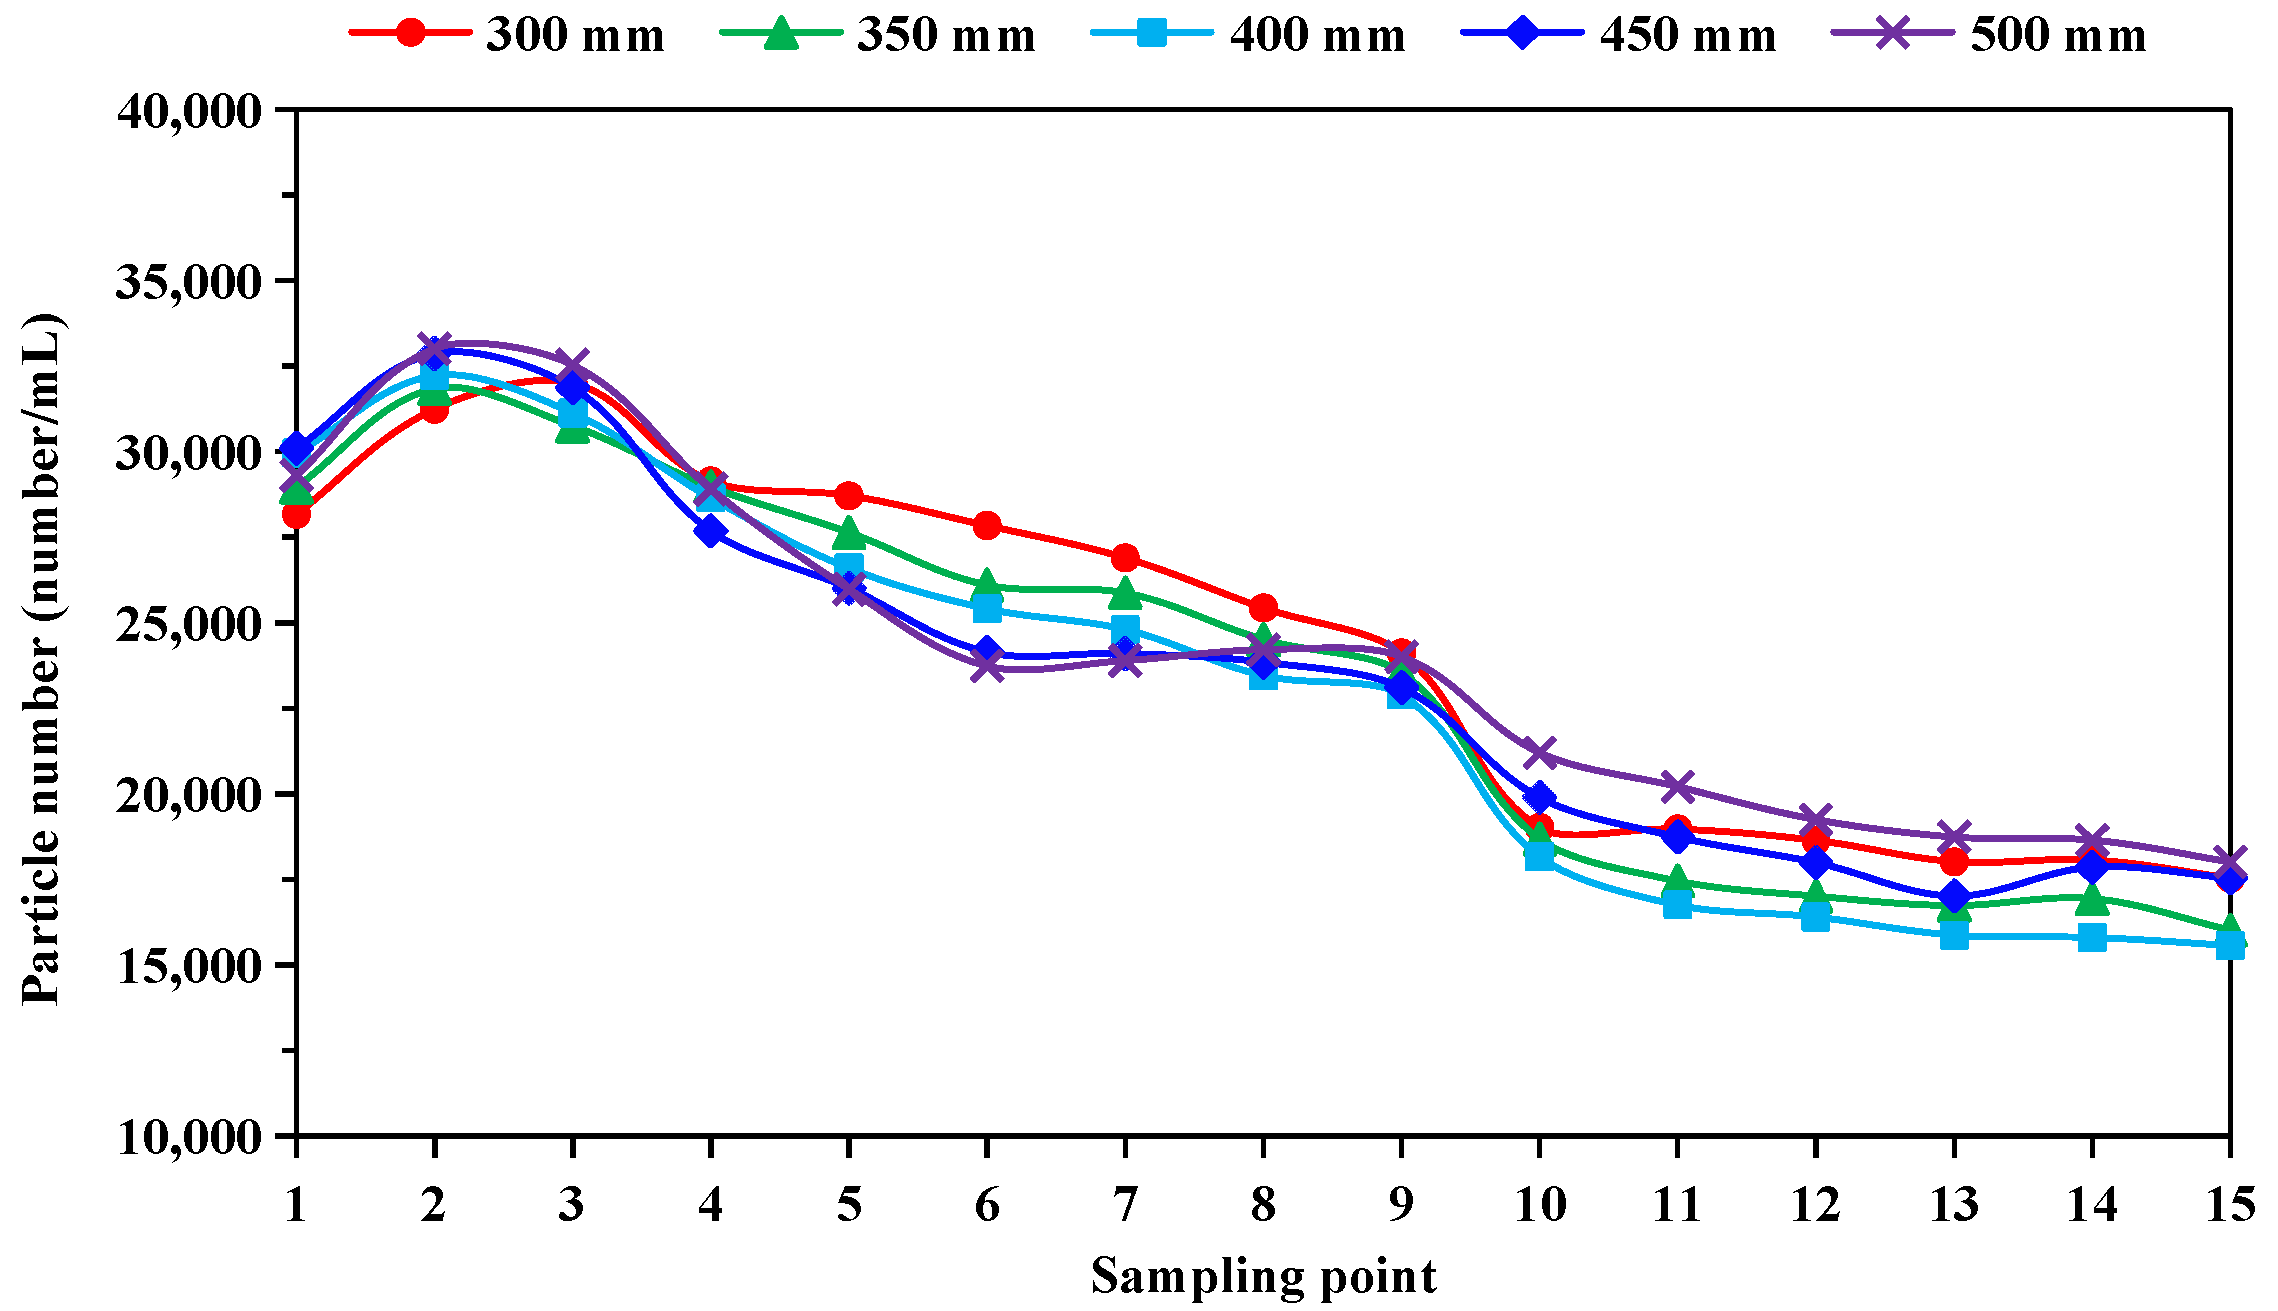
The cone-plate insertion depth has an effect on the flow distribution within the cone-plate clarifier. Therefore, the insertion depth of the cone-plate was investigated. The particle size distribution with different cone-plate insertion depths is shown in
Figure 6.
As shown in
Figure 6, at sampling point 2 of the micro flocculation zone, the particle number increases with the increase in the cone-plate insertion depth between 300 and 400 mm, and remains essentially constant when the cone-plate insertion depth is greater than 400 mm. It shows that the micro flocculation zone is fully flocculated when the cone-plate insertion depth is greater than 400 mm.
At sampling point 15 of the exit pipe zone, the particle number decreases with the increase in the cone-plate insertion depth when the cone-plate insertion depth is between 300 and 400 mm. The particle number increases when the cone-plate insertion depth is greater than 400 mm. This is mainly due to the fact that when the cone-plate insertion depth of the cone-plate is less than 400 mm, the flocs cannot be fully flocculated in the micro flocculation zone. When the cone-plate insertion depth is greater than 400 mm, the cone-plate is too close to the flocs in the settlement zone, and the flocs settled in the bottom will be carried into the exit pipe zone. This leads to an increase in the number of particles at sampling point 15. At a cone-plate insertion depth of 400 mm, the particle number at sampling point 15 is 15,013 mL−1.
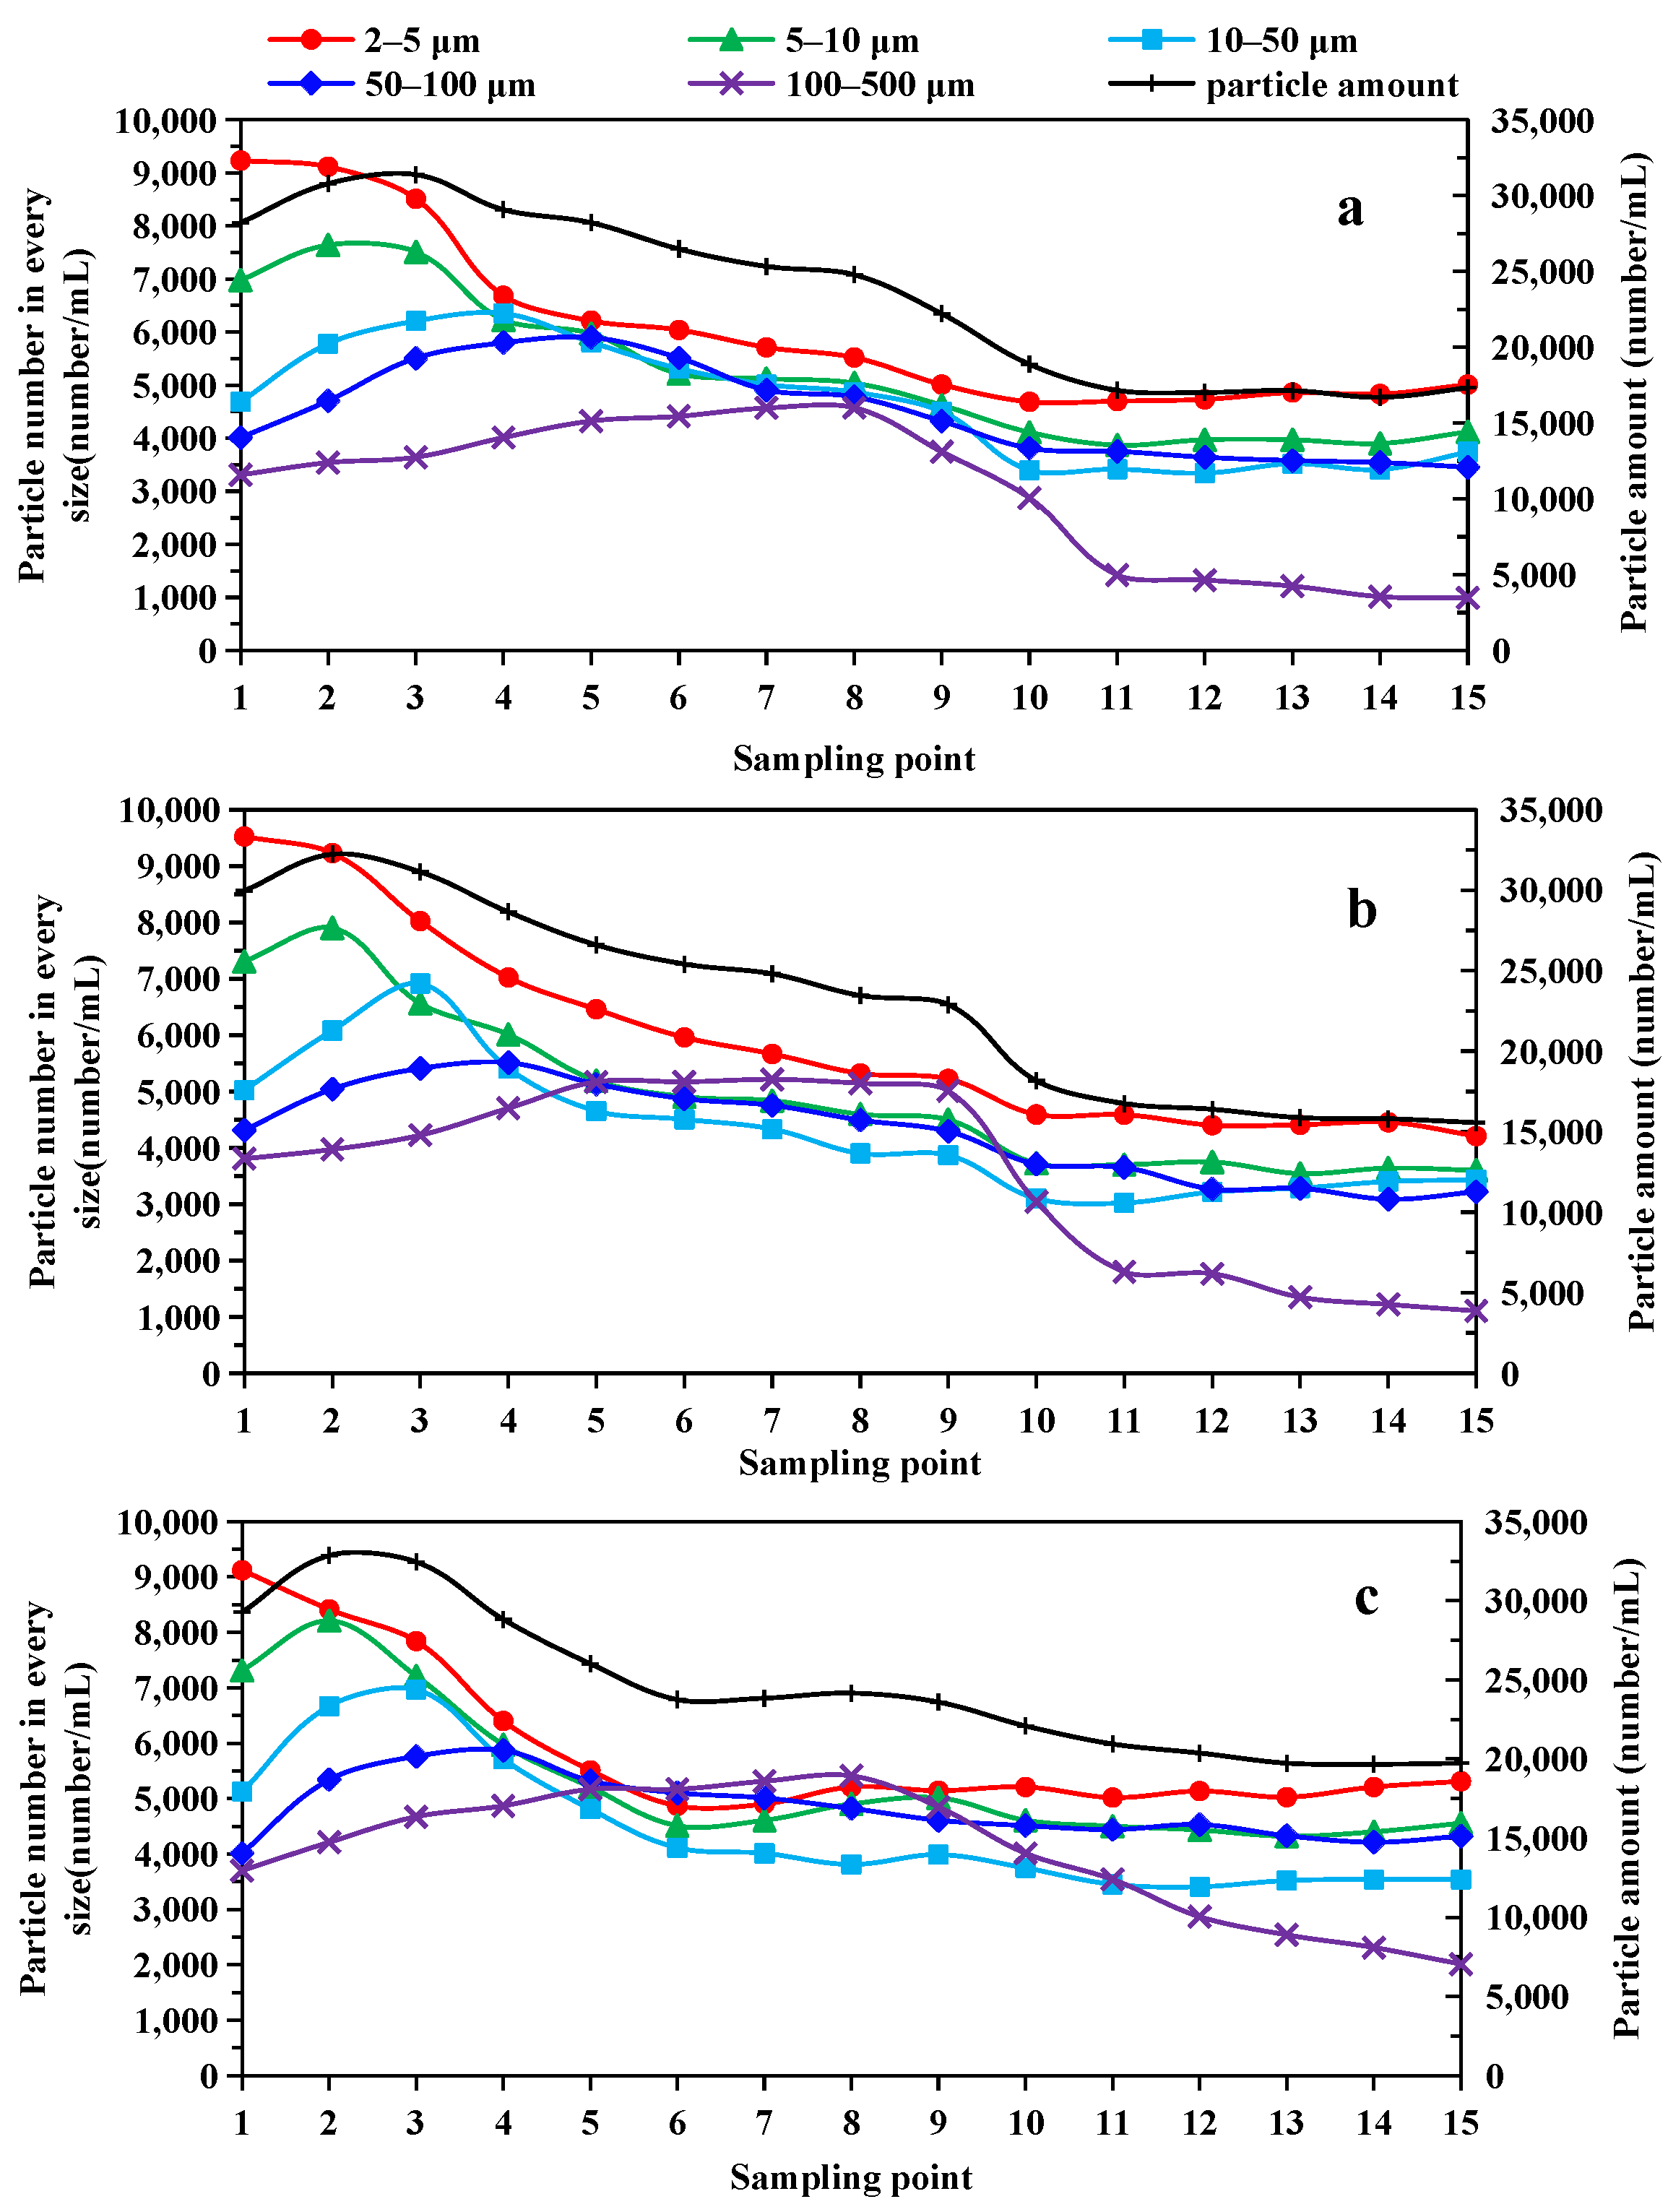
As shown in
Figure 7a, at a cone-plate insertion depth of 300 mm, the values of particles with particle sizes of 10–50 µm reach a maximum at sampling point 4 and particles with particle sizes of 50–100 µm reach a maximum at sampling point 5 in the flocs-growing zone. This means that the flocs are not fully flocculated in the micro flocculation zone. In the flocs-growing zone, there are still a large number of particles with small particle sizes at sampling points 4 and 5. Such particles are less affected by centrifugal force and gravity and enter the exit pipe zone with the water flow through the cone-plate, which leads to an increase in the number of particles of each size at the sampling point 10–15.
As shown in
Figure 7b,c, the particle distribution is similar at the first six sampling points. In
Figure 7c, there is no reduction in the number of 2–100 μm particles at sampling points 10–15 in the exit pipe zone relative to sampling points 7–9 in the settlement zone. This is mainly due to the fact that the cone-plate is too close to the settled flocs in the settlement zone, which brings a large number of particles with a particle size less than 100 μm into the exit pipe zone under the action of the flow field. This leads to an increase in the number of particles at sampling point 15.
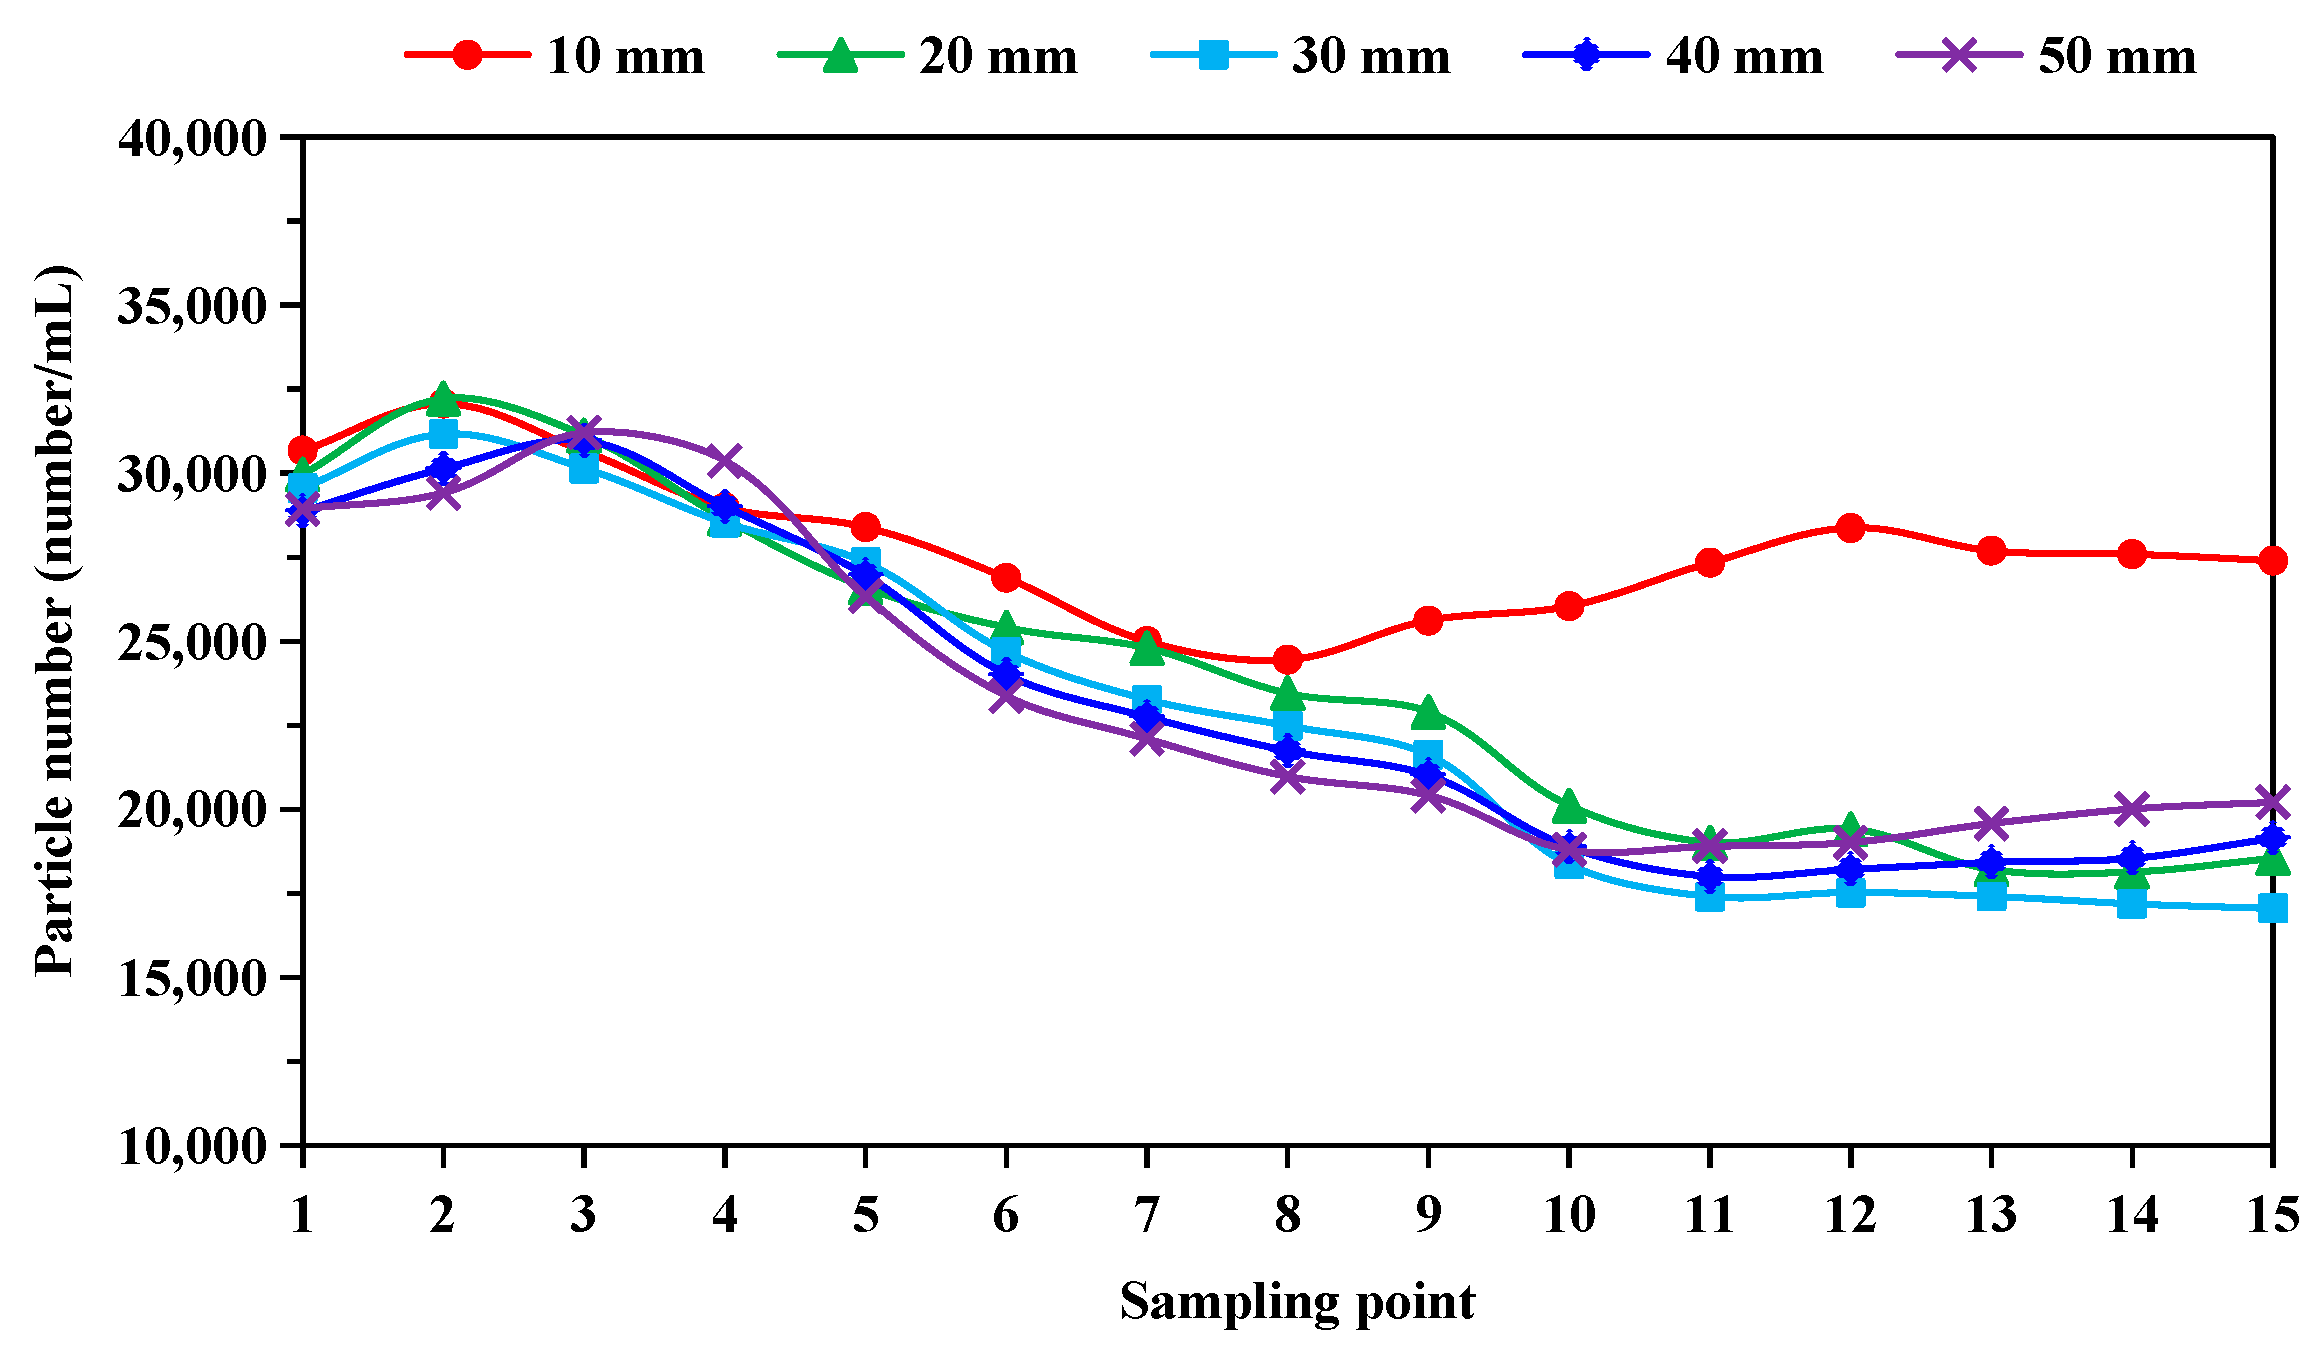
3.1.3. Effect of Cone-Plate Spacing
It is known from the shallow pool theory that cone-plate spacing has an effect on the particle settling efficiency between the cone-plates. Therefore, the spacing of the cone-plate was studied. The particle size distribution with different cone-plate spacings is shown in
Figure 8.
When the cone-plate spacing is 10 mm, the total particle number decreases first and then increases. This is because the cone-plate spacing is too narrow resulting in less flow into the exit pipe zone through the cone-plate. Under the premise that the total flow remains unchanged, the flow rate from the settlement zone into the exit pipe zone increases, resulting in the particles in the settlement zone being unable to settle. A large amount of flocs from the settlement zone entered the exit pipe zone with the flow field, which led to an increase in particles at sampling points 10–15, which reduced the particle settling performance.
When the distance between the cone-plates is 20 mm, the flow through the cone-plate into the exit pipe zone increases, allowing the cone-plate to give full play to the separation and settling effect. At the same time, the disturbance of the already settled flocs in the settlement zone is reduced, so the number of particles in the exit pipe zone is greatly reduced. When the cone-plate spacing is between 30 and 50 mm, the flow through the cone-plate is no longer limited by the cone-plate spacing. It is mainly defined by the size of the hole at the connection between the cone-plate and the exit pipe. At this point, the cone-plate spacing plays a dominant role. As the spacing between the cone-plate increases, the particle settling effect decreases and the number of particles passing through the cone-plate into the exit pipe zone increases, according to the shallow pool theory. As a result, the number of particles at sampling point 15 increases.
As shown in
Figure 9a, the particle number of different sizes increased between sampling points 10 and 15. This indicates that particles smaller than 500 µm are difficult to settle in the settlement zone when the cone-plate is 10 mm.
As shown in
Figure 9b, at sampling points 10–15, particles of all particle sizes are reduced, with the largest reduction in the number of particles of 100–500 μm. This indicates that the cone-plates have a good removal effect on particles of all sizes. Particles larger than 100 µm settle well in the settlement zone. Therefore, the final sampling point 15 had the lowest number of particles.
As shown in
Figure 9c, the particle number with a particle size of 2–5 µm increases and the number of particles larger than 5 µm first decreases and then slowly increases in the exit pipe zone at sampling points 10–15. This means that the smaller the particle size, the more easily it passes through the cone-plate into the exit pipe zone. A large number of particles of different sizes enter the exit pipe zone through the cone-plate and mix with the particles from the settlement zone, resulting in an increase in the number of particles. At this point, the cone-plate does not play its full role in particle settling.
3.2. Curve Fitting for SS and Turbidity Removal Efficiency at Different Structural Parameters
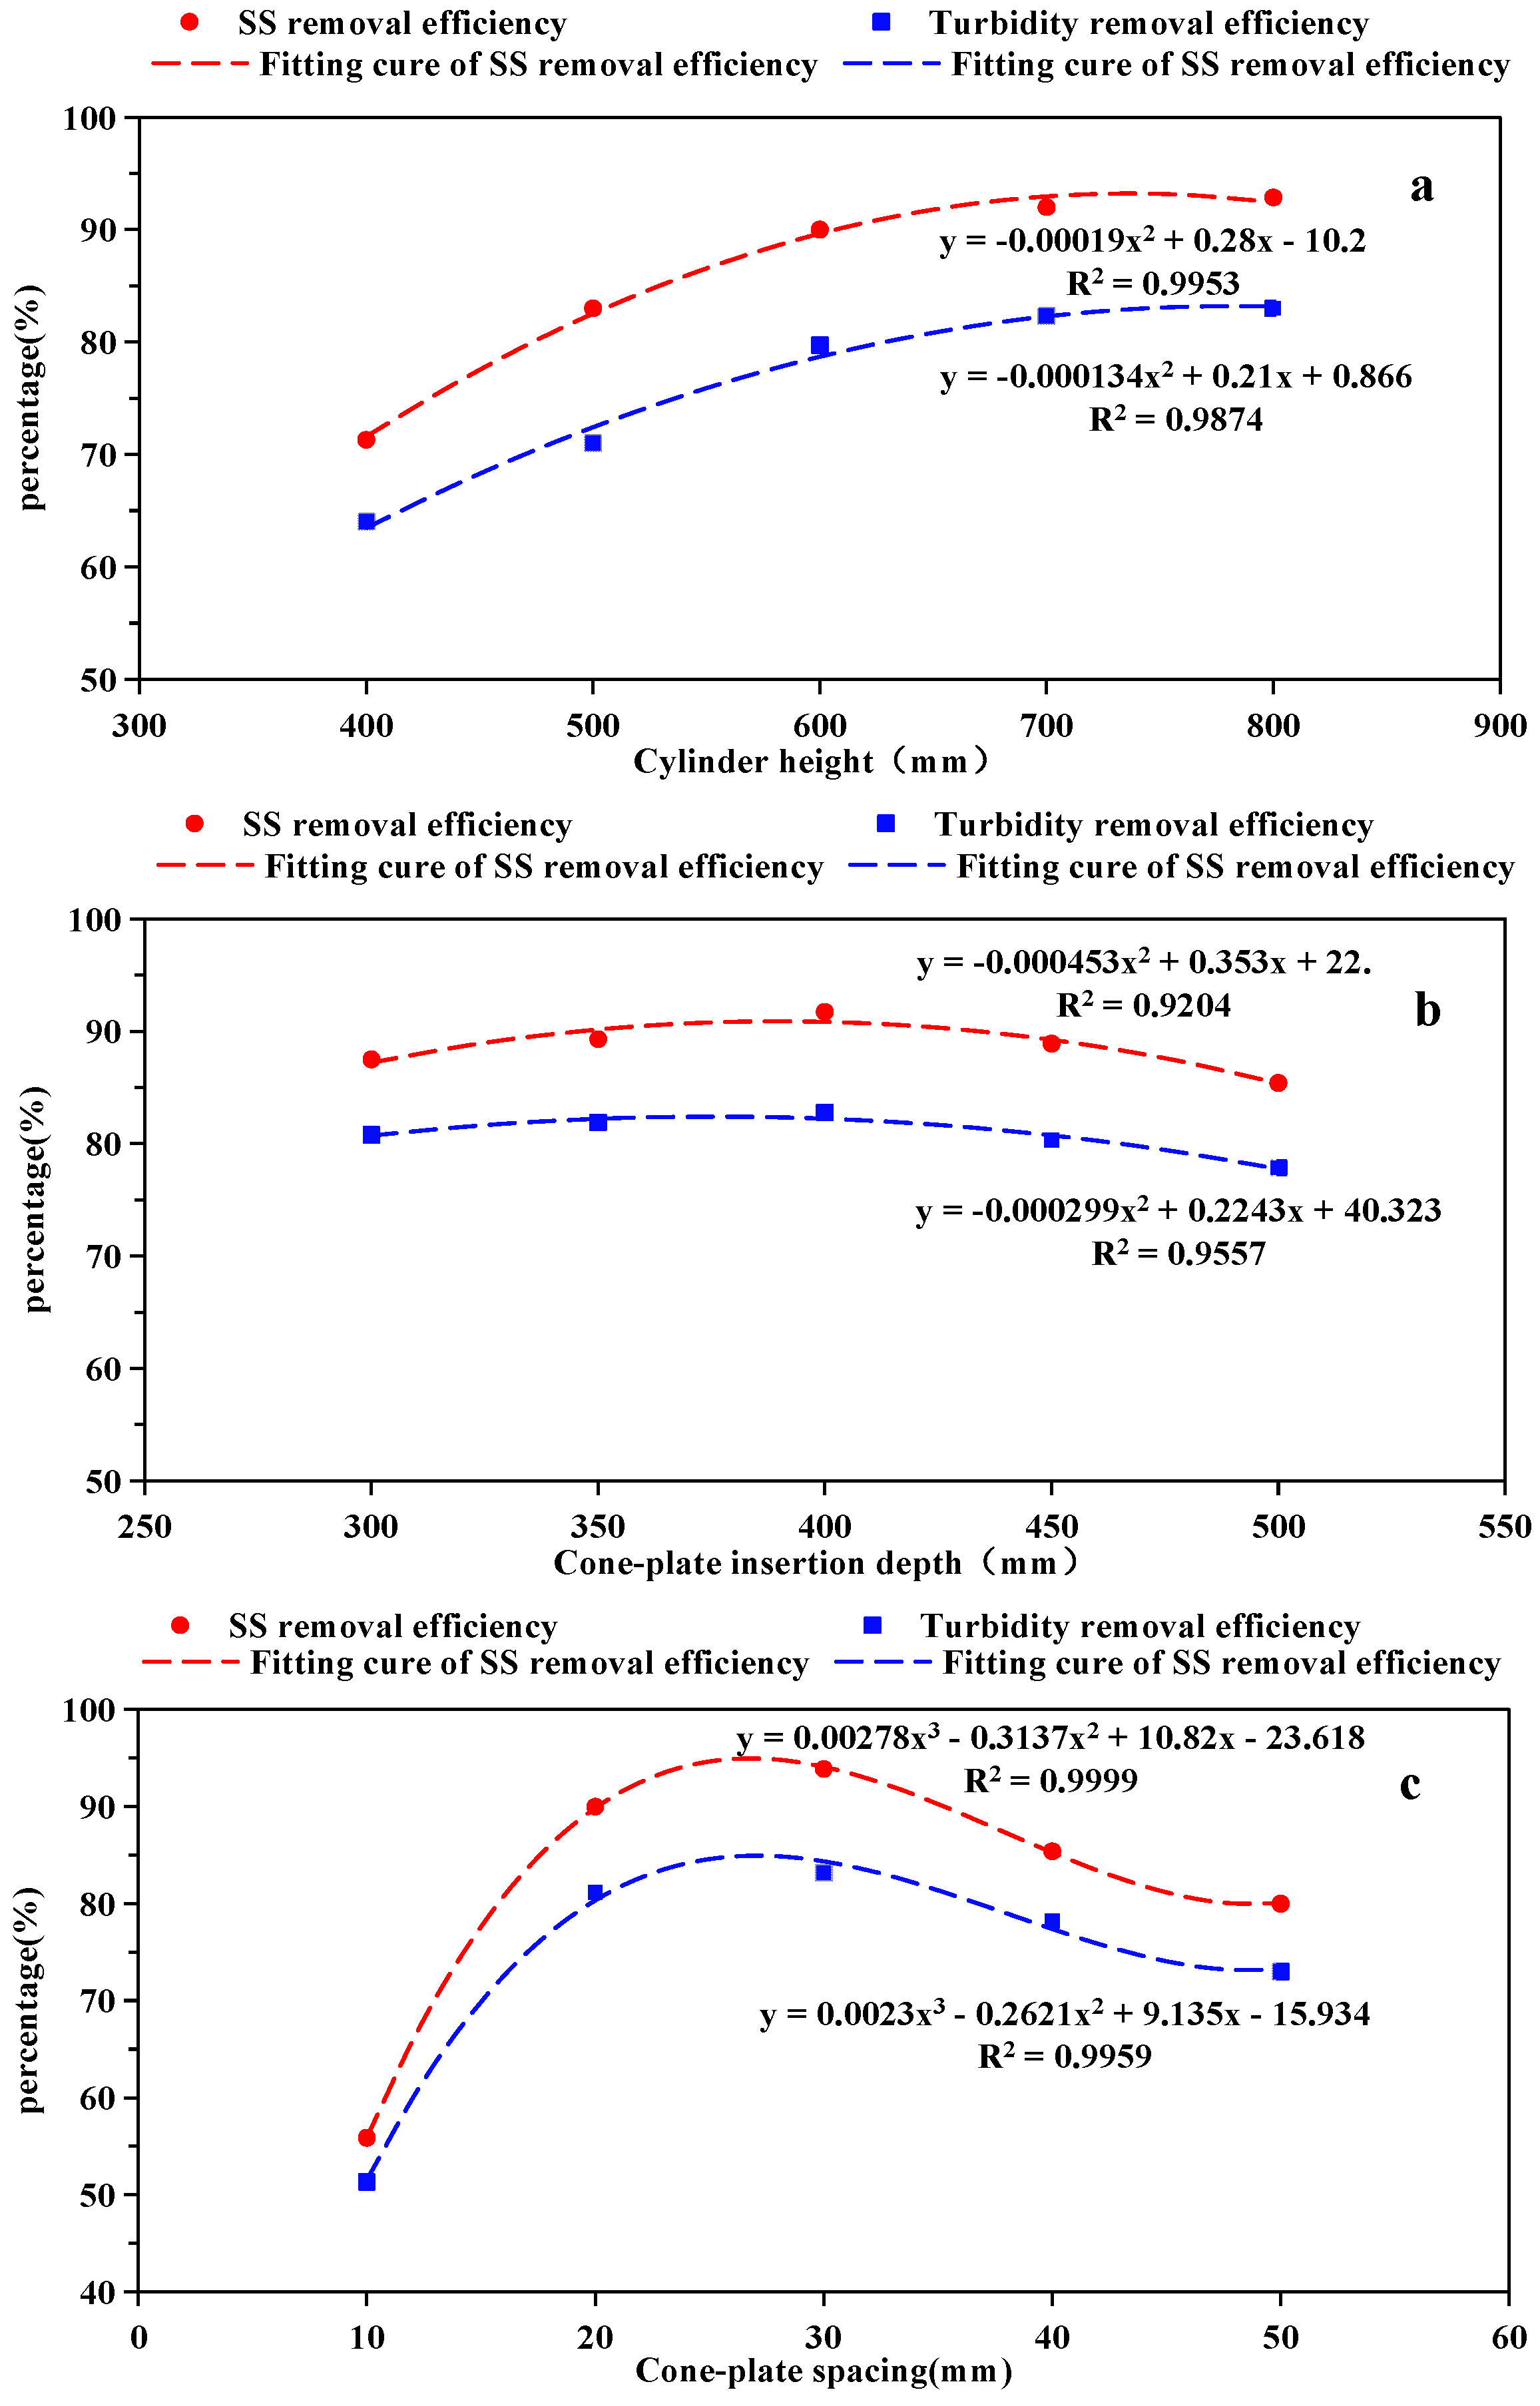
The SS and turbidity of the treated coal mine water were sampled and analyzed. The SS and turbidity removal efficiency were then calculated from the values of the raw coal mine water. The effects of cylinder height, cone-plate insertion depth and cone-plate spacing on SS and turbidity removal efficiency are shown in
Figure 10a–c, respectively.
As the height of the cylinder increases, the SS and turbidity removal efficiency increases and the rate of increase decreases. When the cylinder height reaches 600 mm, the SS and turbidity removal efficiency tend to stabilize. The SS and turbidity removal efficiency increases and then decreases as the cone-plate insertion depth increases. The maximum values were obtained at a cone-plate insertion depth of 400 mm. As the cone-plate spacing increases, SS and turbidity removal efficiency first increase rapidly and then decrease slowly. The maximum values were obtained at a cone-plate spacing between 20 and 30 mm.
A quadratic relationship between the cylinder height and cone-plate insertion depth was found with SS and turbidity removal efficiency, respectively. A cubic relationship was found between the cone-plate insertion depth with the SS and turbidity removal efficiency. The correlation indices are all greater than 0.9, which indicates that there is an excellent correlation between the structural parameters and the removal efficiency.
The respective equations were solved and the results of the optimal solutions for different structural parameters were obtained as shown in
Table 2. The SS removal efficiency reached 94.58% when the cylinder height was 737 mm, the cone-plate insertion depth was 390 mm and the cone-plate spacing was 27 mm. Similarly, a turbidity removal efficiency of 84.92% was achieved at a cylinder height of 784 mm, a cone-plate insertion depth of 375 mm and a cone-plate spacing of 27 mm.
3.3. Regression Models for SS and Turbidity Removal Efficiency with Different Structural Parameters
The cylinder height, cone-plate insertion depth and cone-plate spacing have different effects on the separation performance of the cone-plate clarifier. According to the study in
Section 3.2, a quadratic relationship was found between the cylinder height and cone-plate insertion depth with SS and turbidity removal efficiency respectively for a range of sizes. Similarly, a cubic relationship was found between the cone-plate insertion depth with SS and turbidity removal efficiency. Meanwhile, these parameters interacted with each other. The separation performance was influenced by the interaction of these structural parameters. Therefore, the combined effect of different structural parameters, such as the cylinder height (X1), cone-plate insertion depth (X2) and cone-plate spacing (X3) on the SS removal efficiency (Y1) and turbidity removal efficiency (Y2) was investigated. The regression model was also proposed.
The data required for the regression equation was found according to the fitting formula in
Figure 10.
The equation for SS removal efficiency (Y
1) was obtained as follows:
The turbidity removal efficiency (Y
2) equation was proposed as follows:
In order to check the validity of the proposed equations within a selected range of variables, some random experiments were also conducted using parameters not used in the derivation of the equations. The actual and model predicted data are listed in
Table 3.
It is evident from
Table 3 that the proposed equations predict the actual SS and turbidity removal efficiency within average errors of 1.06 and 1.3, respectively. Therefore, it suggests that regression models fit well with the experimental results.
By comparing the coefficients of each variable in Equations (2) and (3), it can be obtained that the cone-place spacing (X3) has the greatest effect on SS and turbidity removal, while the cone-plate insertion depth (X2) has the least effect. In addition, it can be seen that the coefficients of the parameters interacting with each other are significantly lower than those of the individual variables. Among the coefficients of the interaction parameters, the coefficient of X2X3 is much larger than the others (X1X2, X1X3). It indicates that the combined effect of the cone-plate insertion depth and cone-plate spacing has a greater effect on SS and turbidity removal.
By solving the equations, the maximum values of Y1 and Y2 and the corresponding values of X1, X2 and X3 in the selected range of variables were obtained, respectively. Further, the maximum values of SS and turbidity removal efficiency and their respective corresponding structural parameters were obtained. Therefore, the maximum values of SS and turbidity removal efficiency and their respective corresponding structural parameters were identified.
The SS removal efficiency reached 96.82% when the cylinder height was 708 mm, the cone-plate insertion depth was 367 mm and the cone-plate spacing was 26 mm. The turbidity removal efficiency reached 86.75% when the cylinder height was 709 mm, the cone-plate insertion depth was 369 mm and the cone-plate spacing was 26 mm.


