Article

The Use of an Unmanned Aerial Vehicle for Tree Phenotyping Studies

1
Department of Applied Sciences, Northumbria University, Ellison Building, Newcastle upon Tyne NE1 8ST, UK
2
Natural England, Lancaster House, Hampshire Court, Newcastle upon Tyne NE42 5AQ, UK
*
Author to whom correspondence should be addressed.
Separations 2021, 8(9), 160; https://doi.org/10.3390/separations8090160
Submission received: 23 August 2021 / Revised: 13 September 2021 / Accepted: 15 September 2021 / Published: 18 September 2021
(This article belongs to the Section Environmental Separations)

Abstract

:
A strip of 20th-century landscape woodland planted alongside a 17th to mid-18th century ancient and semi-natural woodland (ASNW) was investigated by applied aerial spectroscopy using an unmanned aerial vehicle (UAV) with a multispectral image camera (MSI). A simple classification approach of normalized difference spectral index (NDSI), derived using principal component analysis (PCA), enabled the identification of the non-native trees within the 20th-century boundary. The tree species within this boundary, classified by NDSI, were further segmented by the machine learning segmentation method of k-means clustering. This combined innovative approach has enabled the identification of multiple tree species in the 20th-century boundary. Phenotyping of trees at canopy level using the UAV with MSI, across 8052 m2, identified black pine (23%), Norway maple (19%), Scots pine (12%), and sycamore (19%) as well as native trees (oak and silver birch, 27%). This derived data was corroborated by field identification at ground-level, over an area of 6785 m2, that confirmed the presence of black pine (26%), Norway maple (30%), Scots pine (10%), and sycamore (14%) as well as other trees (oak and silver birch, 20%). The benefits of using a UAV, with an MSI camera, for monitoring tree boundaries next to a new housing development are demonstrated.

1. Introduction

Designated woodlands are protected places for native species of trees and shrubs that provide habitats for numerous species of fungi, invertebrates, birds, mammals, and reptiles that all contribute to providing a balanced ecosystem [1]. One of the major challenges in conserving designated woodlands is controlling the spread of invasive plant species that are non-native to the location [2]. Invasive plant species in woodland are trees and shrubs introduced by humans, negatively impacting native plant and animal communities [3]. Invasive plant species in designated woodlands can expand through natural regeneration or vegetative spread and eventually cover large land areas. This can inhibit the growth or reproduction of native species and adversely affect the ecosystem [2]. In addition, the spread of invasive plant species is ultimately costly to remove after their occupation within a woodland [4].
There has been a woodland component in the UK landscape since the end of the most recent Ice Age (12,000 years ago) [5]. By the Iron Age (750 BC-40 AD), 50% of the woodland in the UK was cleared due to agricultural activity, and by the 20th century, only 5% of the woodland was remaining [6]. In the 20th century, the need to conserve woodland was recognized, and in 1950, the conservation movement began to protect ancient woodland as nature reserve sites [7]. The term “ancient woodland” is used to describe woodland that dates from 1600 AD; however, some of these woodlands have been later modified by human activity and so are often referred to as ancient and semi-natural woodland (ASNW) [5]. Many of these woodlands were planted with native and non-native conifer or deciduous species to address national timber shortages. These are referred to as Plantations on Ancient Woodland Sites (PAWS) [8]. These species often create unsuitable conditions for native species through either deep shade or changes to soil pH. Some plantation species can be invasive and pose a threat to the wider ancient woodland community. In comparison with some European countries, the UK is one of the least-wooded countries. It is, therefore, an important cultural and social responsibility to protect the destruction of the woodlands by urban development and to restore and create natural ecosystems that are diverse and rich in wildlife.
There are approximately 340,000 hectares of ancient woodland in England. Of these, 200,000 hectares are considered semi-natural, that is, of natural origin rather than artificially planted [9]. Methods for monitoring invasive tree species in woodland has traditionally involved field-based assessment methods to assess trees below the canopy level. However, issues with this approach can be due to restricted access due to ground cover plants and the physical location [10]. In addition, field assessment methods are costly and can be time-consuming and; hence, the interest in the use of remote-sensing technology has been long favored as a tool for monitoring invasive species [1]. Remote sensing techniques have become an area of interest during the last two decades to monitor invasive species as they can provide a synoptic view over a large area. Remote sensing is a non-destructive technique that uses a diverse array of sensors and platforms to collect information from above the Earth’s surface without contacting the object under investigation. There are two main remote sensing approaches for mapping and locating invasive tree species: low spatial resolution and high spectral resolution via satellite and (un)manned aircraft remote sensing platforms [11]. The spectral resolution is defined by the number of different wavelengths in the electromagnetic spectrum operated by the sensors in a remote sensing platform [12]. Spatial resolution is defined by the number of pixels required to comprise an image by the ground sampling distance (GSD) of a sensor. The high spectral resolution entails using hyperspectral sensors, often via satellites, to collect aerial images from hundreds of narrow bands in the visible, near-infrared (NIR) and shortwave infrared regions of the electromagnetic spectrum [13]. Hence, hyperspectral satellite platforms have distinguished invasive tree species by their spectral signatures, structural and functional properties [13,14,15,16,17,18]. However, hyperspectral satellite platforms for monitoring invasive tree species have several limitations, such as the cost of the hyperspectral sensors and the resultant data complexity, which requires high computing power for the processing, which is time-consuming [11]. Moreover, the low spatial resolution of 30–300 m/pixel offered by the satellite platforms becomes inefficient at identifying a small population of invasive tree species and shrubs [19]. Furthermore, satellites offer a low temporal resolution, restricting a multiday revisit cycle to a location [19]. Conventional airborne multispectral and hyperspectral manned aircraft have also been used for invasive plant species monitoring [20,21,22,23]. However, manned aircraft are low in spatial resolution, costly to maintain, require operating personal, and are not economically viable for most invasive species monitoring and management, especially when continuous monitoring is required.
UAV, popularly known as drones, are controlled without an onboard pilot and can fly autonomously or with the help of a remote control ‘pilot’ on the ground. UAV remote sensing has emerged in recent years to monitor invasive tree species using either a consumer-grade digital camera or multispectral sensors which use the visible and NIR regions of the electromagnetic spectrum. The ultra-high spatial resolution of 0.1–0.5 cm/pixel offered by UAVs potentially enables the effective detection and monitoring of understory invasive plant species using cost-efficient sensors [24]. Furthermore, UAVs are less susceptible to the weather, specifically cloud cover, due to their significantly lower flight altitude, e.g., 100 m; UAVs can fly below low clouds removing any potential barrier from their field of view as well as offering flexible temporal resolution where data can be collected multiple times in a day. Due to the benefits of UAV, studies for monitoring invasive plant species have emerged globally from Africa, North America, South America, Europe, and New Zealand with promising results [2,11,19,25,26,27,28,29,30]. However, these studies often use fixed-wing UAVs that offer less stability. They can only move forward and cannot hover in the air, leading to unsatisfactory data collection compared to multirotor UAVs. Moreover, the sensors mounted on these UAV platforms are mainly RGB and NIR, which limits the spectral resolution for obtaining accurate spectral features of the invasive tree species. Furthermore, the hyperspectral sensors used in some of these studies are expensive and require extensive interpretation of data [2,30]. Thus, the most promising and cost-efficient approach employs multispectral sensors to capture images across spectral channels from the visible to NIR regions. Amongst recent research using multispectral UAVs to detect invasive tree species has been the mapping of Sydney golden wattles plants in Portugal by random forest classification models [28] and detection of invasive exotic conifers of Scots pine and ponderosa pine in New Zealand by random forest and logistic regression models [24]. However, despite the great potential offered by UAVs, obtaining meaningful information from the captured data remains challenging. Most of the methods require extensive machine learning classification methods using random forest, regression trees or a support vector mechanism which require a data training set, making these approaches time consuming and computationally intensive. It is doubtful if these methods are widely transferable.
Simpler image classification methods linked with principal component analysis (PCA) and k-means segmentation might offer promising results as they require little training. PCA is a multivariate statistical method often applied in image analysis and classification to reduce the amount of redundant information. PCA provides the most important information in an image which can be useful to differentiate scene elements [31]. The results obtained from PCA for each multispectral band can be used to derive a suitable normalized difference spectral index (NDSI) that effectively enhances spectral features not visible in an RGB image. Currently, the available spectral indices are limited for a specific use, such as the Normalized Difference Vegetation Index (NDVI), which monitors the health and growth of trees or crops. This research investigates the use of information from each multispectral band to derive a suitable NDSI specifically to determine the invasive tree species. This innovative approach compensates for the variation in pigmentation from chlorophyll and carotenoids, which can vary within a tree. Additionally, the discriminated trees from the NDSI algorithm can be classified using the simpler segmentation methods of k-means clustering. K-means clustering is an unsupervised learning algorithm that aims to segment the number of trees in an image to individual tree clusters. By considering the spectral features of individual trees, or phenotyping, and grouping a distinctive pixel value for each cluster, this enables the identification and quantification of tree types. Furthermore, these convenient classification models have not been previously used to classify invasive tree species in an ASNW.
With appropriate digital software manipulation, we aimed to use a UAV with multispectral image sensors to phenotype the non-native tree species alongside a 17th to mid-18th century ancient and semi-natural woodland (ASNW). Data analysis techniques will be investigated to (a) perform PCA classification on the multispectral images to derive an NDSI algorithm that allows determination of the non-native 20th-century species, and (b) to segment the discriminated invasive tree species by a k-means clustering method. The developed algorithm will allow both identification and quantification of the invasive tree species. The results will be corroborated with field study data obtained at ground level.

2. Methodology and Apparatus
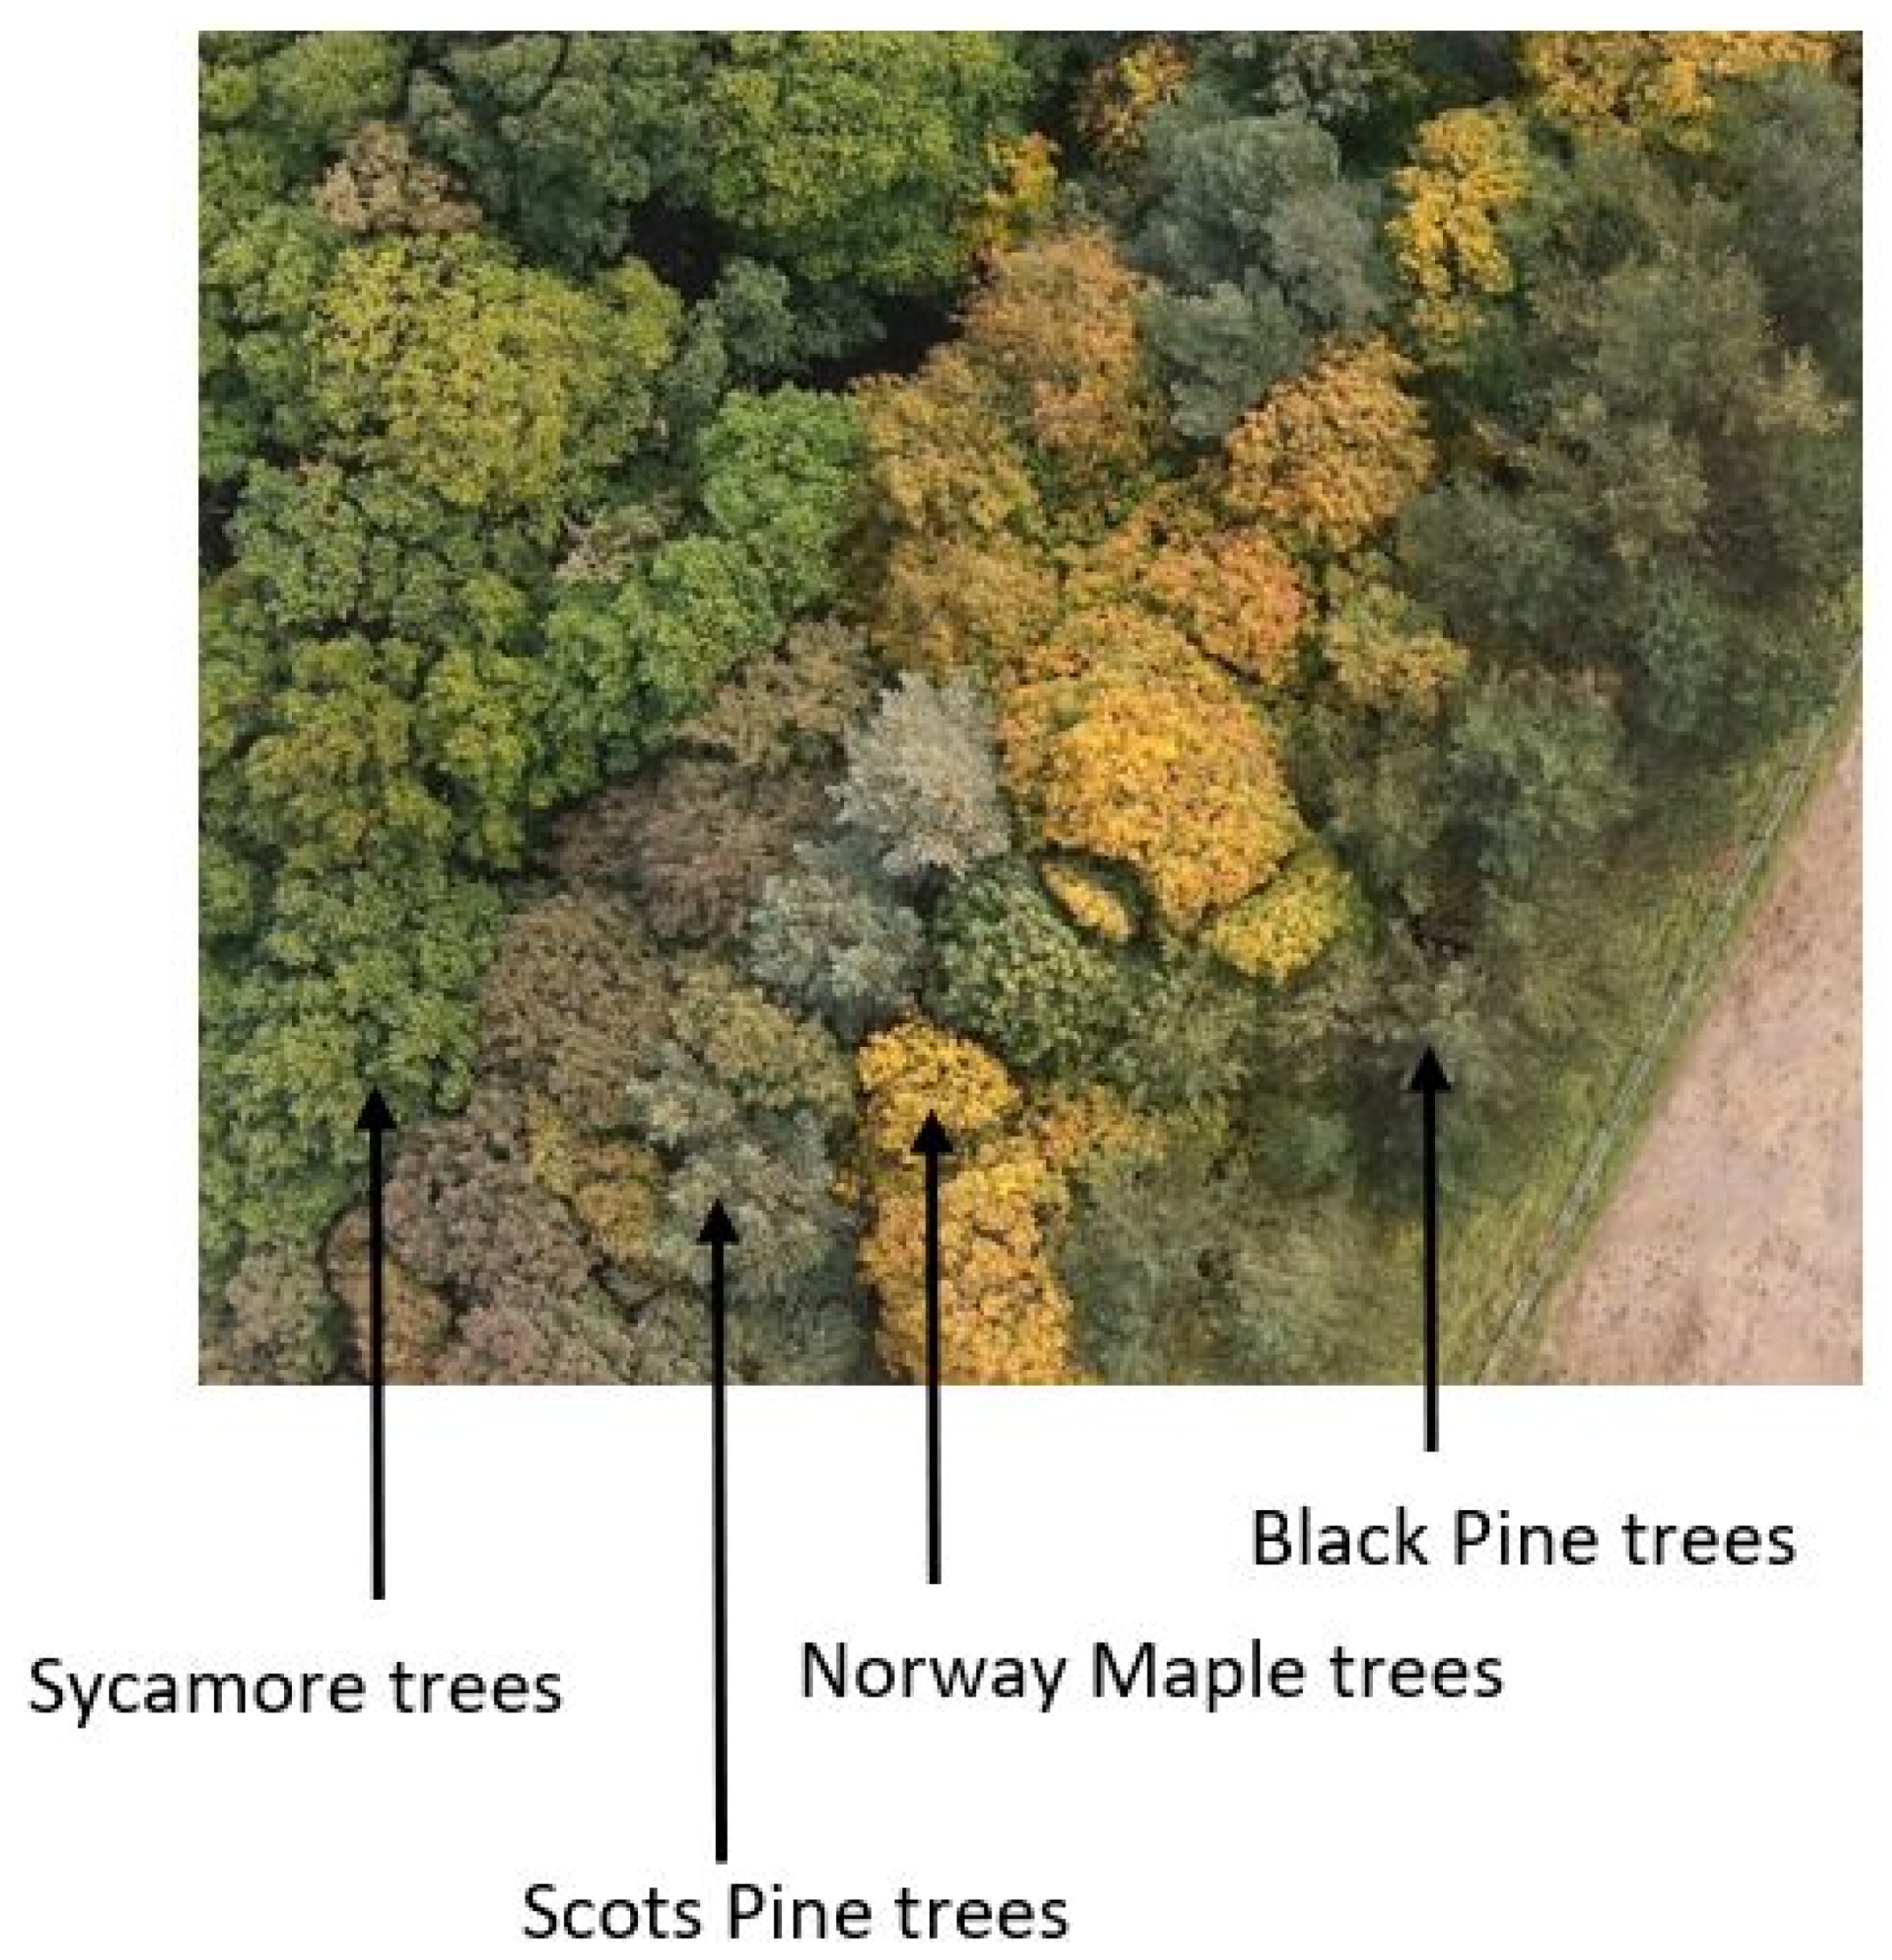
2.1. Sampling Site

Priestclose Wood is a 193,500 m2 woodland close to the center of Prudhoe (Northumberland, UK) (Figure 1a), of which 152,600 m2 is categorized as an ancient and semi-natural and managed as a Local Nature Reserve by the Northumberland Wildlife Trust (NWT) [32]. The wood is predominantly a mixture of Pedunculate and Sessile oak (Quercus robur and Quercus petraea) and silver birch (Betula pendula). The southern boundary (Figure 1b) is a planted 20th-century design landscape added to the 17th mid-18th century ASNW [33]. In 2015, Northumberland County Council: Area Planning Committee considered the maintenance of this boundary as part of the planning application for a new housing estate (Cottier Grange). It was confirmed [34] that a sufficient buffer zone should be maintained between the new housing estate and the ASNW.

2.2. Unmanned Aerial Vehicle

A multirotor UAV (DJI Phantom 4, supplied by Coptrz Ltd., Leeds, UK) was used with a multispectral camera. The multispectral image camera operates with a 5 camera-array covering the blue (450 ± 16 nm), green (560 ± 16 nm), red (650 ± 16 nm), red edge (730 ± 16 nm) and near-infrared (840 ± 26 nm) spectra with an additional camera that can also provide live images in RGB (visible) mode as well as in normalized difference vegetation index (NDVI) mode. All cameras were stabilized with a 3-axis gimbal. In all cases, the camera was angled perpendicular to the ground, with data capture occurring in hover and capture mode. Images were captured as 16-bit TIF files corrected for ambient radiance values. The UAV speed was 5.0 m/s and had an average height of 100 m. All flights were recorded with a resolution of 5.3 cm/px, a front overlap ratio of 75%, a side overlap ratio of 60% and a course angle of 90°. Specific weather conditions relating to daytime temperature during flight, wind speed and direction (recorded using a handheld anemometer (Benetech® GM816, Amazon UK)), and UAV pilot anecdotal observations on cloud coverage are identified with specific dated data.

2.3. UAV Data Analysis: Photogrammetric Processing

From the images taken by the multispectral UAV, an orthomosaic image was produced using Agisoft Metashape Professional (64 bit) software v.1.7.1 (Agisoft LLC, St. Petersburg, Russia). Photogrammetric processing using Agisoft was performed as follows. Initially, the individual images were selected as a group and aligned to generate a sparse point cloud where photographs were matched according to similar features. Afterwards, a dense 3D point cloud was built based on the estimated photograph positioning, where the software calculates the depth information of each photograph and then combines it into a single dense point cloud. The dense point cloud was then used to build a mesh model that defines the combined image’s vertices. Finally, the above steps had to be completed for the software to automatically build an orthomosaic aerial image free of camera lens-related distortion. The x y coordinates system assigned to build the orthomosaic was set to the WGS 1984 Web Mercator. This software provides an automated image processing sequence to align multiple individual images that can be stitched together to build an orthomosaic image, which we term as the aerial image (Figure 1).

2.4. Field Data Analysis

Tree identification, and its mapping with a handheld GPS (Garmin Oregon 600), was done at ground level on the 13 March 2021. Visual identification was done by observation of tree bark, canopy shape and the leaf buds. The main tree types identified were black pine, Norway maple, oak, Scots pine, silver birch and sycamore. The site was surveyed, by foot, by an independent tree surveyor and accompanied by a recorder. The GPS coordinates of the identified trees in the field study were allocated on the orthomosaic image (Figure 1). The software to input x,y coordinates for each location of tree was done using ArcGIS Pro v.2.8.0 (Esri Inc., West Redlands, CA, USA).

2.5. Image Processing and Data Analysis

Further image processing and implementation of algorithms, such as, PCA and vegetation indices (VI) and image segmentation by k-means on the multispectral UAV images were performed using MATLAB v.R2020b (MathsWorks Inc., Natick, MA, USA) a programming language software. The workflow of processing data is summarized in Figure 2. The first step involves the visual interpretation of the RGB images and the selection of the image dataset. Afterwards, PCA was performed on the selected multispectral image dataset using the MATLAB programming software. The PCA result was used to derive a suitable spectral index to classify the tree species. This was done using the eigenvectors in each spectral band from the first three PCs, as it retained more than 80% of the information for the classification of the tree species. The new spectral index was applied to the whole dataset. Then, the image from the dataset was stitched to an orthomosaic image. Finally, k-means segmentation was performed, allowing further refinement of the spectral index leading to quantitation of tree species types.

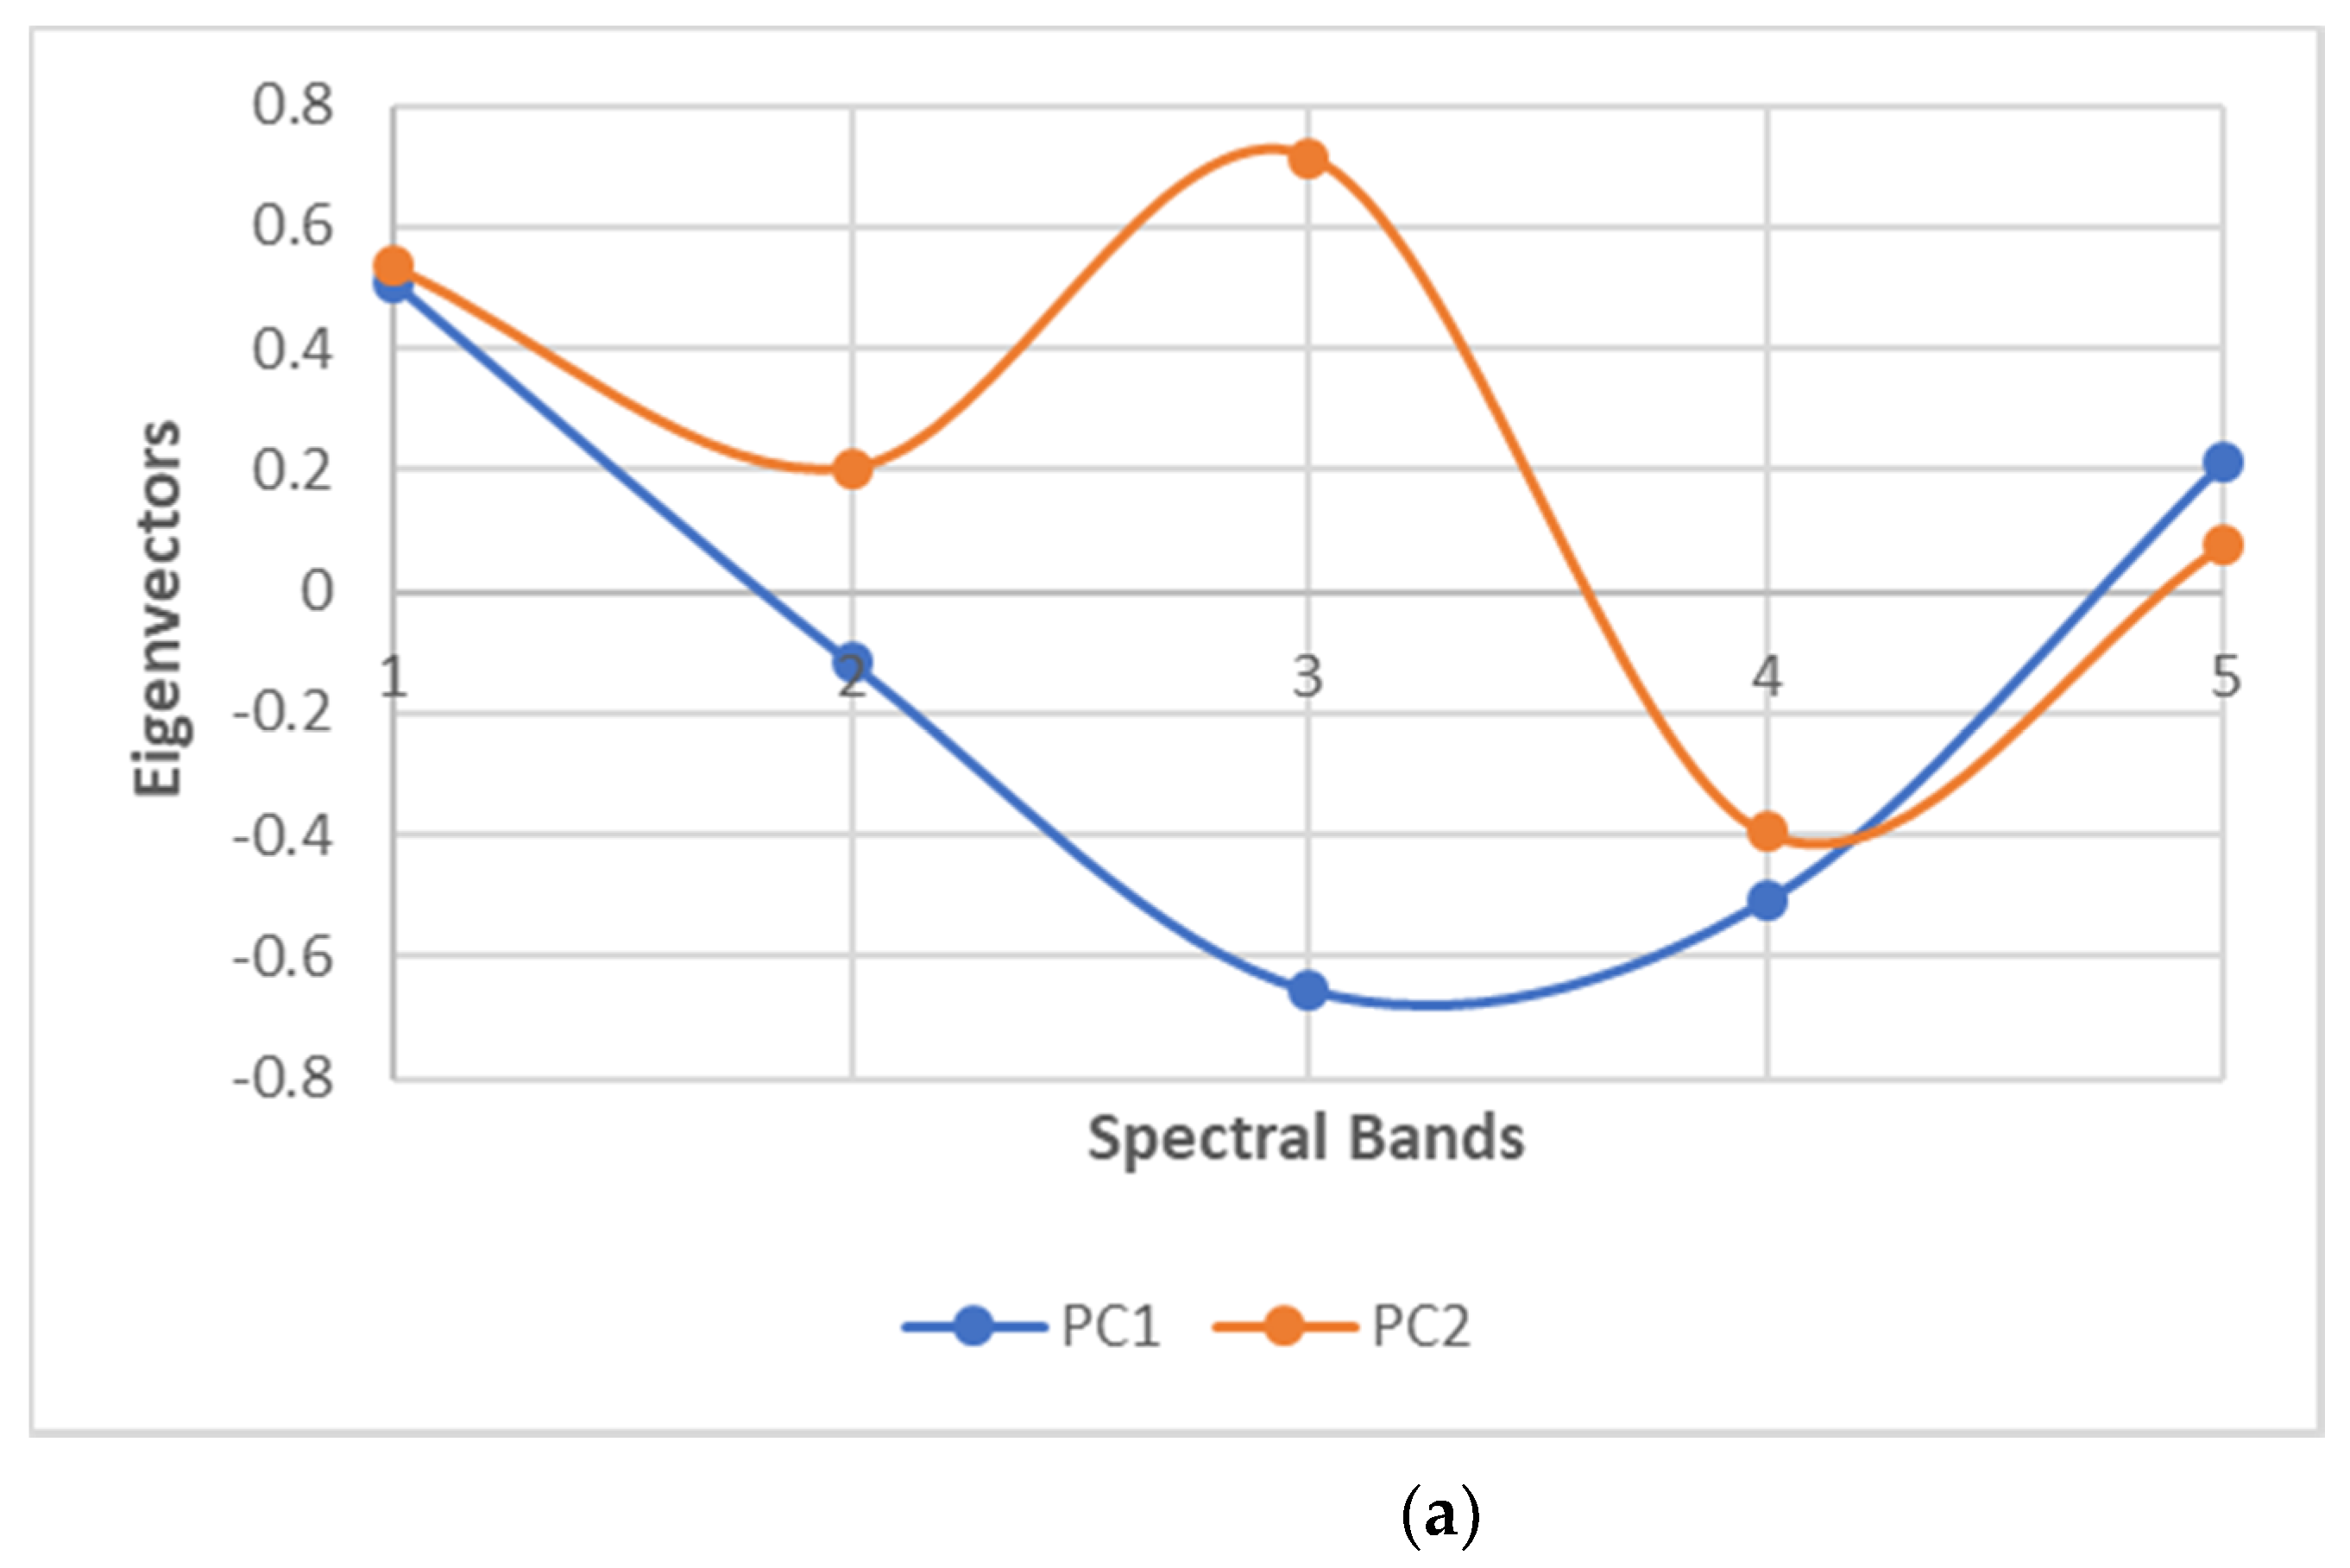
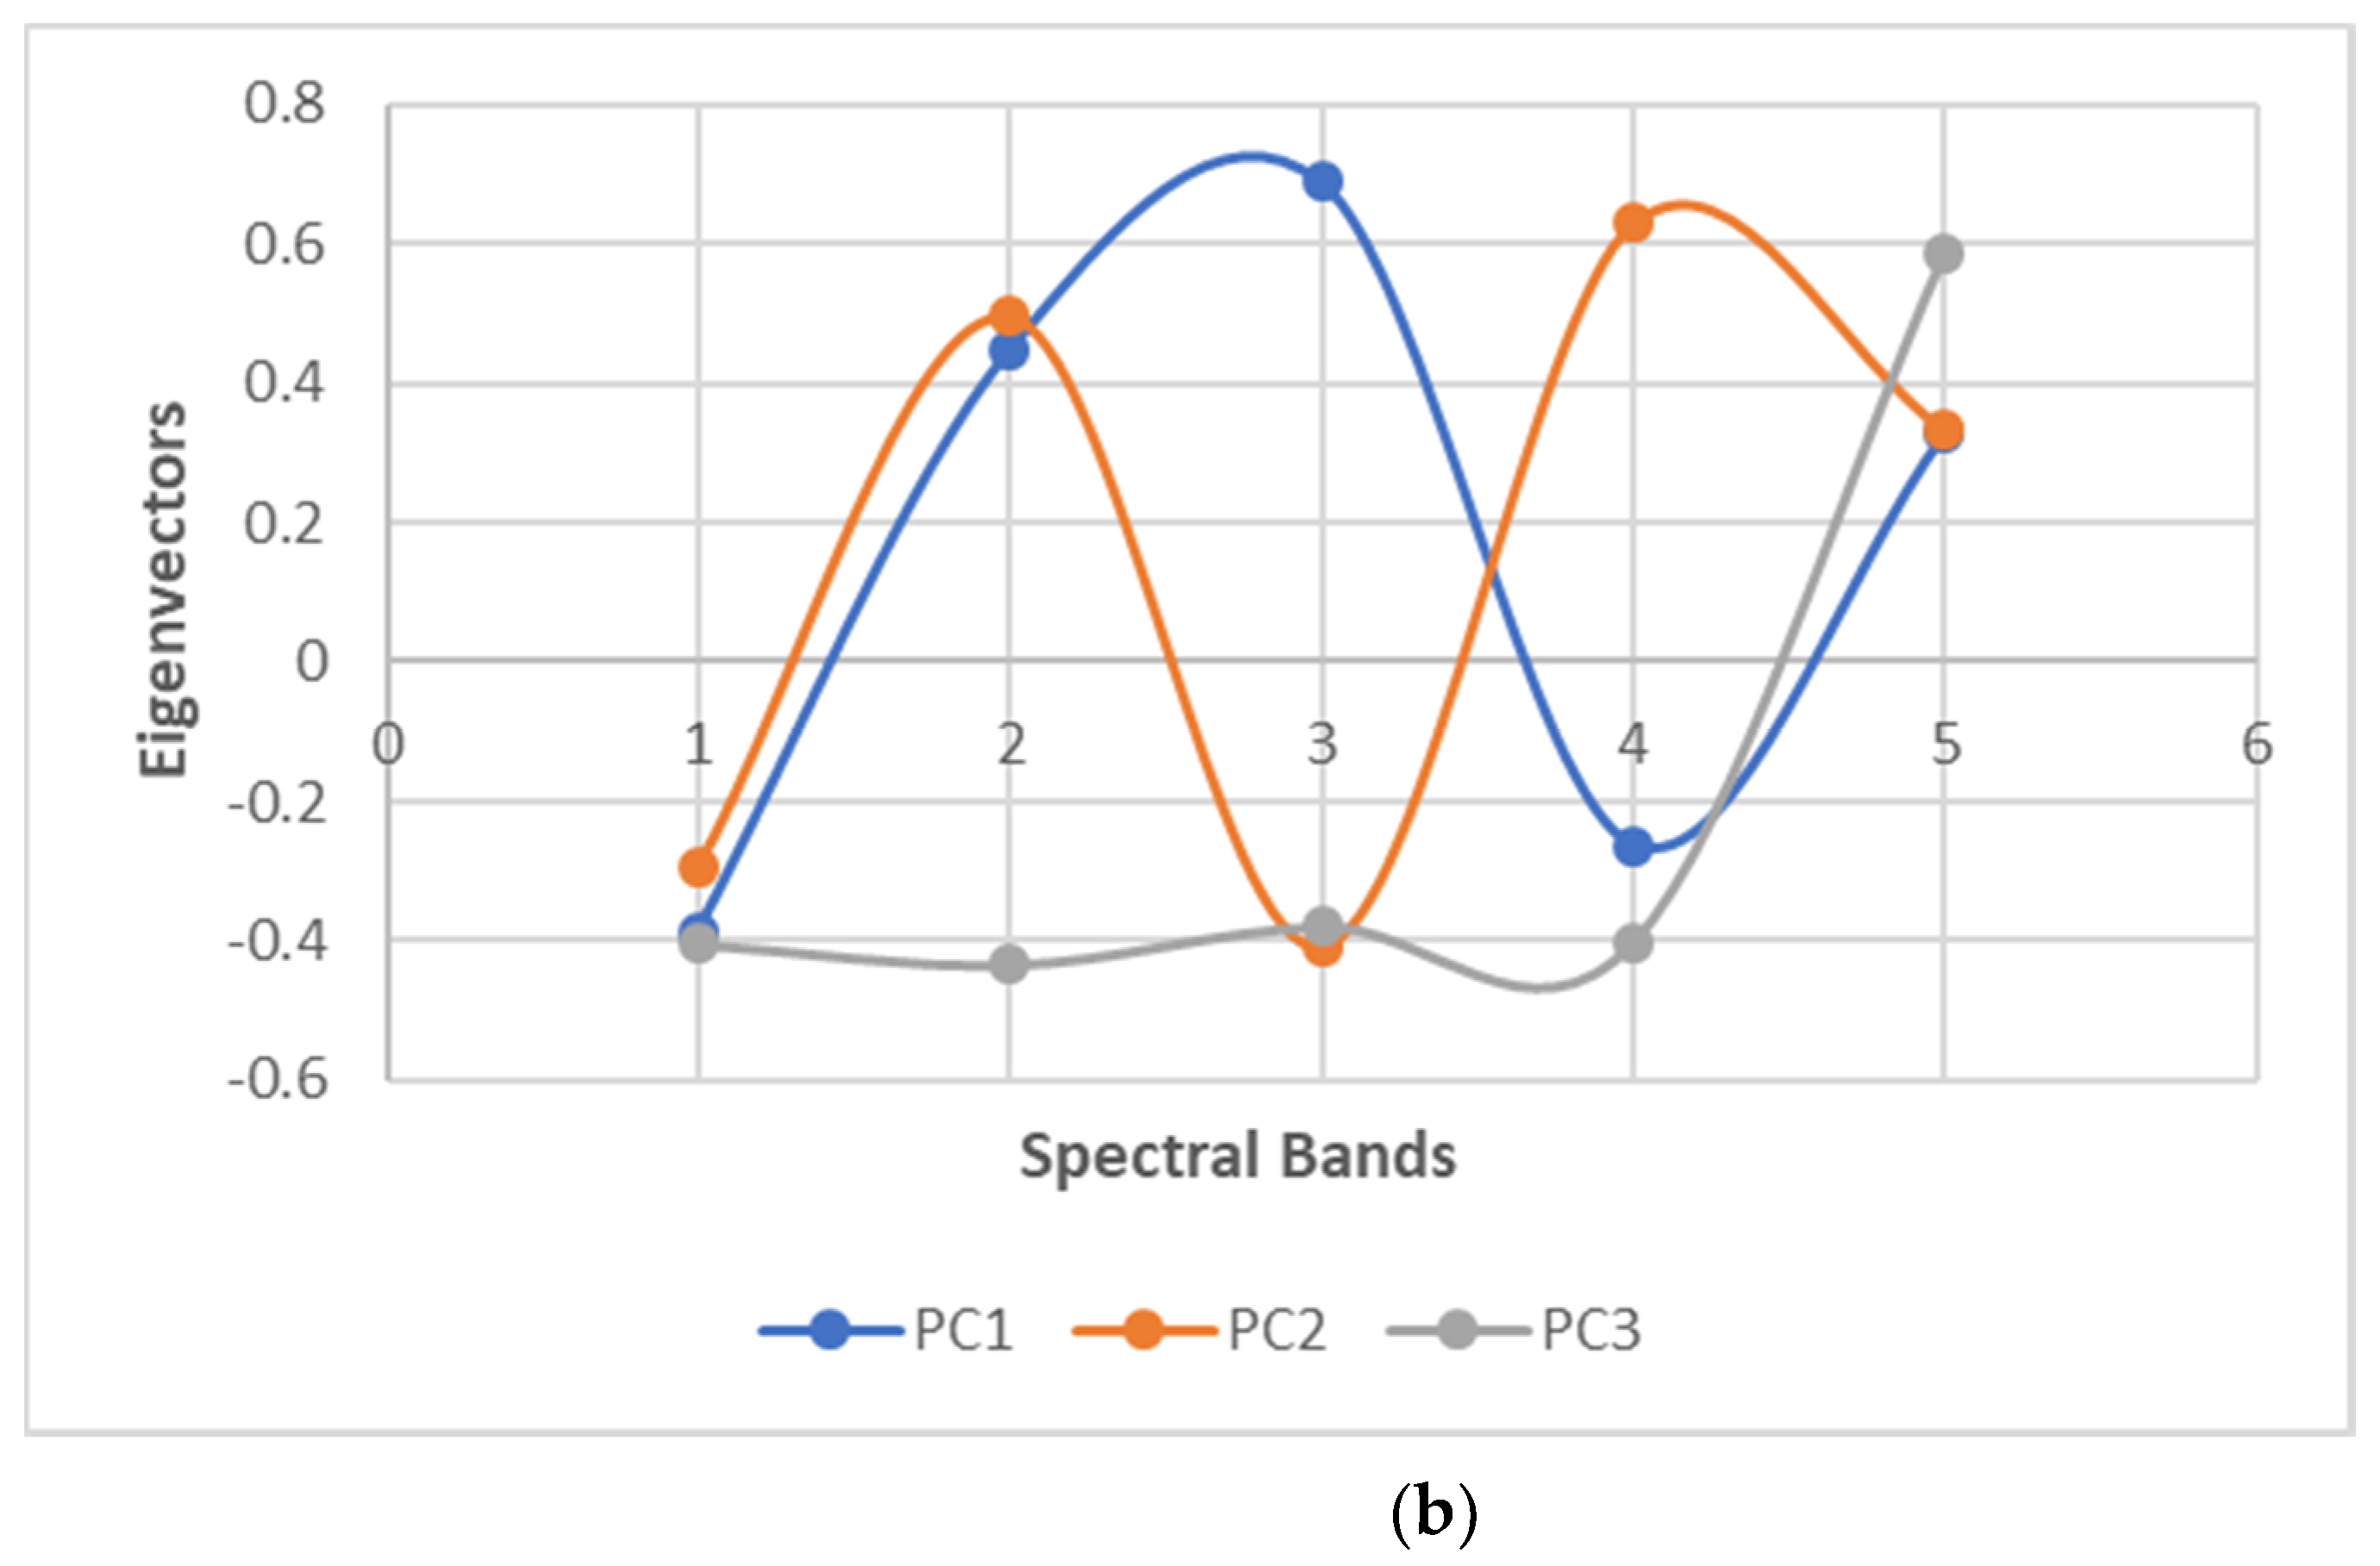
2.6. Principal Component Analysis Applied to Obtained Data

From the image data set of the woodland boundary, RGB (visible) images were used to display the different tree species (Figure 3). Visual observation of the images from the data set was crucial as all the images from the data set do not contain all the non-native tree species. Afterwards, multispectral image data sets representing the native tree species (Figure 4a) were selected. The multispectral images were red, green, blue, red edge and NIR were analyzed using MATLAB to generate the PCA. This data interrogation generated the eigenvectors and % variance (Table 1) representing the features extracted from the multispectral image data set. The % variance obtained for the first three principal components (PCs) was 86.806 (Table 1a), which retains the most important information that can be used for effective data analysis. Hence, the PCA results obtained using the multispectral image data set (Figure 4a) were used to build a new spectral index to extract features to discriminate the pine, Norway maple and sycamore trees. The new spectral index was calculated using the pixel values from the PC as follows:
Normalized Difference Spectral Index (NDSI) = (x1 − x2)/(x1 + x2)
This NDSI can be used to differentiate scene elements and enhance spectral features that are not visible. In addition, PCA can allow a selection of multiple spectral bands, thereby providing the option to select or eliminate desired spectral bands. Using this approach, appropriate PCs with their eigenvectors were used to derive a new NDSI to differentiate the non-native tree species (Figure 5a). Eigenvectors indicate the proportion that each input spectral band contributes to each PC. Figure 5a shows the eigenvector values for each multispectral band in PC1 and PC2 for the multispectral image data set in Figure 4a. According to Figure 5a, PC1 (i.e., blue and NIR spectral bands only) indicate positive eigenvector values while PC2 (i.e., blue, green, red and NIR spectral bands) indicate positive eigenvector values. By combining the information of the eigenvectors from these individual spectral bands would be useful at extracting meaningful features for differentiating tree species, i.e., pine, Norway maple and sycamore trees, by the newly derived NDSI:
NDSI = (PC1)/(PC2 + PC2 + PC1)
Unfortunately, the new NDSI was insufficient to classify Scots and black pine as two separate trees. Therefore, an RGB image and the multispectral data set (Figure 4b) was selected to perform PCA to classify the pine trees. The % variance obtained was 87.552 (Table 1b) for the first three PCs. Figure 5b shows the eigenvector values for each multispectral band in PC1, PC2, and PC3 generated after performing PCA for the multispectral image data set (Figure 4b). Figure 5b shows that PC1 (i.e., green, red and NIR spectral bands only) indicates positive eigenvector values. While PC2 (i.e., green, red edge and NIR spectral bands) indicate positive eigenvector values, PC3 (i.e., the NIR spectral band) indicates a positive eigenvector value. Combining the information from the eigenvector values for the spectral bands in PC1, PC2, and PC3 enables discrimination of the Scots pine trees. Therefore, a new spectral index using the eigenvectors from the first three PC score images were combined to extract features enabling classification of the Scots pine trees.
Spectral Index = (PC1 + PC2 + PC3)
The new indices were then applied on the 20th century woodland boundary data in preparation for further analysis.

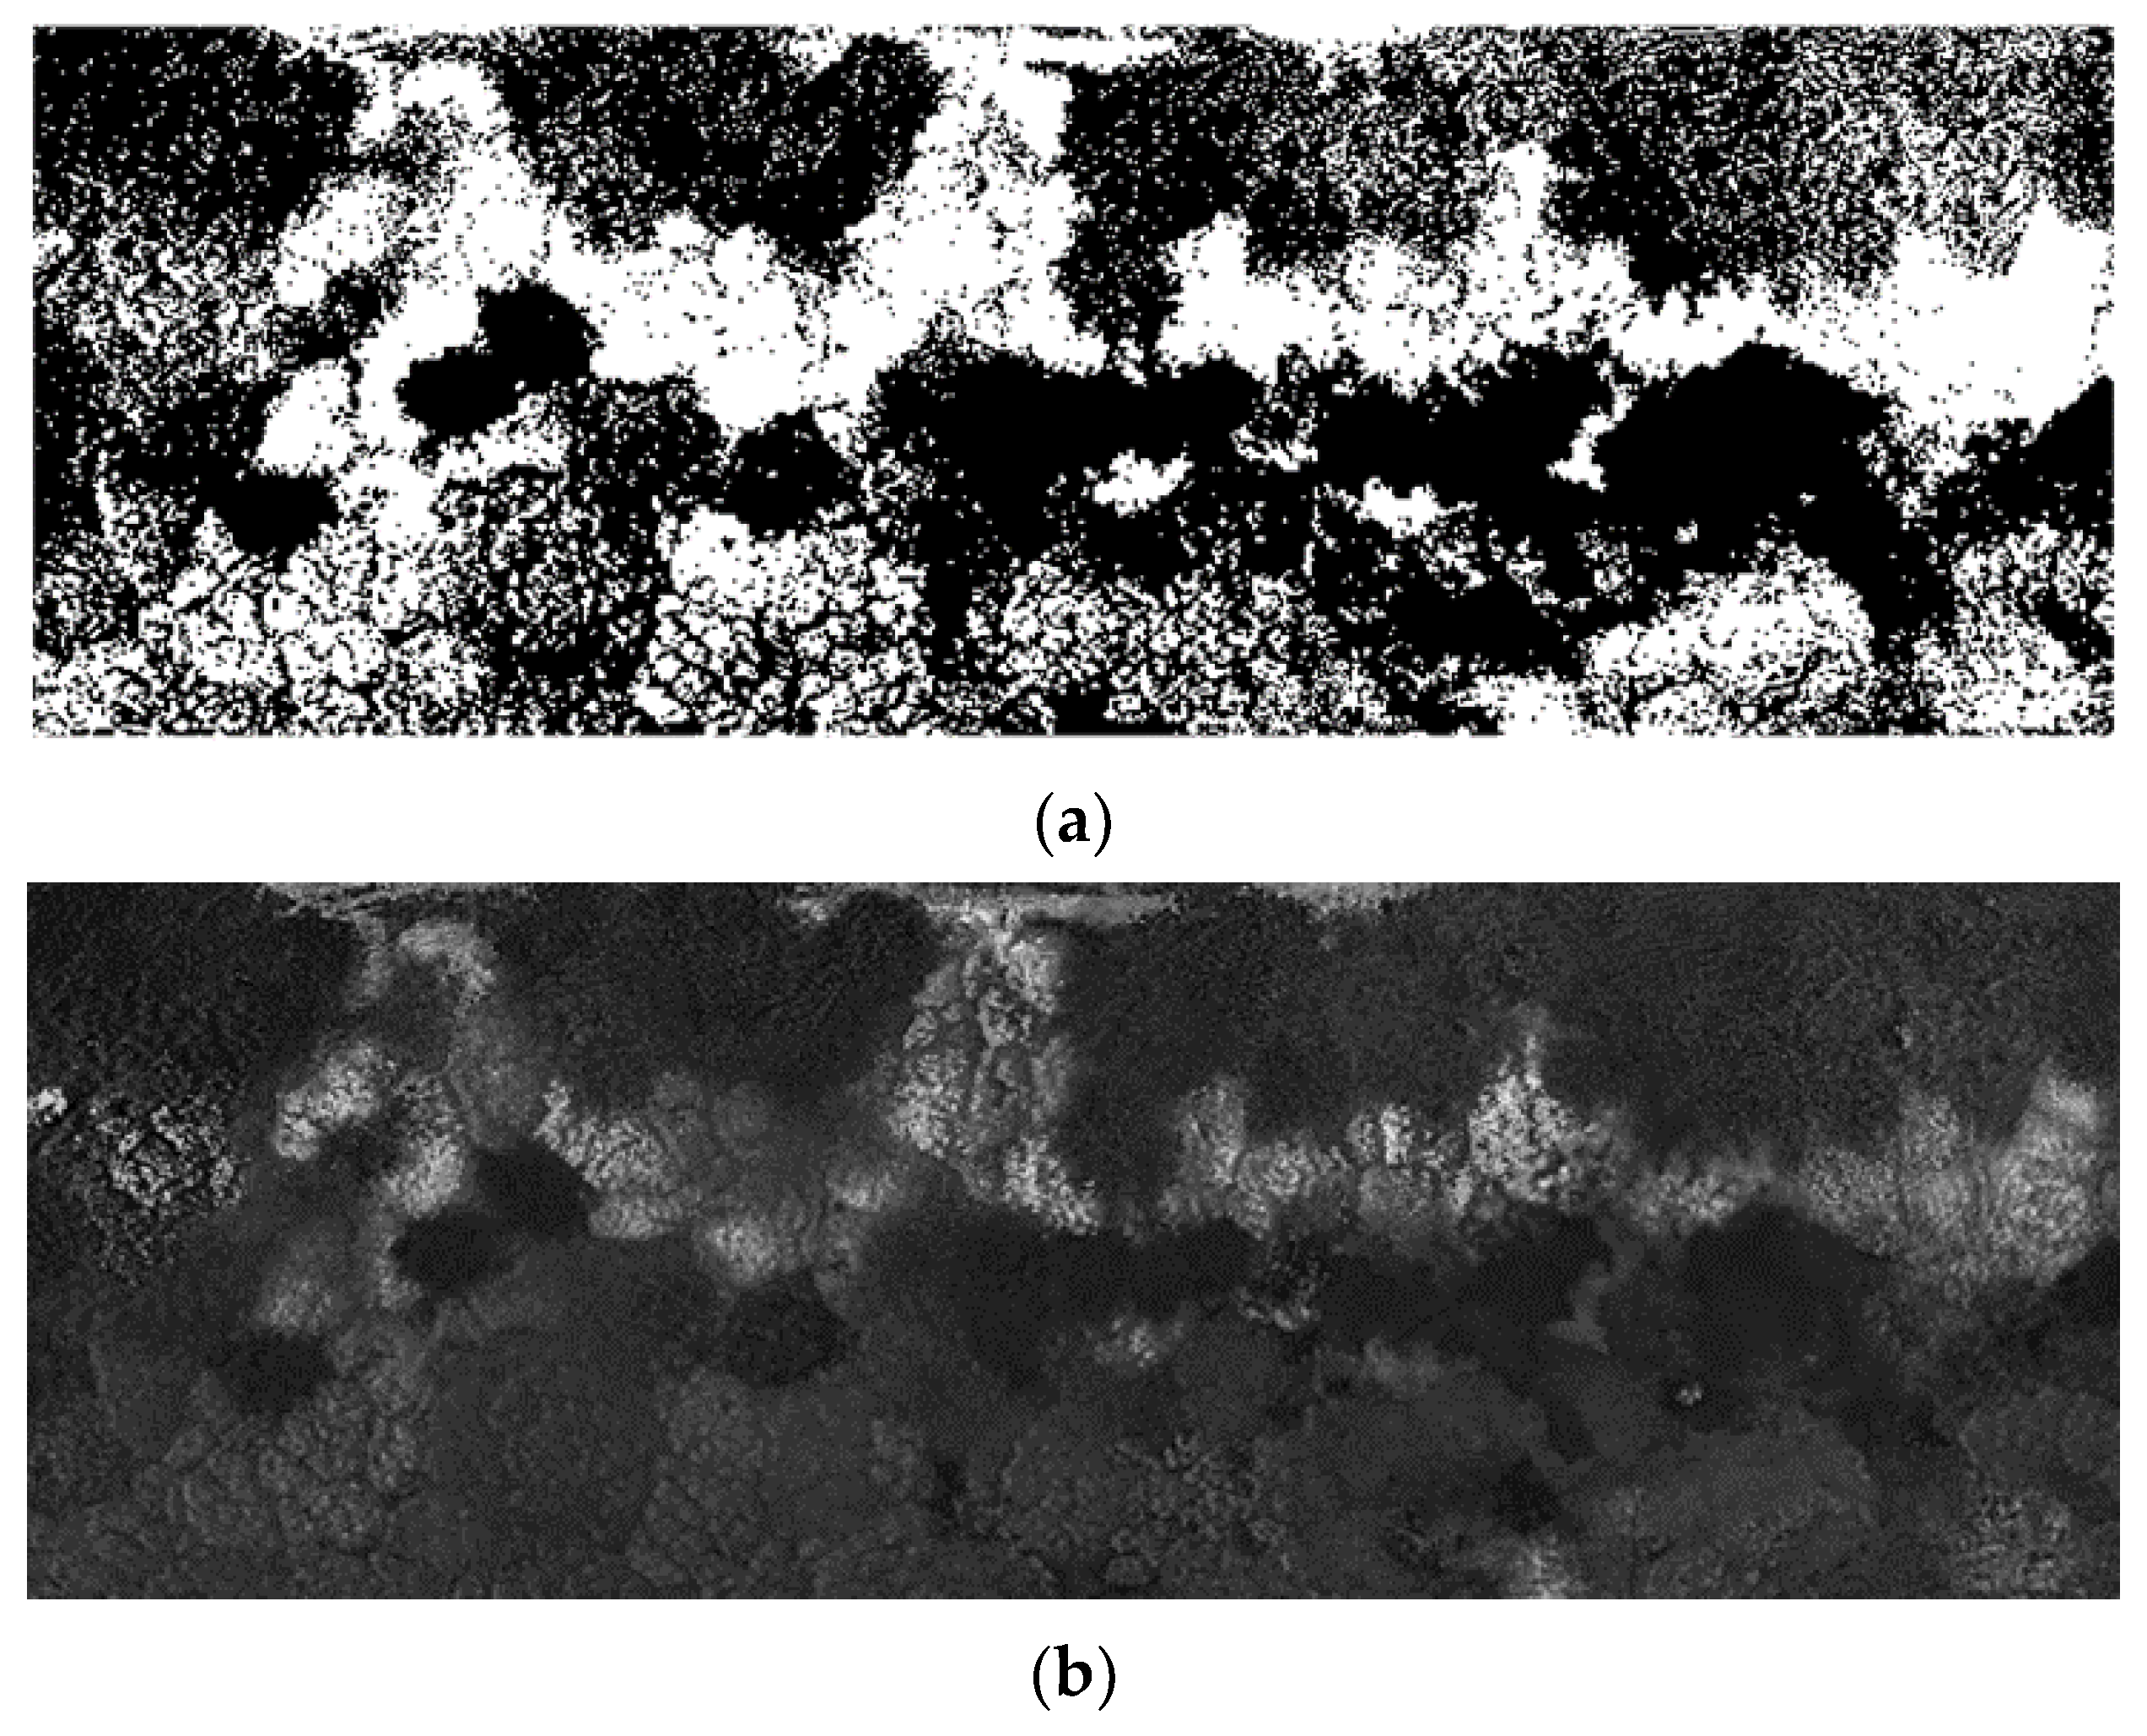
2.7. K-Means Segmentation and Quantification of Invasive Tree Species

Image segmentation translates an image into a group of pixels represented by a labelled image or a mask [35]. It can be used for segmentation of the UAV images into group non-native and native trees. Hence, k-means segmentation was performed on the dataset classified by the new spectral index. It was used to segment different non-native tree species from the background vegetation into different clusters by assigning a separate pixel value for each cluster in the image. The clusters were obtained by observing the similarity in the data, or phenotyping, represented by the assigned k-number of clusters. This approach then calculated and placed centroids according to the k-number of the clusters. The algorithm then calculated the Euclidean distance for each pixel with respect to the centroid. This approach classifies each pixel based on its closest distance according to the similarity threshold and assists in grouping similar pixel values into different clusters, which then can be quantified to identify the area of each non-native tree species. The total pixel count of each respective area was then multiplied by the resolution of the captured drone images (0.053 m/pixel * 0.053 m/pixel) and values determined for both the total woodland investigated as well as for the individual tree species.

3. Results and Discussion

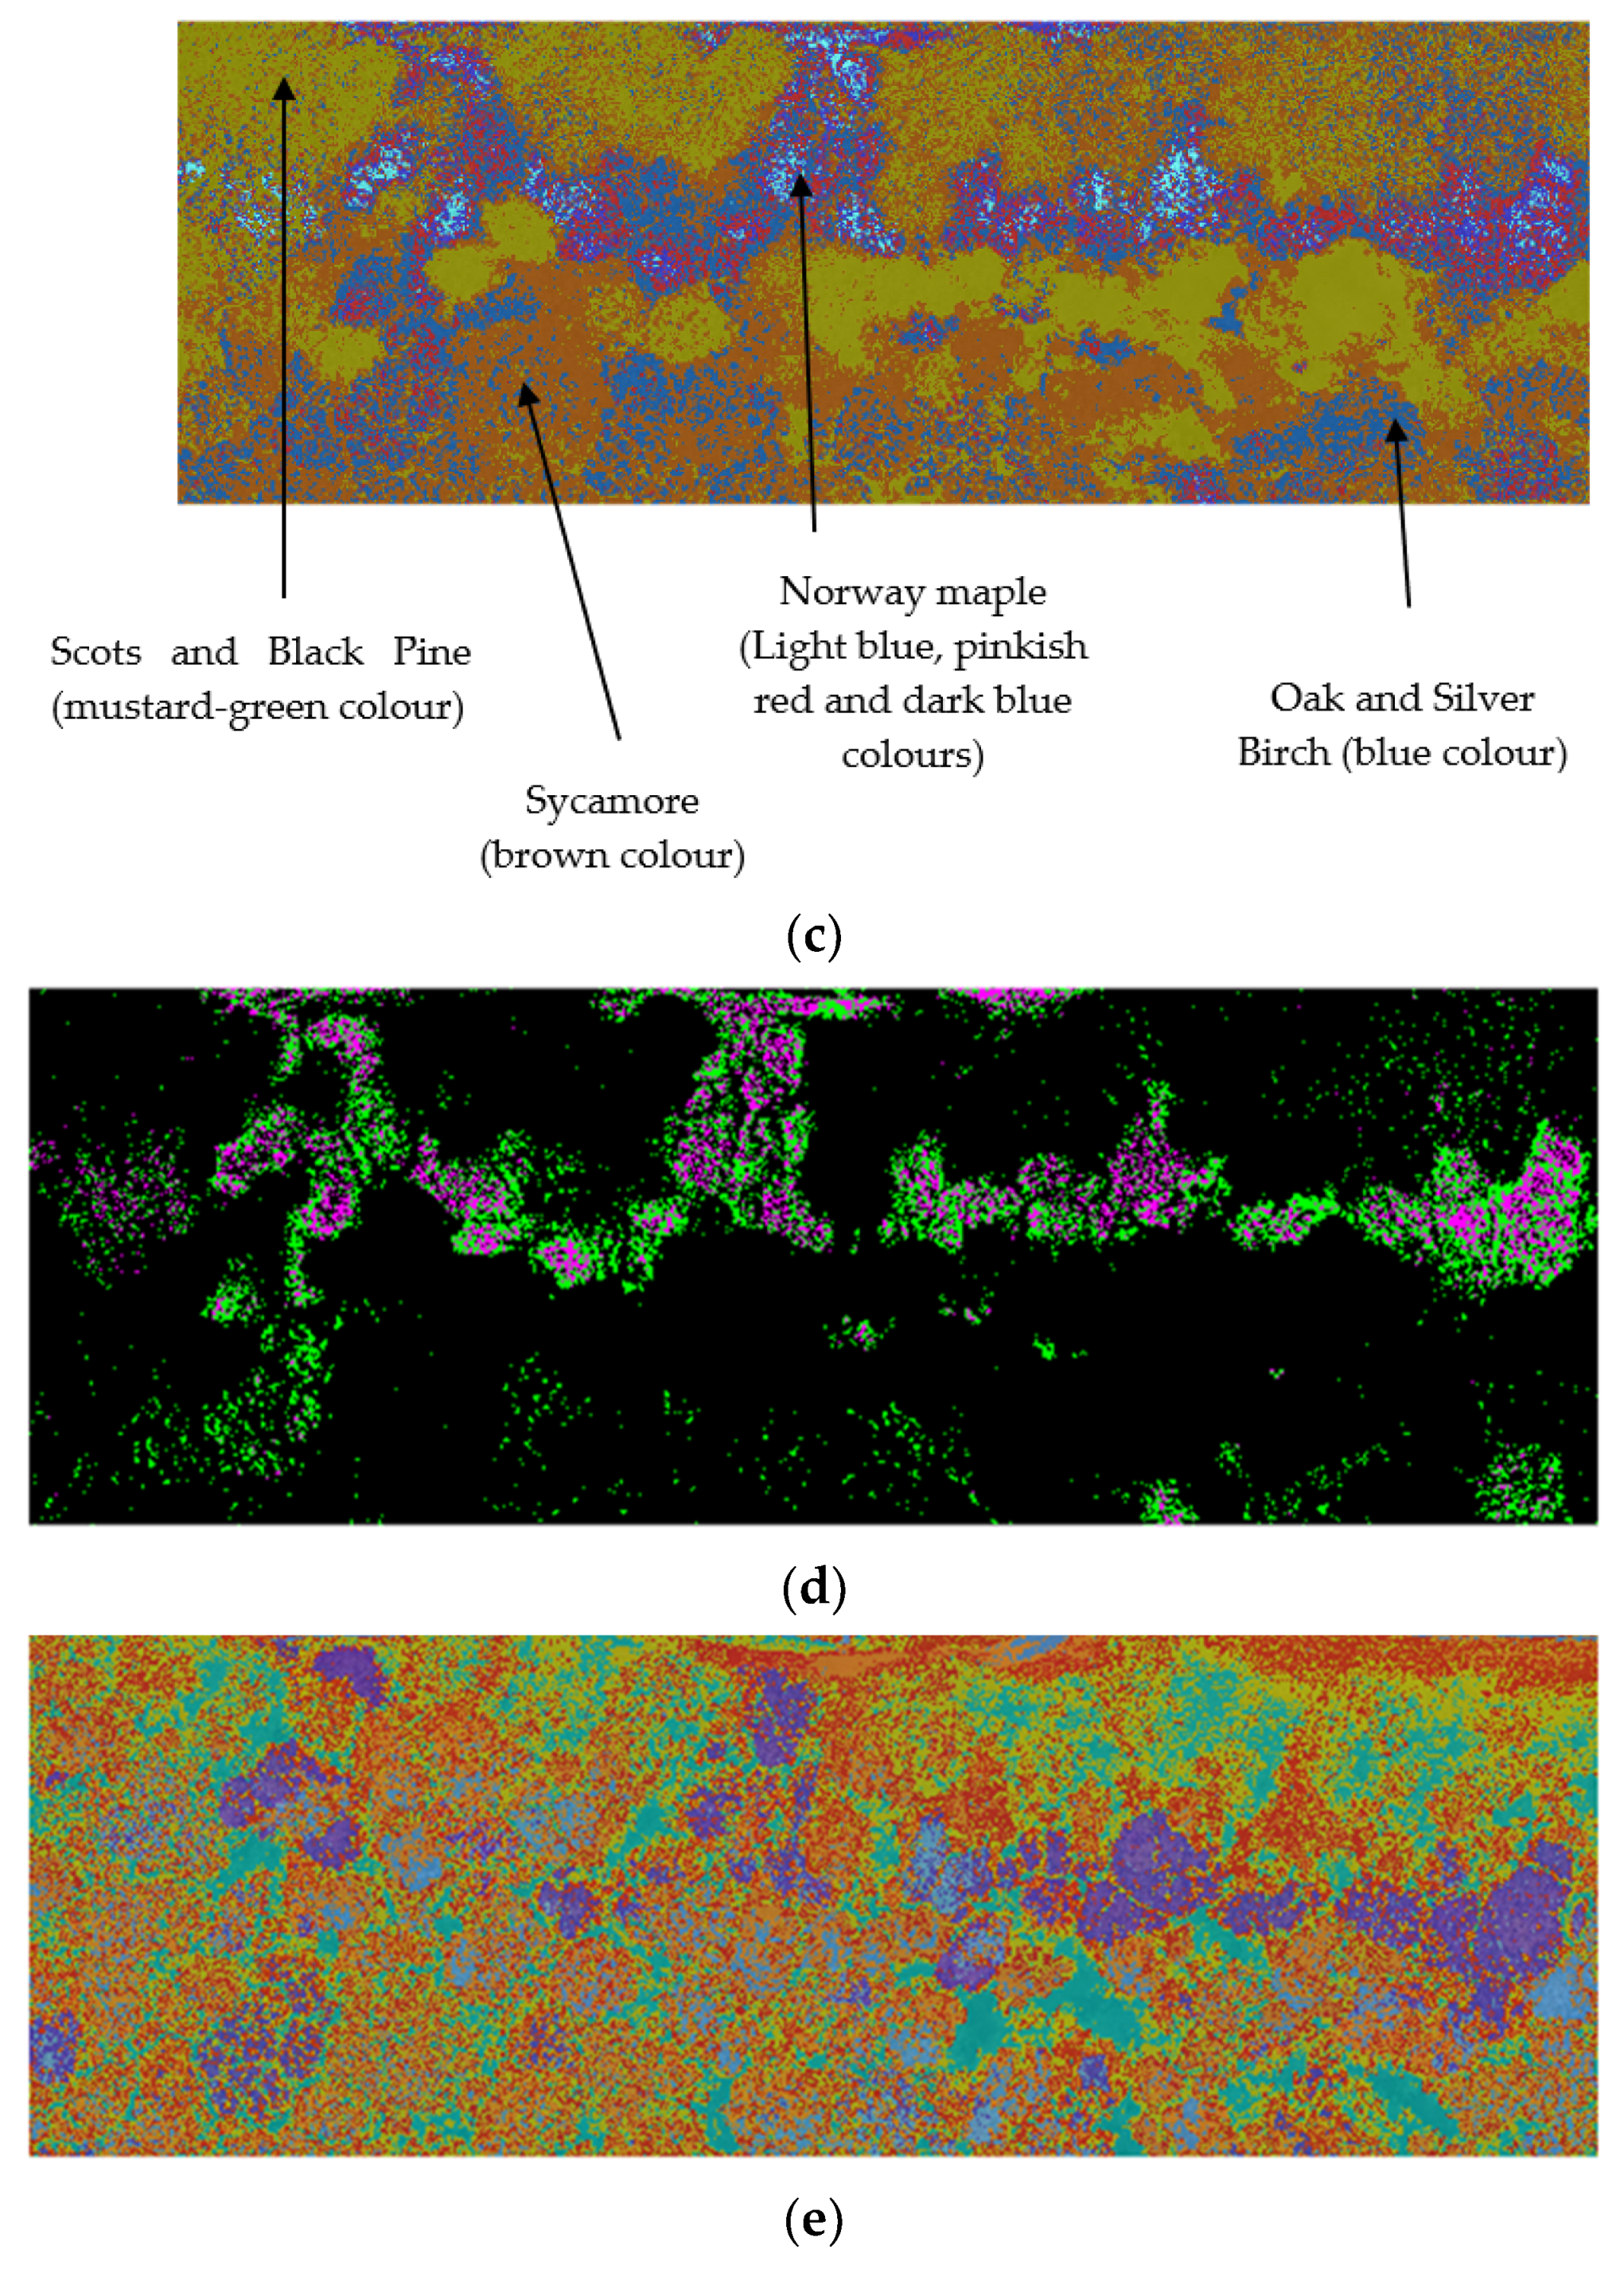
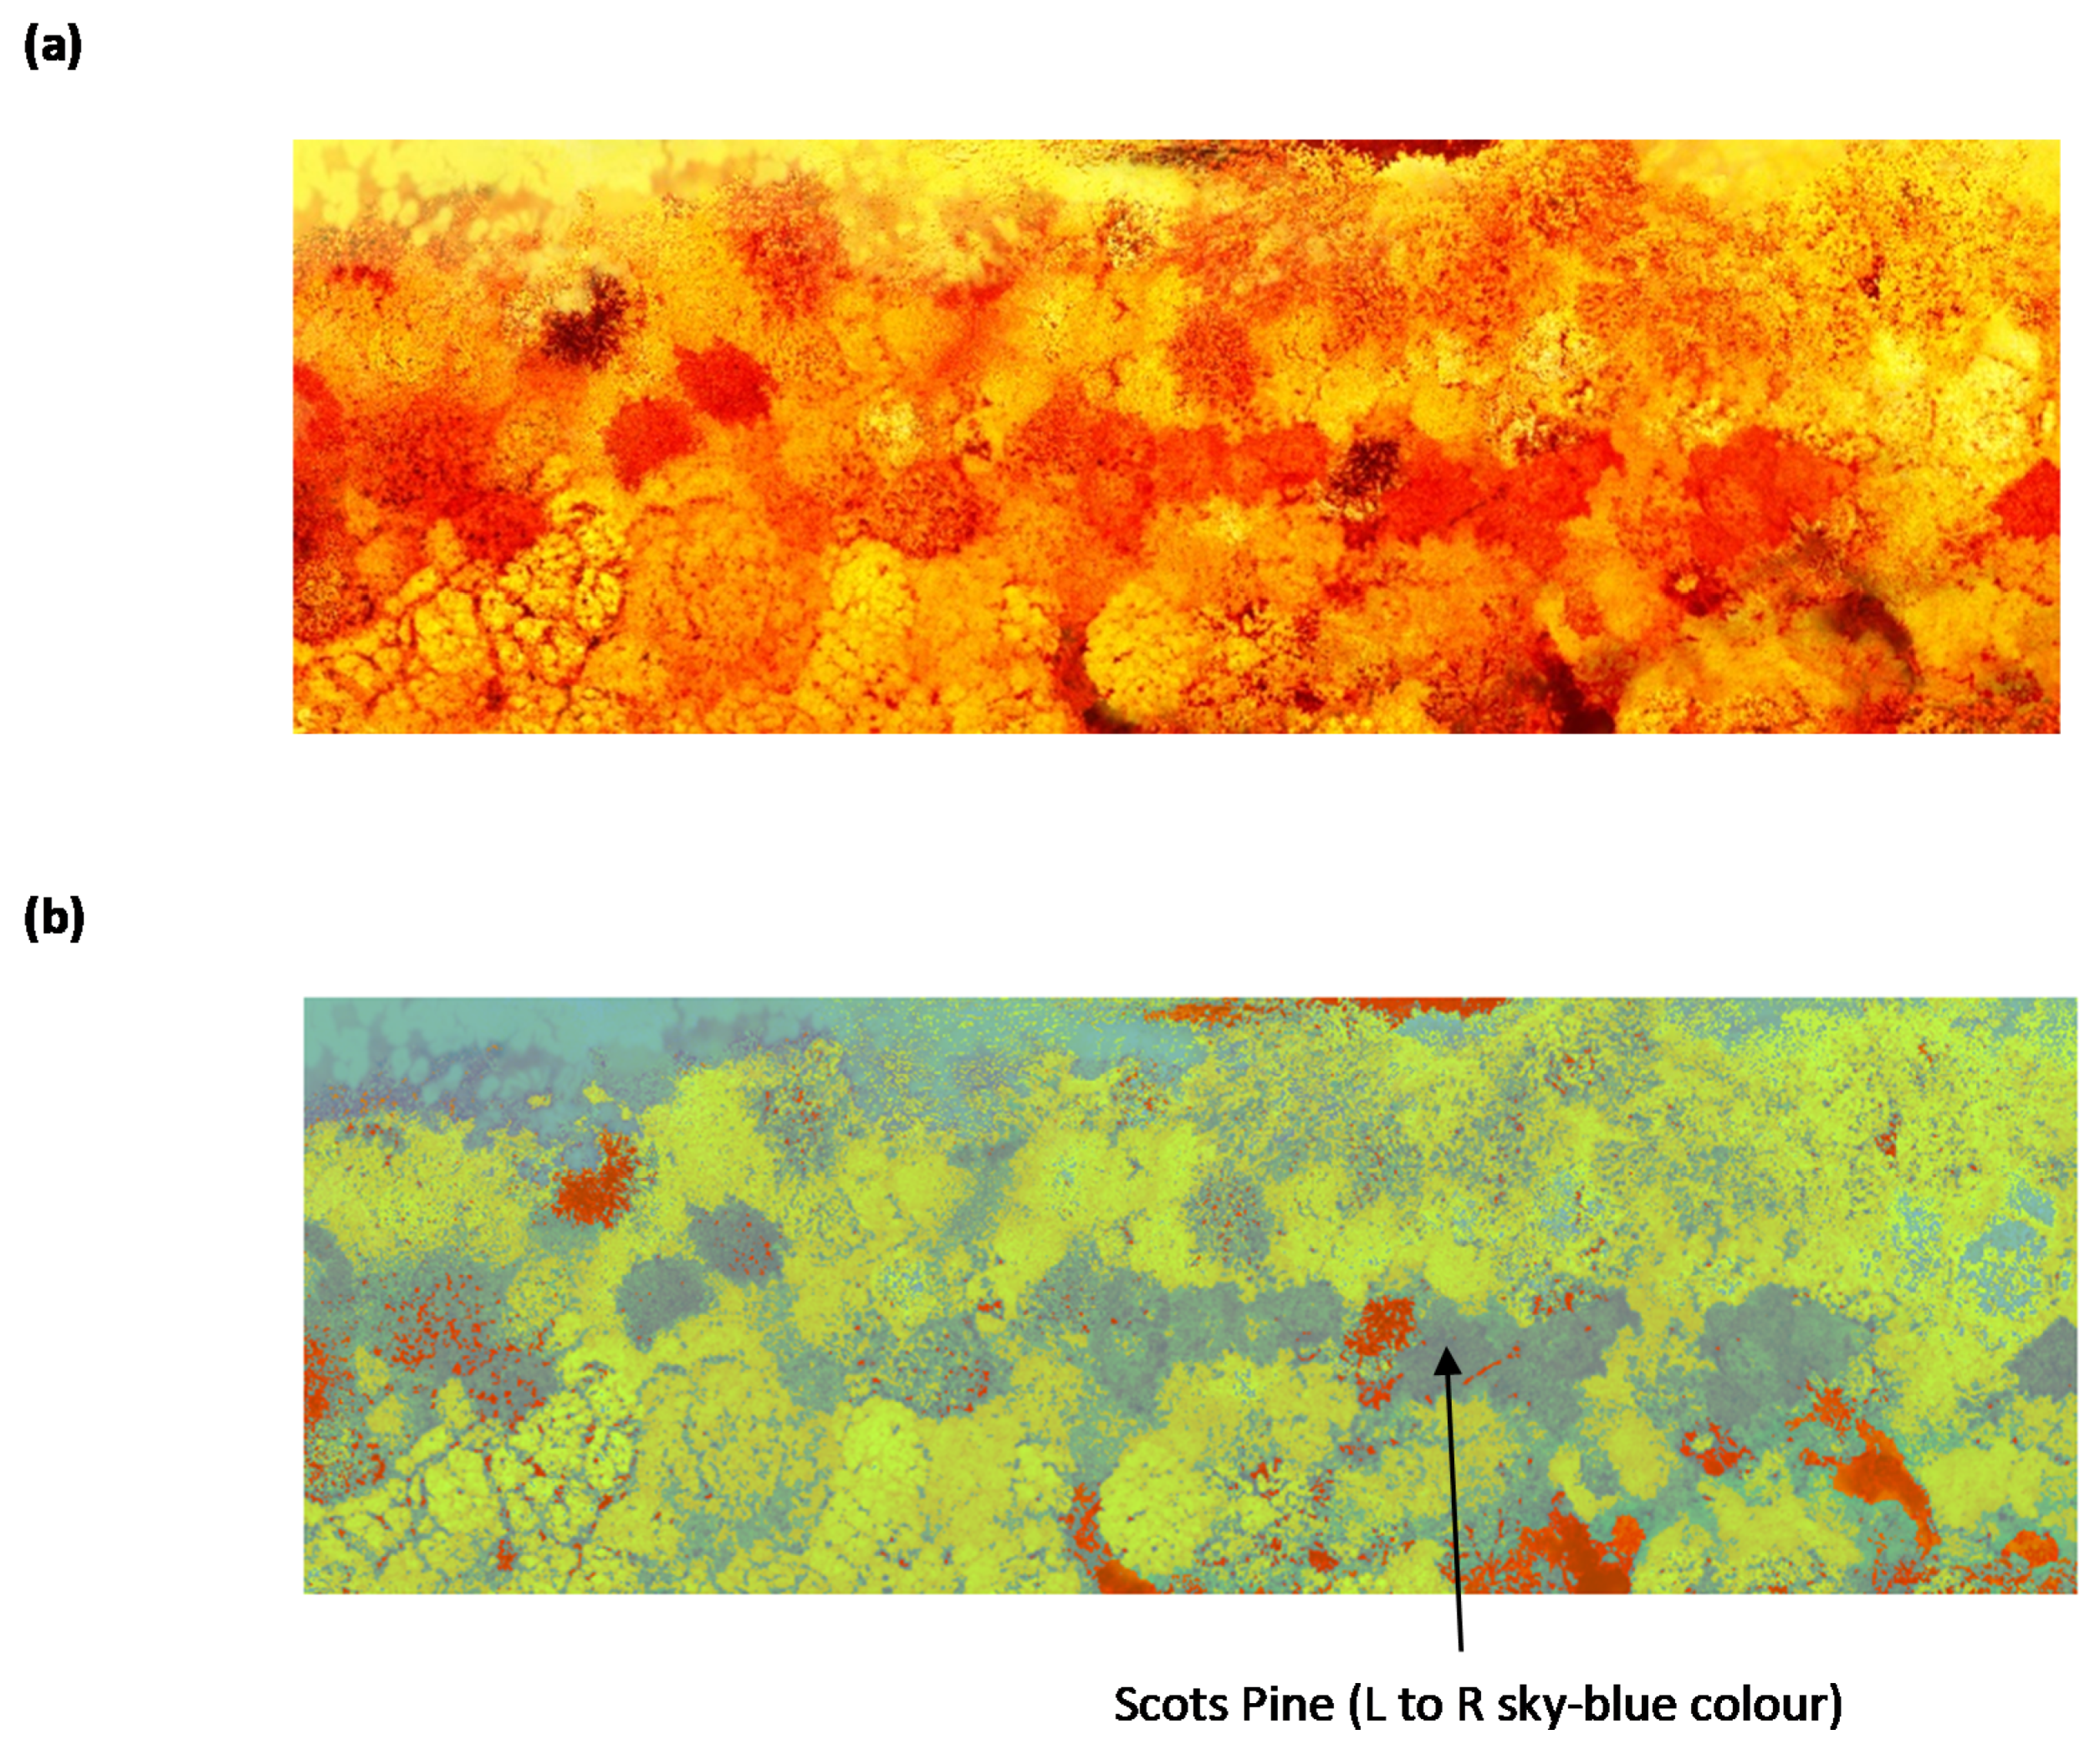
3.1. Evaluating the Performance of PCA and K-Means Segmentation in Classifying Non-Native Tree Species

The PCA results were used to derive an NDSI using the eigenvectors in PC1 and PC2 (Figure 5a), which showed a pronounced spectral response in the green, red, red edge, and NIR spectral bands between PC1 and PC2. The response in these spectral bands enhanced the spectral features enabling identification of pine (Scots and black), Norway maple and sycamore trees using the newly derived NDSI algorithm (Figure 6b). Specifically, the PCA derived NDSI algorithm allows the different tree species to be clustered into groups (Figure 6b). Figure 6b identifies different tree species by using a greyscale. However, the identified clusters need to be refined by an additional classification method. This is because the NDSI algorithm on its own is insufficient to classify the tree species accurately. Therefore, the clusters can further be classified by a segmentation method, either thresholding or k-means clustering. Thresholding converts a greyscale image into a binary image by assigning the pixels a threshold value between 0 to 1, which segments an image’s light and dark regions. Image segmentation by thresholding is efficient when only a few tree species are present. As thresholding only considers the intensity and neglects the relationship between pixels, it is more error-prone at segmenting many trees as the pixels for the desired region of a specific tree might be included or excluded. This effect is evidenced in Figure 6a, which shows Norway maple trees in white regions. This implies that they occupy a larger area in the woodland than in reality. The different intensities of the regions are difficult to distinguish as some appear to have a similar intensity level which allows them to be misclassified by the threshold segmentation approach.
Due to this outcome, k-means segmentation was applied to the PCA-derived NDSI image. K-means clustering is an unsupervised machine learning algorithm that segments different groups of samples (e.g., tree species) from the background into clusters that are represented by a similar pixel value. The clusters are obtained by observing the similarity in the data represented by the assigned k-number of clusters and calculating and placing centroids according to the k-number of clusters. Afterward, the Euclidean distance for each pixel is calculated relative to the centroid, which classifies the pixel into groups based on the distance. The longer the distance between pixels the smaller the similarly and chances of pixels being in separate groups. The closer the distance between the pixels, the greater the similarity of them clustered as one group. In addition, the use of k-mean segmentation compared to thresholding proves to be an effective and simpler classification method. The k-means segmentation method considers pixel values instead of intensity values, reducing the chance of tree species misclassification. Hence, the NDSI derived PCA (Figure 6b) was used for the k-means segmentation. The k-number of clusters assigned was six, which allowed segmentation of the different clusters of non-native tree species into pine (Scots and black), Norway maple, and sycamore (Figure 6c). The mustard green-colored areas represented the pine (Scot and black) trees as one cluster, and the brown-colored areas representing the sycamore trees as the second cluster (Figure 6c). The third clusters were regions with light blue, pinkish-red, and dark blue-colored areas in the center representing the Norway maple trees (Figure 6c). The final cluster at the bottom of the image, with a different shade of blue coloration, was identified to be a mixture of oak and silver birch trees (Figure 6c). However, due to indistinct phenology in these tree species, they were not identified as separate tree species by any spectral index even after multiple interpretations. The effectiveness of k-means segmentation is shown in (Figure 6d) which segments the Norway maple trees more precisely than threshold segmentation (Figure 6a).
Furthermore, the effectiveness of multispectral imaging and deriving an NDSI algorithm prior to k-means segmentation is shown in Figure 6e, where k-means segmentation is performed on the RGB image directly without PCA. The image (Figure 6e) shows a very poor segmentation of non-native tree species. However, the current NDSI classified the two types of pine trees (Scots and black) as one tree type. Hence, a re-consideration of the eigenvectors from the first three PC score images was required. These three PC score images corresponded to a combined eigenvector value of 87.56% (Table 1b). This revised approach allowed the classification of the Scots pine trees (Figure 7a). This newly derived spectral index (Figure 7a) was segmented by k-means clustering, where the k-number of clusters for the image was 4. These clusters, illustrated by the sky-blue colored regions, located in a single row correspond to the Scots pine trees (Figure 7b). Finally, the results obtained by k-means segmentation correlated well with the non-native tree species locations compared with the data obtained from the field study (Figure 8).

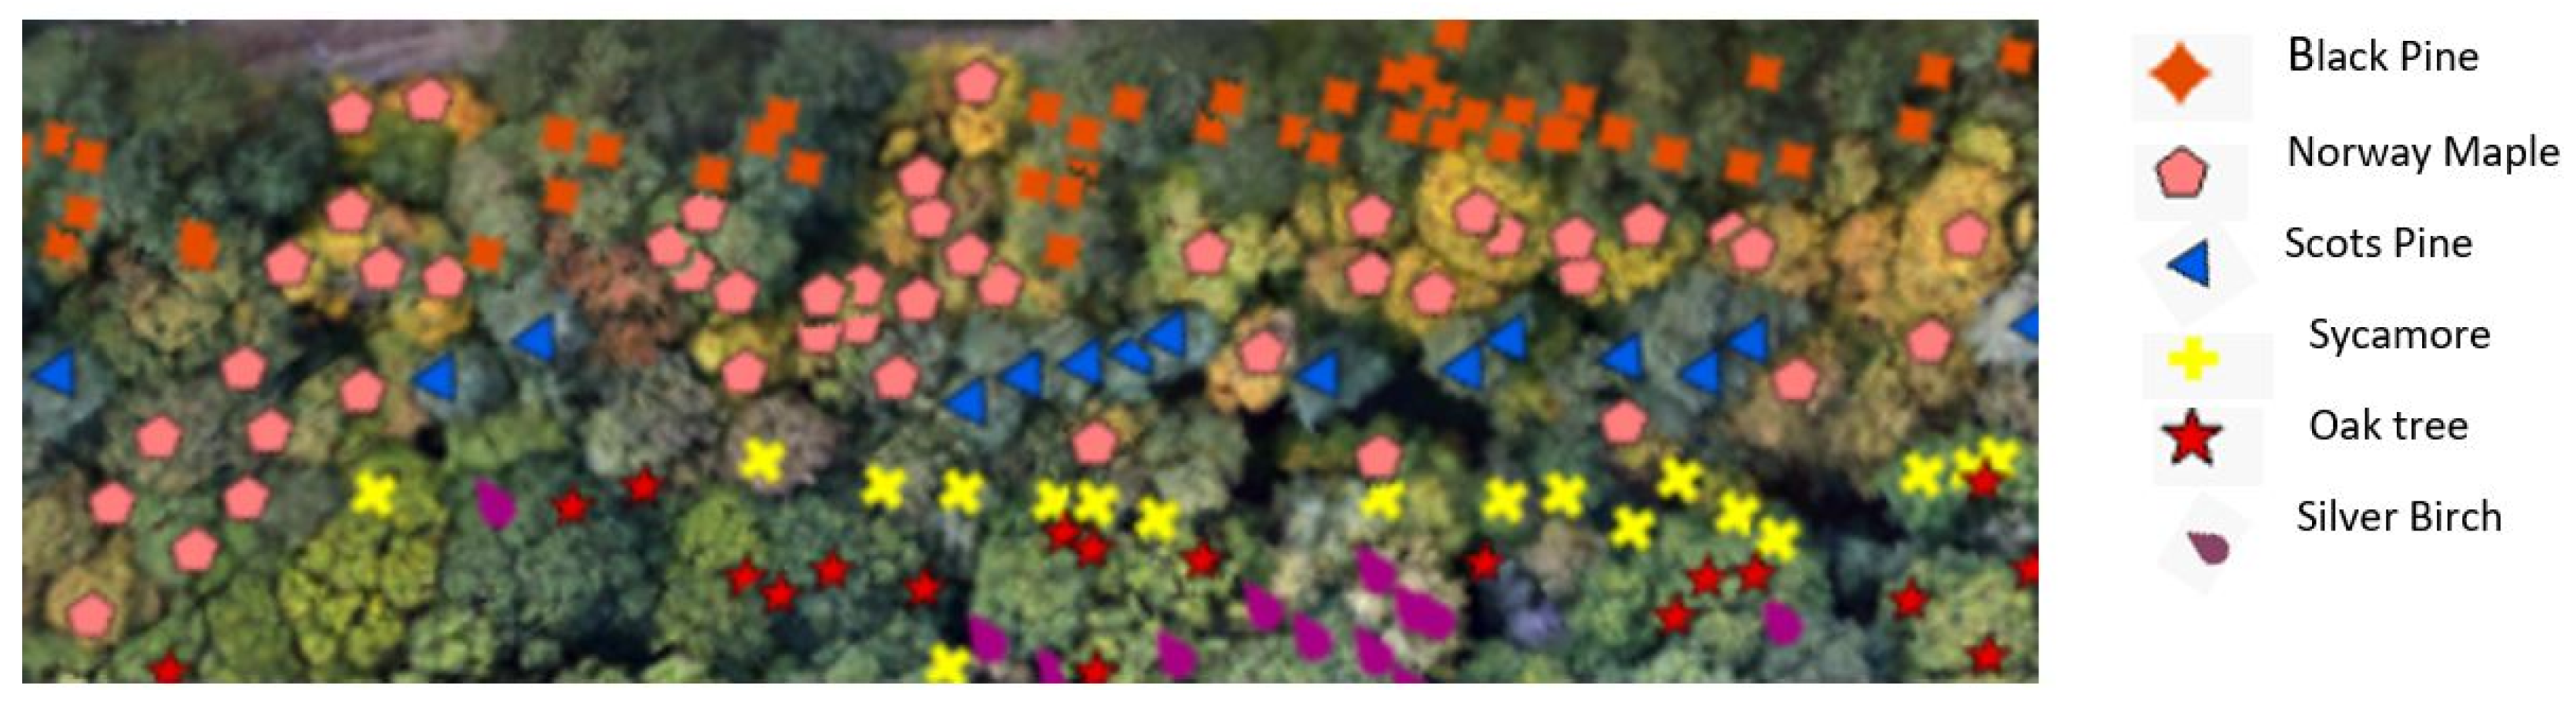
3.2. Quantitative Information Obtained by Analysis of UAV MSI and Field Study Data

The non-native tree clusters of black pine, Scots pine, Norway maple, and sycamore trees obtained from the k-means segmentation images (Figure 6a and Figure 7b) were quantified. The average results of the quantitative results (n = 2) using UAV MSI identified 19% Norway maple trees, 12% Scots pine trees, 23% black pine trees, and 19% of sycamore trees (Table 2). The UAV data was captured within 22 min of flight time, over an area of 8052 m2. In contrast, the detailed ground-level field study was undertaken over 4 h, for an area of 6785 m2, which resulted in the manual counting, identification, and GPS mapping of 30% Norway maple trees, 10% Scots pine trees, 26% black pine trees, and 14% sycamore trees (Table 2). When considering how it was captured, an agreement can be observed between the two sets of differently obtained data. The UAV MSI data is phenotyping tree type from the canopy based on its shape and coloration, whereas the field study data is counting (and identifying tree species) based on ground-level observations. No attempt was made to reconcile the data based on tree trunk versus tree canopy scaling. Furthermore, other trees were identified, specifically oak and silver birch located at the bottom edge of the 20th-century design landscape woodland by UAV MSI (27%) and field study (20%).

4. Conclusions

This study has demonstrated a simple approach to classifying multiple non-native tree species with some additional benefits. The results have demonstrated the benefits of using PCA in the classification process. The use of PCA allows selecting the most appropriate spectral bands to classify tree species into clusters using the newly derived spectral index. Currently available spectral indices, such as NDVI have limited use. Therefore, building up new spectral indices for a specified purpose is a novel and simple approach that has proven to provide promising results for tree species classification in an ASNW. Furthermore, k-means segmentation has been identified as the optimum segmentation method in this approach for identifying multiple trees. K-means allows further refinement of the spectral index leading to quantitation of tree species types. The accuracy of this simple approach was confirmed with data obtained from a ground-level field study.
Current methods for classifying tree species use object-based classification methods that require extensive and time-consuming machine learning and deep learning methods to build up classification models. However, the current approach is a pixel-based approach that allows the selection of spectral bands to derive spectral indices suitable for tree species classification. When combined with the k-means segmentation approach, it provides a powerful tool for identifying different tree clusters. In addition, our approach does not require a training data set, which makes it easy to apply, flexible in application and ultimately less time-consuming.

Author Contributions

Conceptualization, J.R.D., J.J.P. and C.E.N.; data curation, J.R.D., P.M., S.A. and C.E.N.; formal analysis, S.A., P.M., J.R.D. and C.E.N.; funding acquisition, J.R.D. and J.J.P.; investigation, S.A., P.M. and J.R.D.; methodology, C.E.N., S.A., P.M. and J.R.D.; project administration, J.R.D., C.E.N. and J.J.P.; resources, J.R.D., J.J.P. and C.E.N.; software, C.E.N. and S.A.; supervision, J.R.D., C.E.N. and J.J.P.; validation, S.A., P.M., C.E.N. and J.R.D.; visualization, S.A. and J.R.D.; writing—original draft preparation, S.A. and J.R.D.; writing—review and editing, S.A., C.E.N., P.M., J.J.P. and J.R.D. All authors have read and agreed to the published version of the manuscript.

Funding

This research was funded by Northumbria University.

Acknowledgments

We acknowledge Jane Young, former ecologist, Northumberland Wildlife Trust, for providing background information on Priestclose Wood. We acknowledge Geoff Dobbins, Senior Estates Officer (Reserves), Northumberland Wildlife Trust Ltd., for permission to fly the UAV over the wood.

Conflicts of Interest

The authors declare no conflict of interest.

References

  1. Cooper, N.S. How natural is nature reserve? An ideological study of British nature conservation landscapes. Biodivers. Conserv. 2000, 9, 1131–1152. [Google Scholar] [CrossRef]
  2. Papp, L.; Leeuwen, B.; Szilassi, P.; Tobak, Z.; Szatmari, J.; Àrvai, M.; Meszaros, J.; Pàsztor, L. Monitoring Invasive plant species using hyperspectral remote sensing data. Land 2021, 10, 29. [Google Scholar] [CrossRef]
  3. Tobin, P.C. Managing invasive species. F1000Research 2018, 7, 1–18. [Google Scholar] [CrossRef] [Green Version]
  4. Drechsler, M.; Touza, J.; White, P.C.L.; Jones, G. Agricultural landscape structure and invasive species the cost-effective level of crop field clustering. Food Secur. 2016, 8, 111–121. [Google Scholar] [CrossRef]
  5. Atkinson, S.; Townsend, M. The State of the UK’s Forests, Woods and Trees. Woodl. Trust Grantham Lincs. 2011, 1–100. Available online: https://issuu.com/piro.co.uk/docs/state-of-the-uks-forest-report-woodland-trust (accessed on 13 November 2020).
  6. A Brief History of Woodlands in Britain. Conservation Handbook. Available online: https://www.conservationhandbooks.com/woodlands/a-brief-history-of-woodlands-in-britain/ (accessed on 13 November 2020).
  7. Woodland Trust. Ancient Woodland. Available online: https://www.woodlandtrust.org.uk/trees-woods-and-wildlife/habitats/ancient-woodland/ (accessed on 17 September 2021).
  8. Pryor, S.N.; Smith, S. The Area and Composition of Plantations on Ancient Woodland Sites. 2002. Available online: http://www.woodlandtrust.org.uk/en/why-woods-matter/restoring/restoration-research/Pages/research.aspx#.Ul1RDyRKDfQ (accessed on 23 August 2021).
  9. Managing Ancient and Native Woodland in England. Forestry Commission (England). Available online: https://www.forestresearch.gov.uk/research/managing-ancient-and-native-woodland-in-england/ (accessed on 12 November 2020).
  10. Tehrany, M.S.; Kumar, L.; Drielsma, M.J. Review of native vegetation conditions assessment concepts, methods and future trends. J. Nat. Conserv. 2017, 40, 12–23. [Google Scholar] [CrossRef]
  11. Mafanya, M.; Tsele, P.; Botai, J.; Manyama, P.; Swart, B.; Monate, T. Evaluation pixel and object based image classification techniques for mapping plant invasions from UAV derived aerial imagery: Harrisia pomanensis as a case study. ISPRS J. Photogramm. Remote Sens. 2017, 129, 1–11. [Google Scholar] [CrossRef] [Green Version]
  12. Leslie, R.V. Microwave sensors. Compr. Remote Sens. 2018, 1, 435–474. [Google Scholar]
  13. Huang, C.; Asner, G.P. Applications of remote sensing to alien invasive plant studies. Sensors 2009, 9, 4869–4889. [Google Scholar] [CrossRef] [Green Version]
  14. Bradley, B.A.; Mustard, J.F. Characterizing the landscape dynamics of an invasive plant and risk of invasion using remote sensing. Ecol. Appl. 2006, 16, 1132–1147. [Google Scholar] [CrossRef] [Green Version]
  15. Vilà, M.; Espinar, J.L.; Hejda, M.; Hulme, P.E.; Jarošík, V.; Maron, J.L.; Pergl, J.; Schaffner, U.; Sun, Y.; Pysek, P. Ecological impacts of invasive alien plants: A meta-analysis of their effects on species, communities and ecosystems. Ecol. Lett. 2011, 14, 702–708. [Google Scholar] [CrossRef]
  16. Lantz, N.J.; Wang, J. Object-based classification of Worldview-2 imagery for mapping invasive common reed, Phragmites australis. Can. J. Remote Sens. 2013, 39, 328–340. [Google Scholar] [CrossRef]
  17. Khare, S.; Latifi, H.; Ghosh, S.K. Multi-scale assessment of invasive plant species diversity using Pléiades 1A, RapidEye and Landsat-8 data. Geocarto Int. 2017, 33, 681–698. [Google Scholar] [CrossRef]
  18. Ng, W.T.; Rima, P.; Einzmann, K.; Immitzer, M.; Atzberger, C.; Eckert, S. Assessing the Potential of Sentinel-2 and Pléiades Data for the Detection of Prosopis and Vachellia spp. in Kenya. Remote Sens. 2017, 9, 74. [Google Scholar] [CrossRef] [Green Version]
  19. Lehmann, J.R.K.; Prinz, T.; Ziller, S.R.; Thiele, J.; Heringer, G.; Meira-Neto, J.A.A.; Buttschardt, T.K. Open-source processing and analysis of aerial imagery acquired with a low-cost unmanned aerial system to support invasive plant management. Front. Environ. Sci. 2017, 5, 1–16. [Google Scholar] [CrossRef] [Green Version]
  20. Mirik, M.; Chaudhuri, S.; Surber, B.; Ale, S.; James Ansley, R. Detection of two intermixed invasive woody species using color infrared aerial imagery and the support vector machine classifier. Int. J. Remote Sens. 2013, 7, 073588. [Google Scholar] [CrossRef] [Green Version]
  21. Mirik, M.; Ansley, R.J.; Steddom, K.; Jones, D.C.; Rush, C.M.; Michels, G.J.; Elliott, N.C. Remote Distinction of A Noxious Weed (Musk Thistle: CarduusNutans) Using Airborne Hyperspectral Imagery and the Support Vector Machine Classifier. Remote Sens. 2013, 5, 612–630. [Google Scholar] [CrossRef] [Green Version]
  22. Dronova, I.; Spotswood, E.N.; Suding, K.N. Opportunities and Constraints in Characterizing Landscape Distribution of an Invasive Grass from Very High Resolution Multi-Spectral Imagery. Front. Plant Sci. 2017, 8, 890. [Google Scholar] [CrossRef] [Green Version]
  23. Skowronek, S.; Ewald, M.; Isermann, M.; Kerchove, R.V.D.; Lenoir, J.; Aerts, R.; Warrie, J.; Hattab, T.; Honnay, O.; Schmidtlein, S.; et al. Mapping an invasive bryophyte species using hyperspectral remote sensing data. Biol. Invasions 2017, 19, 239–254. [Google Scholar] [CrossRef]
  24. Dash, J.P.; Watt, M.S.; Paul, T.S.H.; Morgenroth, J.; Pearse, G.D. Early detection of invasive exotic trees using UAV and manned aircraft multispectral and LiDAR data. Remote Sens. 2019, 11, 1812. [Google Scholar] [CrossRef] [Green Version]
  25. Dvořák, P.; Müllerová, J.; Bartaloš, T.; Bruna, J. Unmanned aerial vehicles for alien plant species detection and monitoring. Int. Arch. Photogramm. Remote Sens. Spat. Inf. Sci. 2015, 1, 83–90. [Google Scholar] [CrossRef] [Green Version]
  26. Lishawa, S.C.; Carson, B.D.; Brandt, J.S.; Tallant, J.M.; Reo, N.J.; Albert, D.A.; Monks, A.M.; Lautenbach, J.M.; Clark, E. Mechanical Harvesting Effectively Controls Young Typha spp. Invasion and Unmanned Aerial Vehicle Data Enhances Post-treatment Monitoring. Front. Plant Sci. 2017, 8, 619. [Google Scholar] [CrossRef]
  27. Perroy, R.L.; Sullivan, T.; Stephenson, N. Assessing the impacts of canopy openness and flight parameters on detecting a sub-canopy tropical invasive plant using a small unmanned aerial system. ISPRS J. Photogramm. Remote Sens. 2017, 125, 174–183. [Google Scholar] [CrossRef]
  28. De Sá, N.C.; Castro, P.; Carvalho, S.; Marchante, E.; López-Núñez, F.A.; Marchante, H. Mapping the Flowering of an Invasive Plant Using Unmanned Aerial Vehicles: Is There Potential for Biocontrol Monitoring? Front. Plant Sci. 2018, 9, 1–13. [Google Scholar] [CrossRef] [PubMed] [Green Version]
  29. Martin, F.M.; Müllerová, J.; Borgniet, L.; Dommanget, F.; Breton, V.; Evette, A. Using Single- and Multi-Date UAV and Satellite Imagery to Accurately Monitor Invasive Knotweed Species. Remote Sens. 2018, 10, 1662. [Google Scholar] [CrossRef] [Green Version]
  30. Lopatin, J.; Dolos, K.; Kattenborn, T.; Fassnacht, F.E. How canopy shadow affects invasive plant species classification in high spatial resolution remote sensing. Remote. Sens. Ecol. Conserv. 2019, 5, 302–317. [Google Scholar] [CrossRef]
  31. Santo, R.F. Principal component analysis applied to digital image compression. Einstein 2012, 2, 135–139. [Google Scholar] [CrossRef] [Green Version]
  32. Priestclose Wood. Northumberland Wildlife Trust. Available online: https://www.nwt.org.uk/nature-reserves/priestclose-wood (accessed on 12 November 2020).
  33. Northumberland County Council. Northumberland Local Plan. Core Strategy, Green Belt Review 2015, and update 2018. Prudhoe LPA label PE11a, Priestclose Wood. Available online: https://www.northumberland.gov.uk/NorthumberlandCountyCouncil/media/Planning-and-Building/planning%20policy/Local%20Plan/Green-Belt-Technical-Paper-December-2018-Final.pdf (accessed on 12 December 2020).
  34. Northumberland County Council Planning Application: 14/04160/FUL|Development comprising the demolition of non-listed buildings, erection of 392 dwellings (Use Class C3), conversion of Prudhoe Hall and associated buildings to provide 12 dwellings (Use Class C3), improvement works to Walled Garden and associated access, landscape and infrastructure. |Former Prudhoe Hospital Prudhoe Hospital Drive Prudhoe Northumberland NE42 5NT. Available online: https://publicaccess.northumberland.gov.uk/online-applications/ (accessed on 17 September 2021).
  35. Shan, P. Image segmentation method based on K-mean algorithm. J. Image Video Process. 2018, 81, 2–9. [Google Scholar] [CrossRef]
Figure 1. (a) Location of Priestclose Wood, and (b) Software stitched image, in visible mode, of the investigated 20th-century design landscape planted alongside an ancient and semi-natural woodland (i.e., Priestclose Wood).
Separations 08 00160 g001
Figure 2. Workflow of the data processing required to investigate the ASNW.
Separations 08 00160 g002
Figure 3. RGB (visible) image from the data set of the ASNW to classify the tree types: black pine, Norway maple, Scots pine and sycamore.
Separations 08 00160 g003
Figure 4. Multispectral image datasets used to perform PCA for (a) pine trees (Scots and black), Norway maple and sycamore trees (b) Scots Pine trees only. [1 = Blue, 2 = Green, 3 = Red, 4 = Red Edge and 5 = NIR].
Separations 08 00160 g004
Figure 5. The eigenvectors of each spectral band contributing to form each PC image for (a) pine (Scots and Black) trees, Norway maple and sycamore trees (b) Scots pine trees only. [1 = Blue, 2 = Green, 3 = Red, 4 = Red Edge and 5 = NIR].
Separations 08 00160 g005aSeparations 08 00160 g005b
Figure 6. PCA and k-means segmented images for classifying pine (Scots and Black), Norway maple and sycamore trees (a) threshold segmentation representing Norway maple trees from PCA derived NDSI, (b) PCA derived NDSI = (PC1)/(PC2 + PC2 + PC1), (c) k-means segmented image from PCA derived NDSI, (d) k-means cluster representing the Norway maple trees, and (e) k-means segmented image directly on RGB image.
Separations 08 00160 g006aSeparations 08 00160 g006b
Figure 7. PCA and k-means segmented images for classifying Scots pine (a) PCA derived (PC1 + PC2 + PC3) colourmap image, and (b) k-means segmented image.
Separations 08 00160 g007
Figure 8. GPS coordinates for the tree species in the woodland boundary.
Separations 08 00160 g008
Table 1. Percentage Variance of PC1 to PC5 resulting from PCA applied to multispectral images to classify (a) maple, pine (Black and Scots) and sycamore trees and (b) Scots pine trees.
(a)
PC1PC2PC3PC4PC5
% variance47.43526.57012.8018.5994.595
% cumulative47.43574.00586.80695.405100.000
(b)
% variance56.22221.7389.5927.5404.908
% cumulative56.22277.96087.55295.092100.000
Table 2. Quantitative information obtained by analysis of UAV MSI and field study data.
UAV Flight #From Analyzed UAV DataField Study Data @
Total Woodland Area (m2)Area of Norway Maple Coverage (m2)Area of Scots Pine Coverage (m2)Area of Black Pine Coverage (m2)Area of Sycamore Coverage (m2)% Norway Maple Trees% Scots Pine Trees% Black Pine Trees% Sycamore Trees% Other Trees (Oak and Silver Birch)% Norway Maple Trees% Scots Pine Trees% Black Pine Trees% Sycamore
Trees
% Other Trees (Oak and Silver Birch)
Value *805215659341805149319122319273010261420
Range &7866–82391485–1644903–9641794–18171453–1533NANA
# UAV flights: 14 October 2020 and 19 October 2020. * Value based on n = 2 determinations for the tree area. & Range of values, based on individual analysis. @ Field data collected on 13 March 2021 over an area of 6785 m2. NA = not applicable.
Publisher’s Note: MDPI stays neutral with regard to jurisdictional claims in published maps and institutional affiliations.

