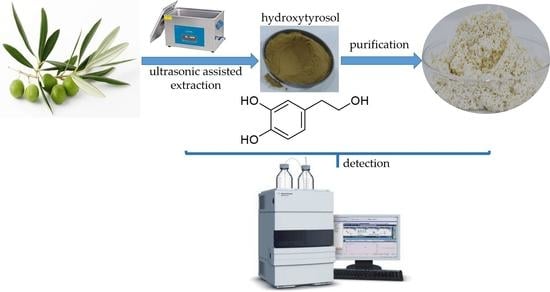
1. Introduction
Hydroxytyrosol (HT) a natural phenolic compound is named as 3,4-dihydroxyphenylethanol and the molecular formula is C
8H
10O
3 with a molecular weight of 154.16 Da [
1]. HT is proved to possess a various bioactivity. The growth of colon and MCF-7 cancer cells is well inhibited by HT [
2,
3]. Moreover, HT also possesses the ability of anti-oxidant and anti-inflammatory [
4,
5]. Natural HT rarely exists in free form and always formed oleuropein (OE) with oleoside, which is widely distributed in different parts of olive trees such as leaves and fruits. Oleuropein is also easily degraded to HT affected by acids, alkalis, enzymes, etc. [
6].
HT was first found in olive oil. However, the major HT of olive fruits is mainly in the residues and waste water (OMWW) for the preparation of olive oil with the content arranging from 975 ± 37 mg/kg to 1614 ± 81 mg/kg [
7]. HT is usually obtained from fresh olive leaves, olive pomace and OMWW, which is easily operated in a lower cost [
8,
9,
10]. Visioli et al. isolated HT from OMWW by three methods including XAD resin adsorption, ethyl acetate extraction and gel column chromatography (Sephadex LH-20). After detecting HT content by HPLC, gel column chromatography performed best with a content of 13% [
11]. Ye et al. used ultrasonic-assisted methanol to extract HT from olive leaves, and separated HT by macroporous resin and silica gel column, then purified by preparative chromatography. Finally, the purity of HT could reach 95% [
12]. Jemai et al. applied methanol to extract olive leaves and added 2 M HCl into the extraction for acidification at 100 °C for 1 h. After cooling, the reaction solution was diluted and neutralized then extracted with ethyl acetate and finally separated through the column to separate HT [
13].
Natural HT is mainly formed by glucosidase hydrolysis of oleuropein during the ripening of fruits [
14]. The content of HT varies in different cultivars and parts of olive tree, but it is generally low, even in olive leaves which are abundant in phenol content only accounting for 0.3–0.8% (
w/
w) [
12]. Only a few standard reference products of HT exist in scientific research and there are no mass-produced HT products on the market.
However, the extraction rate of HT from olive leaves is always low. Therefore, a suitable extraction method shall be carried out to investigate how to improve the yield of HT. Therefore, in this present work, ethanol maceration and ultrasound-assisted extraction were applied to obtain a better extraction method. Then, response surface method (RSM) was also used to optimize the process of hydrolysis on olive leaves by hydrochloric acid with the assistance of ultrasound. The content of HT was then enriched by macroporous resins.
2. Materials and Methods
2.1. Materials and Chemicals
Olive leaves of Pendolino were picked in November 2018 from the olive planting base in Huaikou, Chengdu, Sichuan (China). Olive leaves were stored at −20 °C after cleaning, drying and grinding.
Hydrochloric acid (analytically pure), methanol and acetonitrile (chromatographically pure) were purchased from Chengdu Kelong Chemical Co., Ltd. (Chengdu, China).
The mechanical devices in this work were: LDP-750A pulverizer (Zhejiang Yongkang Red Sun Electromechanical Co., Ltd., Wenzhou, China); BT-124S electronic balance (German Sartorius); DZ-2BC vacuum dryer (Tianjin Taisite Instrument Co., Ltd., Tianjin, China); RM-220 ultrapure water machine (Sichuan Water Technology Development Co., Ltd., Chengdu, China); 7D-4Z low speed centrifuge (Shu Ke Instrument Co., Ltd., Chengdu, China); and Agilent 1260 high performance liquid chromatography system (Agilent Technology China Co., Ltd., Santa Clara, CA, USA).
2.2. Chromatographic Conditions
2.2.1. Determination of HT
The chromatographic column was a ZORBAX SB-C18 column (4.6 mm × 150 mm, 5.0 μm), and the mobile phase was 10% methanol aqueous solution. The ultraviolet absorption wavelength was 280 nm. The column temperature was kept at 30 °C with the flow rate of 1 mL/min as well as the injection volume of 10 μL.
2.2.2. Determination of Oleuropein
The chromatographic column was ZORBAX SB-C18 (4.6 mm × 150 mm, 5.0 μm). The mobile phase was acetonitrile and water with the ratio of 25:75. The ultraviolet absorption wavelength was read at 254 nm as the column temperature was maintaining at 30 °C and the injection volume was 10 μL with the flow rate of 1 mL/min.
2.3. Determination of the Extraction Method
2.3.1. Ethanol Digestion for HT and OE
Olive leaves powder (1 g) was mixed with different concentration of ethanol (50, 70 and 90%) to various solution to sample ratio (20, 40 and 60 mL/g). Then, the mixtures were reacted at 50 °C for 30, 60 and 90 min. The extraction solutions were obtained at the speed of 5000 r/min for 20 min. Finally, the supernatant was filtered by 0.45 μm microporous membrane for following detection. The extraction rate of HT and oleuropein was determined by the formula:
where C
1 was the concentration of OE (mg/mL) in the sample; C
2 was the concentration of HT (mg/mL) in the sample; V was the volume of the sample (mL); N was the dilution ratio of the sample; and m was the weight of dried olive leaves powder (g).
2.3.2. Ultrasonic-Assisted Extraction for HT and OE
Ultrasound (210 W) was used under different extraction conditions in
Section 2.3.1 to investigate its effect on the yield of oleuropein and HT.
2.4. Ultrasonic-Assisted Hydrolysis Olive Leaves for HT
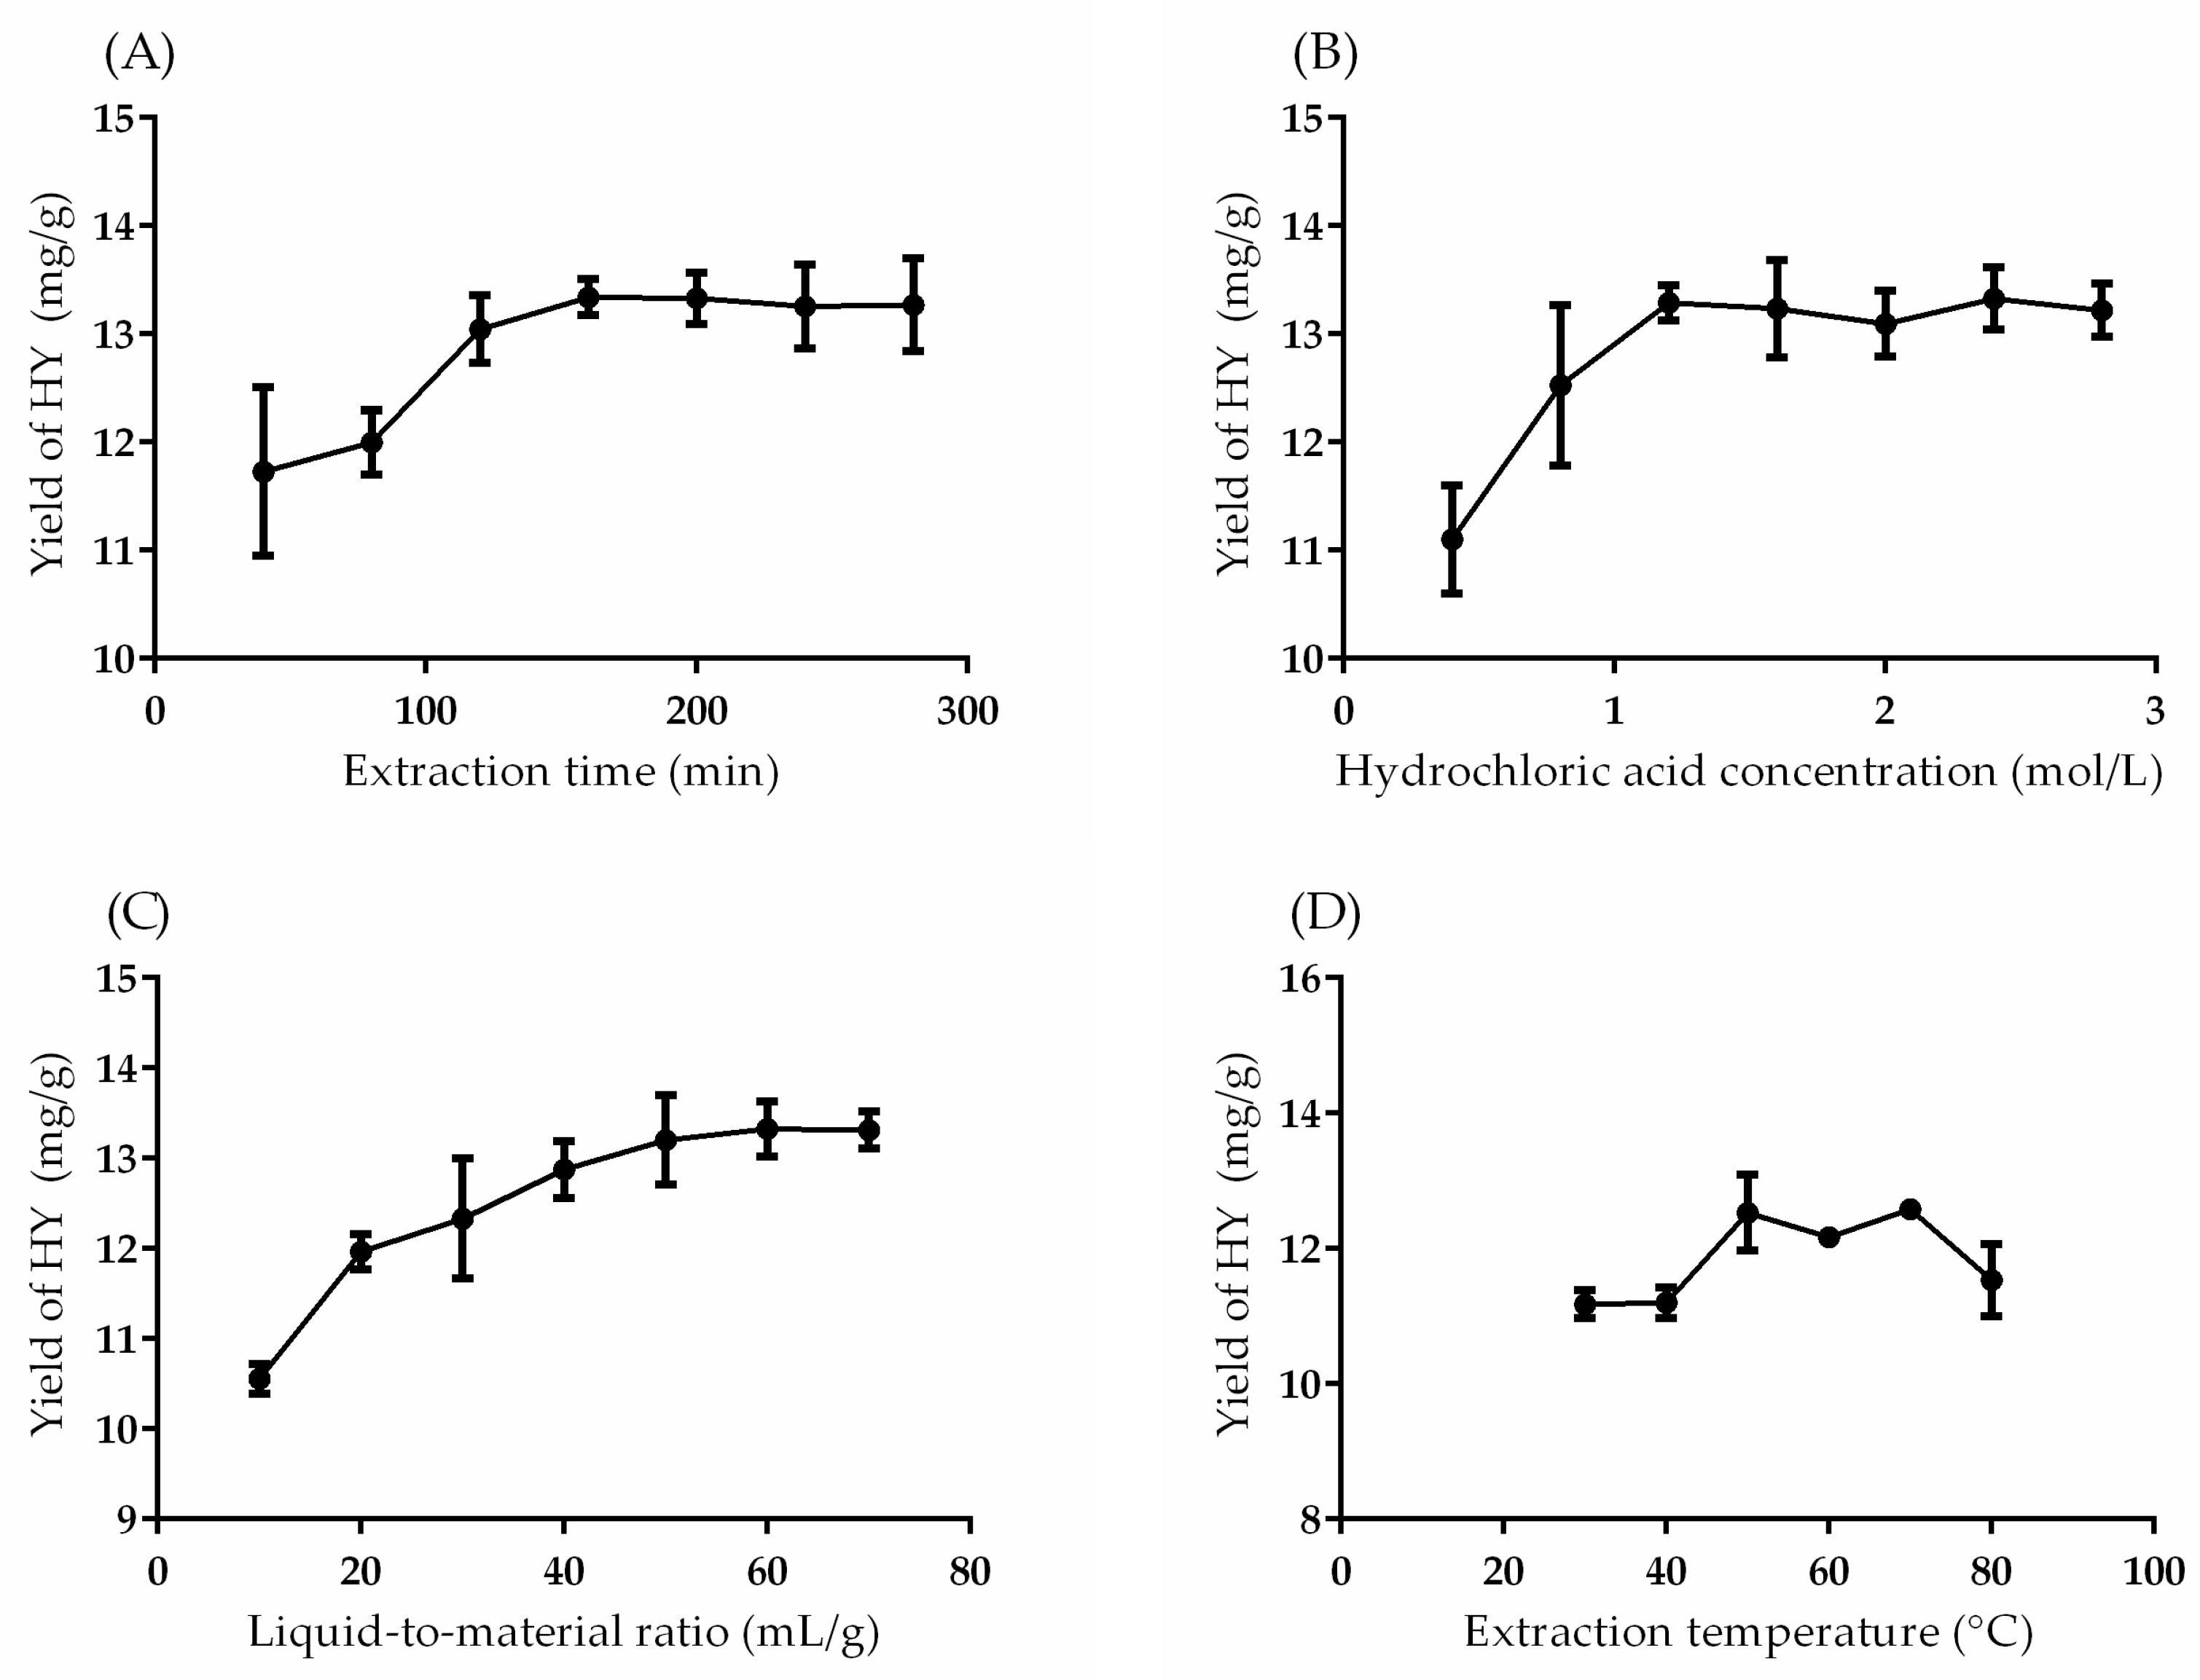
2.4.1. Single Factors Assays
Dried sample powder was mixed with different concentration of hydrochloric acid (0.4, 0.8, 1.2, 1.6, 2.0, 2.4 and 2.8 mol/L) to different liquid-to-material ratio (10:1, 20:1, 30:1, 40:1, 50:1, 60:1 and 70:1 mL/g) then reacted at various temperature (30, 40, 50, 60, 70 and 80 °C) for 40, 80, 120, 160, 200, 240 and 280 min with the assistance of ultrasound (210 W). The yield was taken as an index to assess the effect of ultrasound-assisted hydrochloric acid hydrolysis on the preparation of HT.
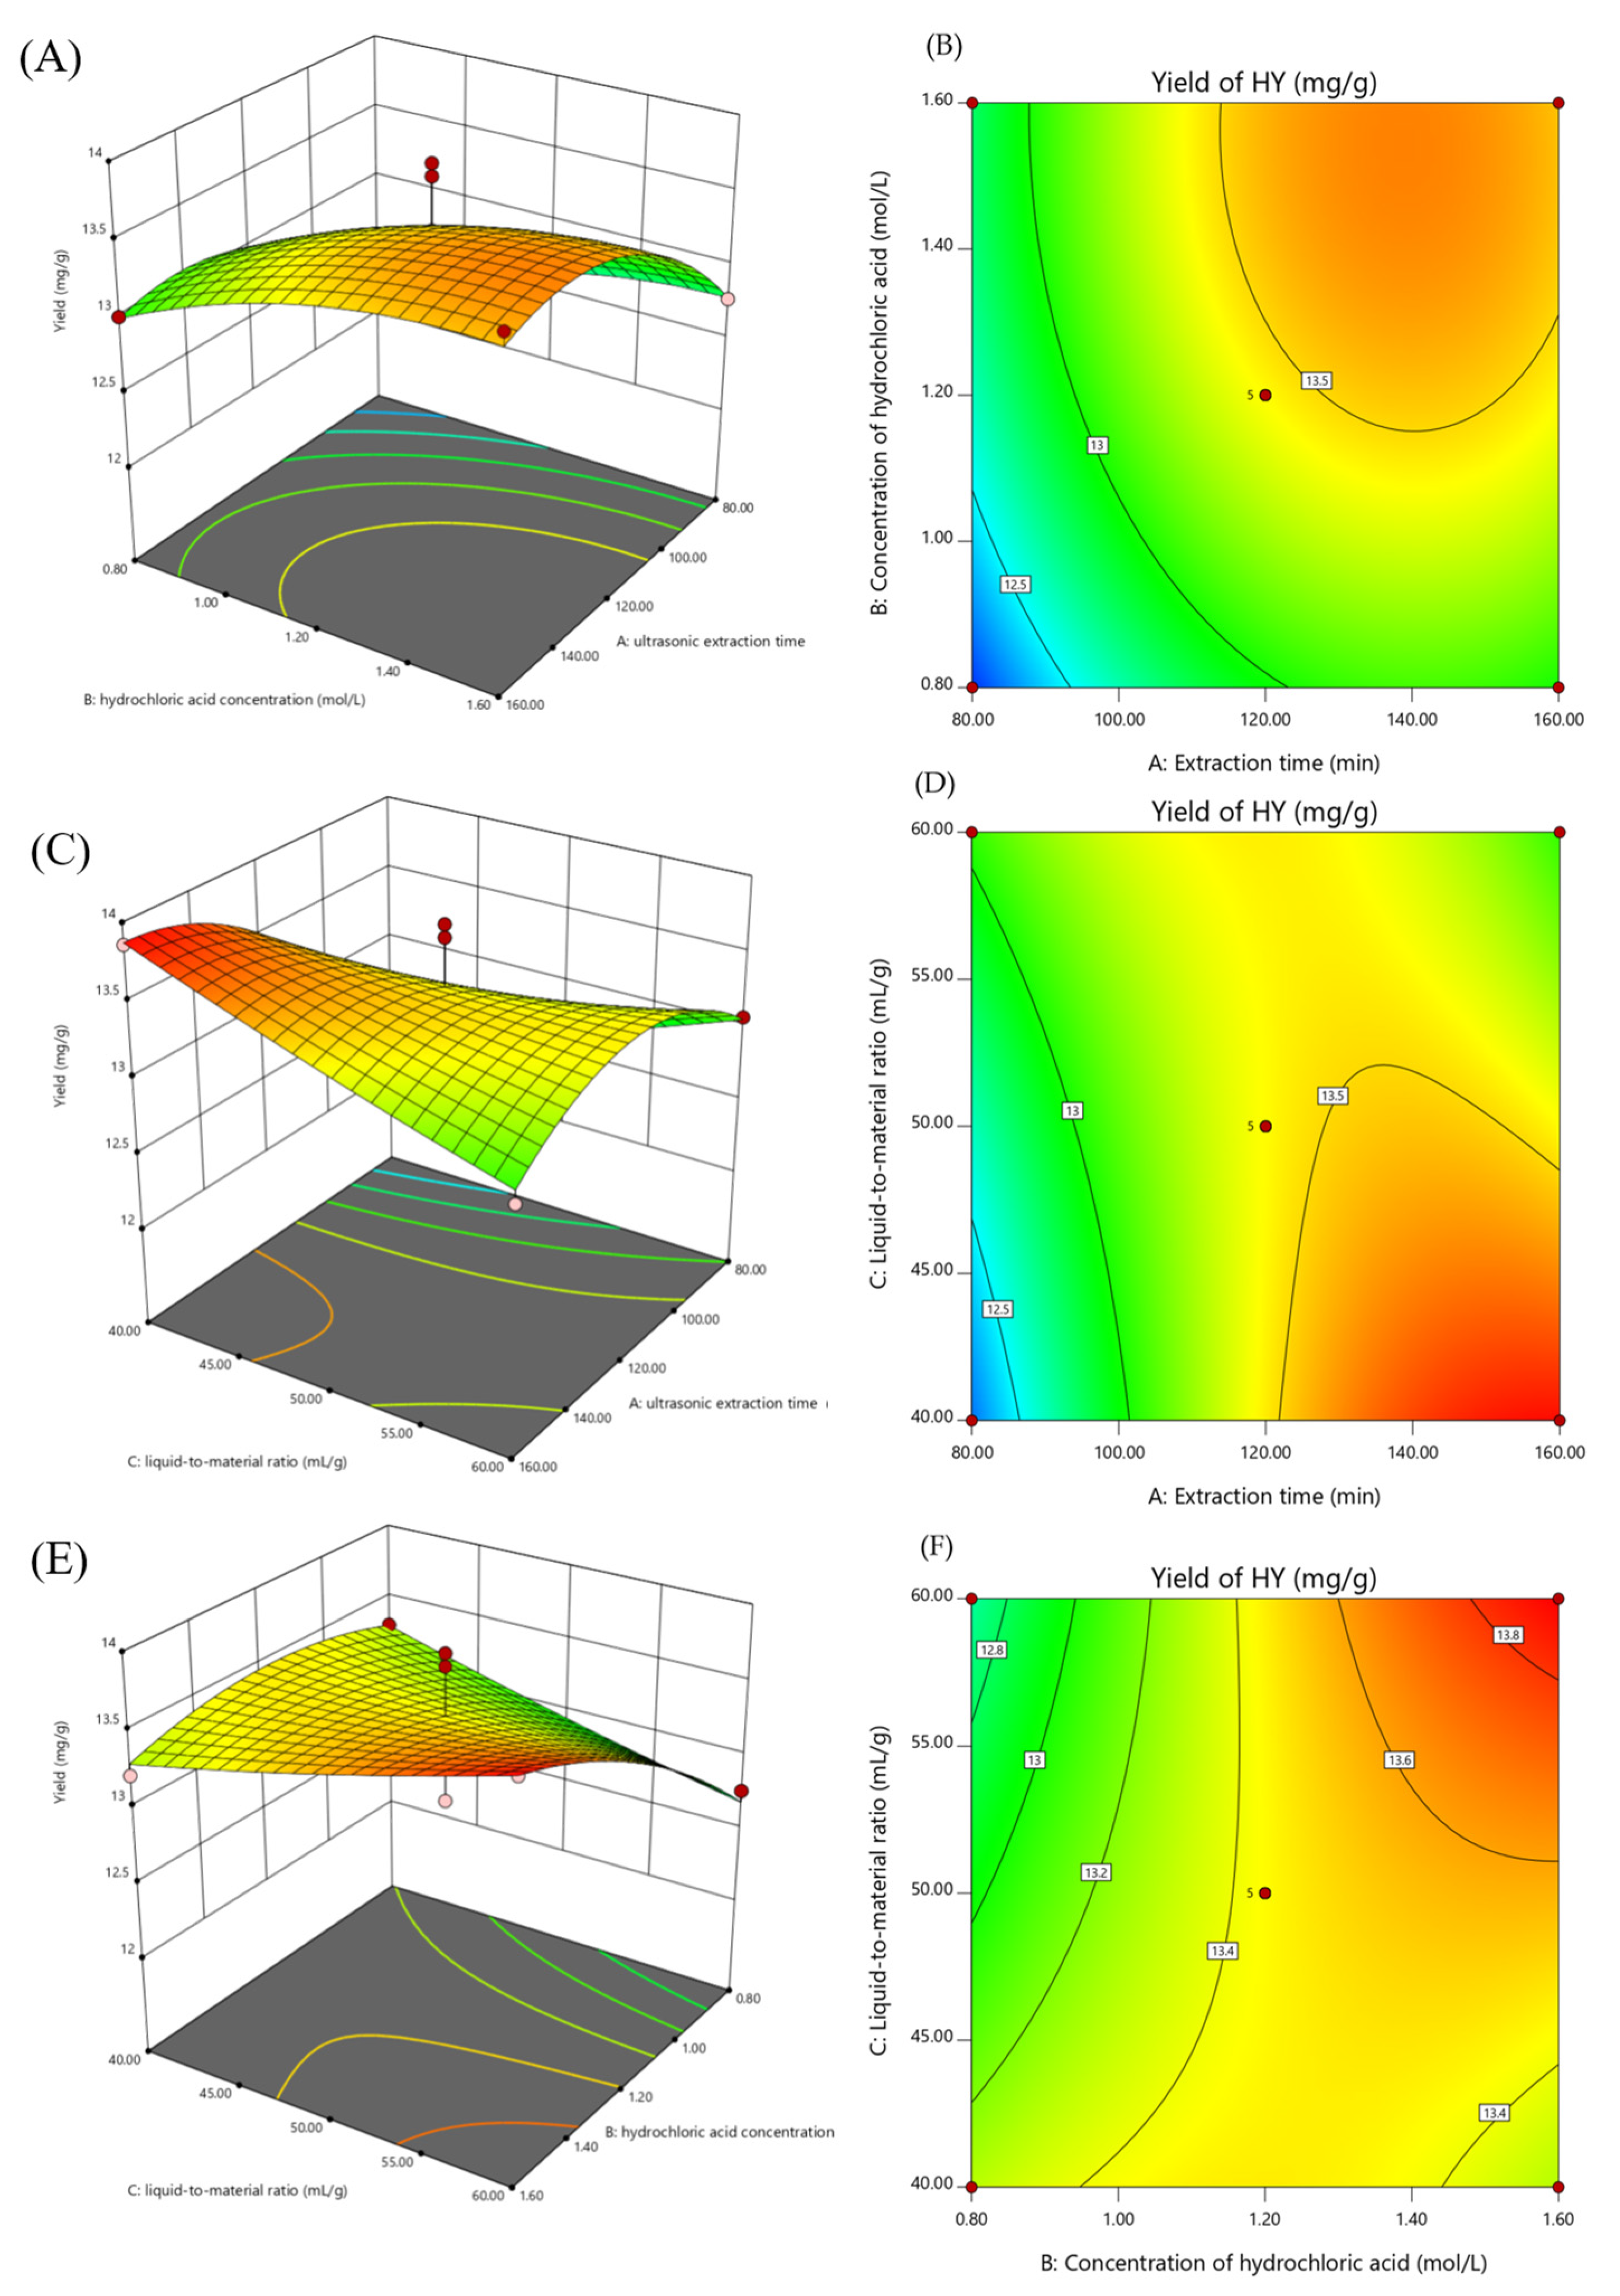
2.4.2. Designing the Response Surface
Based on the single-factor test, Box–Behnken design (BBD) was designed by the response surface software Design Expert 8.0.6. The ultrasonic extraction time (A), hydrochloric acid concentration (B) and liquid-to-material ratio (C) were used as independent variables. Taking the yield of HT as the response value (Y), a three-factor and three-level response surface test was designed. The test design was shown in
Table 1.
2.4.3. Verification Conduction
Dried olive leaves powder (1.0 g) was accurately weighed to conduct 3 parallel (n = 3) verification tests under the optimal process conditions. The reliability and stability of the optimized process were evaluated by comparing the measured and predicted values to examine.
2.5. Enrichment n of HT by Macroporous Resins
2.5.1. Selection a Suitable Macroporous Resin
Eight kinds of macroporous resins were soaked in ethanol for 24 h, and then rinsed with distilled water until no ethanol remained. Subsequently, resins were soaked in 5% sodium hydroxide solution for 5 h then rinsed with distilled water until neutral and then soaked in 5% hydrochloric acid solution for another 5 h and rinsed with distilled water until neutral again. The resins were dried at 50 °C in a drying oven to a constant weight. The extract solution was filtered through a 0.45 μm filter.
Dry resins (1 g) were accurately put in a conical flask with 30 mL of extraction solution. Then, the flasks were shaken at the speed of 120 r/min for 24 h at 25 °C. The HT content in the supernatant was determined by HPLC. The adsorption rate was calculated according to the following formula:
where C
1 was the HT content in the supernatant after 24 h of adsorption, and C
0 was the HT content in the initial extract solution.
Then, the solution was removed and the resins were dried by filter paper. A total of 30 mL 70% ethanol was added into the flask. All flasks were placed at shaking table for another 24 h. Finally, the content of HT in the solution was determined by HPLC. The desorption rate was calculated according to the following formula:
where C
2 was the HT content in the supernatant after 24 h of desorption, C
1 was the concentration of HT in the supernatant after 24 h of adsorption and C
0 was the HT content in the initial extract.
2.5.2. Static Adsorption and Desorption
In order to investigate the effect of ethanol concentration on the desorption ability, static adsorption and desorption experiments were performed. Resin (1 g) was placed in conical flasks with 30 mL of sample solution and placed in a shaker for 24 h. The HT content in the supernatant was measured. Then, the resin was dried with filter paper after the solution was removed. A total of 30 mL of 0, 25, 50, 75 and 100% ethanol was added into the flasks and then the flasks were put in a shaker for another 24 h at 25 °C. The content of HT in the supernatant was measured.
2.5.3. Dynamic Adsorption and Desorption
Determination of Leakage Curve
Resin was put in a chromatography column (1 × 30 cm). The sample solution was loaded at the flow rate of 1 mL/min, and every 5 mL was collected a tube to determine the HT content through HPLC. The leakage point was defined when the HT content in the collection solution was up to 10% of the original content so as to confirm the loading volume.
Effect of Load Rates
The sample solution was loaded into the column at the flow rate of 0.5, 1, 1.5 and 2 mL/min with a loading volume of 250 mL. Then, all solution was collected to determine the HT content. An optimal loading rate was chosen based on the above outcomes.
Determination of Elution Curve
After the resin adsorped the HT in the extraction solution, distilled water was loaded to rinse the resin until the solution was clean. Ethanol (75%) used as the elution was added into the column at a flow rate of 1.0 mL/min. The eluate was collected and the content of HT was measured to make up an elution curve so as to determine the volume of eluent.
Effect of Elution Flow Rates
After the resin adsorped the HT in the 250 mL extraction solution, distilled water was loaded to rinse the resin until the solution was clean. Ethanol (75%) was added into the column at the flow rate of 0.5, 1.0, 1.5 and 2.0 mL/min. An optimal elution flow rate was selected by measuring the content of HT in the eluent.
2.6. Statistical Analyses
The data in this study were carried out in triplicates and analyzed statistically by ANOVA (GraphPad Prism 6) (GraphPad Software, Inc., La Jolla, CA, USA). Design-Expert 11 software (trial version, State-Ease Inc., Minneapolis, MN, USA) was performed to design and analyze the experimental results of the response surface design. All experimental results were expressed as mean ± standard deviation (SD), n = 3.
3. Results
3.1. Determination of Extraction Method
The results in
Table 2 showed that under the same test conditions, the yield of HT after ultrasonic-assisted ethanol extraction was higher than that after traditional maceration method, indicating that ultrasound exhibited a positive effect on the yield of HT. Additionally, the yield of oleuropein was far higher than the yield of HT, showing the content of OE in olive leaves is much more than HT. Therefore, simple ethanol extraction could not promote the yield of HT in olive leaves.
De et al. reported that the yield of HT was 0.2% on fresh leaves produced by hydrolyzing leaves with hydrochloric acid [
15]. Additionally, some scholars used glacial acetic acid to hydrolyze leaves to get HT. However, there were many hetero peaks of glacial acetic acid in liquid chromatography and the peak of HT itself cannot be separated. Thus, based on the chromatographic conditions, ultrasonic-assisted hydrochloric acid was selected to enhance the yield of HT.
3.2. Analysis of Single-Factor Test Results
The yield of HT increased significantly with increasing ultrasound time (
Figure 1A), and when the ultrasound time was higher than 120 min, the yield of HT showed no significant difference. Thus three extraction times, 80, 120 and 160 min, were selected as the investigation level of the response surface test. As shown in
Figure 1B, the yield of HT boosted significantly as the concentration of hydrochloric acid increased. When the concentration of hydrochloric acid was higher than 1.2 mol/L, the yield of HT barely changed. Hence, 0.8, 1.2 and 1.6 mol/L of hydrochloric acid were chosen to design the response surface table. Increasing the liquid-to-material ratio would enhance the yield of HT (
Figure 1C) and while the sample to solution ratio was higher than 50 mL/g, the extraction rate tended to be stable. Therefore, 50 mL/g was selected as the central point.
It could be seen from
Figure 1d that the yield of HT fluctuated slightly with increasing temperature. When the temperature was increased from 30 °C to 80 °C, the maximum yield of HT was 12.6 mg/g and the minimum yield was 11.1 mg/g with a fluctuation range of 1.5 mg/g. When the temperature was between 50–70 °C, the yield of HT was about 12 mg/g and the yield of HT tended to decrease when the temperature was higher than 70 °C. Previous research demonstrated the increasing of temperature leaded to the decomposition as well as decrease of HT [
16]. In summary, in a certain range, the effect of temperature on HT was not significant, so temperature was not considered as a factor in the response surface test. Hence, the extraction was undergone at 50 °C.
3.3. Analysis of Response Surface Test Results
The response surface design and results were shown in
Table 3. Design Expert 11 was used to perform a multiple regression fit analysis and the following fitting coding equation was obtained:
The statistical parameters of the regression model were shown in
Table 4. The
p-value of model was 0.0256 (<0.05) and the
p-value of lack of fit was 0.9580 (>0.05), indicating that the model had a high degree of fit and small experimental errors. The correlation coefficient of the model R
2 was 0.8600, showing that the model had a higher accuracy. Therefore, this model could be used to optimize the extraction process of HT.
The analysis of ANOVA in
Table 4 showed that the ultrasound time and hydrochloric acid concentration had a significant effect on the yield of HT. The interaction between ultrasound time and liquid-material ratio also had a significant effect on the yield. The value of the F is: A > B > C. Hence, the order of the influence of each factor on the yield of HT was: ultrasound time > hydrochloric acid concentration > liquid-material ratio.
The 3D and contour plots of the response surface could intuitively reflect the influence of each factor and the interaction between two factors on the response value. The slope of 3D graph in a certain direction reflected the sensitivity of the response value to that factor. A steep slope indicated the large influence of the factor on the response value; otherwise, it was small. Judging the effect on the yield of HT from the 3D plots, the ultrasonic time had the greatest effect, followed by hydrochloric acid concentration and liquid–material ratio. As shown in
Figure 2A,B, the yield gradually increased with increasing ultrasound time and hydrochloric acid concentration, indicating the two factors were not interactive. Meanwhile, increasing the hydrochloric acid concentration and the liquid-to-material ratio could promote the yield of HT (
Figure 2E,F), meaning the same interaction. However, treating with different ultrasonic time, the yield of HT increased or decreased with the increasing liquid-to-material ratio, indicating they interacted each other (
Figure 2C,D). The results were in accordance with variance analysis (
Table 4).
3.4. Optimization and Verification of Extraction Process
The optimal extraction condition for ultrasonic-assisted extraction of HT by hydrochloric acid was: ultrasonic time was 118.65 min, hydrochloric acid concentration was 1.60 mol/L, liquid–liquid ratio was 60 mL/g and the predicted yield was 13.90 mg/g. Considering the actually experimental conditions, the optimized extraction condition was slightly modified: ultrasonic time was 120 min, hydrochloric acid concentration was 1.60 mol/L and liquid-to-material ratio was 60 mL/g. After three repeated experiments, the yield was 14.11 ± 0.1153 mg/g, which was not significantly different from the predicted value, indicating that the optimal process obtained by the optimization of the response surface was stable and reliable.
3.5. Screening of Macroporous Resin
The adsorption and desorption abilities of macroporous resins were affected by not only their polarity, specific surface area and pore size, etc. but also affected by the structure, molecular weight and polarity of the adsorbed substance. Therefore, the appropriate macroporous resin before separation and enrichment should be selected. The adsorption rate and desorption rate of macroporous resin were direct indicators reflecting the affinity between resins and target compounds. As shown in
Table 5, the absorption capacities of HT from extraction solution by eight macroporous resins was: NKA-Ⅱ > H103 > XAD4 > DM301 > DA201 > D101 > DM-2 > AB-8. Especially NKA-Ⅱ and H103 had a strong adsorption capacity for HT. The adsorption rate reached 97.43 and 97.34%, respectively. Comparing the desorption capabilities of the two macroporous resins, the 49.85% of NKA-Ⅱ was higher than 45.62% of H103. Taking the absorption and desorption into comprehensive consideration, NKA-Ⅱ could absorped more HT from extraction solution and the desorption was also about to 50%. Hence, NKA-Ⅱ was selected to enrich HT in extraction solution from olive leaves.
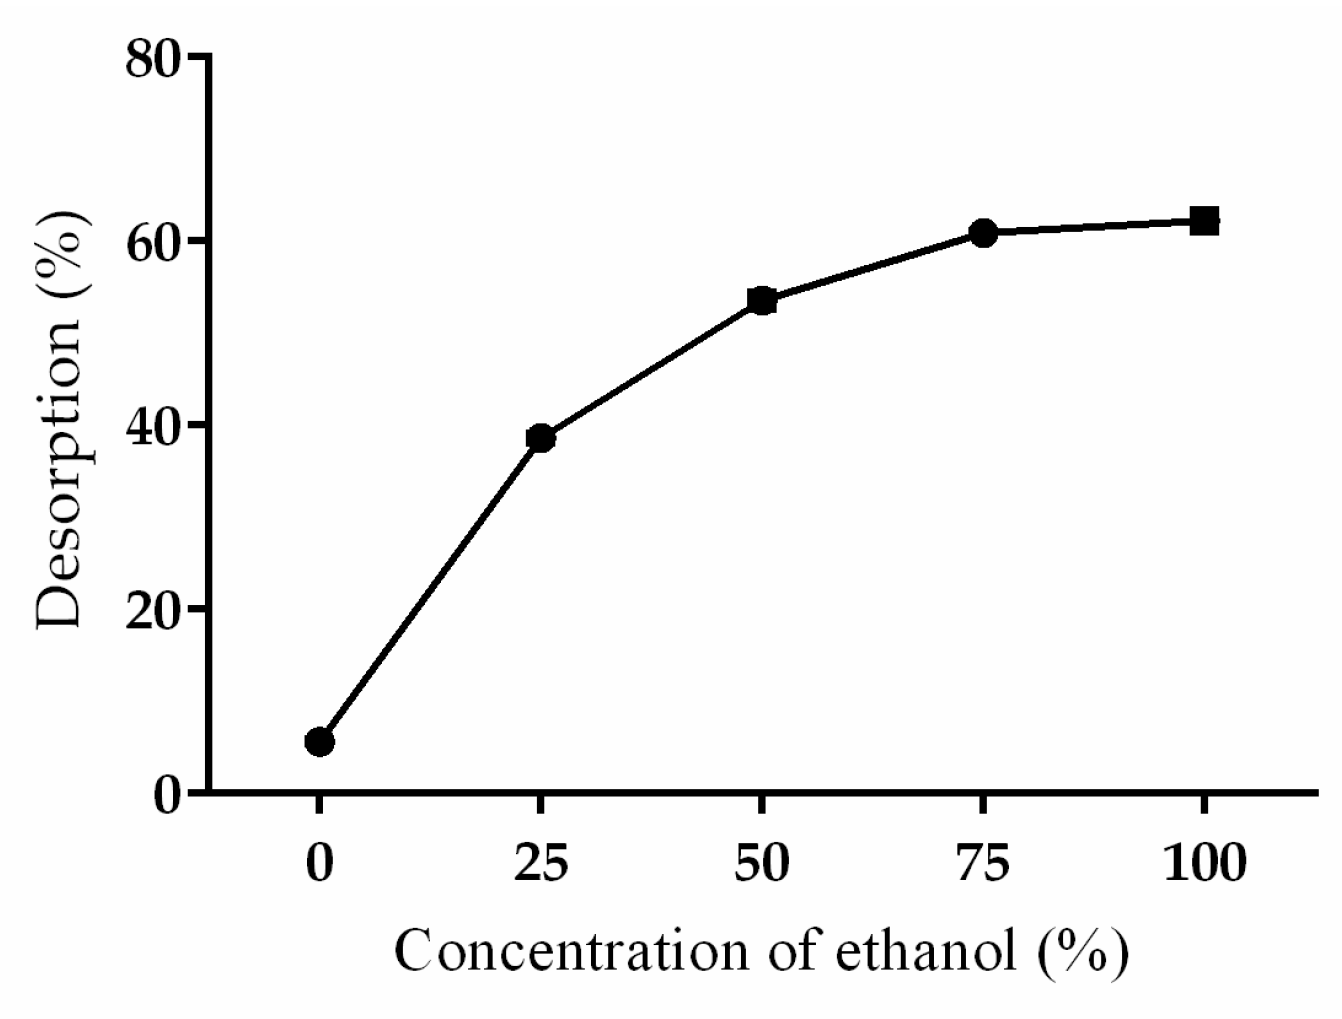
3.6. Effect of Ethanol Concentration on Resin Adsorption and Desorption
The concentration of ethanol directly affected the polarity of the eluent. According to the similar miscibility principle, a suitable polarity would be beneficial for enrichment. As shown in
Figure 3, the desorption rate of NKA-Ⅱ macroporous resin to HT in increased rapidly, and the rate tended to be flat when the concentration of ethanol reached to 75%. Hence, the suitable concentration of eluent was 75%.
3.7. Defination of Leakage Point
When the HT concentration in the collection solution reached 10% of the original concentration, it was defined as the leakage point [
17]. The leakage point of HT indicated that the macroporous resin had reached the adsorption saturation point at this time and the sample loading should be stopped. As shown in
Figure 4, the previous 39 tubes had no leakage indicating that HT had been completely adsorbed by the macroporous resin. The loading volume continued to increase, so as the leakage volume did. When the sample volume was 250 mL, the leakage was 11.54% reaching the leakage point. However, the volume was more than 250 mL, the macroporous resin could not absorb any more HT. Therefore, the loading volume was determined to be 250 mL.
3.8. Effect of Loading Speed on Adsorption of Macroporous Resin
The loading speed greatly affected the adsorption time of the resin by influencing the interaction time between HT and the surface-active area of the macroporous resin [
18]. The loading volume was the same 250 mL, and the leakage point was not shown up at the speed of 0.5, 1.0 and 1.5 mL/min and HT content was not detected in the collection solution. However, when the speed reached to 2.0 mL/min, the HT content was 9.13% indicating it was not conducive to the full contact between the resin and HT and HT flew out without being adsorbed by the resin. Hence, the loading speed was determined as 1.5 mL/min after comprehensive consideration of practicality.
3.9. Determination of Elution Curve and Influence of Elution Flow Rate
As shown in
Figure 5A, the peak shape of the elution curve was classical and the elution peak was narrow and sharp. More importantly there was no obvious tailing. HT firstly appeared in the elution when the eluent was 5 mL. Then, the content reached to a maximum when the elution volume was 15 mL. HT concentration tented to zero as the eluent was 40 mL, indicating that HT had almost washed out by eluent. Therefore, the elution volume was determined to be 40 mL.
The speed of the elution had a significant effect on the desorption effect of the macroporous resin. When the eluent was in full contact with the resin, it promoted the desorption of HT. However, when the speed was too slow, HT under desorption may be re-adsorped, thus reducing the desorption effect. If the speed was too fast, the eluent could not contact the resin sufficiently. When the speed of elution was over 1 mL/min, the content of HT was reducing showing a lower desorption. Moreover, the desorption effect of 0.5 and 1.0 mL/min was not significantly different. Hence, the elution flow rate was selected as 1.0 mL/min.
3.10. Investigation on Enrichment Process of HT by Macroporous Resin
According to the selected best process: 250 mL of loading solution was loaded at the flow rate of 1.5 mL/min and the elution solution was 75% ethanol to elute HT from resin at a flow rate of 1.0 mL/min. The collection solution was 40 mL then was dried and determined the concentration of HT. The concentration of HT in the extraction solution was 2.27%. While the concentration was reaching to 9.25% after enrichment by macroporous resin. This showed that NKA-Ⅱ macroporous resin could excellently enrich HT from the olive leaves. The process was pretty low in cost and easy to operate, and could be used in actual production.
4. Conclusions
In this study, ultrasound was found to be beneficial for improving the yield of HT compared with the simple ethanol maceration extraction. Therefore, hydrolysis of hydrochloric acid with the assistance of ultrasound was applied to extract HT from olive leaves. Single-factors assays and response surface method were also successfully used to optimize the extraction process. An optimal extraction conditions were obtained: ultrasonic time was 120 min, hydrochloric acid concentration was 1.60 mol/L and the liquid-to-material ratio was 60.00 mL/g. The highest yield of HT was 14.11 ± 0.12 mg/g. Furthermore, macroporous resins were applied to enrich HT from the extraction solution. NKA-Ⅱ macroporous resins was selected to be the suitable resin to exhibit a high adsorption and desorption rate on HT. Under the optimal condition: 250 mL of loading solution at the flow rate of 1.5 mL/min and the 40 mL eluent of 75% ethanol at a flow rate of 1.0 mL/min, the concentration of HT changed from 2.27% to 9.25%. Olive leaves were the waste of production but also were abundant in bioactive compounds such as HT. Hence, this study provided a simple and practical method to obtain more HT from olive leaves thus making waste to a treasure.