Abstract
The immature epicarps of Juglans mandshurica and Juglans regia have been used as folk medicine for the treatment of cancer in China. Other parts of the J. mandshurica plant, including leaves, branches, barks, and stems, have reported antitumor activities. We previously found that various diarylheptanoids and phenolic compounds isolated from J. mandshurica epicarps show significant antitumor activities. However, there are no reports of quantitative analysis of diarylheptanoids and phenolic compounds of J. mandshurica. In this study, a validated quantitative method, based on ultraperformance liquid chromatography coupled with triple-quadrupole tandem mass spectrometry, was employed to determine the contents of eight diarylheptanoids and seven phenolic compounds in the epicarps of J. mandshurica during different growth periods, in different parts of the plant, and in the epicarps of two Juglans species. The most successful J. mandshurica epicarp harvesting time fell between Day 12 and Day 27. The leaves of J. mandshurica showed potential for medical use as they had the highest content of the 15 compounds (3.399 ± 0.013 mg/g). We showed for the first time that the total content of diarylheptanoids in J. mandshurica is higher than that in J. regia, though, conversely, J. regia has higher contents of phenolic compounds. The method developed in this study is practical and simple and can be applied for quantitative analysis for evaluating the intrinsic quality of J. mandshurica.
1. Introduction
Juglans mandshurica Maxim. (family: Juglandaceae), a type of walnut tree, is primarily distributed throughout rural intermontane areas in northeast China [1]. The immature epicarps, branches, barks, stems, and leaves of J. mandshurica contain several types of natural compounds, such as naphthoquinones [2,3], diarylheptanoids [4], phenolic compounds [5], triterpenes [6], and polysaccharides [7], which show antitumor [8], antioxidant [9], anti-inflammatory [10], antimicrobial [11], immunoregulatory [12], neuroprotective [13] activities. In particular, the epicarps of J. mandshurica and J. regia have been used in China since the Han dynasty as popular folk herbal medicines to treat diseases and ailments such as diarrhea, gastritis, leukopenia, dermatosis, and uterine prolapse [14,15,16,17].
We recently reported on the structures and cytotoxic activities of various diarylheptanoids and phenolic compounds that are constituents of green walnut (J. mandshurica and J. regia) [18,19]. Diarylheptanoids are distinctive biological components responsible for melanogenesis, inhibitory and free radical scavenging activities [20], antitumor activity [21], degranulation inhibition [22], and phenolic compounds possess anti-inflammatory [10], hepatoprotective [16], antioxidative [23], and anticarcinogenic properties [24].
The current study focuses on the identification and quantification of biological constituents, including diarylheptanoids and phenolic compounds, in different plant parts, species, and harvest times, to provide an indication of their efficacy. Quantitative analysis of constituents is essential for a scientifically robust investigation of the relationship between chemical constituents and pharmacological activities [25], and the harvest time, organs, and species of medicinal plants can affect the contents of bioactive constituents [26,27].
Recently, high-performance liquid chromatography (HPLC) [28] and capillary zone electrophoresis (CZE) [29] were applied in the detection of diarylheptanoids in Juglans species, but these methods suffer from low resolution, low sensitivity, and long analysis times. As a sensitive and selective tool, ultraperformance liquid chromatography coupled with tandem mass spectrometry (UPLC–MS/MS) is frequently used to analyze the bioactive substances in traditional Chinese medicines due to its high repeatability and sensitivity [30,31], and multiple reaction monitoring (MRM), performed on a triple quadrupole (TQ) mass spectrometer, is considered the gold standard for compound quantification [32].
Consequently, in order to evaluate the intrinsic qualities of J. mandshurica, ultraperformance liquid chromatography coupled with triple-quadrupole tandem mass spectrometry (UPLC–TQ-MS) was performed to confirm the contents of eight diarylheptanoids and seven phenolic compounds with three specific purposes. First, we aimed to determine the optimal harvesting time of J. mandshurica epicarps. Second, we attempted to determine the difference in compound content between five different J. mandshurica parts. Additionally, the third purpose was to find out if there is any significant difference between the epicarps of J. mandshurica and J. regia in terms of their chemical constituents. The results may provide a reason for the utilization of J. mandshurica and the method may serve as a tool for further related studies.
2. Materials and Methods
2.1. Reagents and Materials
The epicarps from different growth periods of J. mandshurica were collected every 2 weeks from Harbin Medical University, Harbin, Heilongjiang, China, from 18 June 2020 until the fruits fell. The samples from 18 June, 30 June, 15 July, 28 July, 11 August, and 30 August were marked as Day 0, Day 12, Day 27, Day 40, Day 54 and Day 73, respectively. The sample collected on 30 August 2020 was denoted as HLJ-1 in the comparison to samples of J. regia. The epicarps, branches, leaves, stems, and stem bark of J. mandshurica were picked from Harbin Medical University, Harbin, Heilongjiang, China on 30 August 2020. The epicarps of J. mandshurica, including JiLin-1, JiLin-2, and JiLin-3, were collected from the regions of Shulan, Changchun, Songyuan, respectively, in Jilin, China, on 30 August 2020. Additionally, the epicarps of J. regia, including Luguo1hao, Zhipihetao, Xinzaofeng, Zha343, Xinjufeng, Lipin1hao, and Xilin3hao, which are the most common local varieties, cultivated at a high rate in Xinjiang, were collected from Aksu, Xinjiang, China, on 1 September 2020. After collection, the fresh samples were dried at room temperature in the shade, and then the dry raw materials were stored in sealed plastic bag at room temperature before analysis. All the plant materials were identified by Professor Jinhui Wang (College of Pharmacy, Harbin Medical University, Harbin, China). Voucher specimens (202009XJLKY) were deposited in the Xinjiang Academy of Forestry.
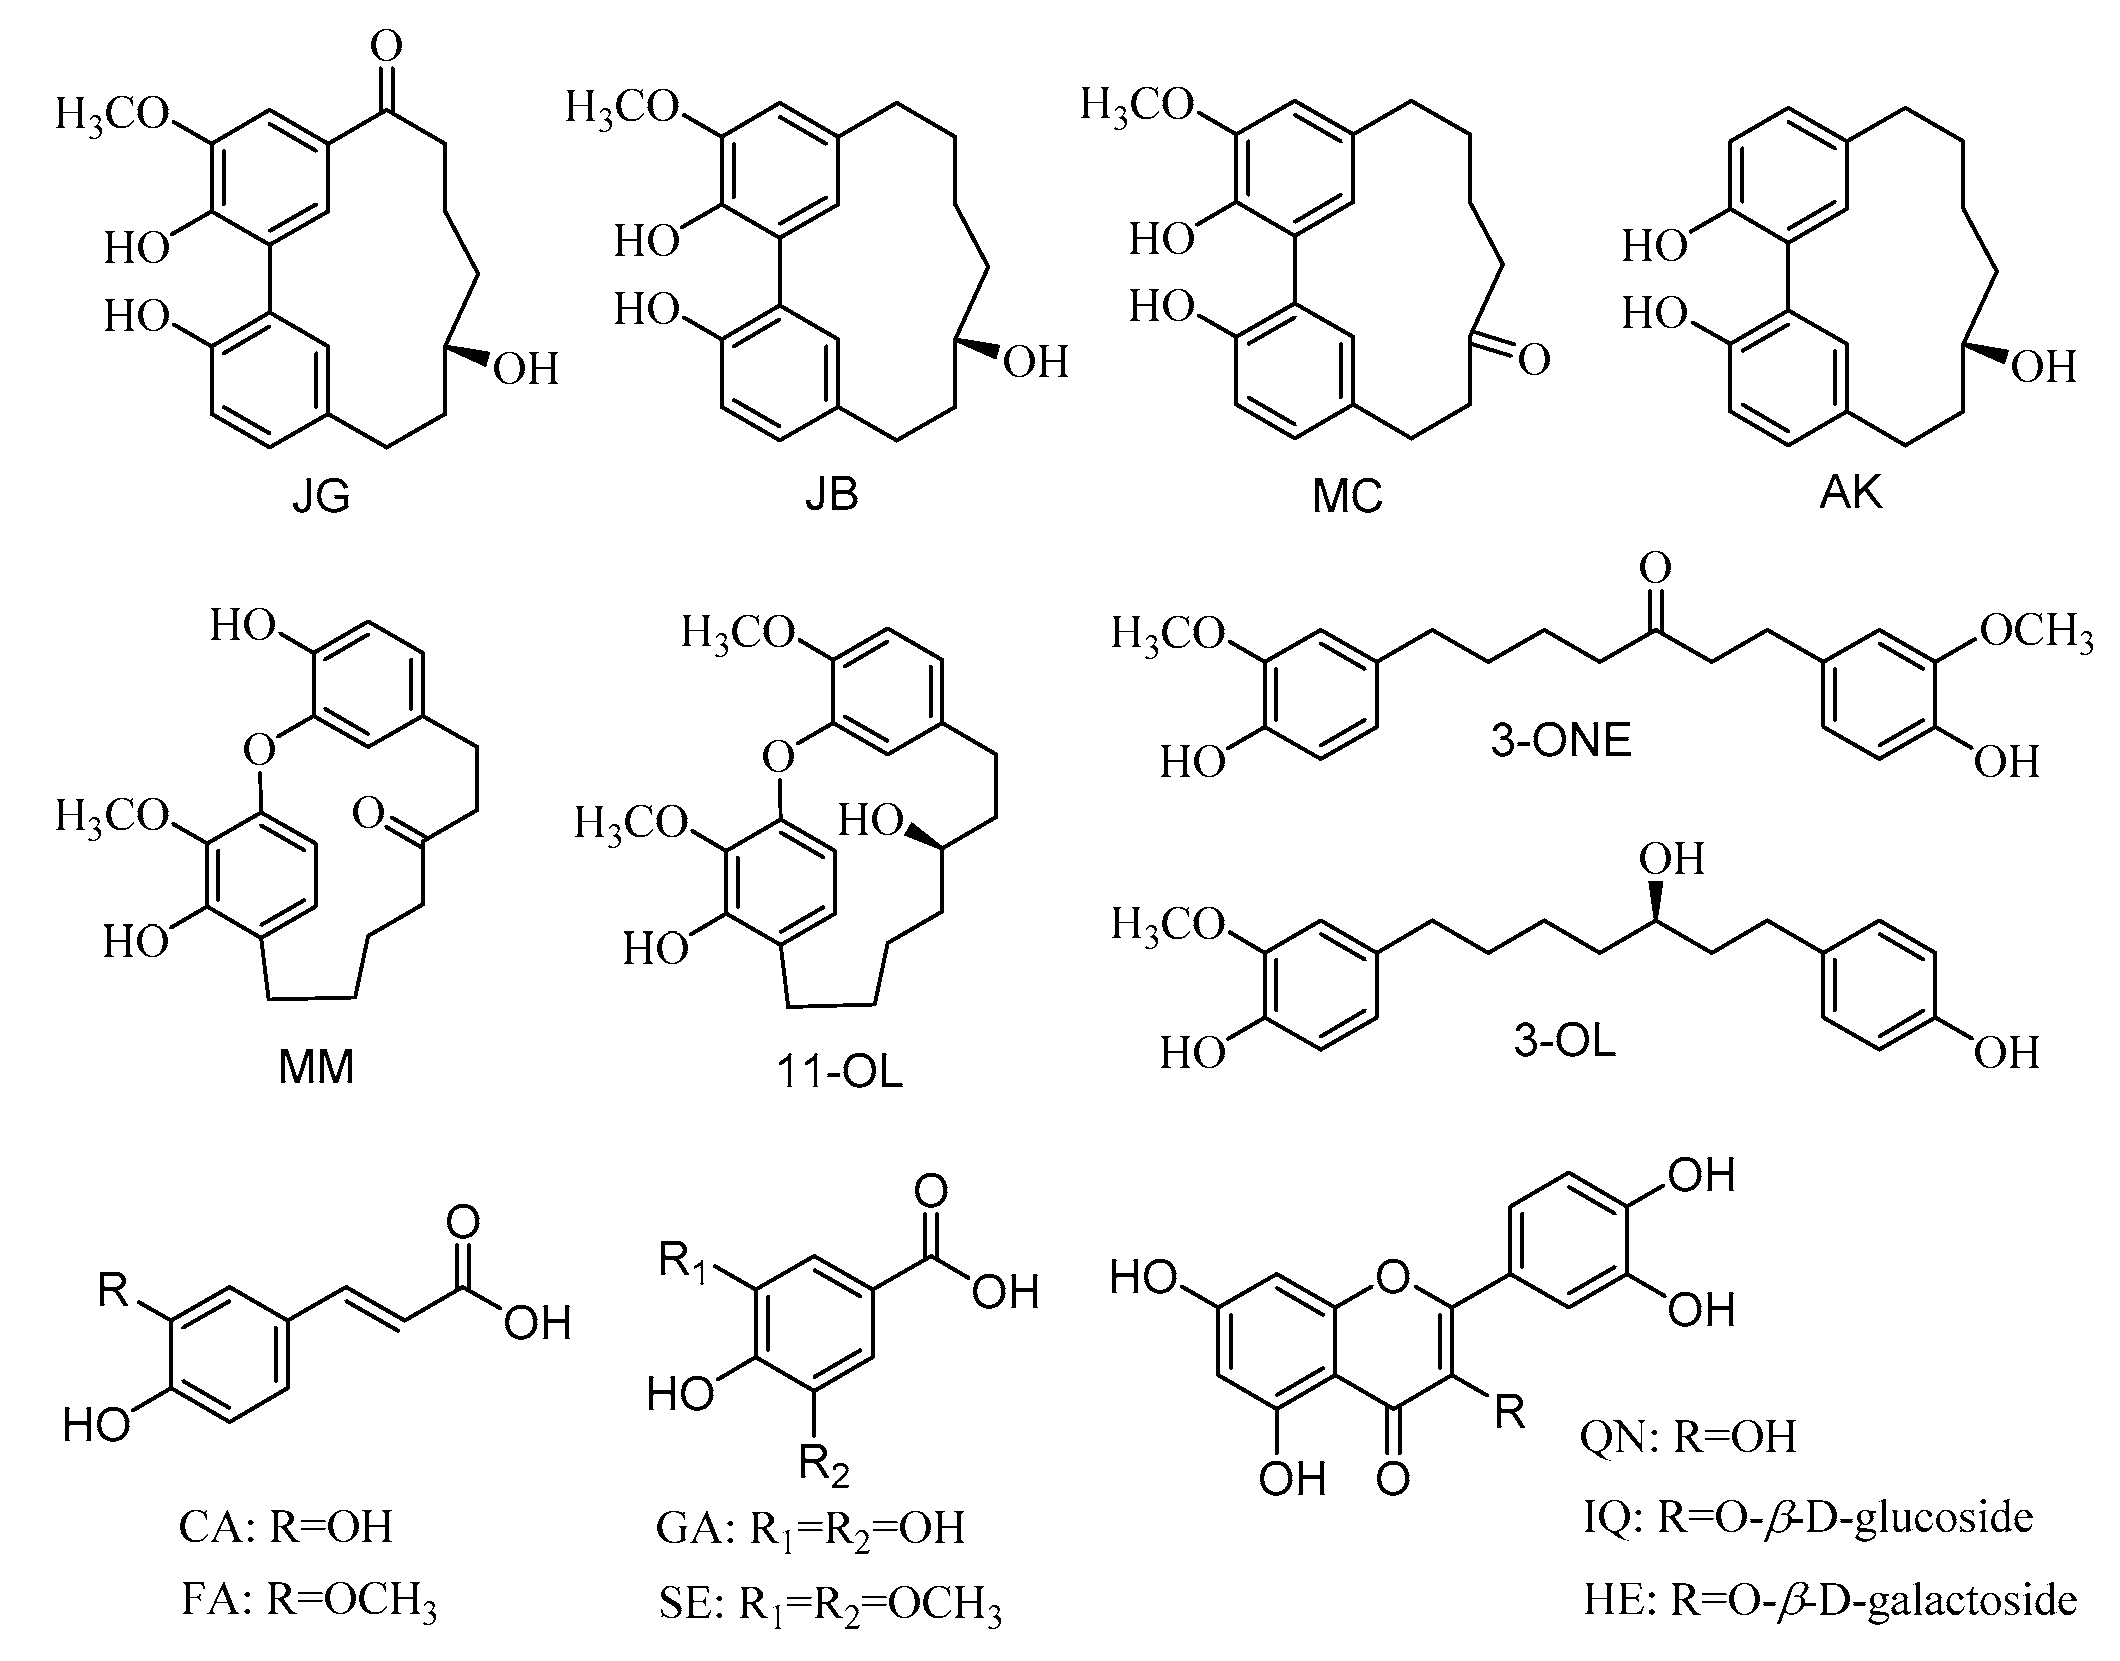
The reference compounds of juglanin G (JG), juglanin B (JB), myricananin C (MC), acerogenin K (AK), myricatomentogenin (MM), (11R)-3,11-dihydroxy-2,17-dimethoxy-1, 16-oxo-7,13-diphenyl-11-heptanol (11-OL), 1,7-di(4-hydroxy-3-methoxyphenyl) heptan-3-one (3-ONE), and (3R)-1-(4′-hydroxyphenyl)-7-(3″-methoxy-4″-hydroxyphenyl)-3-heptanol (3-OL) (structures shown in Figure 1) were extracted and purified from green walnut husks (J. mandshurica) in our laboratory and their purities were more than 96% per HPLC-PDA analysis. The structures of these compounds were elucidated by extensive analyses of nuclear magnetic resonance (NMR) and high resolution mass spectrometry (HRMS) data, and on the basis of spectroscopic analysis [18,19]. In addition, hyperoside (HE), isoquercitrin (IQ), quercetin (QN), syringate (SE), ferulic acid (FA), caffeic acid (CA), and gallic acid (GA) (purity ≥ 98%) were purchased from ANPEL Laboratory Technologies Inc. (Shanghai, China).
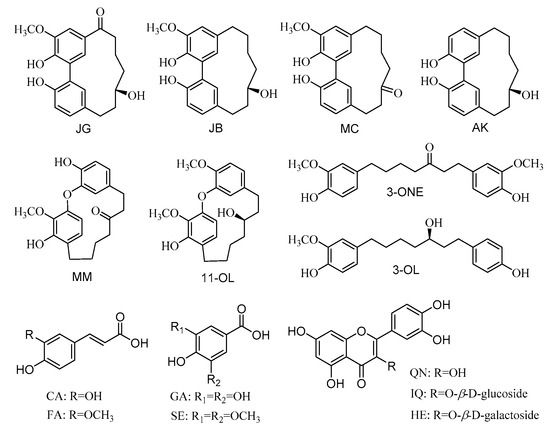
Figure 1.
Chemical structures of the 15 reference substances: JG—juglanin G; JB—juglanin B; MC—myricananin C; AK—acerogenin K; MM—myricatomentogenin; 11-OL—(11R)-3,11-dihydroxy-2,17-dimethoxy-1,16-oxo-7,13-diphenyl-11-heptanol; 3-ONE—1,7-di(4-hydroxy-3-methoxyphenyl)heptan-3-one; 3-OL—(3R)-1-(4′-hydroxyphenyl)-7-(3″-methoxy-4″-hydroxyphenyl)-3-heptanol; HE—hyperoside; IQ—isoquercitrin; QN—quercetin; SE—syringate; FA—ferulic acid; CA—caffeic acid; GA—gallic acid.
LC–MS-grade acetonitrile and methanol were purchased from Fisher Scientific Co. (Loughborough, UK). HPLC-grade methanol was obtained from Sigma-Aldrich (St. Louis, MO, USA). Deionized water (18.2 Ω) was further purified using a Milli-Q system (Millipore, Billerica, USA). Oasis® PRiME HLB Cartridge Plus Short (335 mg) was provided by Waters Technology (Milford, MA, USA).
2.2. Preparation of Standard and Sample Solutions
Fifteen reference substances were separately dissolved in methanol to prepare the individual standard stock solutions with a concentration of 1.0 mg/mL. Then, the 15 mixed standards were progressively diluted to 10 μg/mL. Finally, the 10 μg/mL mixed standard solution was serially diluted with methanol to obtain nine standard working solutions with different concentrations for the construction of calibration curves. All solutions were stored at −20 °C and filtered through 0.22 μm membrane filter before analysis.
Each sample was accurately weighed to 250 mg and mixed with 5 mL 70% MeOH–water (v/v). The samples were extracted ultrasonically for 30 min and cooled to room temperature; we compensated for weightlessness and then centrifuged the samples at 12,000 rpm for 5 min. Then, 1 mL of the supernatant was filtered through an HLB Cartridge Plus Short and eluted with 4 mL methanol in a 5 mL volumetric flask. Methanol was added to bring the volume to scale and mixed thoroughly. Three replicates were prepared for every sample.
2.3. Quantitative Analysis Conditions
The quantitation method was performed using an Acquity UPLC I-class system (Waters, Milford, MA, USA) with an Acquity UPLC BEH C18 column (100 mm × 2.1 mm, 1.7 μm, Waters, Milford, MA, USA) used at 40 °C. A binary solvent system was used, consisting of solvent A (water containing 0.1% formic acid) and solvent B (acetonitrile). The gradient program was 0–0.5 min with 5% solvent B, 0.5–3.0 min with 5–20% B, 3.0–4.0 min with 20–45% B, 4.0–7.0 min with 45–55% B, and 7.0–8.0 min with 55–95% B. The injection volume was 2 μL and the flow rate was set to 0.4 mL/min.
A Xevo TQ (Waters MS Technologies, Manchester, UK), equipped with an electrospray ionization ion (ESI) source, was applied for mass spectrometry data acquisition in negative ionization mode. The ion scan mode adopted was multiple reaction monitoring (MRM) mode and the MS experimental conditions were set as follows: electrospray capillary voltage 2.5 kV, cone voltage 40 V, source temperature 110 °C, desolvation temperature 450 °C, cone gas flow 50 L/h, and desolvation gas 800 L/h. Nitrogen and argon were used as the nebulizer and collision gas, respectively. The UPLC–TQ-MS system was controlled by the MassLynx 4.1 software (Waters, Milford, MA, USA). The parameters of the MRM mode were optimized automatically and the MRM ions pairs were as follows: JG (341.1787 → 326.1056), JB (327.1994 → 312.0562), MC (325.3752 → 310.1357), AK (297.3803 → 224.1975), MM (341.1787 → 326.1073), 11-OL (357.2100 → 342.1386), 3-ONE (357.2100 → 206.0234), 3-OL (329.2150 → 134.9892), HE (463.3189 → 300.1985), IQ (463.3189 → 271.0959), QN (301.1400 → 150.9000), SE (197.0209 → 181.9573), FA (193.0260 → 133.9034), CA (179.0103 → 134.9226), and GA (168.9896 → 124.9345), all of which correspond to parent ion → daughter ion (the detailed parameters are shown in Supplementary Material, Table S3).
2.4. Validation of the Quantitative Method
The calibration curve for each diarylheptanoid was constructed by plotting the peak area (y) against corresponding concentrations (x). The limit of detection (LOD) and limit of quantification (LOQ) were determined by serial dilution of the mixed standard solution at the lowest concentrations of each calibration curves at signal-to-noise ratios (SNRs) of 3 and 10.
The precision was determined by six repetitive injections. To determine the repeatability, the same samples were measured in six replicates. The sample solution was stored in sample manager and analyzed at 0, 2, 4, 8, 12, and 24 h to investigate the stability. The accuracy of the method was expressed according to the recovery. We placed the known mixed standard solutions into the same sample. The results were evaluated by the relative standard deviation (RSD) values, and six replicates were performed for the analysis.
2.5. Data Analysis
Statistical analyses of the quantitative data were conducted using Microsoft Office Excel 2016 (Microsoft, Redmond, WA, USA), and the quantitative contents of the representative components were imported into the SIMCA 14.1 software (Sartorius, Goettingen, Germany) to perform chemometric analysis, including construction of the principal component analysis (PCA) and orthogonal projections to latent structures discriminant analysis (OPLS-DA) models. R2X and Q2 (cumulative) are usually used to evaluate the quality of the PCA model; the closer both R2X and Q2 (cumulative) are to 1, the higher the quality of the PCA model. R2X, R2Y, and Q2 were comparably used in the OPLS-DA models. The closer the obtained values are to 1, the higher the model quality.
3. Results and Discussion
3.1. Method Validations
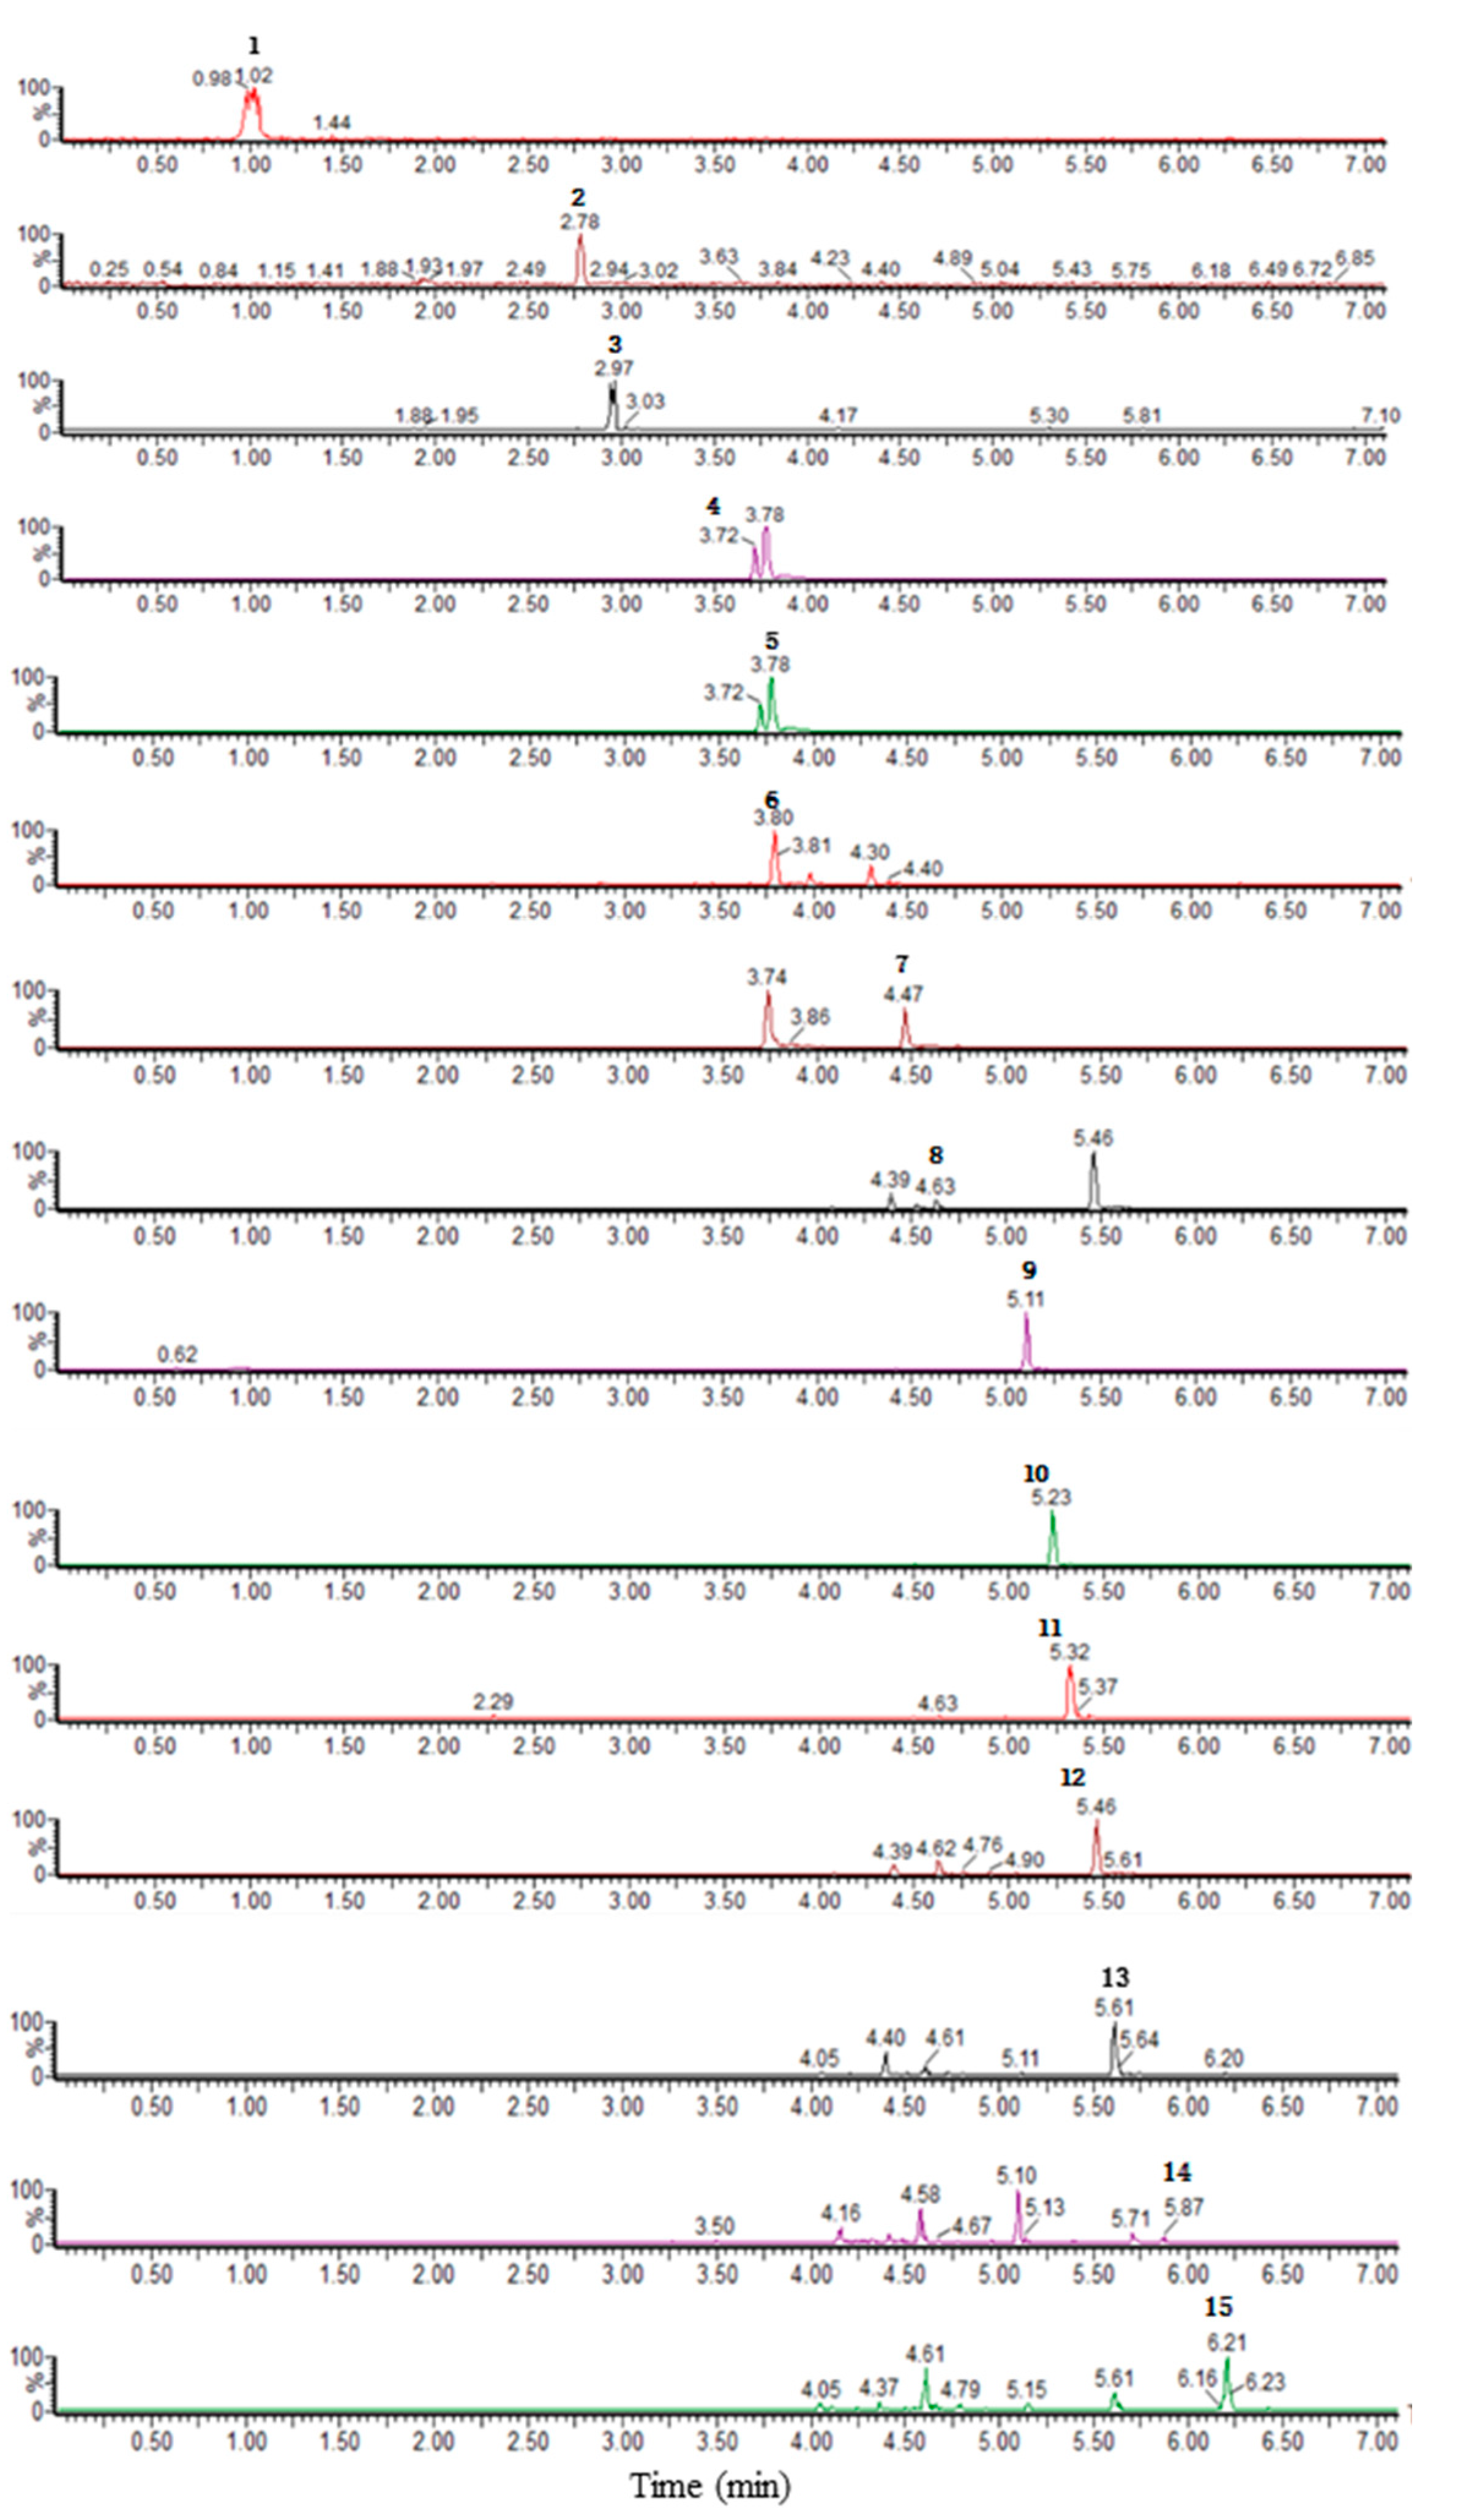
The chemical structures of the 15 reference substances are shown in Figure 1. The extracted ion chromatogram of the reference substances (ESI−) in J. mandshurica is depicted in Figure 2.
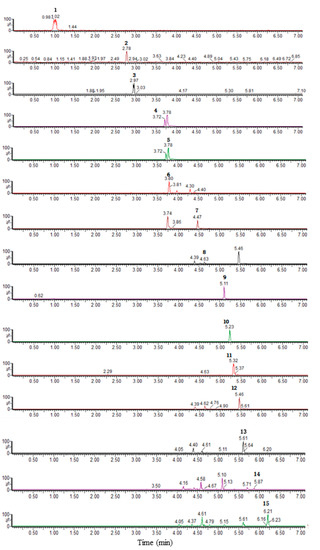
Figure 2.
Extracted ion chromatogram of reference standards of the 15 studied compounds (ESI−) in the epicarps of J. mandshurica. (1) GA; (2) CA; (3) SE; (4) HE; (5) IQ; (6) FA; (7) QN; (8) JG; (9) 3-OL; (10) JB; (11) AK; (12) MM; (13) 3-ONE; (14) MC; (15) 11-OL.
According to the peak area of each standard solution (y) and the concentration of each analyte (x), a series of the linear calibration curves of the reference standard solutions with seven concentrations was plotted. The correlation coefficient (R2) of linearity was greater than 0.9990 for all investigated compounds. The method showed a good precision in the range of 0.47–4.11%. The recoveries ranged from 99.93% to 108.81% with an RSD% less than 3.38%. The RSD% values of the stability and repeatability were less than 2.72% and 2.28%, respectively. The calibration curves, correlation coefficient, linear range, LOD, and LOQ of each compound are listed in Table 1, and they confirm the feasibility of the method for the quantitative assessment of J. mandshurica.

Table 1.
Linearity of standard curves and validated data for reference standards 1–15.
3.2. Quantification of the 15 Compounds in the Epicarps of J. mandshurica
In this study, six J. mandshurica epicarp samples were collected during the period of fruit growth to maturity (18 June–30 August, Day 0–Day 73) at two-week intervals. Then, eight diarylheptanoids and seven phenols in epicarps were quantitatively analyzed using UPLC–TQ-MS. The changing trends and compositions in compound contents for each sample are described below.
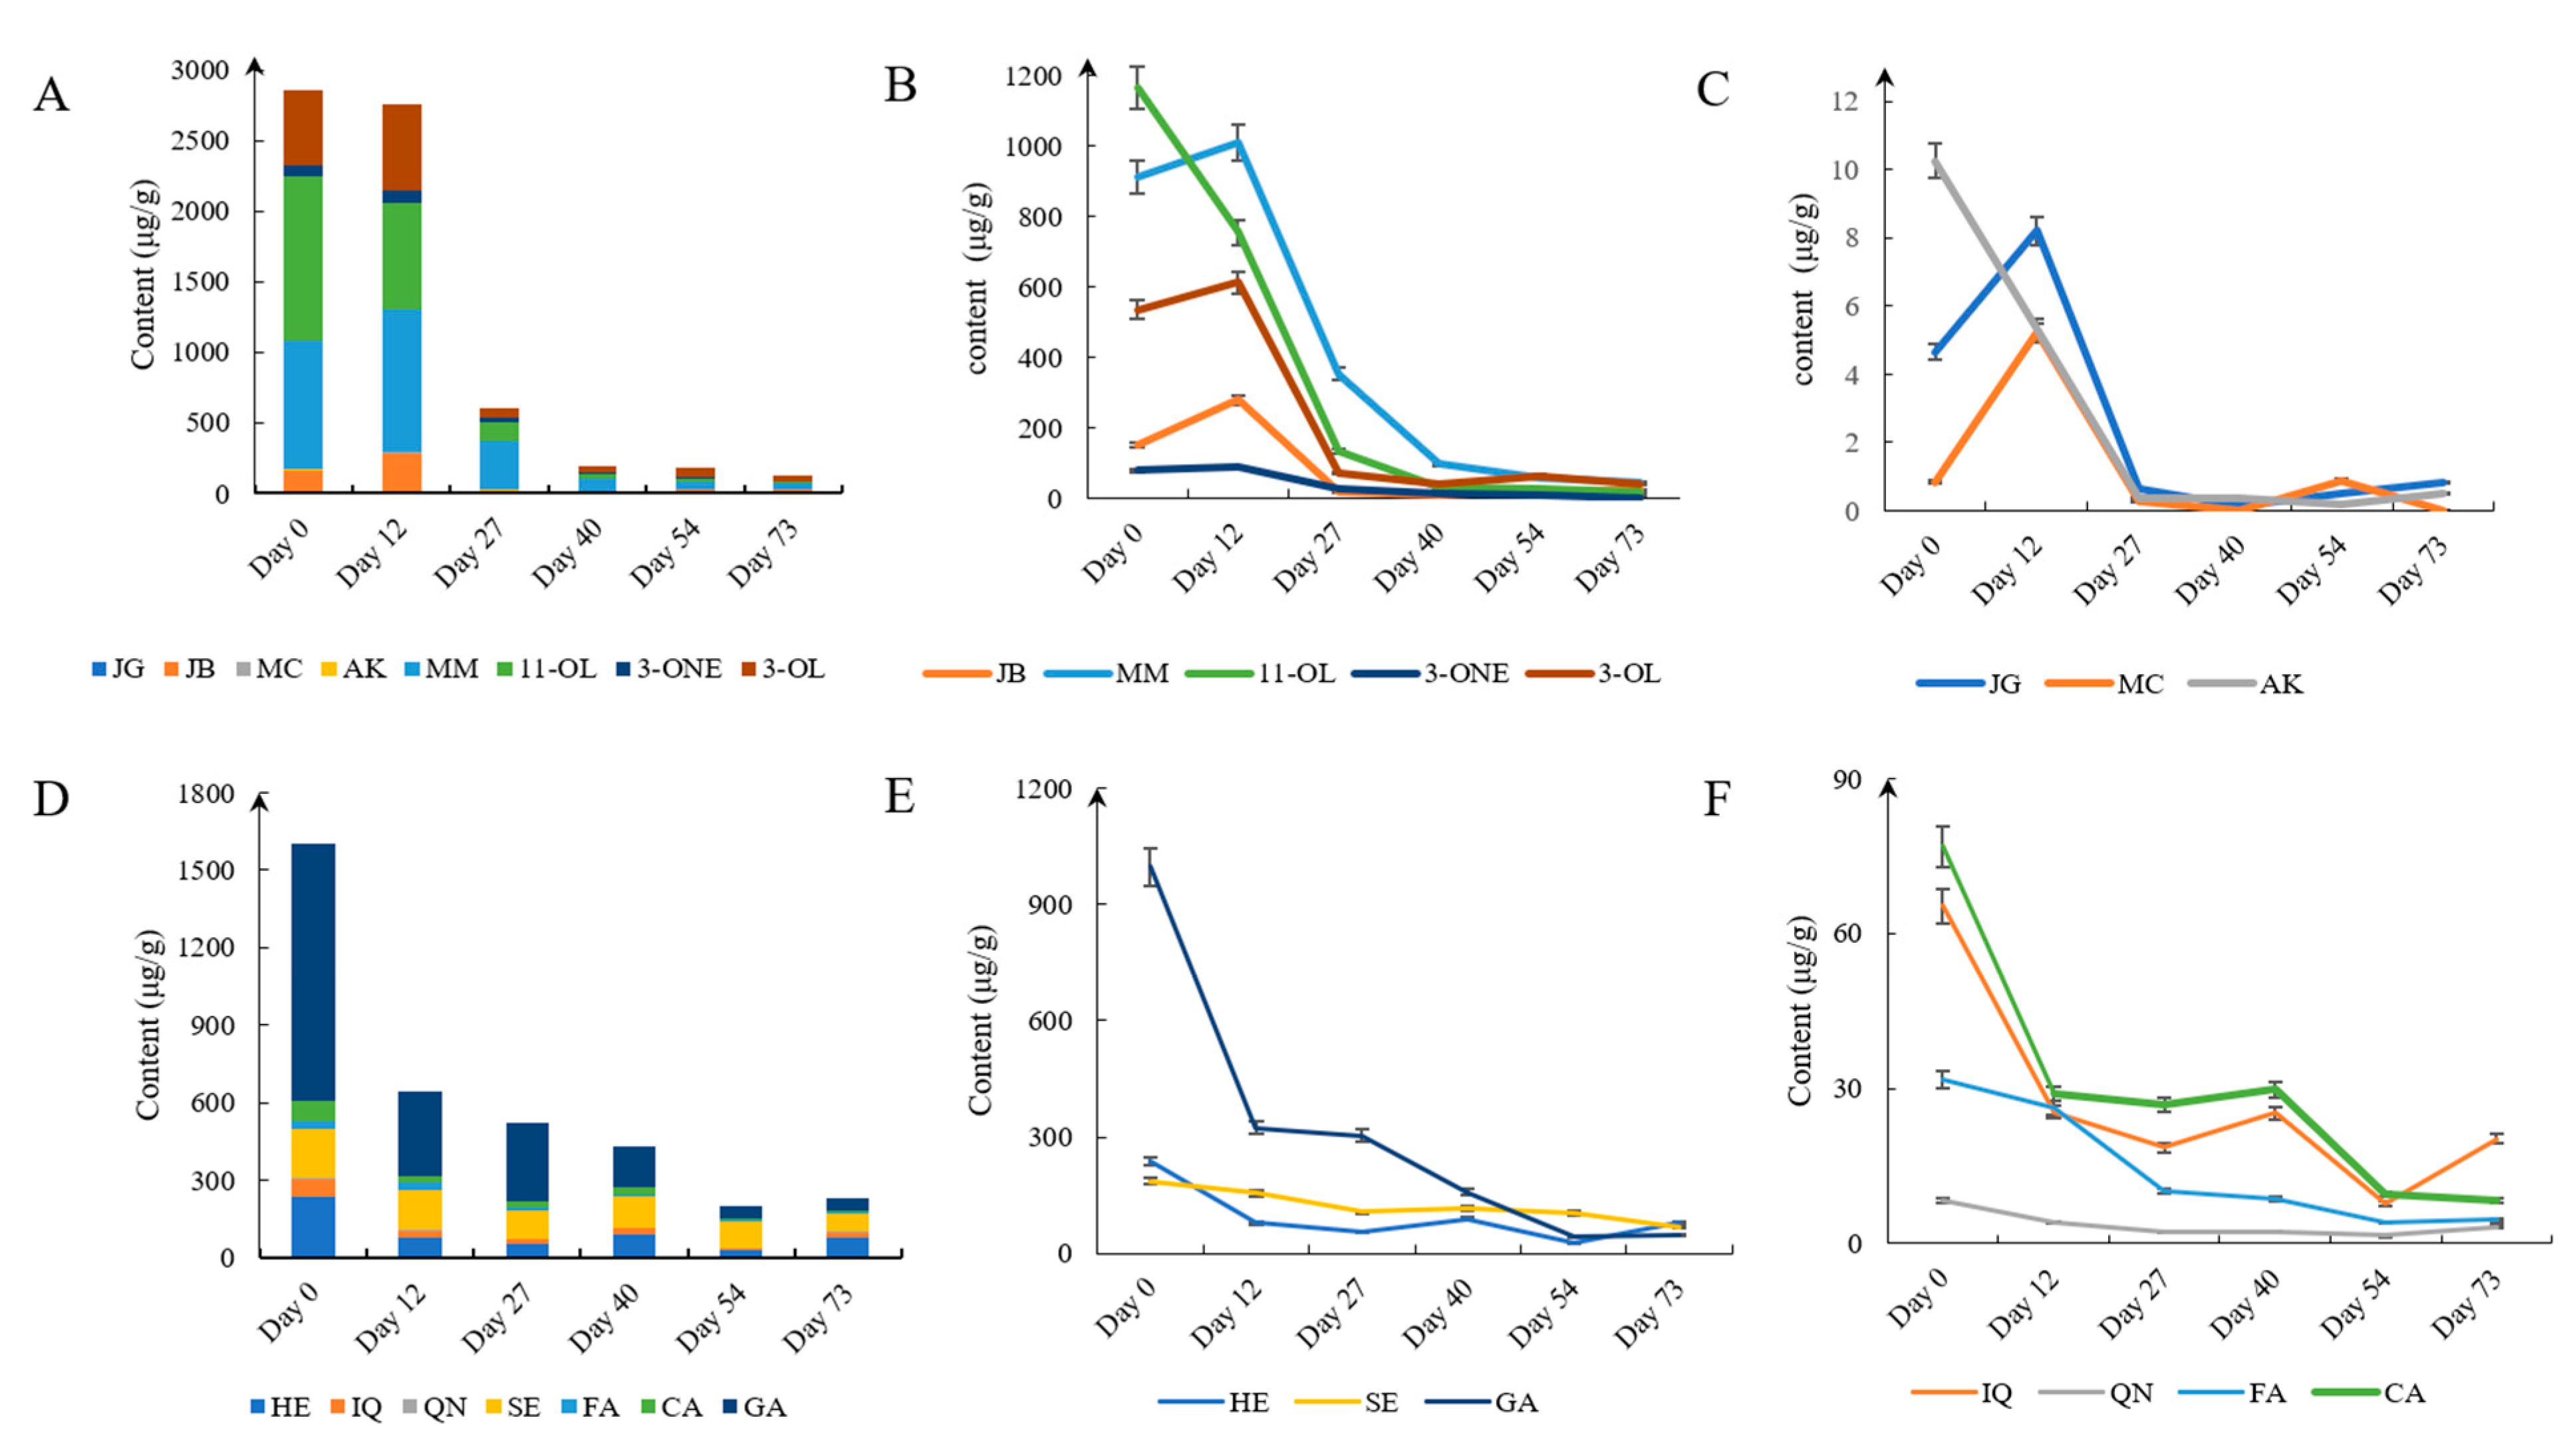
The detailed contents of the 15 compounds in J. mandshurica epicarps are listed in Supplementary Tables S1 and S2. By comparing the content of diarylheptanoids in the epicarps collected from June to August (Figure 3A), we found that with the increase in growth duration, the total content of diarylheptanoids in the epicarps gradually decreased. We also found that the total content of diarylheptanoids in the epicarps of J. mandshurica in June (2.86 ± 0.007 mg/g on Day 0 and 2.761 ± 0 mg/g on Day 12, Table S1) was remarkably higher than in July and August. Furthermore, MM, 11-OL, and 3-OL were the main compounds in epicarps. According to the line graphs of the content of each compound in Figure 3B,C, on Day 12, we found that except for 11-OL and AK, the contents of the other diarylheptanoid compounds increased slightly, and the contents of all compounds dropped sharply by 15 July (Day 27) and levels were stable in August. Most of the time, the MM content was the highest (from 0.043 ± 0 to 1.011 ± 0.001 mg/g, Table S1), except for Day 0, when the content of 11-OL was the highest (1.165 ± 0.001 mg/g, Table S1), possibly due to conversion of 11-OL to MM.
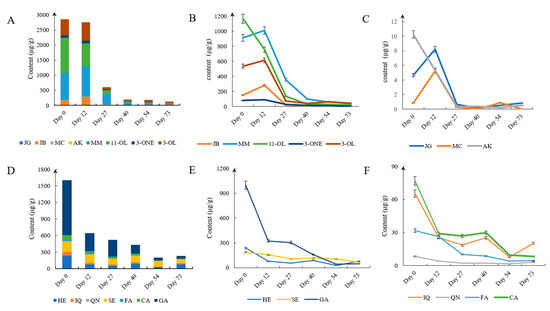
Figure 3.
Quantitative results of the 15 reference substances in the epicarps of J. mandshurica from 18 June to 30 August (Day 0 to Day 73). (A) Stacking histogram and (B,C) line graph of the 8 diarylheptanoids; (D) stacking histogram and (E,F) line graph of the 7 phenolic compounds (n = 3).
Similarly, Figure 3D shows that the total content of phenolic compounds in the epicarps gradually decreased over time and increased slightly at the end of August (Day 73). Except for compounds SE and CA, all other compounds were the lowest on Day 54, and their levels increased to a certain extent by Day 73 (Figure 3E,F). Among these compounds, GA was the main constituent and had the highest content in J. mandshurica epicarps (from 0.044 ± 0 to 0.997 ± 0 mg/g, Table S2). In addition, the content of these phenolic compounds was relatively stable from Day 12 to Day 40.
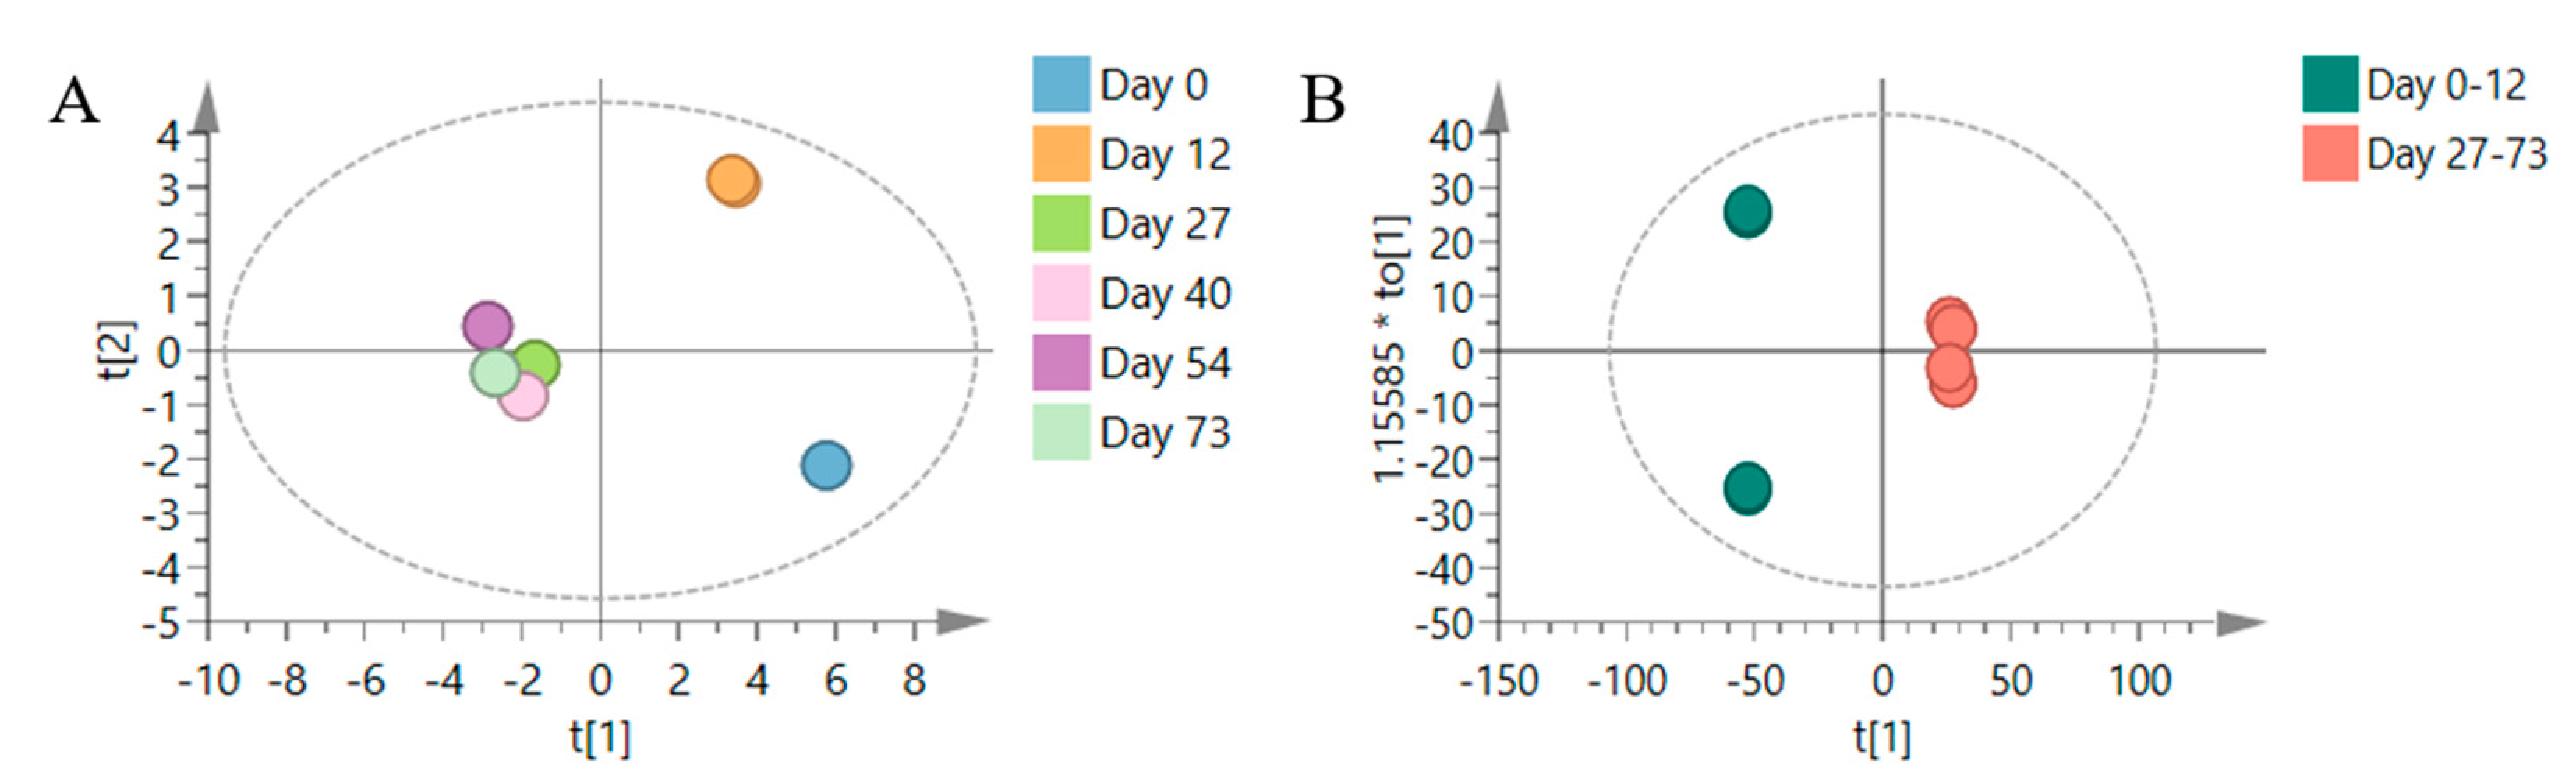
To further explore the relationship between the contents of the studied compounds in J. mandshurica epicarps and various growth periods, PCA was conducted and the OPLS-DA models of the 15 compounds were constructed (Figure 4). In a PCA score plot, the closer the samples, the more similar they are in terms of their contents of the studied compounds [33]. On the contrary, a sample distant from others indicates it has a significantly different profile of compound contents. The R2X and Q2 of the PCA models were 0.996 and 0.985, respectively, indicating the model fit the data well. In Figure 4A, samples from Day 0 and Day 12 are notably separated from others, which indicates that the epicarps from June were remarkably different from those of July and August. Additionally, OPLS-DA (Figure 4B) was performed to explore the difference between the epicarps in the different growth periods based on hierarchical clustering analysis (HCA) (Figure S1). R2X, R2Y, and Q2 were 0.994, 1, and 1 for the OPLS-DA model, respectively, which revealed that the model was well-matched. In the OPLS-DA model, the latter four growth periods (Day 27–73) were significantly separated from the first two growth periods (Day 0–12) with respect to the x-axis. The scatter plot (S plot) and variable importance plot (VIP) from the OPLS-DA model was used to identify the most relevant variables that were distinguished among the first two growth periods and the latter four growth periods. The S plot is a graphical description of the covariance and the correlation structure between the x-loading variables and the predictive score. Therefore, variables situated in the upper-right and lower-left of the S plot (VIP > 1) are potential markers with both high model influence and high reliability [34]. By filtering the compounds with VIP > 1.0, we found that 11-OL, MM, 3-OL, and GA contributed more to distinguishing the different growth periods (Supplementary Figure S2A,B). These compounds are good candidates for further exploring how their profiling can be used to identify growth stages J. mandshurica epicarps.
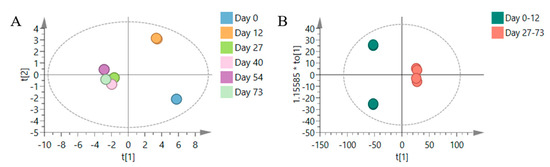
Figure 4.
Statistical analysis of the contents of the 15 reference compounds in J. mandshurica epicarps corresponding to six growth periods: (A) score plot from the PCA model of six growth periods and (B) OPLS-DA model of Day 0–12 vs. Day 27–73 with Hotelling’s 95% confidence ellipse.
From the above results, we conclude that the overall trend in the total content of diarylheptanoids and phenolic compounds indicates their content was higher before Day 27 and Day 40, respectively. However, the walnut fruits only start to form in June, so their total amount was insufficient [35]. As such, we preliminarily determined that the harvesting time of epicarps in Harbin is between Day 12 and Day 27. This study of diarylheptanoids and phenolic compounds lays a basic foundation for the establishment of a reasonable period for harvesting J. mandshurica epicarps.
3.3. Quantification of the 15 Compounds in the Different Parts of J. mandshurica
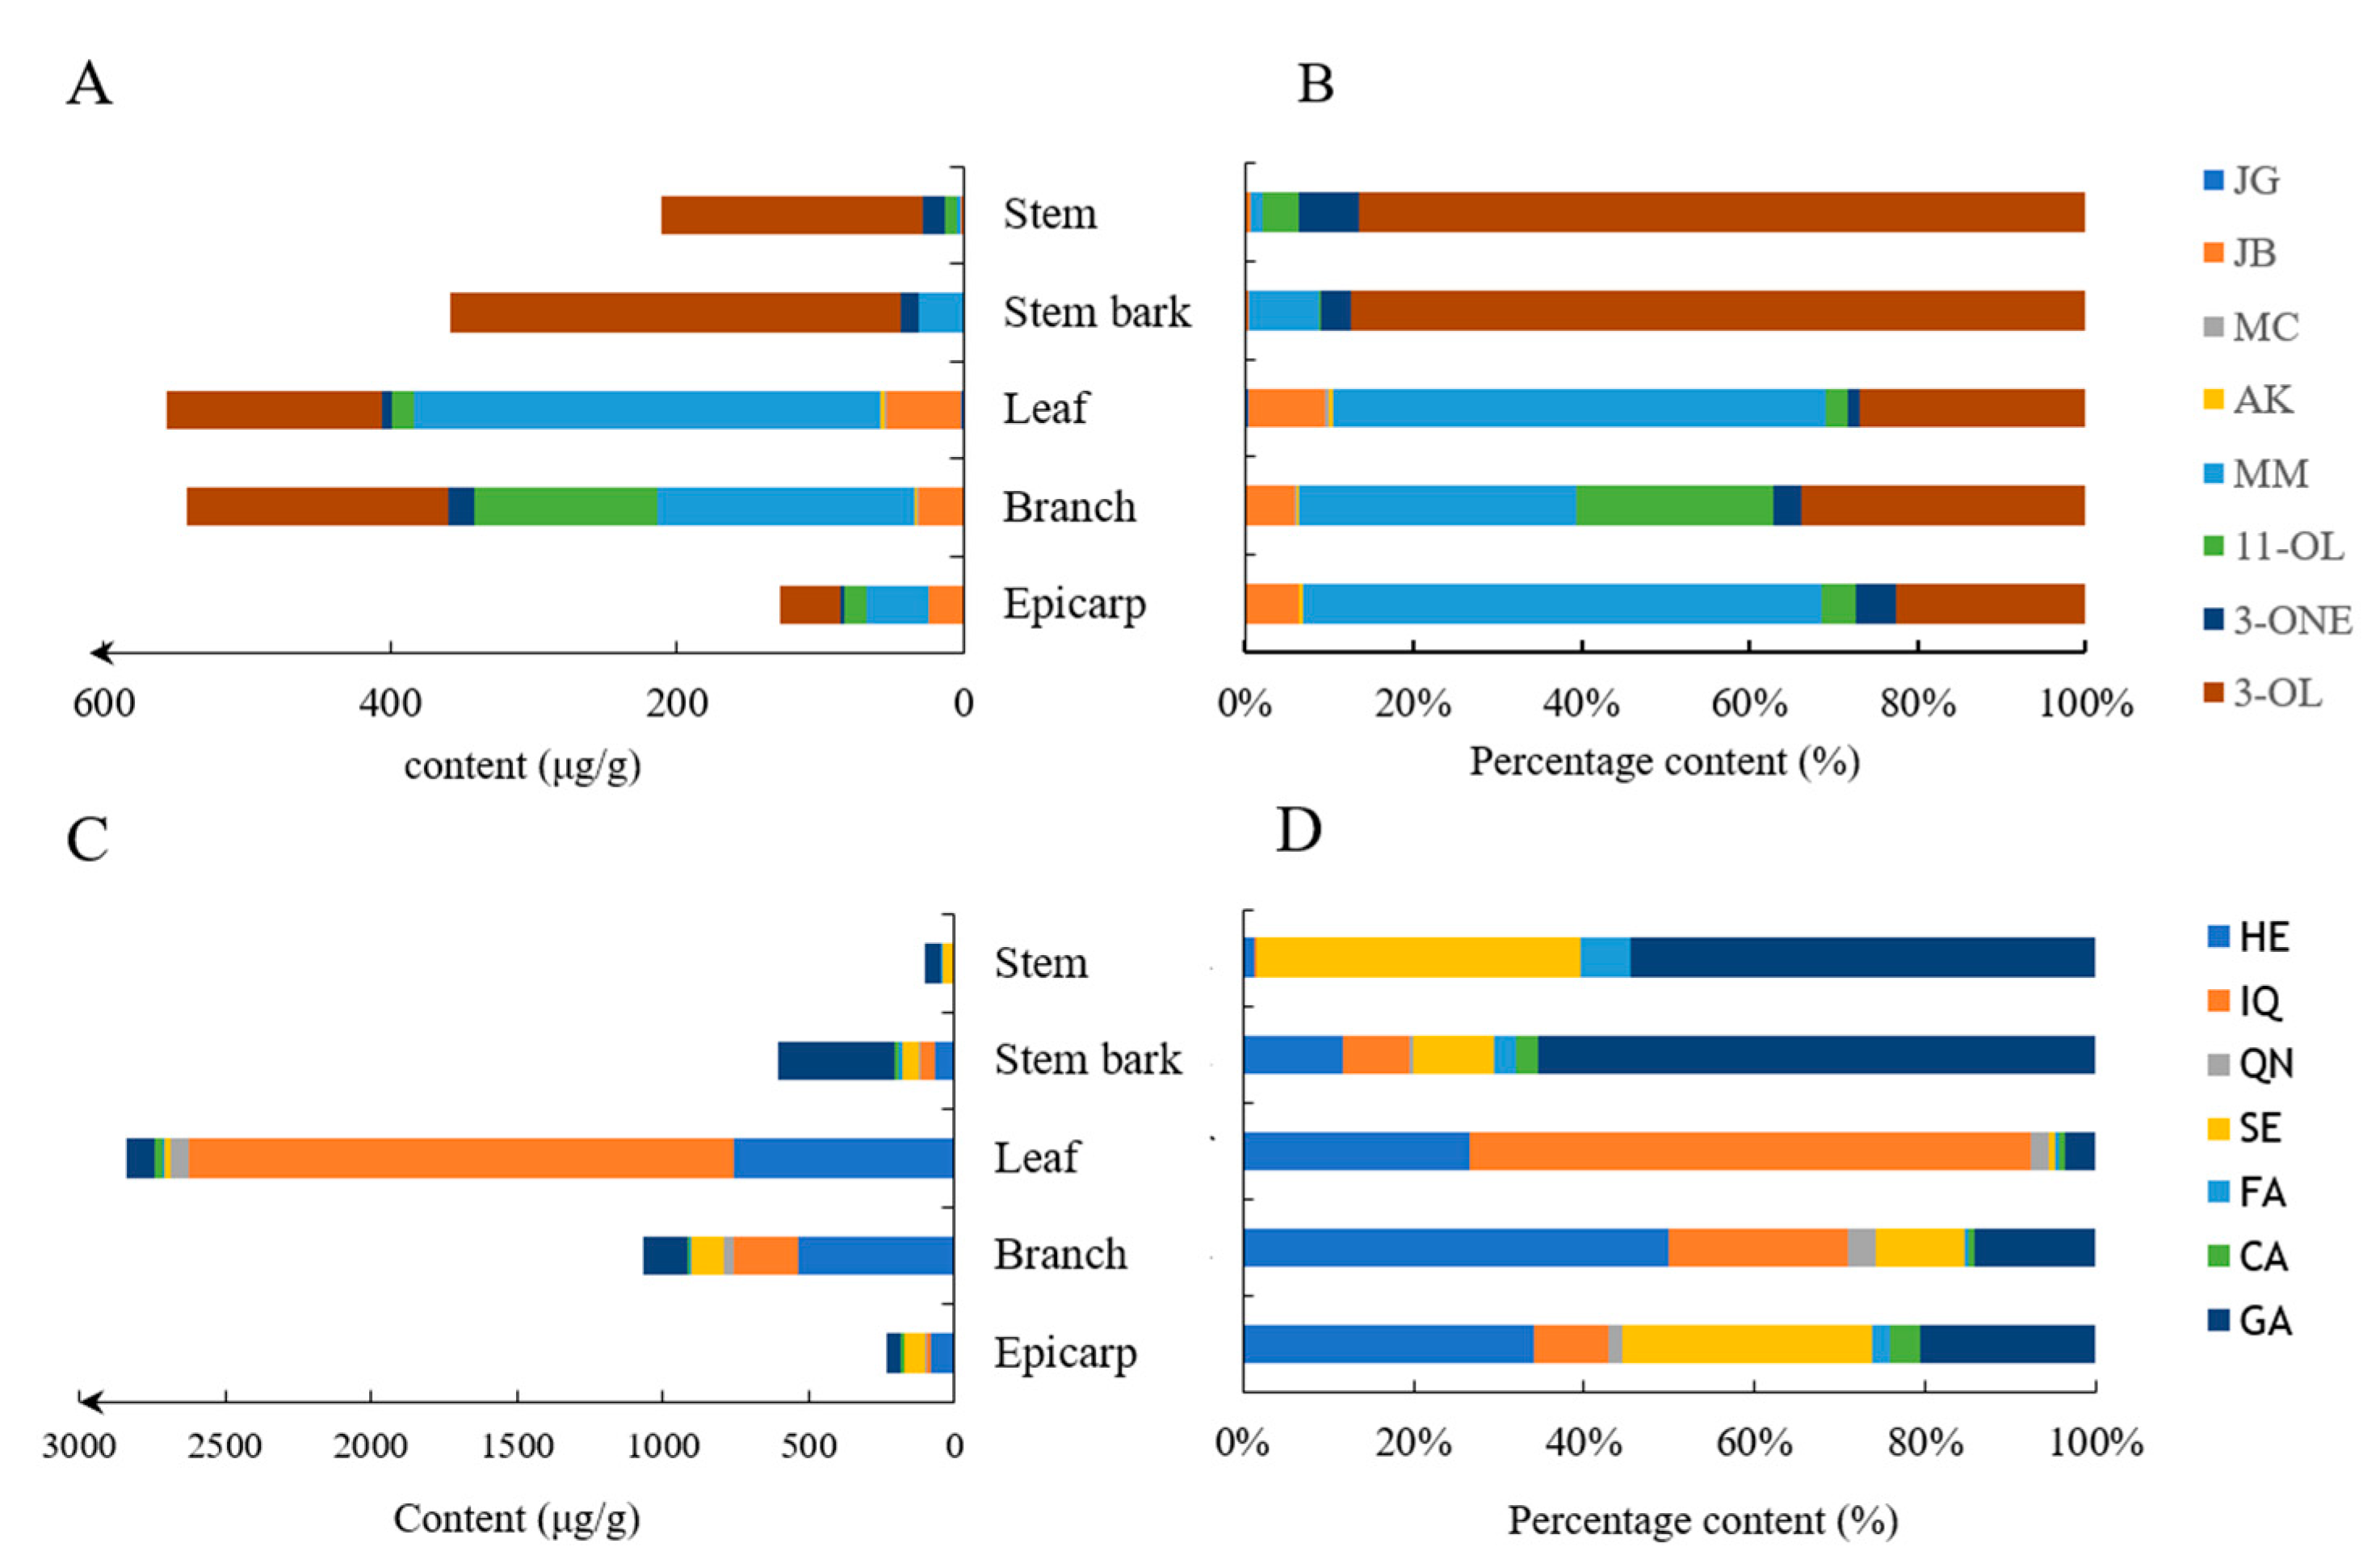
The detailed contents of the 15 compounds in the five plant parts of J. mandshurica are shown in Supplementary Tables S1 and S2. Comparing the total contents of diarylheptanoids in the five parts (epicarps, branches, leaves, stem barks, and stems) of J. mandshurica (Figure 5A), we determined that the total content in leaves was the highest (0.557 ± 0.006 mg/g, Table S1). The trend from high to low content was leaves, branches, stem bark, stems, and epicarps. Unfortunately, JG, JB, MC, and AK, which are all diphenyl diarylheptanoids, were not detected in the stem bark or stems of J. mandshurica, whereas 3-OL, which is a chain diarylheptanoid, was highest in stem bark (0.314 ± 0.002 mg/g, Table S1) and stems (0.183 mg/g, Table S1). In addition, JG and MC were not detected in the branches or epicarps of J. mandshurica, respectively, but MM, which is a diphenyl ether diarylheptanoid, was highest in the epicarps (0.043 ± 0 mg/g, Table S1) and leaves (0.326 ± 0.003 mg/g, Table S1). Furthermore, as the compound percentage diagram in Figure 5B shows, the percentage compositions of epicarps and leaves were similar, and MM and 3-OL accounted for a higher proportion in the leaves, epicarps, and branches.

Figure 5.
Quantitative results of the 15 reference substances in the different parts of J. mandshurica: (A) stacking histogram and (B) percentage stacked histogram of the 8 diarylheptanoids; (C) stacking histogram and (D) percentage stacked histogram of the 7 phenolic compounds.
Comparison of the total content of phenolic compounds (Figure 5C), the highest content was found in the leaves (2.842 ± 0.007 mg/g, Table S2), followed by branches, stem bark, epicarps, and stems. IQ, QN, and CA were not detected in the stems. However, IQ (1.868 ± 0.005 mg/g) and HE (0.758 ± 0.007 mg/g) were highest in the leaves and GA was highest in the stem bark (0.396 ± 0 mg/g). In terms of percentage content (Figure 5D), GA accounted for a higher proportion in the stems and stem bark, IQ in the leaves, and HE in the branches and epicarps.
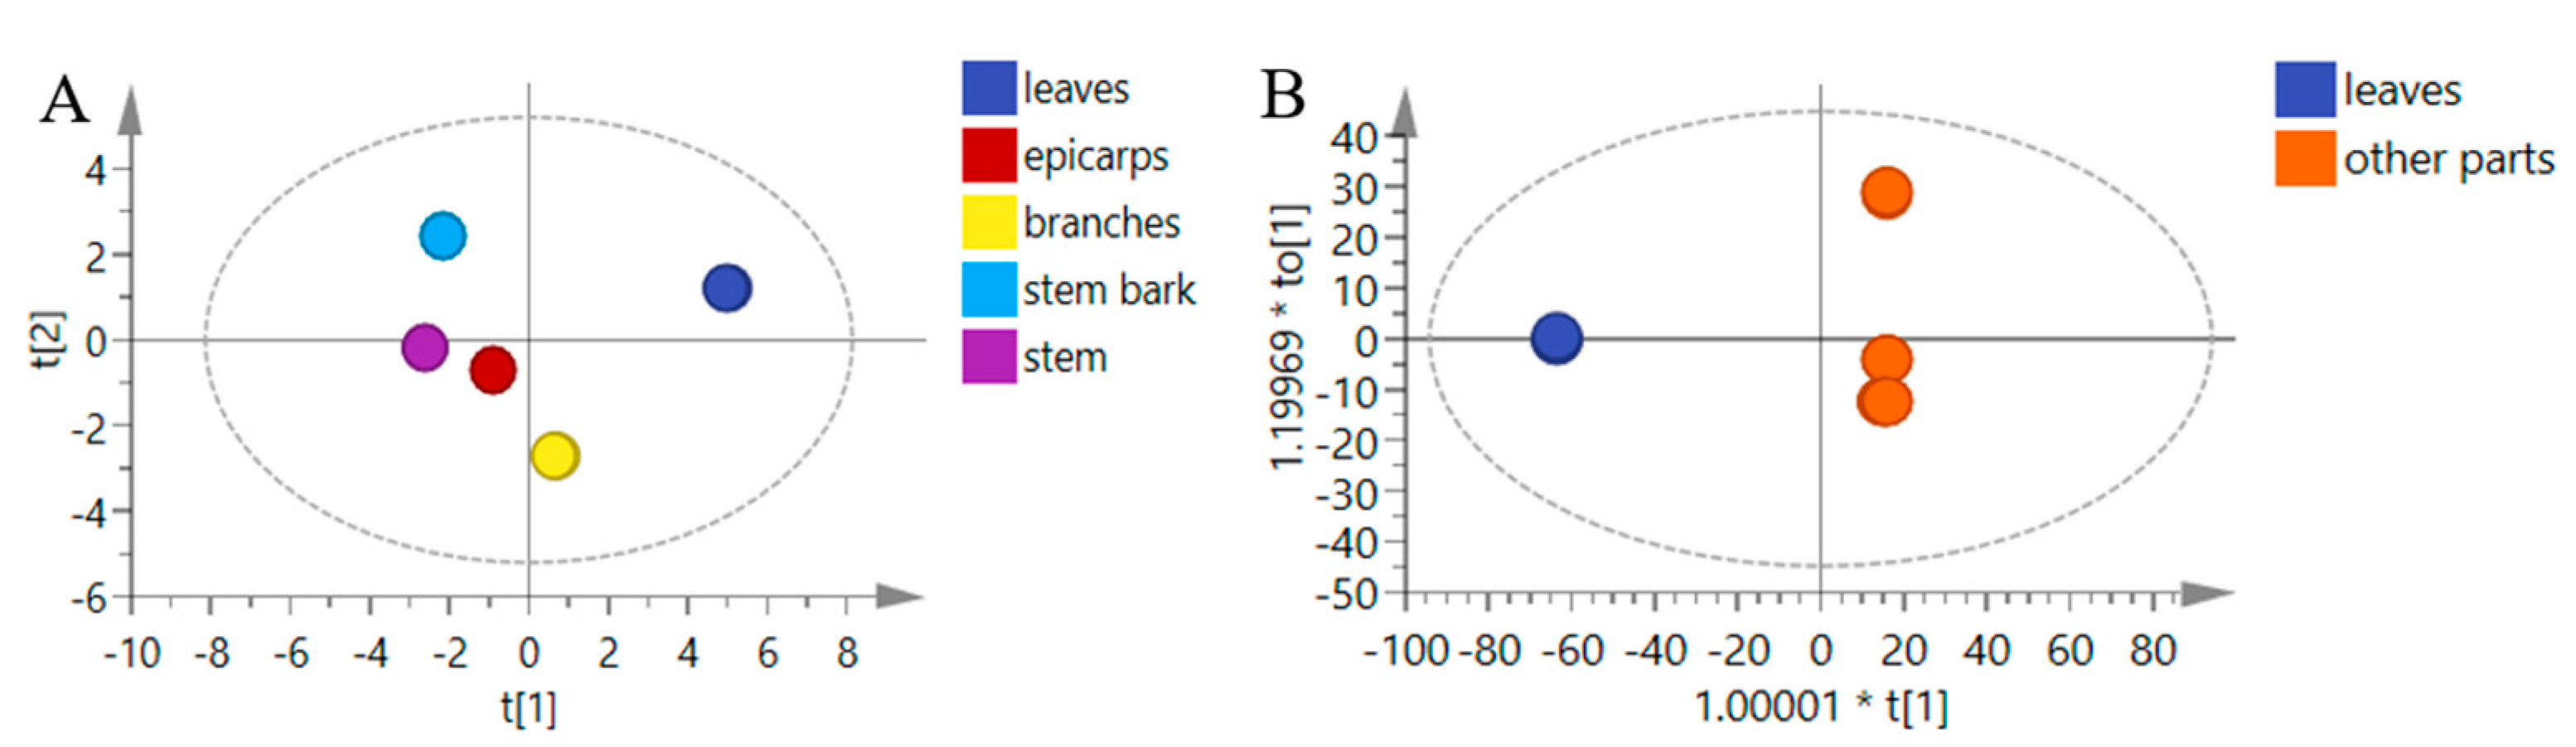
To further explore the similarities and differences in compound profiles of the five parts of J. mandshurica, PCA and OPLS-DA models were built (Figure 6). In the score plot of the PCA model (R2X and Q2 were 1 and 0.999, respectively; Figure 6A), epicarps, branches, stem bark, and stems grouped into one category, with leaves being far from the other parts based on HCA (Figure S3). The score plot of the OPLS-DA models (R2X, R2Y, and Q2 were 0.853, 1, and 0.999, respectively; Figure 6B) shows a good separation between the leaves and other parts, which suggests the content in the leaves is different from the others. According to the S plot and filtering the compounds with VIP > 1, IQ, HE, and MM were the main contribution to the differences between the leaves and other parts of J. mandshurica.
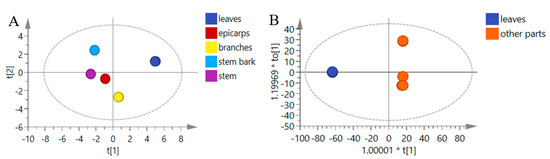
Figure 6.
Statistical analysis of the contents of the 15 reference substances in the different parts of J. mandshurica: (A) score plot from the PCA model of the 5 plant parts and (B) OPLS-DA model of leaves vs. other parts with Hotelling’s 95% confidence ellipse.
As such, we found that the contents of both diarylheptanoids and phenolic compounds are higher in leaves. As a renewable resource, leaves have considerable potential for utilization due to their variety of chemical components and biological activities [7]. Hence, the leaves of J. mandshurica should be further explored to determine their therapeutic potential and application in medicine.
3.4. Quantification of the 15 Compounds in the Epicarps of Different Local Varieties of J. mandshurica and J. regia
To investigate the contents and composition of the 15 studied compounds in the epicarps of J. mandshurica (JMM) and J. regia (JRL), which belong to the same genus Juglans and have similar properties [25], we collected the samples of HLJ-1 and JiLin-1~3, belonging to J. mandshurica, and selected seven cultivars of J. regia, common walnuts widely cultivated in Xinjiang, including Luguo1hao, Zhipihetao, Xinzaofeng, Zha343, Xinjufeng, Lipin1ha, and Xilin3hao. All the samples were collected before the fruits had ripened and fallen.
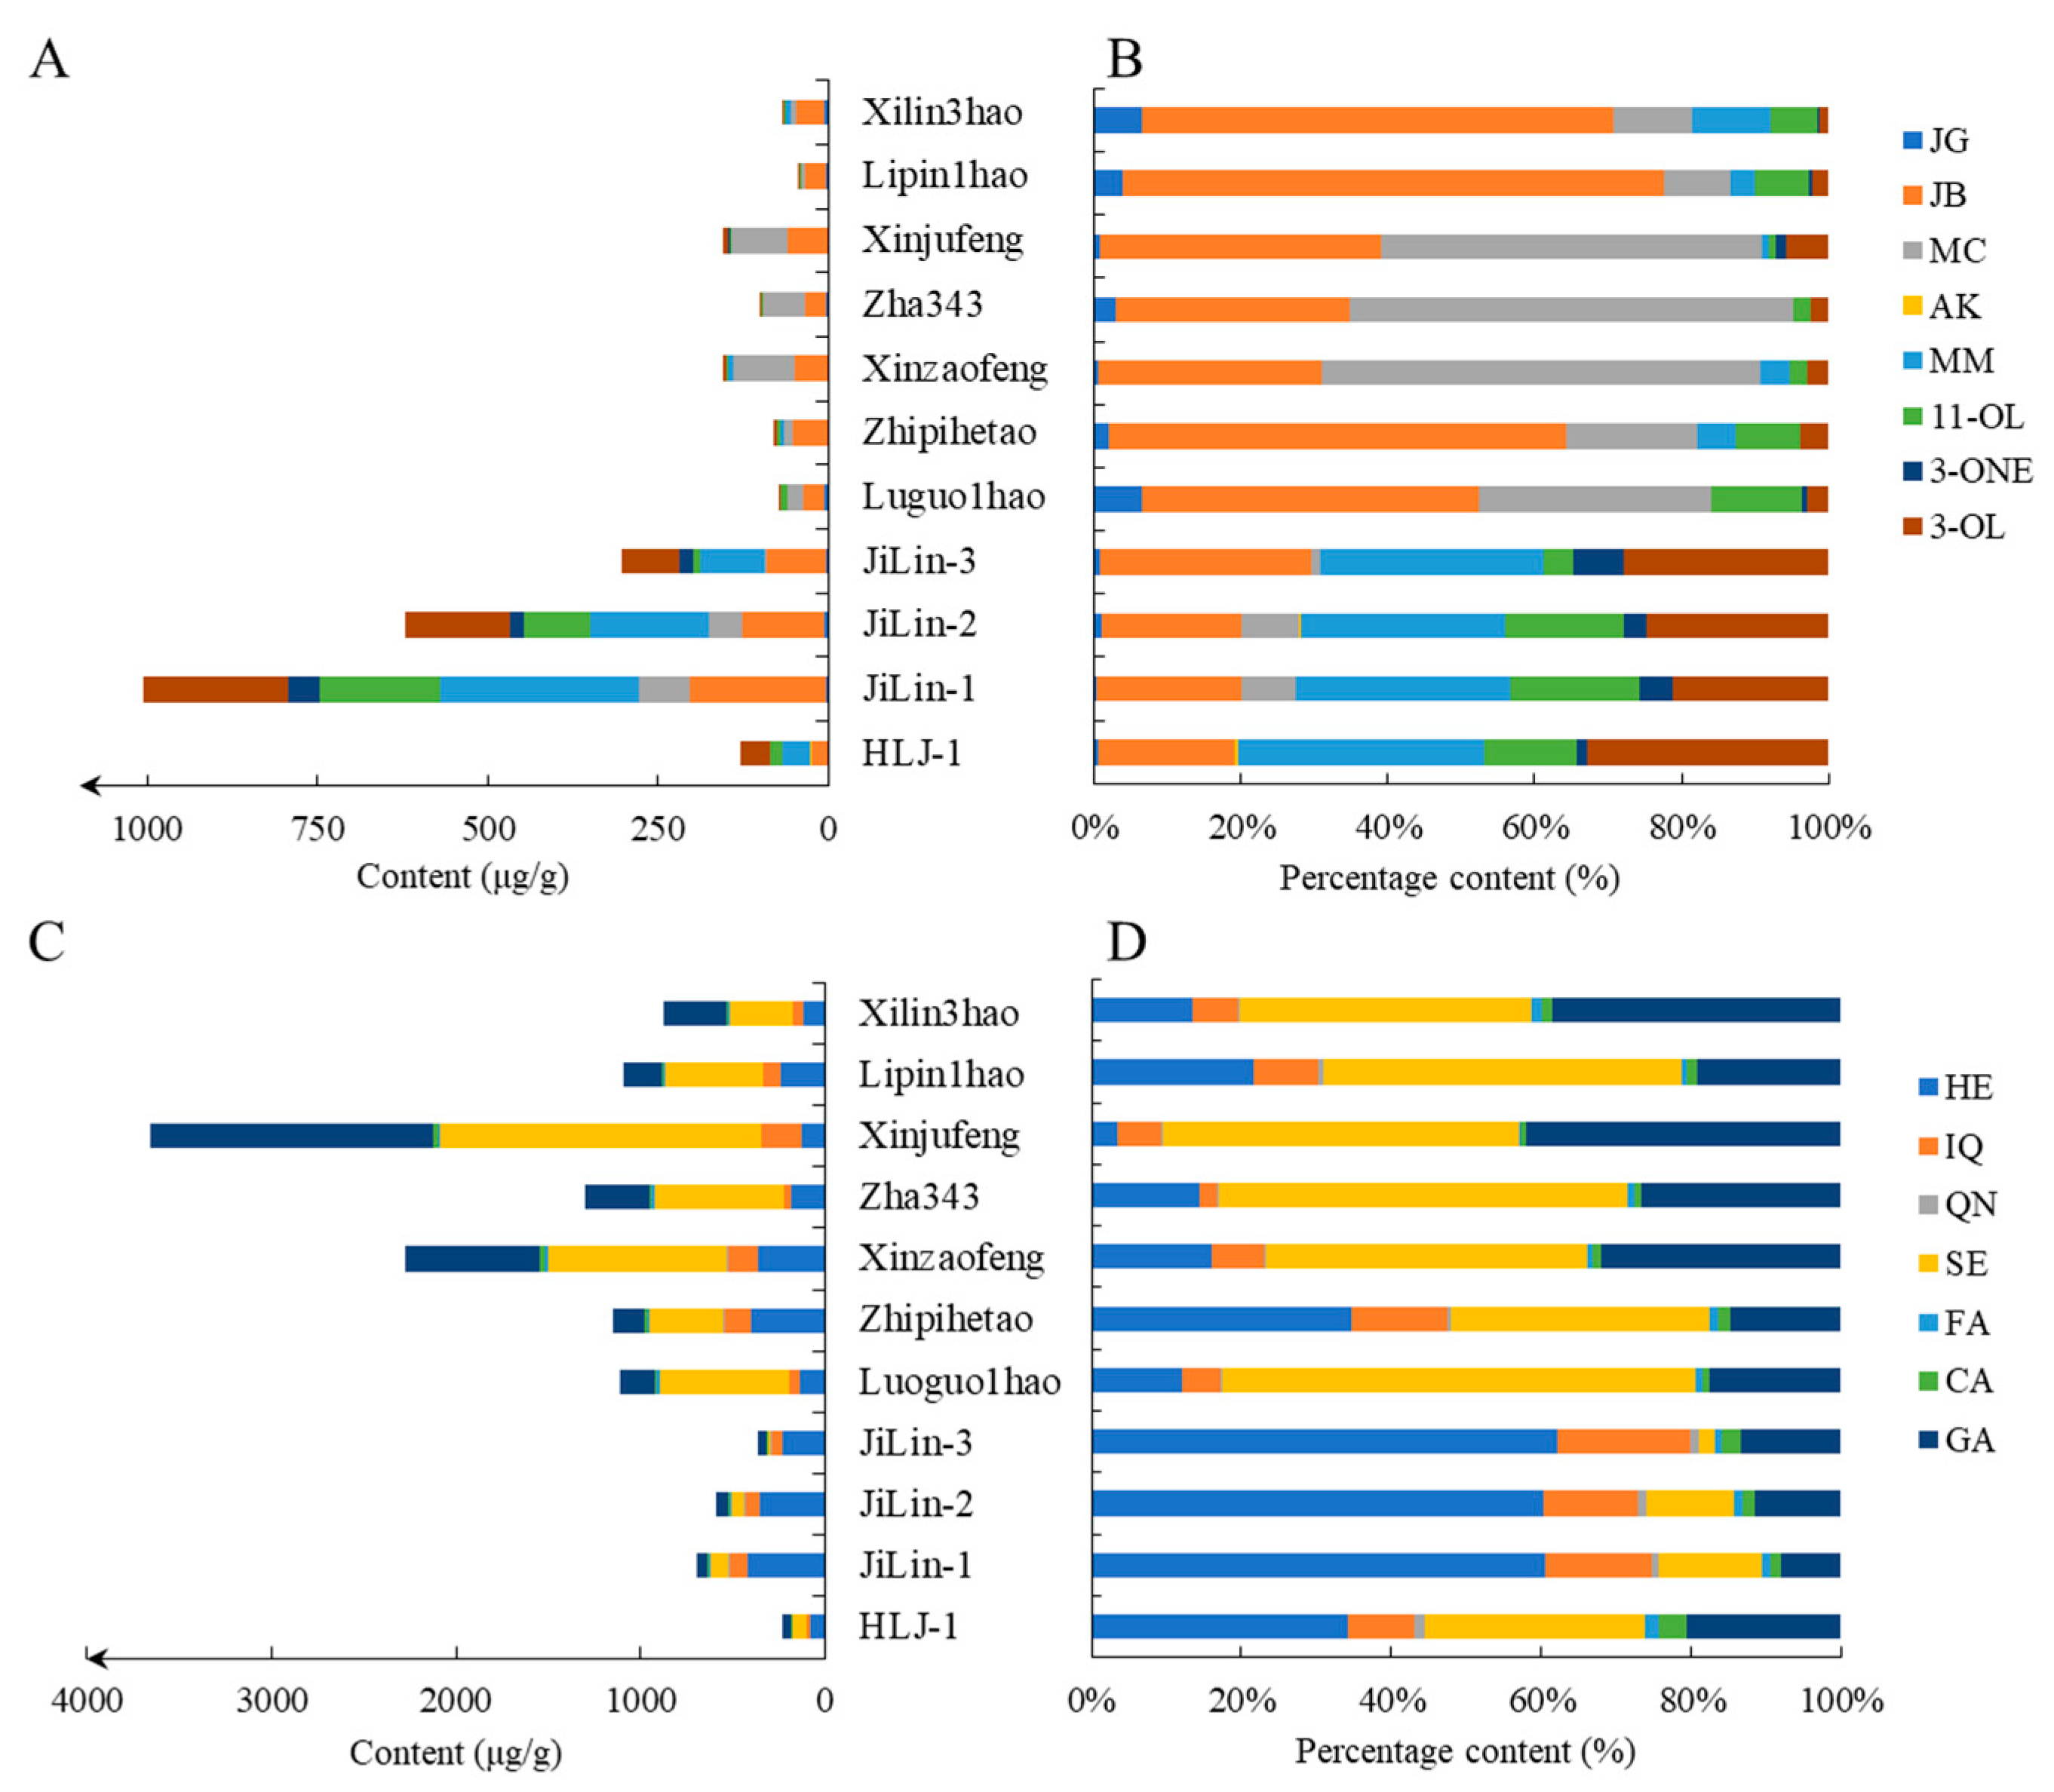
The detailed contents of the 15 compounds in the epicarps of J. mandshurica and J. regia are provided in Supplementary Tables S1 and S2. Figure 7A shows that the total content of diarylheptanoids of JiLin-1 (1.005 ± 0.002 mg/g, Table S1) was the highest, followed closely by JiLin-2 (0.632 ± 0.004 mg/g) and JiLin-3 (0.304 ± 0 mg/g). However, despite being the same species, their total content of HLJ-1 (0.129 ± 0 mg/g) was much lower. We did not detect the presence of AK in any of the seven cultivars of J. regia and 3-ONE was not detected in six cultivars of J. regia, only in Xinjufeng. Interestingly, in terms of compound composition (Figure 7B), the HLJ-1 in J. mandshurica was similar to the samples of JiLin-1~3. Particularly, JB, MM, and 3-OL were the main components in the epicarps of J. mandshurica, whereas in the epicarps of J. regia, the main components were JB and MC.

Figure 7.
Quantitative results of the 15 reference substances in the epicarps of different local varieties of J. mandshurica and J. regia: (A) stacking histogram and (B) percentage stacked histogram of the 8 diarylheptanoids; (C) stacking histogram and (D) percentage stacked histogram of the 7 phenols.
Figure 7C shows that the total content of phenolic compounds in the epicarps of the different local varieties of J. regia was generally higher than that of J. mandshurica; Xinjufeng had the highest content of phenolic compounds (3.662 ± 0.006 mg/g, Table S2). In the compound percentage graph (Figure 7D), SE and GA are shown as the main constituents in the epicarps of J. regia, except for Zhipihetao, whereas HE and IQ accounted for a higher proportion in the epicarps of JiLin 1–3. HE, SE, and GA were the main contributing compounds in HLJ-1 and Zhipihetao.
To determine the similarities and differences of the compounds in the epicarps of the different varieties, PCA and OPLS-DA models (Figure 8A,B) were built. The R2X and Q2 of the PCA model of the two species were 0.991 and 0.910, respectively, and R2X, R2Y, and Q2 were 0.891, 0.987, and 0.980, respectively, for J. mandshurica vs. J. regia, which showed that the models fit the data well. Based on HCA (Figure S5), the Euclidean distance and Ward clustering algorithm were selected; the score plot of the PCA model of the two Juglans species revealed four groups (Figure 8A). JL-1 and JL-2 (green plots) were separated into group 1; Xinzaofeng and Xinjufeng were in group 2 (blue plots); HLJ-1 and JL-3 constituted group 3 (red plots); and Zhipihetao, Lipin1hao, Zha343, Lugo1hao, and Xilin3hao were designated as group 4 (yellow plots). To further explore the differences between J. mandshurica and J. regia, a score plot of the OPLS-DA model was constructed (Figure 8B). We found that the samples of J. mandshurica and J. regia had good separation with respect to the x-axis, which indicated remarkable differences in JMM and JRL. With the combined S plot and VIP (Table S6), by filtering the compounds with VIP > 1, we discovered that SE, GA, MM, and 3-OL were the major contributions to the variance between the two species.
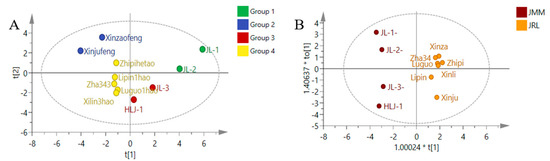
Figure 8.
Statistical analysis of the contents of the 15 compounds in different varieties of J. mandshurica and J. regia: (A) score plot from the PCA model of the two species and (B) OPLS-DA model of J. mandshurica (JMM) vs. J. regia (JRL) with Hotelling’s 95% confidence ellipse.
In the above results, we observed a significant difference in the contents and the compositions of the 15 compounds between J. mandshurica and J. regia. Notably, the total content of diarylheptanoids was much higher in J. mandshurica, whereas phenolic compounds content was higher in J. regia.
4. Conclusions
In this study, we successfully developed a highly efficient and reliable UPLC–TQ-MS method based on chemical profiling to facilitate simultaneous determination of eight diarylheptanoids and seven phenolic compounds within 8 min in five plant parts of J. mandshurica and the epicarps of J. regia. By the analysis of the contents of the 15 compounds in the epicarps of J. mandshurica for different growth periods, we found that the total content of diarylheptanoids and phenolic compounds is the most abundant in June, gradually decreases in July, and then levels off in August; the most suitable harvest time for epicarps in Harbin ranges from Day 12 to Day 27. In addition, leaves are a valuable part, having a variety of chemical constituents and bioactivities that should be studied further. To the best of our knowledge, the differences in the diarylheptanoids and phenolic compounds between different Juglans species have not been previously investigated. The results showed that the profiles of compound contents in the epicarps of J. mandshurica are different from those of J. regia. This paper provides a practical and simple quantitative method and references for further research on the intrinsic qualities of J. mandshurica.
Supplementary Materials
The following are available online at https://www.mdpi.com/article/10.3390/separations8090132/s1. Table S1: Contents (µg/g) of eight diarylheptanoid compounds from different growth periods, medicinal parts, and plant varieties. Table S2: Contents (µg/g) of seven phenolic compounds from different growth periods, medicinal parts, and plant varieties. Figure S1. HCA from PCA model of J. mandshurica epicarps in different growth periods. Figure S2: Statistical analysis of the contents of the 15 compounds in J. mandshurica epicarps corresponding to six growth periods: (A) S-plot from OPLS-DA model of 18–30 June vs. 15 July–30 August and (B) variable importance plot (VIP) with 95% jack-knifed confidence intervals. Figure S3. HCA from PCA model of J. mandshurica in five plant parts. Figure S4. Statistical analysis of the contents of the 15 compounds in different plant parts of J. mandshurica: (A) S-plot from OPLS-DA model of leaves vs. other parts and (B) variable importance plot (VIP) with 95% jack-knifed confidence intervals. Figure S5. HCA from PCA model of different local varieties of J. mandshurica and J. regia. Figure S6. Statistical analysis of the contents of the 15 compounds in different local varieties of J. mandshurica and J. regia: (A) S-plot from OPLS-DA model of J. mandshurica vs. J. regia epicarps and (B) variable importance plot (VIP) with 95% jack-knifed confidence intervals. Table S3: Optimized parameters for multiple reaction monitoring (MRM) of the 15 reference substances by UPLC–TQ-MS in negative ion mode.
Author Contributions
Conceptualization, H.Y., J.H. and L.Y.; methodology, H.Y., L.-B.W., Y.-P.G. and L.Y.; software, H.Y., L.-B.W. and L.Y.; validation, J.H., L.Y. and K.Z.; formal analysis, H.Y., L.-B.W. and Y.-L.W.; investigation, H.Y., Y.-L.W. and X.-X.C.; resources, J.H., L.Y. and J.-H.W.; data curation, H.Y., L.-B.W. and Y.-P.G.; writing—original draft preparation, H.Y., L.-B.W. and J.H.; writing—review and editing, H.Y., Y.-P.G. and L.Y.; visualization, H.Y. and J.-H.W.; supervision, J.H. and L.Y.; project administration, J.-H.W.; funding acquisition, J.H. All authors have read and agreed to the published version of the manuscript.
Funding
This research was funded by the National Science and Technology Major Project of the Ministry of Science and Technology of China, grant number 2018ZX09735005; The Outstanding Young Talents Funding of the Pharmacy College Harbin Medical University, grant number 2019-JQ-04; and the Heilongjiang Postdoctoral Foundation, grant number LBH-Z18105.
Data Availability Statement
Not applicable.
Acknowledgments
Not applicable.
Conflicts of Interest
The authors declare no conflict of interest. The funders had no role in the design of the study; in the collection, analyses, or interpretation of data; in the writing of the manuscript; or in the decision to publish the results.
References
- Kuang, K.R.; Li, P.Q. Flora of China; Scientific Publisher: Beijing, China, 1979. [Google Scholar]
- Lee, S.W.; Lee, K.S.; Son, J.K. New naphthalenyl glycosides from the roots of Juglans mandshurica. Planta Med. 2000, 66, 184–186. [Google Scholar] [CrossRef]
- Liu, L.; Li, W.; Koike, K.; Nikaido, T. Two New Naphthalenyl Glucosides and a New Phenylbutyric Acid Glucoside from the Fruit of Juglans mandshurica. Heterocycles 2004, 63, 1429–1436. [Google Scholar] [CrossRef]
- Diao, S.; Jin, M.; Sun, J.; Zhou, Y.; Ye, C.; Jin, Y.; Zhou, W.; Li, G. A new diarylheptanoid and a new diarylheptanoid glycoside isolated from the roots of Juglans mandshurica and their anti-inflammatory activities. Nat. Prod. Res. 2017, 33, 701–707. [Google Scholar] [CrossRef] [PubMed]
- Regueiro, J.; González, C.S.; Queralt, A.V.; Gándara, J.S.; Raventós, R.L.; Pulido, M.I. Comprehensive identification of walnut polyphenols by liquid chromatography coupled to linear ion trap-Orbitrap mass spectrometry. Food Chem. 2014, 152, 340–348. [Google Scholar] [CrossRef]
- Zhou, Y.Y.; Yang, B.; Liu, Z.; Jiang, Y.; Liu, Y.; Fu, L.; Wang, X.; Kuang, H. Cytotoxicity of Triterpenes from Green Walnut Husks of Juglans mandshurica Maxim in HepG-2 Cancer Cells. Molecules 2015, 20, 19252–19262. [Google Scholar] [CrossRef] [PubMed] [Green Version]
- Yao, D.L.; Zhang, C.H.; Luo, J.; Jin, M.; Zheng, M.S.; Cui, J.M.; Son, J.K.; Li, G. Chemical constituents from the leaves of Juglans mandshurica. Arch. Pharm. Res. 2015, 38, 480–484. [Google Scholar] [CrossRef] [PubMed]
- Zhou, Y.Y.; Yang, B.Y.; Jiang, Y.Q.; Liu, Z.X.; Liu, Y.X.; Wang, X.L.; Kuang, H.X. Studies on Cytotoxic Activity against HepG-2 Cells of Naphthoquinones from Green Walnut Husks of Juglans mandshurica Maxim. Molecules 2015, 20, 15572–15588. [Google Scholar] [CrossRef] [PubMed] [Green Version]
- Liu, L.; Li, W.; Sasaki, T.; Asada, Y.; Koike, K. Juglanone, a novel alpha-tetralonyl derivative with potent antioxidant activity from Juglans mandshurica. J. Nat. Med. 2010, 64, 496–499. [Google Scholar] [CrossRef] [PubMed]
- Pitschmann, A.; Zehl, M.; Atanasov, A.G.; Dirsch, V.M.; Heiss, E.; Glasl, S. Walnut leaf extract inhibits PTP1B and enhances glucose-uptake in vitro. J. Ethnopharmacol. 2014, 152, 599–602. [Google Scholar] [CrossRef]
- Yang, Q.; Yao, Q.S.; Kuang, Y.; Zhang, Y.Z.; Feng, L.L.; Zhang, L.; Guo, L.; Xie, Z.P.; Zhang, S.M. Antimicrobial and cytotoxic juglones from the immature exocarps of Juglans mandshurica. Nat. Prod. Res. 2019, 33, 3203–3209. [Google Scholar] [CrossRef]
- Li, J.; Wang, J.; Liu, C.; Fang, L.; Min, W. Protein Hydrolyzates from Changbai Mountain Walnut (Juglans mandshurica Maxim.) Boost Mouse Immune System and Exhibit Immunoregulatory Activities. Evid. Based Complementary Altern. Med. 2018, 2018, 4576561. [Google Scholar] [CrossRef]
- Liu, C.; Guo, Y.; Zhao, F.; Qin, H.; Lu, H.; Fang, L.; Wang, J.; Min, W. Potential mechanisms mediating the protective effects of a peptide from walnut (Juglans mandshurica Maxim.) against hydrogen peroxide induced neurotoxicity in PC12 cells. Food Funct. 2019, 10, 3491–3501. [Google Scholar] [CrossRef]
- Luan, F.; Wang, Z.; Yang, Y.; Ji, Y.; Lv, H.; Han, K.; Liu, D.; Shang, X.; He, X.; Zeng, N. Juglans mandshurica Maxim.: A Review of Its Traditional Usages, Phytochemical Constituents, and Pharmacological Properties. Front Pharmacol. 2020, 11, 569800. [Google Scholar] [CrossRef]
- Xu, H.L.; Yu, X.F.; Qu, S.C.; Zhang, R.; Qu, X.R.; Chen, Y.P.; Ma, X.Y.; Sui, D.Y. Anti-proliferative effect of Juglone from Juglans mandshurica Maxim on human leukemia cell HL-60 by inducing apoptosis through the mitochondria-dependent pathway. Eur. J. Pharmacol. 2010, 645, 14–22. [Google Scholar] [CrossRef]
- Park, S.; Kim, N.; Yoo, G.; Kim, S.N.; Kwon, H.J.; Jung, K.; Oh, D.C.; Lee, Y.H.; Kim, S.H. Phenolics and neolignans isolated from the fruits of Juglans mandshurica Maxim. and their effects on lipolysis in adipocytes. Phytochemistry 2017, 137, 87–93. [Google Scholar] [CrossRef]
- Chaudhary, N.; Sasaki, R.; Shuto, T.; Watanabe, M.; Kawahara, T.; Suico, M.; Yokoyama, T.; Mizuguchi, M.; Kai, H.; Devkota, H. Transthyretin Amyloid Fibril Disrupting Activities of Extracts and Fractions from Juglans mandshurica Maxim. var. cordiformis (Makino) Kitam. Molecules 2019, 24, 500. [Google Scholar] [CrossRef] [Green Version]
- Yang, H.; Gan, C.L.; Guo, Y.P.; Qu, L.Y.; Ma, S.; Ren, Y.B.; Wang, X.W.; Wang, L.B.; Huang, J.; Wang, J.H. Two novel compounds from green walnut husks (Juglans mandshurica Maxim.). Nat. Prod. Res. 2020, 1–9. [Google Scholar] [CrossRef]
- Yang, H.; Ma, Y.; Gao, C.; Wang, B.; Lin, C.; Feng, H.; Wang, L.; Huang, J.; Wang, J.H. Five novel diarylheptanoids from green walnut husks (Juglans regia L.). Fitoterapia 2019, 134, 221–225. [Google Scholar] [CrossRef]
- Akazawa, H.; Akihisa, T.; Taguchi, Y.; Banno, N.; Yoneima, R.; Yasukawa, K. Melanogenesis inhibitory and free radical scavenging activities of diarylheptanoids and other phenolic compounds from the bark of acer nikoense. Bio Pharm. Bull. 2006, 29, 1970–1972. [Google Scholar] [CrossRef] [Green Version]
- Lee, K.S.; Li, G.; Kim, S.H.; Lee, C.S.; Woo, M.H.; Lee, S.H.; Jhang, Y.D.; Son, J.K. Cytotoxic Diarylheptanoids from the Roots of Juglans mandshurica. J. Nat. Prod. 2002, 65, 1707–1708. [Google Scholar] [CrossRef]
- Morikawa, T.; Tao, J.; Ueda, K.; Matsuda, H.; Yoshikawa, M. Medicinal foodstuffs. XXXI. Structures of new aromatic constituents and inhibitors of degranulation in RBL-2H3 cells from a Japanese folk medicine, the stem bark of acer nikoense. Chem. Pharm. Bull. 2003, 51, 62–67. [Google Scholar] [CrossRef] [Green Version]
- Gawlik-Dziki, U.; Durak, A.; Pecio, L.; Kowalska, I. Nutraceutical potential of tinctures from fruits, green husks, and leaves of Juglans regia L. Sci. World J. 2014, 2014, 501392. [Google Scholar] [CrossRef] [Green Version]
- Tsasi, G.; Samara, P.; Tsitsilonis, O.; Jürgenliemk, G.; Skaltsa, H. Isolation, identification and cytotoxic activity of triterpenes and flavonoids from green walnut (Juglans regia L.) pericarps. Rec. Nat. Prod. 2015, 10, 83–92. [Google Scholar]
- Wang, T.M.; Liu, J.; Yi, T.; Zhai, Y.J.; Zhang, H.; Chen, H.B.; Cai, S.Q.; Kang, T.G.; Zhao, Z.Z. Multiconstituent identification in root, branch, and leaf extracts of Juglans mandshurica using ultra high-performance liquid chromatography with quadrupole time-of-flight mass spectrometry. J. Sep. Sci. 2017, 40, 3440–3452. [Google Scholar] [CrossRef] [Green Version]
- Xia, Y.-G.; Song, Y.; Liang, J.; Guo, X.-D.; Yang, B.-Y.; Kuang, H.-X. Quality Analysis of American Ginseng Cultivated in Heilongjiang Using UPLC-ESI−-MRM-MS with Chemometric Methods. Molecules 2018, 23, 2396. [Google Scholar] [CrossRef] [Green Version]
- Chen, L.L.; Lai, C.J.; Mao, L.Y.; Yin, B.W.; Tian, M.; Jin, B.L.; Wei, X.Y.; Chen, J.L.; Ge, H.; Zhao, X.; et al. Chemical constituents in different parts of seven species of Aconitum based on UHPLC-Q-TOF/MS. J. Pharm. Biomed. Anal. 2021, 193, 113713. [Google Scholar] [CrossRef]
- Liu, J.; Meng, M.; Li, C.; Huang, X.; Di, D. Simultaneous determination of three diarylheptanoids and an alpha-tetralone derivative in the green walnut husks (Juglans regia L.) by high-performance liquid chromatography with photodiode array detector. J. Chromatogr. A 2008, 1190, 80–85. [Google Scholar] [CrossRef]
- Li, C.; Liu, J.X.; Zhao, L.; Di, D.L.; Meng, M.; Jiang, S.X. Capillary zone electrophoresis for separation and analysis of four diarylheptanoids and an alpha-tetralone derivative in the green walnut husks (Juglans regia L.). J. Pharm. Biomed. Anal. 2008, 48, 749–753. [Google Scholar] [CrossRef]
- Sang, Q.; Jia, Q.; Zhang, H.; Lin, C.; Zhao, X.; Zhang, M.; Wang, Y.; Hu, P. Chemical profiling and quality evaluation of Zhishi-Xiebai-Guizhi Decoction by UPLC-Q-TOF-MS and UPLC fingerprint. J. Pharm. Biomed. Anal. 2021, 194, 113771. [Google Scholar] [CrossRef]
- Tian, T.; Xu, X.; Li, X.; Zhang, W.; Lu, H. Precision-characterization and quantitative determination of main compounds in Si-Ni-San with UHPLC-MS/MS based targeted-profiling method. J. Pharm. Biomed. Anal. 2021, 194, 113816. [Google Scholar] [CrossRef]
- Luo, P.; Dai, W.; Yin, P.; Zeng, Z.; Kong, H.; Zhou, L.; Wang, X.; Chen, S.; Lu, X.; Xu, G. Multiple reaction monitoring-ion pair finder: A systematic approach to transform nontargeted mode to pseudotargeted mode for metabolomics study based on liquid chromatography-mass spectrometry. Anal. Chem. 2015, 87, 5050–5055. [Google Scholar] [CrossRef]
- Britton, E.; Kellogg, J.; Kvalheim, O.; Cech, N. Biochemometrics to Identify Synergists and Additives from Botanical Medicines: A Case Study with Hydrastis canadensis (Goldenseal). J. Nat. Prod. 2018, 81, 484–493. [Google Scholar] [CrossRef] [Green Version]
- Plazas, E.; Casoti, R.; Murillo, M.A.; Da Costa, F.B.; Cuca, L.E. Metabolomic profiling of Zanthoxylum species: Identification of anti-cholinesterase alkaloids candidates. Phytochemistry 2019, 168, 112–128. [Google Scholar] [CrossRef] [PubMed]
- Huo, J.H.; Sun, G.D.; Dong, W.T.; Wang, W.M. Dynamic variation of major effective components in fresh rejuvenated fruit of Juglans mandshurica based on UPLC-Q-TOF-MS. China J. Chin. Mater. Med. 2016, 41, 3379–3388. [Google Scholar]

Publisher’s Note: MDPI stays neutral with regard to jurisdictional claims in published maps and institutional affiliations. |
© 2021 by the authors. Licensee MDPI, Basel, Switzerland. This article is an open access article distributed under the terms and conditions of the Creative Commons Attribution (CC BY) license (https://creativecommons.org/licenses/by/4.0/).