Article

Immunomodulatory Activity of Phyllanthus maderaspatensis in LPS-Stimulated Mouse Macrophage RAW 264.7 Cells

by
Uoorakkottil Ilyas
1,
Deepshikha P. Katare
2,
Punnoth Poonkuzhi Naseef
3,*,
Mohamed Saheer Kuruniyan
4,
Muhammed Elayadeth-Meethal
5 and
Vidhu Aeri
6,*
1
Department of Pharmacognosy and Phytochemistry, Moulana College of Pharmacy, Perinthalmanna 679321, Kerala, India
2
Department of Pharmaceutical Biotechnology, Faculty of Pharmacy, Amity University, Noida 201301, India
3
Department of Pharmaceutics, Moulana College of Pharmacy, Perinthalmanna 679321, Kerala, India
4
Department of Dental Technology, College of Applied Medical Sciences, King Khalid University, Abha 61421, Saudi Arabia
5
Department of Animal Breeding and Genetics, College of Veterinary and Animal Sciences, Kerala Veterinary and Animal Sciences University, Pookode, Wayanad 673576, Kerala, India
6
Department of Pharmacognosy and Phytochemistry, Faculty of Pharmacy, Jamia Hamdard University, New Delhi 110062, India
*
Authors to whom correspondence should be addressed.
Separations 2021, 8(9), 129; https://doi.org/10.3390/separations8090129
Submission received: 2 August 2021 / Revised: 14 August 2021 / Accepted: 17 August 2021 / Published: 24 August 2021
(This article belongs to the Special Issue Extraction and Analysis of Plant Active Ingredients)

Abstract

:
Phyllanthus species (Family Euphorbiaceae) has been used in traditional medicine of several countries as a cure for numerous diseases, including jaundice and hepatitis. This study is an attempt to evaluate the immunomodulatory activity of various fractions, column eluents of ethyl acetate fraction, and their polyphenols. Phyllanthus maderaspatensis were standardized using high-performance liquid chromatography to identify and quantify polyphenols, and purification of polyphenols was carried out using vacuum liquid chromatography. Subsequently, we tested various fractions, column eluents of ethyl acetate fraction, and polyphenols in vitro to assess their impact on nitric oxide (NO) production in LPS-stimulated mouse macrophage RAW 264.7 cells. The ethyl acetate fraction (100 μg mL−1) had a more significant stimulatory effect on LPS-stimulated NO production by the RAW 264.7 cells. We found that the ethyl acetate fraction contains a high amount of catechin, quercetin, ellagic acid kaempferol, and rutin, which are responsible for immunomodulation. The ethyl acetate fraction at concentrations of 25 and 50 μg mL−1 had a significant inhibitory effect and 100 μg mL−1 had a more significant stimulatory effect when compared with the LPS control. The percentage of inhibition by LPS control ranged from zero percentage, kaempferol ranged from 45.4% at 50 μg mL−1 to 41.88% at 100 μg mL−1, catechin ranged from 50% at 50 μg mL−1 to 35.28% at 100 μg mL−1, rutin ranged from 36.2% at 50 μg mL−1 to 47.44% at 100 μg mL−1, gallic acid ranged from 28.4% at 50 μg mL−1 to 50.9% at 100 μg mL−1, ellagic acid ranged from 45.12% at 50 μg mL−1 to 38.64% at 100 μg mL−1, and purified quercetin ranged from 26.2% at 50 μg mL−1to 45.48% at 100 μg mL−1. As NO plays an important role in the immune function, polyphenols’ treatment could modulate several aspects of host defense mechanisms owing to the stimulation of the inducible nitric oxide synthase.

1. Introduction

Phyllanthus maderaspatensis, belonging to the genus Phyllanthus (Euphorbiaceae), is widely distributed in Sri Lanka, South Africa, China, and southern India. In India, the whole plant is used against kidney and urinary tract infections, digestive disorders, hepatitis, and diabetes. In Tanzania, the whole plant is used as a topical application for scabies. A root decoction has been indicated to cure constipation, gastrointestinal disorders, menstrual problems, intestinal pain and diarrhea, lack of appetite, testicular swelling, chest complaints, and snakebites. Leaves are mixed with lemon juice and applied to the skin for the treatment of rheumatics. The plant is used for a variety of ailments including smallpox, syphilis, asthma, and bleeding gums, as well as in various biological activities such as chronic hepatitis B infection [1], antihepatotoxic and choleretic activities [2], adulticidal and larvicidal efficacy [3], antidiabetic activity [4], hepatoprotective and antioxidant activity [5], anti-Epstein–Barr virus [6], antiretroviral reverse transcriptase [7], and antiherpes simplex virus type 1 and type [8]. Compounds with immunomodulatory activities like flavonoids, fatty acids, triterpenes, and polysaccharides are found in many plants [9]. Phyllanthus genus was found to be rich in polyphenols, lignans, flavonoids, triterpenes, hydrolysable tannins, sterol, and alkaloids [10]. Nowadays, HPTLC is used instead of HPLC owing to the easiness, specificity, speed, and low cost [11].
Chronic inflammation has been concerned with various steps involved in tumorigenesis, including metastasis, cellular transformation, promotion, survival, invasion proliferation, and angiogenesis. Only a minority of all tumors are caused by germline mutation, whereas approximately 90% are linked to environmental and somatic mutation factors. Many environmental causes of tumors and risk factors are associated with some form of chronic inflammation [12]. Throughout, chronic inflammation acts as an associate accommodative multitude resistance against illness or injury and is primarily a self-limiting methodology; inadequate resolution of inflammatory responses typically ends up in numerous chronic ailments such as AIDS and cancer [13,14]. At the time of infection, the immune system goes under the attack of a large number of viruses, bacteria, and fungi [15]. The immune system is a part of the body that detects the pathogen using a specific receptor to produce an immediate response by the activation of immune components’ cells, chemokines, and cytokines, as well as release inflammatory mediators [16,17]. The immune system can be manipulated by the use of immunomodulators in disease conditions by achieving immunostimulation (as in the treatment of coronavirus, cancer, and AIDS) or immunosuppression (suppression of normal or excessive immune function (e.g., the treatment of graft rejection or autoimmune disease)) [18,19]. Nitric oxide (NO) is a highly reactive and diffusible gas molecule that exerts many biological effects, which include iron homeostasis, smooth muscle relaxation, platelet reactivity, neurotransmission, and cytotoxic defense mechanism against pathogens [20]. NO is also involved in the pathogenesis of many human pathological conditions such as inflammatory disease, cancer, and neurodegenerative disorders [21]. Nitric oxide acts through the stimulation of the soluble guanyl cyclase; is expressed in the cytoplasm of almost all mammalian cells; and mediates a wide range of important physiological functions such as immunomodulation, inhibition of platelet aggregation, vasodilation, and neuronal signal transduction. Nitric oxide is also generated by phagocytes (neutrophils, monocyte, and macrophages) as part of the human immune response [22]. Phagocytes are formed with inducible nitric oxide synthase (iNOS), which is activated by interferon-gamma (IFN-γ) as a single signal or by tumor necrosis factor (TNF) along with a second signal. In this way, the immune system may regulate the armamentarium of phagocytes that play a role in inflammation and immune responses [23]. Lipopolysaccharide (LPS) is widely reported as a major inducer for the production of inflammatory cytokines, which in turn stimulate iNOS induction during the inflammatory process in RAW 264.7 cells macrophages [24]. These cytokines can be formed from macrophages in response to bacterial LPS, inflammatory stimulation, and infection. They also play an important role in the immune system by aiding cytostatic and cytotoxic effects on malignant or infected cells [25].

2. Materials and Methods

2.1. Reagents and Apparatus

We purchased reference standards for quercetin rutin, ellagic acid, catechin, and kaempferol from Natural Remedies Pvt. Ltd. (Bangalore, India). All chemicals used were of analytical grade, including mouse macrophage RAW 264.7 cells (National Centre for Cell Science (NCCS), Pune, India, Dulbecco’s modified Eagle’s medium (DMEM), fetal bovine serum (FBS) and MTT assay kit, trypsin EDTA, penicillin and streptomycin and DMSO (Sigma-Aldrich Co. LLC, St. Louis, MO, USA), Trypan blue solution, galactosamine, and absolute ethanol (Himedia Lab Pvt. Ltd., Mumbai, India). Tissue culture flasks, 96- and 24-well micro-culture plates, Eppendorf tube, inverted microscope, serological pipette, heamocytometer (Himedia Lab Pvt. Ltd., Mumbai, India), laminar flow hoods (Khera instrument, New Delhi, India), CO2 incubator (NuAire, Plymouth, MA, USA), water bath, deep freezer (−20 °C) were used.

2.2. Collection of Plant Material

The fresh whole plant was collected from the Kanyakumari district of Tamil Nadu state in India. Dr. R.P Pandey, Plant taxonomist of Tropical Botanical Garden and Research Institute (TBGRI), Trivandrum, India, identified and authenticated the specimen. A voucher specimen was placed at the herbarium of TBGRI (TBGRI 65616 dated 24 December 2010) for future reference.

2.3. Extraction of Plant Materials

2.3.1. Preparation of Aqueous Ethanolic Extract

We extracted dried powdered plant material using aqueous ethanolic solvent (50%, for 6 h at 37 °C), then pooled the hydroalcoholic extract, and it dried under reduced pressure at 40 °C with a rotator evaporator. For hydroalcoholic extracts, the percentage yields of the crude extracts were 15.58% w/w.

2.3.2. Standardization of Polyphenols in P. maderaspatensis by HPTLC

Standard solutions of ellagic acid, gallic acid, catechin, quercetin, rutin, and kaempferol were applied in triplicate on silica gel 60 F254 plates, using a CAMMAG Linomat-5 Automatic Sample Spotter. The plates were developed in a solvent system, toluene/ethyl acetate/formic acid/methanol (3:3:0.8:0.2 v/v) in a CAMAG glass twin trough chamber (20 × 10 cm) up to a distance of 8 cm, dried in the air, and scanned at 254 nm. The developed plates were dried in the air and scanned at 254 nm using CAMAG TLC scanner 3 and win CATS 4 software. The peak areas were recorded. Calibration curves of ellagic acid, gallic acid, catechin, quercetin, rutin, and kaempferol were obtained by plotting peak areas versus applied crude extracts, and the concentration of ellagic acid, gallic acid, catechin, quercetin rutin, and kaempferol was calculated, respectively.

2.3.3. Estimation of Different Markers

Each sample solution (10 µL) was applied in triplicate on silica gel 60 F254 plates with CAMAG Linomat-5 Automatic Sample Spotter and the peak areas and absorption spectra were recorded. We calculated the number of bioactive compounds in P. maderaspatensis using the peak areas and the absorption spectra were recorded. The number of bioactive compounds in P. maderaspatensis was calculated using the respective standard calibration curves of ellagic acid, gallic acid, catechin, quercetin, rutin, and kaempferol.

2.3.4. Fractionation of Potent Aqueous Ethanolic (50% v/v) Extracts of P. maderaspatensis

The aqueous ethanolic extract of P. maderaspatensis was dissolved in 10% distilled water and was successively fractionated thrice with hexane (3 × 600 mL), chloroform (3 × 600 mL), ethyl acetate (3 × 500 mL), and water-soluble fractions. The combined fractions of P. maderaspatensis were evaporated to dryness under reduced pressure at 40 °C in a rotary evaporator.

2.3.5. Nitric Oxide Estimation of Various Fractions of P. maderaspatensis

Nitric oxide was measured as nitrite released from mouse macrophage cells, RAW 264.7. Cells were suspended in DMEM (Sigma) supplemented with 10% FCS, seeded in a 96-well culture dish at a density of 1 × 10⁶ cells/well, and incubated for 48 h at 37 °C in an atmospheric of 5% CO2 and 95% humidity. After incubation, 100 µL of the medium was transferred from the surface of the cultures of each well and replenished with the same amount of fresh medium. Further incubation for 24 h was done with concentrations of 25, 50, and 100 μg mL−1 of alcoholic and aqueous-alcoholic (50% v/v) extracts/metabolites (100 and 200 μg mL−1) of P. maderaspatensis in the presence or absence of the indicated amount of LPS (10 μg mL−1). Nitric oxide production was estimated in terms of the amount of nitrite. After incubation, 100 µL from the surface of the cultures was transferred into a new plate and the equivalent amount of Griess reagent was added (1% sulfanilamide in 5% phosphoric acid, 0.1% N-(1-naphthyl)-ethylenediamine dihydrochloride in 5% phosphoric acid). This plate was incubated for 10 min at room temperature and measured by an ELISA reader at 570nm. NO concentration was determined using a standard curve plotted using a known quantity of sodium nitrite. The outcome is obtainable in µM concentration obtained from the mean OD of triplicate wells of each group.
The percentage of NO inhibition/stimulation by the extracts was calculated as follows:
% inhibition = 100 × [([NO2] control − [NO2] sample)/[NO2] control

2.3.6. Isolation and Purification of Potent Fractions by Vacuum Liquid Chromatography

The air-dried whole plant of P. maderaspatensis was coarsely powdered, defatted with extraction procedure thrice. Using a rotary evaporator, the aqueous ethanolic extracts were pooled and dried at 40 °C under reduced pressure. The crude extracts of P. maderaspatensis were successively fractionated thrice with chloroform, ethyl acetate, and water. Ethyl acetate fraction was found to have significant immunomodulatory and hepatoprotective activity compared with other fractions. Hence, this fraction was subjected to vacuum liquid chromatography to separate various components present in the fraction. An amount of 16 gm of ethyl acetate fraction was mixed with a small amount of Silica gel G (Merck) to form a dry slurry, which was then loaded onto a sintered glass funnel filled with silica gel gas stationary phase. The column was eluted stepwise under vacuum with solvents of accelerating polarity, starting from pure toluene, and ethyl acetate mixture, to pure ethyl acetate. To elaborate, after initially eluting with 5% ethyl acetate in toluene, the ethyl acetate portion was increased by 5% increments up to 50% and then in 10% increments up to 100% ethyl acetate with a concomitant decrease in the toluene levels. After elution with ethyl acetate, elution with 5% methanol in ethyl acetate, the methanol portion was increased by 5% increments up to 100% methanol. The solvents were eluted until they ran clear of the funnel. The flow rate of solvent was monitored constantly (100 mL/min) throughout the experiment. Various fractions were collected individually and monitored by TLC to match homogeneity. Similar fractions having the same Rf values were combined and crystallized.

2.3.7. Statistical Analysis

Statistical analysis was performed using Dunnett’s multiple comparison tests and one-way analysis of variance (ANOVA) using Graphpad prism 5.0 (Graphpad Software, Inc., San Diego, CA, USA). The level of significance was set at p < 0.05.

2.3.8. Maintenance of Cell Lines

HepG2 cell lines were grown in 25 cm2 tissue culture flasks containing minimum essential medium (MEM) supplemented with 10% FBS and 1% penicillin/streptomycin at 37 °C in a CO2 incubator in an atmosphere of humidified 5% CO2 and 95% air. The cells were maintained by routine sub-culturing in 25 cm2 tissue culture flasks.

2.3.9. Method for Passaging the Cells

All the reagents were brought to room temperature before use. Media was removed from the 80–90% confluent flasks by a 10 mL serological pipette. Cells in the T-75 flask were washed with 10 mL of PBS. Two milliliters of 0.1% trypsin EDTA was added to the flask. The flask was kept at 37 °C in the CO2 incubator for 2–3 min and was observed under a microscope for detachment. Six milliliters of growth medium were added to the flask for inhibition of trypsin action and re-suspended properly by pipetting. The cell suspension was collected in a 15 mL falcon tube and then centrifuged at 1200 rpm for 3 min. The supernatant was discarded and the pellet was resuspended in 3 mL of complete medium. Cells were counted, and then 0.2–0.4 million cells were kept in a T-25 flask for growing. The flasks were incubated in a CO2 incubator at 37 °C and the cells were periodically monitored for any morphological changes and contamination. After the formation of an 80–90% confluent monolayer, the cells were further utilized.

2.3.10. Calibration Curves for Standard Markers

Standard solutions of kaempferol, rutin, ellagic acid, catechin, and quercetin were applied in triplicate on silica gel 60 F254 plates, using a CAMMAG Linomat-5 Automatic Sample Spotter. The plates were developed in a solvent system, toluene/ethyl acetate/formic acid/methanol (3:3:0.8:0.2 v/v) in a CAMAG glass twin trough chamber (20 × 10 cm) up to a space of 8 cm. Further, the developed plates were dried and scanned at 254 nm using CAMAG TLC scanner 3 and win CATS 4 software. The peak areas were recorded. The quantification of polyphenols was carried out based on peak area with a linear calibration curve at concentration ranges of 40–200, 100–1600, 20–200, 200–1400, and 10–160 ng/band of kaempferol, rutin, ellagic acid, catechin, and quercetin, respectively. Calibration curves of polyphenols were obtained by plotting peak areas versus applied crude extracts, and the concentrations of kaempferol, rutin, ellagic acid, catechin, and quercetin were calculated, respectively.

3. Results

3.1. Percentage Yield of the Different Crude Extracts of P. maderaspatensis

We found that the yield of aqueous extract, crude ethanolic extract, and aqueous ethanolic extract was 13.7 ± 1.9% w/w, 15.18 ± 0.19% w/w, and 15.58 ± 0.45% w/w, respectively.

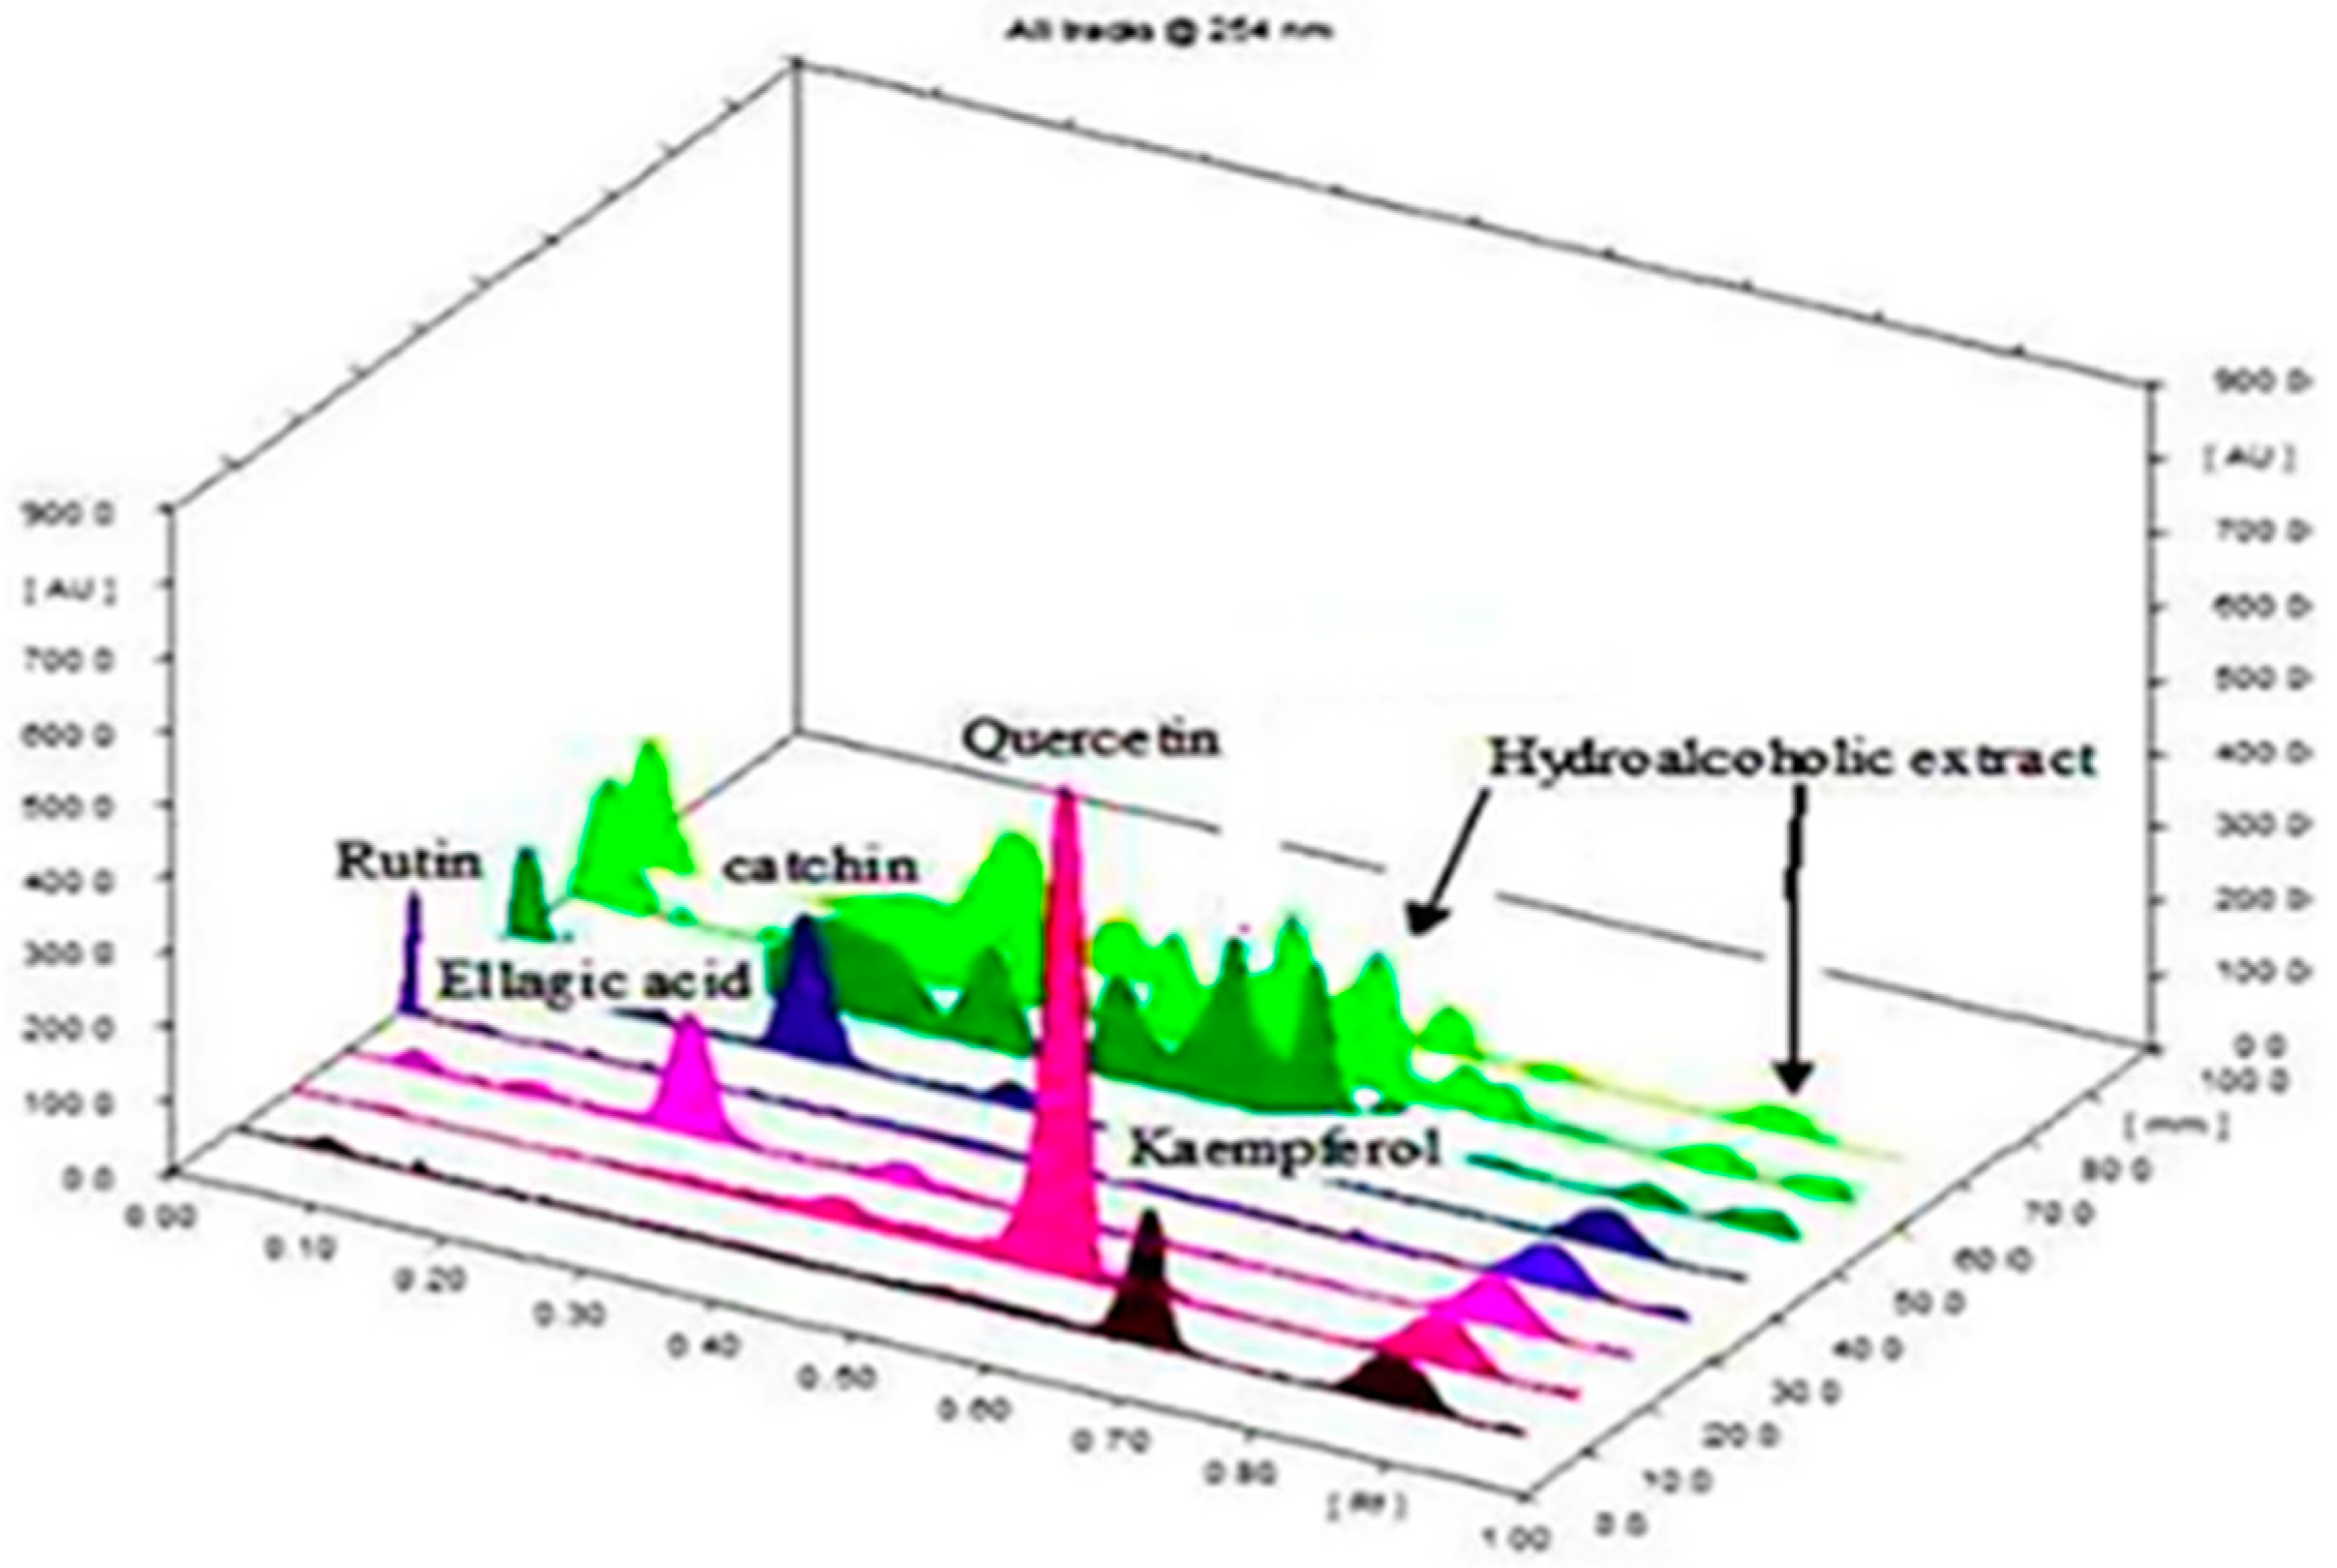
3.2. HPTLC Fingerprint Profile of Aqueous Ethanolic Extracts of P. maderaspatensis

Development of Optimum Mobile Phase

Chromatographic separation studies were carried out on the working standard solution of polyphenols’ compounds (1 mg mL1) in methanol. Initially, various trials were carried out with different solvent systems. Finally, toluene/ethyl acetate/formic acid/methanol (3:3:0.8:0.2) was used for simultaneous determination of ellagic acid, gallic acid, catechin, rutin, kaempferol, and quercetin, showing a sharp and well-defined peak. At room temperature, we obtained well-defined bands upon saturating the chamber with the mobile phase for 30 min. The standard band of ellagic acid, gallic acid, catechin, quercetin, rutin, and kaempferol, along with ethanolic, aqueous ethanolic, and aqueous extracts of P. maderaspatensis separated on HPTLC plate, were scanned at 254 nm (Figure 1).

3.3. Fractionation of Aqueous Ethanolic Extract of P. maderaspatensis

Fractionation of the most potent aqueous ethanolic extract into hexane soluble, ethyl acetate sediment, ethyl acetate soluble, chloroform sediment, chloroform soluble, methanol, and water-soluble fractions was carried out. These fractions were studied for their TLC pattern using the above-mentioned solvent systems. The data regarding the number of spots and their resolution are given in Table 1.
The solvent system no.7 indicated the best separation of polyphenols in the ethyl acetate fraction. Except for the ethyl acetate fraction, none of the other fractions indicated the presence of selected polyphenols. Other fractions were discarded. The ethyl acetate fraction was selected for vacuum liquid chromatography.

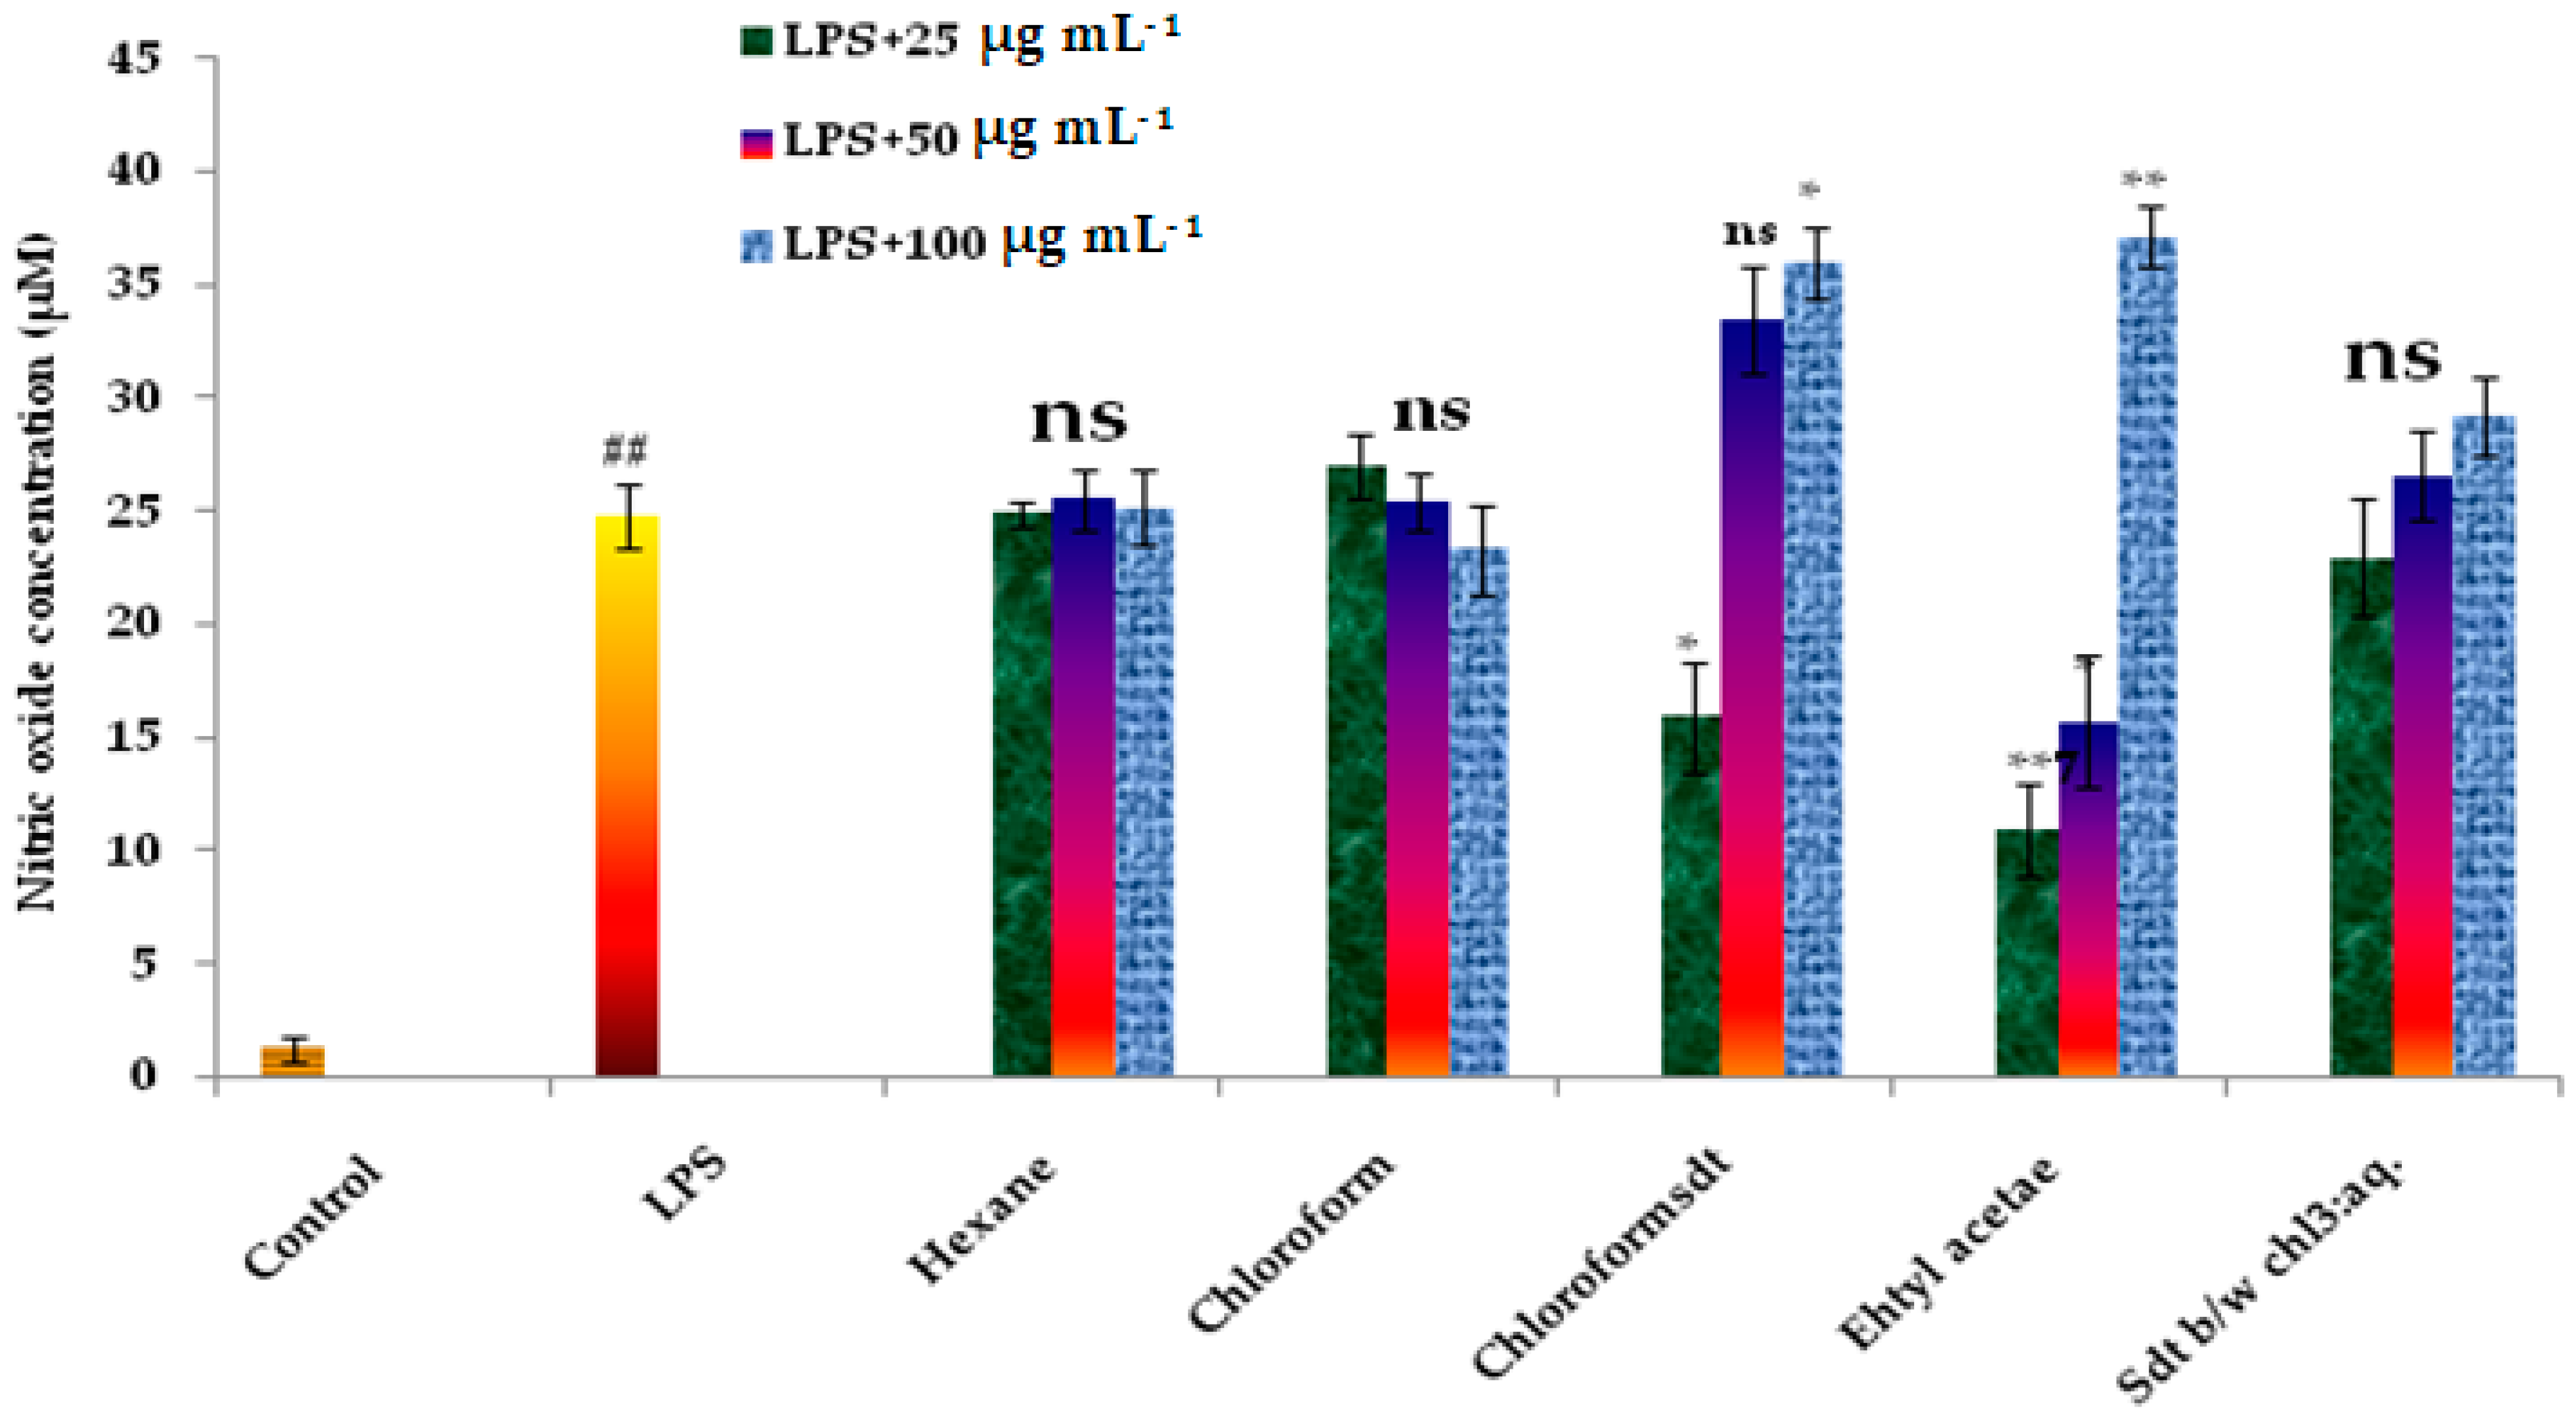
3.4. Stimulation of Inducible NO Synthesis by the Different Fractions of P. maderaspatensis

Ethyl acetate, chloroform, hexane, and water-soluble fractions, along with sediment of chloroform and ethyl acetate, were then screened at different concentrations (25, 50, and 100 μg mL−1) for invitro immunomodulatory activity using the nitric oxide assay method. Hexane, chloroform, and sediment between chloroform and water-soluble fractions had no significant effect on LPS-stimulated NO production by the RAW 264.7 cells, while chloroform sediment (25 μg mL−1) and ethyl acetate fraction at concentrations of 25 and 50 μg mL−1 had a significant inhibitory effect on LPS-stimulated NO production when compared with LPS control. The ethyl acetate fraction and chloroform fraction (100 μg mL−1) had a more significant stimulatory effect on LPS-stimulated NO production by the RAW 264.7 cells, as represented in Table 2 and Figure 2.

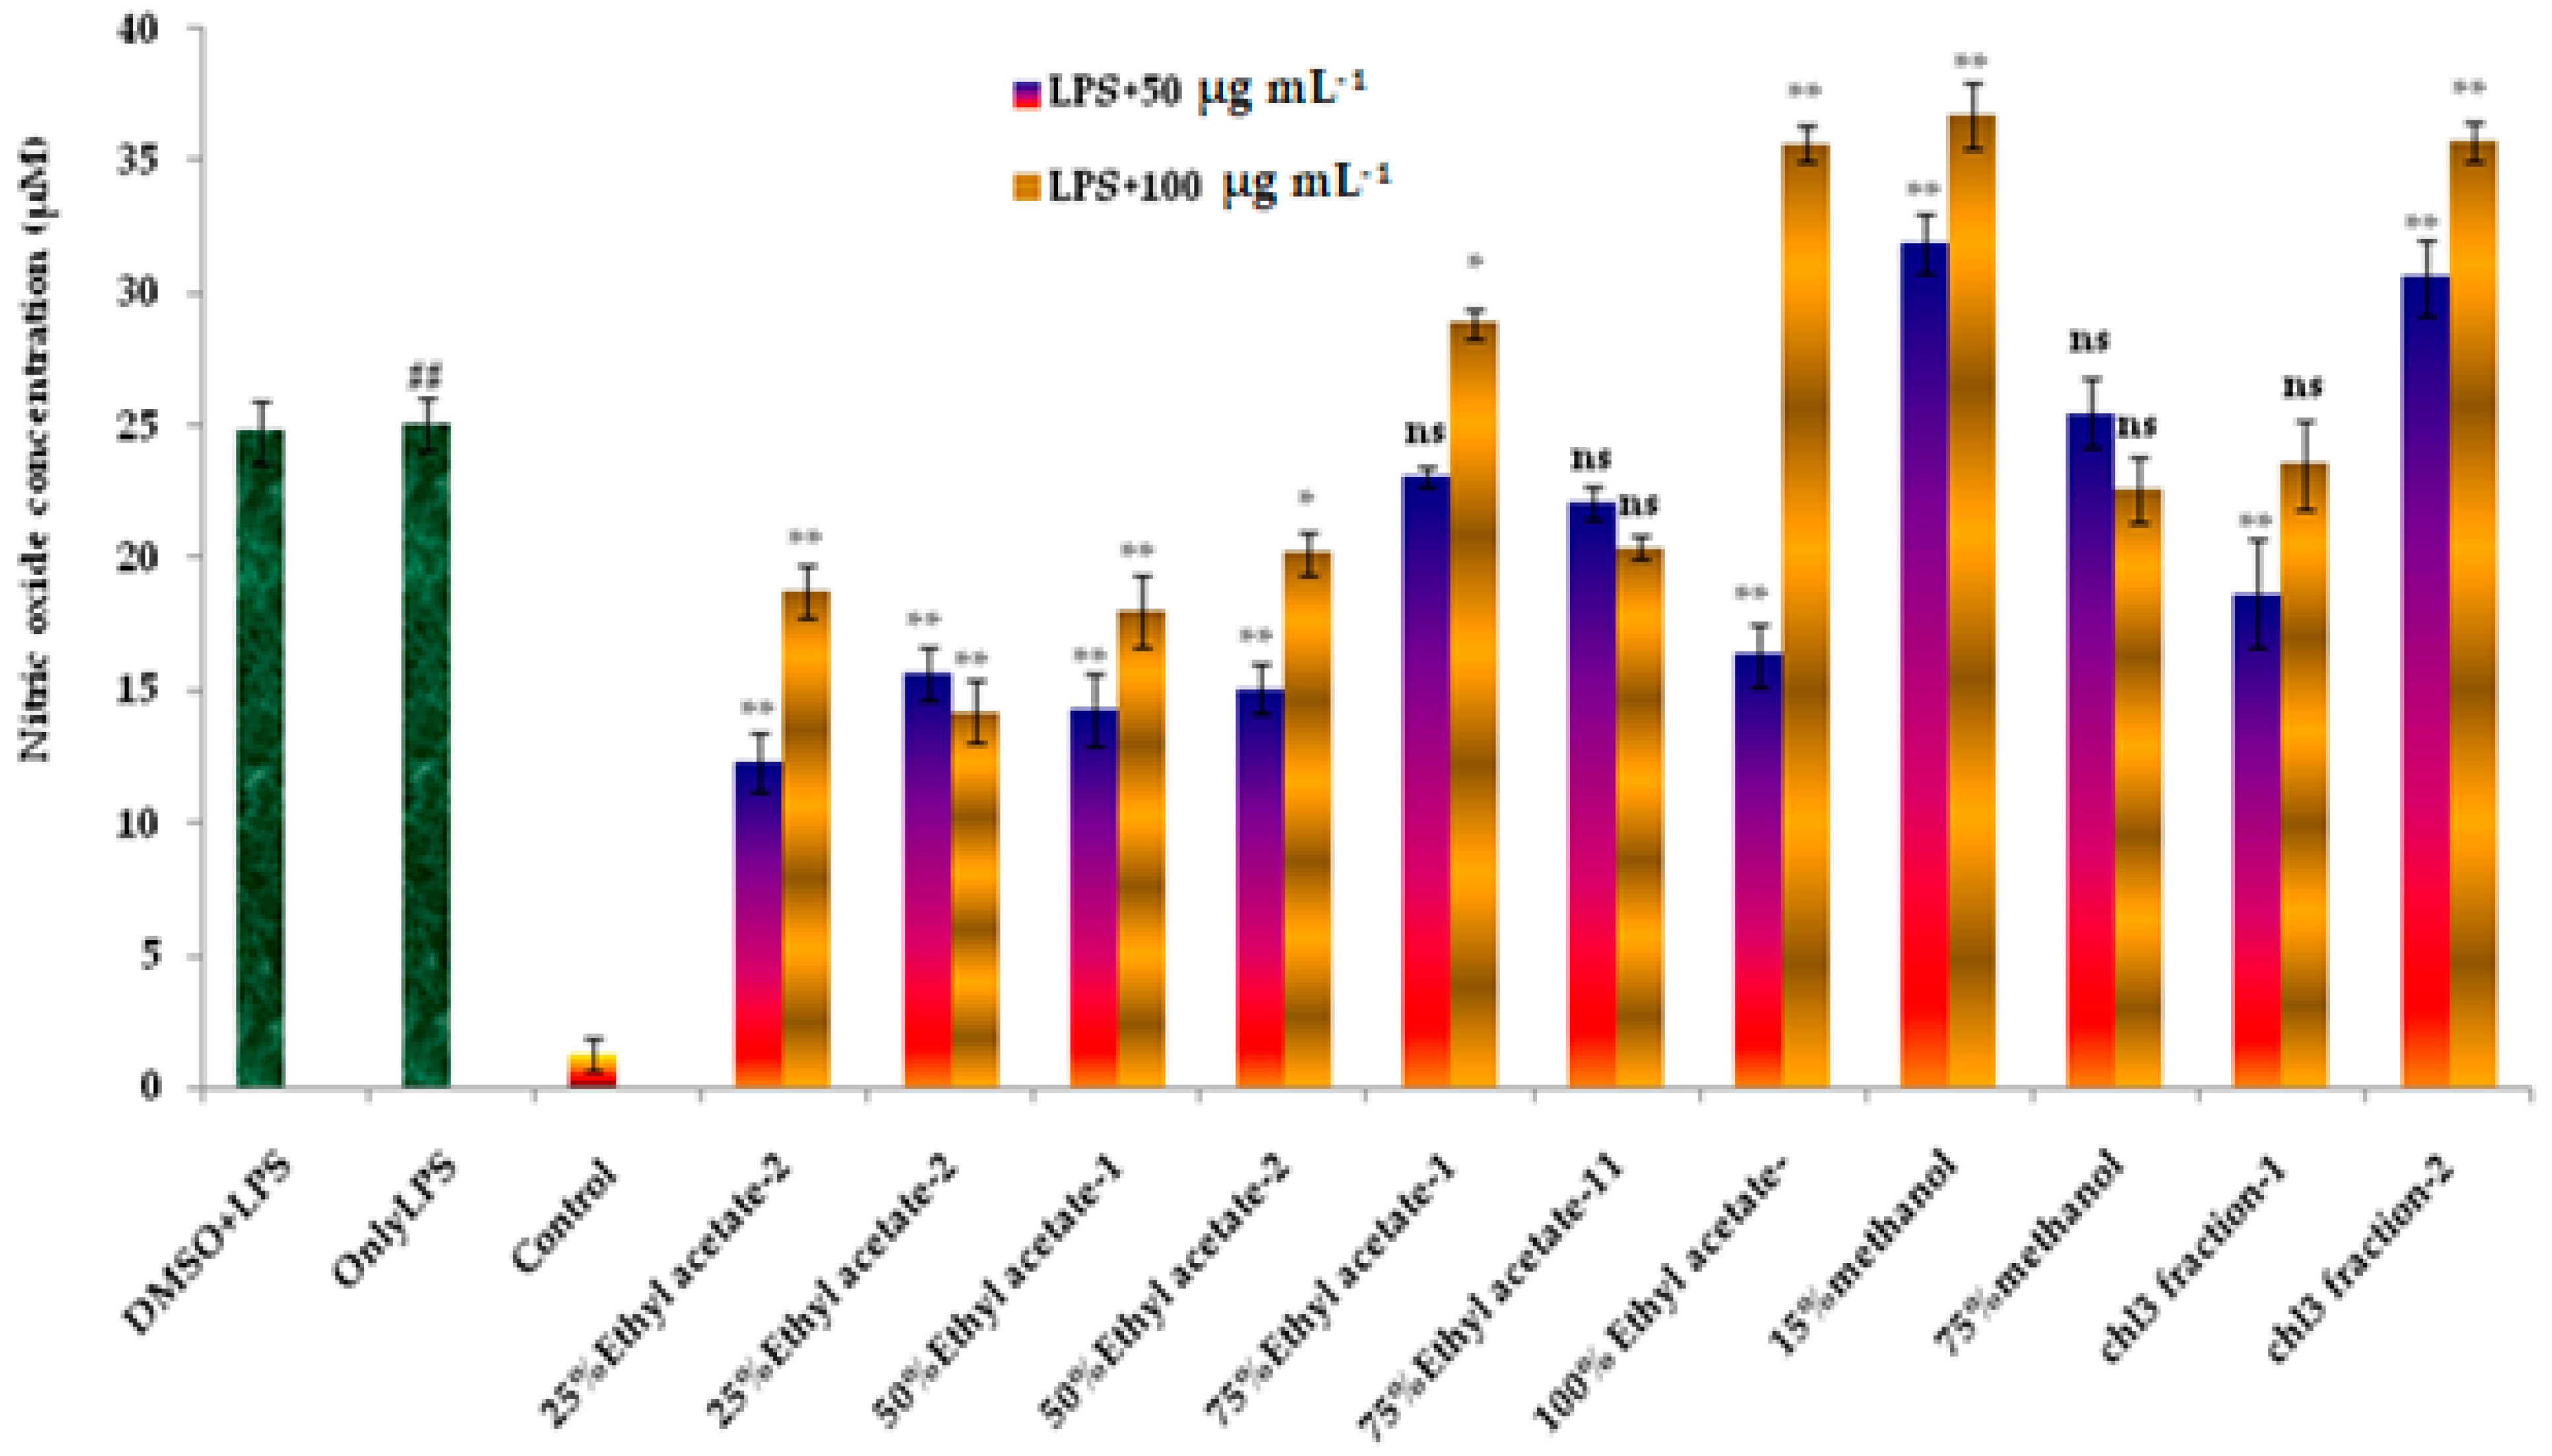
3.5. Vacuum Liquid Chromatography and Selected Activity of Column Eluents of Ethyl Acetate Fraction

Fourteen column eluents were obtained from the column chromatography of the ethyl acetate fraction of P. maderaspatensis. These column eluents were subjected to the HPTLC profile. Different components present in the eluents were identified by spraying with NP reagent and subsequently matching the Rf value with the standards (1–6). The detailed HPTLC profile of each fraction is represented in Table 3.
The standards (1–6) were identified as follows: ellagic acid (Rf value: 0.55) standard was matched with track no. 19 (100% ethyl acetate elutes), eupalitin(Rf value: 0.23) standard was not matched with any track, kaempferol (Rf value: 0.81) standard was matched with track no. 8 (25% ethyl acetate in toluene elutes), rutin (Rf value: 0.08) standard was matched with track no. 13 (50% ethyl acetate in toluene 3rd elutes), epicatechin (Rf value: 0.50) standard was matched with track no. 28 (75% ethyl acetate in toluene elutes), epicatechin (Rf value: 0.50) standard was matched with track no. 15 (75% ethyl acetate in toluene elutes), and catechin (Rf value: 0.54) standard was matched with track no. 15 (75% ethyl acetate in toluene elutes).

3.6. Effect of Column Eluents of Ethyl Acetate Fraction on LPS-Stimulated NO Production in RAW 264.7 Cells

The effect of nine column eluents of ethyl acetate fractions on NO production was determined by treating the RAW cell of LPS stimulation/inhibition by pre-incubating the cells with or without the elutes. LPS significantly increased NO production in RAW 264.7 cells. The levels of NO production induced by LPS-stimulated were significant (** p < 0.01) in a dose-dependent manner when treated with concentrations of 25 and 50 μg mL−1 of each elute and significantly stimulated by column eluents of ethyl acetate fractions.NO production was 25 and 50 μg mL−1 of column eluents of ethyl acetate fractions of P. maderaspatensis compared with LPS treatment alone. In this study, a comparison of column elutes of ethyl acetate fractions was carried out in mouse monocyte cell lines RAW 264.7 cells, as shown in Figure 3.

3.7. Stimulation of Inducible NO Synthesis by Compounds

The significant suppressive effect by concentration at 50 μg mL−1 and 100 μg mL−1 of rutin, kaempferol, gallic acid, and ursolic acid; the minimum concentration of ellagic acid (50 μg mL−1); and the more significant stimulatory effect of oleanolic acid, ellagic acid, and quercetin in LPS stimulated NO production by the RAW 264.7 cells were observed (Figure 4).
The compounds indicated significant invitro immunomodulation: ellagic acid ˃ quercetin ˃ oleanolic acid and immunosuppressive effect: kaempferol ˃ catechin ˃ rutin ˃gallic acid ˃ ellagic acid (50 μg mL−1), when compared with LPS.

4. Discussion

A single solvent system (toluene/ethyl acetate/formic acid/methanol (3:3:0.8:0.2 v/v) was developed for densitometric quantification of polyphenols by HPTLC in aqueous-alcoholic extracts with reference to respective marker compounds such asrutin, kaempferol, quercetin, catechin, ellagic acid, gallic acid, and quercetin present in P. maderaspatensis. Ethyl acetate supernatant fractions showed significant immunomodulatory activity compared with other fractions, and we subsequently separated ethyl acetate fraction by vacuum liquid chromatography. Using ethyl acetate fraction in P. maderaspatensis, we performed isolation, purification, and characterization of rutin, kaempferol, ellagic acid, gallic acid, and catechin. Ellagic acid showed more significant immunomodulatory activity, while quercetin exhibited significant immunomodulation when compared with the crude. Specifically, ethyl acetate (100%) column eluents indicated that ellagic acid exhibited significant immunomodulation, followed by 15% methanol elutes, followed by chloroform second sediment fraction (oleanolic acid and ursolic acid), followed by 75% ethyl acetate(catechin, epicatechin) and 50% ethyl acetate elutes showed highly significant suppression (rutin, gallic acid), followed by 25% ethyl acetate (kaempferol and quercetin) and 75% methanol indicated non-significant active fraction, followed by 75% ethyl acetate second elutes and chloroform first fraction when compared with LPS.
Synthetic agents, natural adjuvant, and antibody reagents are used as immunosuppressive and immunostimulants. However, there is a major limitation to the general use of these agents, that is, the increased risk of infection and generalized effect throughout the immune system [26]. Many therapeutic effects of plant extracts have been claimed to be thanks to their influence on the immune system of the human body [27]. Many herbal preparations such as Panax ginseng, Picrorhiza scrophulariiflora, Centella asiatica, Tinospora cordifolia, Phyllanthus debilis, Trigonella foenum graecum, and Pouteria cambodiana have been shown to alter the immune function and report a wide array of immunomodulatory effects [28,29,30,31,32,33,34]. Most research concerning the immunomodulatory activities of the plant has been carried out using crude extracts [35,36]. In some, combinations of various herbs or herbs in combination with minerals have been used, taking into consideration Unani, Ayurvedic, or Chinese traditional formulation. Although it may be rational to use a single plant or its single constituents, it has been a general experience that the single constituent shows more efficacy compared with the total plant extract. Phyllanthus genus was found to be rich in polyphenols, lignins, flavonoids, triterpenes, hydrolysable tannins, sterol, and alkaloids [37].

5. Conclusions

We evaluated the immunomodulatory activity of various fractions, column eluents of ethyl acetate fraction, and their polyphenols present in P. maderaspatensis obtained from the Maruthmallai region of Kanyakumari district, Tamilnadu, India. Rutin, gallic acid, kaempferol, and catechin, each 200 μg mL−1, as well as ellagic acid (100 μg mL−1), showed a significant immunosuppressive effect owing to the inhibition of NO production compared with the LPS-stimulated RAW 264.7 cells group, and the most significant immunostimulatory effect was produced by ellagic acid and quercetin, each 200 μg mL−1, when compared with the LPS control group.

Author Contributions

Conceptualization, U.I., D.P.K. and V.A.; methodology, U.I., D.P.K. and V.A.; investigation, U.I.; data curation, U.I., D.P.K., V.A., P.P.N. and M.E.-M.; writing—original draft preparation, U.I., D.P.K., V.A. and P.P.N.; writing—review and editing, U.I., D.P.K., V.A., P.P.N., M.E.-M. and M.S.K.; visualization, U.I.; supervision, V.A.; funding acquisition, U.I., D.P.K., V.A., P.P.N., M.E.-M. and M.S.K. All authors have read and agreed to the published version of the manuscript.

Funding

The authors extend their appreciation to the Deanship of scientific research at king Khalid University, Grant No: RGP2/191/42 Saudi Arabia for financial assistance.

Institutional Review Board Statement

Not applicable.

Informed Consent Statement

Not applicable.

Acknowledgments

The authors would like to thank the National Medicinal Plant Board, Department of AYUH, Delhi, India.

Conflicts of Interest

The authors declare no conflict of interest. The funders had no role in the design of the study; in the collection, analyses, or interpretation of data; in the writing of the manuscript; or in the decision to publish the results.

References

  1. Munshi, A.; Mehrotra, R.; Ramesh, R.; Panda, S.K. Evaluation of anti-hepadnavirus activity of Phyllanthus amarus and Phyllanthus maderaspatensis in duck hepatitis B virus carrier Pekin ducks. J. Med. Virol. 1993, 41, 275–281. [Google Scholar] [CrossRef]
  2. Asha, V.V.; Akhila, S.; Wills, P.J.; Subramoniam, A. Further studies on the antihepatotoxic activity of Phyllanthus maderaspatensis Linn. J. Ethnopharmacol. 2004, 92, 67–70. [Google Scholar] [CrossRef]
  3. Bagavan, A.; Kamaraj, C.; Elango, G.; Abduz Zahir, A.; Abdul Rahuman, A. Adulticidal and larvicidal efficacy of some medicinal plant extracts against tick, fluke and mosquitoes. Vet. Parasitol. 2009, 166, 286–292. [Google Scholar] [CrossRef]
  4. Prashanth, D.; Padmaja, R.; Samiulla, D.S. Effect of certain plant extracts on alpha-amylase activity. Fitoterapia 2001, 72, 179–181. [Google Scholar] [CrossRef]
  5. Srirama, R.; Deepak, H.B.; Senthilkumar, U.; Ravikanth, G.; Gurumurthy, B.R.; Shivanna, M.B.; Chandrasekaran, C.V.; Agarwal, A.; Shaanker, R.U. Hepatoprotective activity of Indian Phyllanthus. Pharm. Biol. 2012, 50, 948–953. [Google Scholar] [CrossRef] [PubMed] [Green Version]
  6. Zhang, X.; Xia, Q.; Yang, G.; Zhu, D.; Shao, Y.; Zhang, J.; Cui, Y.; Wang, R.; Zhang, L. The anti-HIV-1 activity of polyphenols from Phyllanthus urinaria and the pharmacokinetics and tissue distribution of its marker compound, gallic acid. J. Tradit. Chin. Med. Sci. 2017, 4, 158–166. [Google Scholar] [CrossRef]
  7. Tan, W.C.; Jaganath, I.B.; Manikam, R.; Sekaran, S.D. Evaluation of antiviral activities of four local Malaysian Phyllanthus species against herpes simplex viruses and possible antiviral target. Int. J. Med. Sci. 2013, 10, 1817–1829. [Google Scholar] [CrossRef] [Green Version]
  8. Yang, C.M.; Cheng, H.Y.; Lin, T.C.; Chiang, L.C.; Lin, C.C. Acetone, ethanol and methanol extracts of Phyllanthus urinaria inhibit HSV-2 infection in vitro. Antiviral. Res. 2005, 67, 24–30. [Google Scholar] [CrossRef]
  9. Kumar, D.; Arya, V.; Kaur, R.; Bhat, Z.A.; Gupta, V.K.; Kumar, V. A review of immunomodulators in the Indian traditional health care system. J. Microbiol. Immunol. Infect. 2012, 45, 165–184. [Google Scholar] [CrossRef] [Green Version]
  10. Patel, J.R.; Tripathi, P.; Sharma, V.; Chauhan, N.S.; Dixit, V.K. Phyllanthus amarus: Ethnomedicinal uses, phytochemistry and pharmacology: A review. J. Ethnopharmacol. 2011, 18, 286–313. [Google Scholar] [CrossRef] [PubMed]
  11. Srivastava, A.; Misra, H.; Verma, R.K.; Gupta, M.M. Chemical fingerprinting of Andrographis paniculata using HPLC, HPTLC and densitometry. Phytochem. Anal. 2004, 15, 280–285. [Google Scholar] [CrossRef]
  12. Singh, N.; Baby, D.; Rajuguru, J.P.; Patil, P.B.; Thakkannavar, S.S.; Pujari, V.B. Inflammation and cancer. Ann. Afr. Med. 2019, 18, 121–126. [Google Scholar] [CrossRef]
  13. Schottenfeld, D.; Beebe-Dimmer, J. Chronic inflammation: A common and important factor in the pathogenesis of neoplasia. Ca. Cancer J. Clin. 2006, 56, 69–83. [Google Scholar] [CrossRef]
  14. Ilyas, U.; Katare, D.P.; Aeri, V.; Naseef, P.P. A Review on hepatoprotective and immunomodulatory herbal plants. Pharmacogn. Rev. 2016, 10, 66–70. [Google Scholar]
  15. Tomar, N.; De, R.K. A brief outline of the immune system. In Immunoinformatics; Humana Press: New York, NY, USA, 2014; pp. 3–12. [Google Scholar]
  16. Chaplin, D.D. Overview of the immune response. J. Allergy Clin. Immunol. 2010, 125, 3–23. [Google Scholar] [CrossRef] [PubMed]
  17. Chandra, R.K. Nutrition and the immune system: An introduction. Am. J. Clin. Nutr. 1997, 66, 460S–463S. [Google Scholar] [CrossRef] [PubMed]
  18. Catanzaro, M.; Corsini, E.; Racchi, M.; Lanni, C. Immunomodulatory inspired by nature: A review on curcumin and echinacea. Molecules 2018, 23, 2778. [Google Scholar] [CrossRef] [PubMed] [Green Version]
  19. Sattler, S. The role of the immune system beyond the fight against infection. Adv. Exp. Med. Biol. 2017, 1003, 3–14. [Google Scholar]
  20. Schaller, M. The behavioral immune system and the psychology of human sociality. Philos. Trans. R Soc. Lond. B Boil. Sci. 2011, 366, 3418–3426. [Google Scholar] [CrossRef] [Green Version]
  21. Calabrese, V.; Cornelius, C.; Dinkova-Kostova, A.T.; Calabrese, E.J.; Mattson, M.P. Cellular stress responses, the hormesis paradigm, and vitagenes: Novel targets for therapeutic intervention in neurodegenerative disorder. Antioxid. Redox Signal. 2010, 13, 1763–1811. [Google Scholar] [CrossRef]
  22. Hsieh, H.L.; Yang, C.M. Role of redox signaling in neuroinflammation and neurodegenerative diseases. BioMed. Res. Int. 2013, 2013, 484613. [Google Scholar] [CrossRef]
  23. Green, S.J.; Mellouk, S.; Hoffman, S.L.; Meltzer, M.S.; Nacy, C.A. Cellular mechanisms of nonspecific immunity to intracellular infection: Cytokine-induced synthesis of toxic nitrogen oxides from L-arginine by macrophages and hepatocytes. Immunol. Lett. 1990, 25, 15–19. [Google Scholar] [CrossRef] [Green Version]
  24. Yue, G.G.L.; Lau, C.B.S.; Leung, P.C. Medicinal Plants and Mushrooms with Immunomodulatory and Anticancer Properties—A Review on Hong Kong’s Experience. Molecules 2021, 26, 2173. [Google Scholar] [CrossRef] [PubMed]
  25. Sanjeewa, K.K.A.; Nagahawatta, D.P.; Yang, H.W.; Oh, J.Y.; Jayawardena, T.U.; Jeon, Y.J.; De Zoysa, M.; Whang, I.; Ryu, B. Octominin inhibits LPS-induced chemokine and pro-inflammatory cytokine secretion from RAW 264.7 macrophages via blocking TLRs/NF-κB signal transduction. Biomolecules 2020, 10, 511. [Google Scholar] [CrossRef]
  26. Arango, D.G.; Descoteaux, A. Macrophage cytokines: Involvement in immunity and infectious diseases. Front. Immunol. 2014, 5, 491. [Google Scholar] [CrossRef] [Green Version]
  27. Shivaprasad, H.N.; Kharya, M.D.; Rana, A.C.; Mohan, S. Preliminary immunomodulatory activities of the aqueous extract of Terminalia chebula. Pharm. Biol. 2016, 44, 32–34. [Google Scholar] [CrossRef] [Green Version]
  28. Bayan, L.; Koulivand, P.H.; Gorji, A. A review of potential therapeutic effects. Avicenna J. Phytomed. 2014, 4, 1–14. [Google Scholar]
  29. Muhammad, R.; Najm, U.-R.; Muhammad, Z.-U.-H.; Hawa, Z.E.J.; Rosana, M. Ginseng: A dietary supplement as immune-modulator in various diseases. Trends Food Sci. Tech. 2019, 83, 12–30. [Google Scholar]
  30. Smit, H.F.; Kroes, B.H.; van den Berg, A.J.; Van der Wal, D.; Van den Worm, E.; Beukelman, C.J.; Van Dij, K.H.; Labadie, R.P. Immunomodulatory and anti-inflammatory activity of Picrorhiza scrophulariiflora. J. Ethnopharmacol. 2000, 73, 101–109. [Google Scholar] [CrossRef]
  31. Punturee, K.; Wild, C.P.; Kasinrerk, W.; Vinitketkumnuen, U. Immunomodulatory activities of Centella asiatica and Rhinacanthusnasutus extracts. Asian Pac. J. Cancer Prev. 2005, 6, 396–400. [Google Scholar]
  32. Sharma, U.; Bala, M.; Kumar, N.; Singh, B.; Munshi, R.K.; Bhalerao, S. Immunomodulatory active compounds from Tinospora cordifolia. J. Ethnopharmacol. 2012, 14, 918–926. [Google Scholar] [CrossRef]
  33. Jantan, I.; Haque, M.A.; Ilangkovan, M.; Arshad, L. An insight in to the modulatory effects and mechanisms of action of Phyllanthus species and their bioactive metabolites on the immune system. Front. Pharmacol. 2019, 10, 878. [Google Scholar] [CrossRef] [PubMed] [Green Version]
  34. Bin-Hafeez, B.; Haque, R.; Parvez, S.; Pandey, S.; Sayeed, I.; Raisuddin, S. Immunomodulatory effects of fenugreek (Trigonella foenum graecum L.) extract in mice. Int. Immunopharmacol. 2003, 3, 257–265. [Google Scholar] [CrossRef]
  35. Sudam, V.S.; Potnuri, A.G.; Subhashini, N.J.P. Syk—GTP RAC-1 mediated immune-stimulatory effect of Cuscutaepithymum, Ipomoea batata and Euphorbia hirta plant extracts. Biomed. Pharmacother. 2017, 96, 742–749. [Google Scholar] [CrossRef] [PubMed]
  36. Ramesh, K.V.; Padmavathi, K. Assessment of immunomodulatory activity of Euphorbia hirta L. Indian J. Pharm. Sci. 2010, 72, 621–625. [Google Scholar] [PubMed] [Green Version]
  37. Zhou, Y.; Tang, Q.; Du, H.; Tu, Y.; Wu, S.; Wang, W.; Xu, M. Antiviral effect of ovotransferrin in mouse peritoneal macrophages by up-regulating type I interferon expression. Food Agric. Immunol. 2018, 29, 600–614. [Google Scholar] [CrossRef] [Green Version]
Figure 1. Simultaneous HPTLC profile of hydroethanolic extracts of P. maderaspatensis with different markers in the solvent system: toluene/ethyl acetate/formic acid/methanol (3:3:0.08:0.02) (v/v) at 254 nm.
Separations 08 00129 g001
Figure 2. Effect of various fractions based on polarity on LPS-stimulated RAW 264.7 cells. Cells in 96-well plates (1 × 10⁶ cells/well) were first incubated with and without specified concentrations of crude extracts for 2 h, and then incubated with LPS (10 μg mL−1) for 20 h. ## LPS treated. Untreated is the negative control without LPS treatment. Each value was expressed as mean ± SEM in the triplicate experiment. ns: non-significant, n = 3, data ± S.E.M. Groups 3–7 were compared against group II using Dunnett’s post-hoc test (* significant at < 0.01; ** significant at < 0.001).
Separations 08 00129 g002
Figure 3. Effect of column eluents of ethyl acetate fractions on NO levels in LPS-stimulated RAW 264.7 cells. Cells (1 × 10⁶ cells/well) in 96-well plates were first incubated with and without specified concentrations of column eluents for 2 h, and then incubated with LPS (10 µg/mL) for 20 h. ## LPS treated. Untreated is the negative control without LPS treatments. Values are expressed as mean ±SEM. ns: non-significant, n = 3, data ± S.E.M. Groups 3–7 were compared against group II using Dunnett’s post-hoc test (* significant at < 0.01; ** significant at < 0.001).
Separations 08 00129 g003
Figure 4. Effect of polyphenols on NO levels in LPS-stimulated RAW 264.7 cells. Cells (2 × 10⁴ cells /well) in 96-well plates were first incubated with and without indicated concentrations of polyphenols for 2 h and then incubated with LPS (10 μg mL−1) for 20 h. ## LPS treated. Untreated is the negative control without LPS treatments. Values are expressed as mean ± SEM. ns: non-significant, n = 3, data ± S.E.M. Groups 3–7 were compared against group II using Dunnett’s post-hoc test (* significant at < 0.01; ** significant at < 0.001).
Separations 08 00129 g004
Table 1. TLC analysis of ethyl acetate fraction using different solvent systems and visualising agents.
Sl. No.Solvent SystemVisualizing AgentsInference
01Hexane/ethyl acetate (7:3)Anisaldehyde sulphuric acidPoor separation
02Ethyl acetate/chloroform (40:60)Anisaldehyde sulphuric acidPoor separation
03Ethyl acetate/methanol/water (100:13.5:10)Anisaldehyde sulphuric acidPoor separation
04Ethyl acetate/formic acid/acetic acid/water (100:11:11:27)Anisaldehyde sulphuric acidTailing
05n-propanol/ethyl acetate/water (40:40:30)Anisaldehyde sulphuric acidTailing
06Toluene/ethyl acetate/formic acid (5:4:1)NP reagentsGood separation
07Toluene/ethyl acetate/formic acid/methanol (3:3:0.8:0.02)NP reagentsBest separation
Table 2. Effect of P. maderaspatensis fractions on NO production in LPS-stimulated RAW 264.7cells.
DoseControlLPSHexaneChloroformChloroform Std.Ethyl AcetateStd b/w chl3: aq.
-1.3 ± 0.625.77 ± 1.4
LPS + 25 μg mL−1--25.9 ± 0.627.03 ± 1.415.96 ± 2.510.97 ± 2.122.99 ± 2.6
LPS + 50 μg mL−1--25.56 ± 1.425.43 ± 1.333.45 ± 2.3415.76 ± 2.926.62 ± 1.9
LPS + 100 μg mL−1--25.19 ± 1.623.33 ± 2.035.92 ± 1.637.17 ± 1.329.25 ± 1.74
Table 3. HPTLC analyses of column eluent of ethyl acetate fractions of P. maderaspatensis using VLC.
TracksSolvent CombinationRf ValuesTracksSolvent CombinationRf Values
01Ellagic acid0.5511Toluene + 50% ethyl acetate-10.48, 0.48, 0.52, 0.72, 0.78
02eupalitin0.2312Toluene + 50% ethyl acetate-20.27, 0.48
03Rutin0.0813Toluene + 50% ethyl acetate-30.08, 0.12, 0.18, 0.26,
0.36, 0.42, 0.51, 0.60, 0.67
04Kaempferol0.8114Toluene + 50% ethyl acetate-40.08, 0.16, 0.26, 0.56, 0.62, 0.70, 0.87
05Epicatechin0.5015Toluene + 75% ethyl acetate-10.17, 0.27, 0.34, 0.50, 0.54, 0.75
06Catechin0.5416Toluene + 75% ethyl acetate-20.17, 0.27, 0.35, 0.46, 0.54
07Toluene + 25% ethyl acetate-10.76, 0.8117Toluene + 75% ethyl acetate-30.17, 0.27, 0.35, 0.46, 0.55, 0.68, 0.75
08Toluene + 25% ethyl acetate-20.25, 0.34, 0.48, 0.59,
0.64, 0.7, 0.81, 0.90
18Toluene + 75% ethyl acetate-40.05, 0.17, 0.27, 0.35, 0.46, 0.55
09Toluene + 25% ethyl acetate-30.58, 0.68, 0.7219100% ethyl acetate0.08, 0.55
10Toluene + 25% ethyl acetate-40.482050% ethyl acetate remain 0.25, 0.08
Publisher’s Note: MDPI stays neutral with regard to jurisdictional claims in published maps and institutional affiliations.

