Abstract
The determination of C18 fatty acids (FAs) is a key and difficult aspect in FA profiling, and a qualified method with good chromatographic separation and high sensitivity, as well as easy methylation, is required. A GC-MS method was established to simultaneously determine C18 FAs in milk. To simplify the methylation protocol for milk samples, besides a base-catalyzation methylation (50 °C for 20 min), the necessity of an additional acid-catalyzation was also studied using different temperatures (60 °C, 70 °C, 80 °C, and 90 °C) and durations (90 min and 150 min). The results showed that the chromatographic resolution was improved, although three co-eluted peaks existed. The base-catalyzation was sufficient, and an additional acid-catalyzation was not necessary. The proposed method was validated with good sensitivity, linearity, accuracy, and precision, and then applied in determining C18 FAs in 20 raw milk and 30 commercial milk samples. UHT milk presented a different profile of C18 FAs from raw milk and PAS milk samples, which indicated that excessive heating could change the profile. Overall, the proposed method is a high-throughput and competent approach for the determination of C18 FAs in milk, and which presents an improvement in chromatographic resolution and sensitivity, as well as a simplification of methylation.
1. Introduction
The fatty acid (FA) composition of milk fat has drawn increasing attention and been extensively studied for its nutritive value and functional potential for human health [1,2]. Due to the complexity of FA composition in milk fat and some difficulties in chromatographic separation, a single method cannot accomplish an overall analysis [3]. In previous studies, a good resolution of FAs in chromatography was intensively investigated, and most efforts were focused on the determination of C18:1 and conjugated linoleic acid (CLA) isomers, including positional and geometric isomers [4,5,6,7]. Moreover, derived from the isomerization and bio-hydrogenation of the dietary unsaturated FAs in rumen and desaturation in mammary gland tissue, the C18 FAs present a great diversity and abundance in milk fats; related to various potential health benefits and risks [8,9,10,11]. Therefore, the qualified determination of the C18 FAs has been the key and most difficult aspect in the analysis of FA composition.
The gas chromatography (GC) system is widely used in the identification and quantification of FAs, which are usually converted into fatty acid methyl esters (FAMEs) before detection [12,13]. To improve the resolution of the C18 FAs, some columns with different polarity were used; but the difficulty in chromatographic separation was not completely resolved [14]. In early studies, only two C18:1 and two CLA isomers were well-separated in chromatography and analyzed [15,16,17,18]; while eight C18:1 and three CLA isomers were identified using a CP7420 column in the reports of Firl et al. [19] and Ariko et al. [20]. In other studies, the results from two separations were combined for an overall analysis of C18 FAs, using different columns or temperature programs [21,22]. The application of silver ion (Ag+) chromatography was also proposed, in which cis and trans isomers of the C18 FAs were pre-separated before GC analysis, and more species of C18 FAs were identified through four injections [23]. However, multiple-injection methods are time-, labor-, and cost-intensive and lead to magnified errors in data normalization. In terms of quantification, flame ionization detector (FID) is considered as the standard method, due to its easy calculation, whereas it presents a weakness in detecting minor C18 FAs [24]. Instead, a mass spectrometry (MS) detector obviously improves the sensitivity in the selected ion monitor (SIM) mode [25], while relatively wider or more reasonable, linear ranges are required to fit the great abundance of C18 FAs in milk fat [26]. When it comes to methylation, multiple-step methods are commonly used in the determination of C18 FAs, including both base- and acid-catalyzed reactions before GC analysis. However, the base-catalyzed protocol presents a weak conversion of free FAs, whereas the acid-catalyzed reaction leads to a low efficiency and a degradation of CLA at high temperature [27]. Therefore, good chromatographic separation and high sensitivity are the basis for establishing a competent quantification method for the determination of C18 FAs in milk, and meanwhile a stable and easy step is required for methylation.
The aim of this study was to establish a high-throughput GC-MS method for the simultaneous determination of C18 FAs in milk. Besides a base-catalyzation methylation, the necessity of additional acid-catalyzation was also studied, to optimize the protocol for milk samples. The proposed method was applied in determining the C18 FAs in 20 raw milk and 30 commercial milk samples, followed by a further analysis on the profile and a comparison between the samples.
2. Materials and Methods
2.1. Milk Samples
Raw milk samples (n = 20) were collected from Mengde dairy farm in Tianjin. Commercial milk samples, including pasteurized milk (PAS, n = 15) and UHT milk (n = 15), and whey powder were purchased from local markets in Beijing. All samples were frozen immediately after collection and stored at −20 ℃ until analysis.
Whey solution was made using 1 g whey powder mixed with 30 mL ultra-pure water and used in recovery experiments; as milk samples, even skimmed milk samples, are rich in C18 FAs and not suitable as a control sample.
2.2. Chemicals and Reagents
Methanol and n-hexane (HPLC grade) were from Fisher Scientific (Fair Lawn, NJ, USA). NaOH (purity ≥ 95%) and pyrogallic acid were from Macklin (Shanghai, China). Ammonium hydroxide (purity ≥ 25%), ethanol (purity ≥ 95%), isopropanol (purity ≥ 99.5%), and acetyl chloride (purity > 99.5%) were obtained from Anpel (Shanghai, China). Ultra-pure water was prepared with a Milli-Q purification system (Millipore, Bedford, MA, USA).
The following standards were used: linoleic acid methyl ester mix CRM 47,791 and α-linolenic acid methyl ester mix CRM 47,792 from Supelco (Bellefonte, PA, USA); CLA methyl ester mix and FAME individual standards of C18:3 c6,c9,c12, C18:0, C18:1 t6, C18:1 t9, C18:1 t11, C18:1 c6, C18:1 c9, and C18:1 c11 from Nu-Check Prep (Elysian, MN, USA); C18:1 c8 and C18:1 c12 FAME individual standards from Cayman (Ann Arbor, Michigan, USA); Triacylglycerols (TAGs) individual standards of C18:1 c9, C18:2 c9,c12, and C18:3 c9,c12,c15 from Nu-Check Prep (Elysian, MN, USA); and C18:3 c6,c9,c12 TAGs from BePure (Beijing, China).
2.3. Sample Pretreatment
The frozen milk samples were pre-warmed in a water bath at 40 °C before analysis and stirred carefully to avoid frothing. Milk fat was extracted from milk samples according to AOAC 996.06 [28] and Serafim et al. [29]. Next, 2 mL milk sample was mixed with 2 mL ammonium hydroxide solution, 1 mL ethanol, 50 mg pyrogallic acid, and then hydrolyzed at 70 °C in a water bath for 20 min. After, 4 mL n-hexane/isopropanol (V/V = 3/2) solution was added into the hydrolysate, followed by oscillation and centrifugation, to extract milk fat, and 2.4 mL n-hexane was then used for additional extraction.
The extracted n-hexane was collected and mixed with 2 mL methanolic NaOH (2%), sealed and heated at 50 °C in a water bath for 20 min for base-catalyzed methylation, followed by additional acid-catalyzed methylation treatments using 2 mL acetylchloride-methanol (10%). The acid-catalyzed methylation was conducted under different reaction temperatures (60 °C, 70 °C, 80 °C, and 90 °C) and durations (90 min and 150 min). The samples only treated by base-catalyzed methylation (50 °C for 20 min) were used as a control group, without additional acid-catalyzation. After cooling to room temperature, 5 mL n-hexane and 5 mL ultra-pure water were added to make the interface of the two phases clearer. The extracted n-hexane was diluted and subsequently analyzed by GC-MS.
2.4. GC-MS Analysis
The composition of C18 FAMEs was analyzed with an Agilent 7890A GC system equipped with a 5975C MS detector (Agilent Technologies, Santa Clara, CA, USA) and a capillary column CP-Sil 88 (100 m × 0.25 mm × 0.20 µm; Agilent, Palo Alto, CA, USA).
The injection volume was 1 μL, and a split ratio of 10:1 was used. Helium was used as the carrier gas, with a constant pressure of 38 psi, and the total run time was 80.33 min. The inlet temperature was 250 °C and the oven temperatures were as follows: initial temperature of 120 °C and held for 10 min, increased by 3 °C/min to 180 °C, then increased by 1.5 °C/min to 200 °C and held for 3 min, and increased by 2 °C/min to 220 °C and held for 24 min.
The temperature of the transfer line was set at 250 °C, and the solvent delay was 10 min. The temperature of the MS ion source and quadrupole were set at 230 °C and 150 °C, respectively, and the ionizing energy was 70 eV. Qualitative and quantitative analysis of C18 FAMEs was performed in SIM mode, as shown in Table 1. Such individuals were identified by comparing the retention times and qualitative ions of the samples with those of the standards, and quantitated by the external standard method. To improve the sensitivity, the quantitative ion of each individual was selected at the best ratio of signal to noise (S/N), and the run time was divided into 5 windows. The amount of each C18 FA individual was expressed as the absolute concentration (mg/L).

Table 1.
GC-MS parameters for determination of C18 FAMEs.
2.5. Method Validation
The validation of the proposed method was applied according to the method validation guide, in which the linearity, sensitivity, precision, and accuracy were tested, ICH [30]. Linear regression was obtained by determining each C18 FAME standard solution in 6 concentration levels within a wide range of 0.15~400 μg/mL. The limit of detection (LOD) and quantitation (LOQ) values were calculated by S/N of 3 and 10. The intra-day precision of the method was determined by testing 6 parallel samples within a day, while the inter-day precision was analyzed by testing those samples once a day for 3 consecutive days. Recovery experiments were applied, with 20, 100, and 400 μg/mL each C18 TAGs standard spiked into whey solution. The proposed method was applied in determining C18 FAs in 50 milk samples, including 20 raw milk, 15 PAS milk, and 15 UHT milk samples.
2.6. Statistical Analysis
Peak areas were obtained by manual integral with Agilent ChemStation E.02.02.1431. The results were preliminarily analyzed and sorted using Excel 2019. Statistical variance analysis and multiple comparisons were respectively analyzed by ANOVA procedure and Duncan’s method, using SAS software (version 9.4, SAS Institute). p < 0.05 was set as the significant difference. A principal component analysis (PCA) was performed with Origin 2019 (OriginLab Corporation, Northampton, MA, USA).
3. Results and Discussion
3.1. The Species of Detected C18 FAs
As shown in Figure 1, twenty-four C18 FAMEs were simultaneously detected by this proposed method, including one C18:0, eight C18:1, six C18:2 (including two CLAs), and nine C18:3 FAMEs. The resolution was improved, although there were three co-eluted peaks on the chromatogram, which were labeled as C18:1 c6/C18:1 c8, C18:3 t9,t12,c15/C18:3 t9,c12,t15, and C18:3 c9,t12,t15/C18:3 c9,c12,t15, respectively. In our study, the order of FAMEs and their isomers eluted was definitively determined in the CP-Sil 88 column, which was consistent with the report of Li et al. [31]. Briefly, fewer double bonds, the further position of the double bond towards the carboxyl terminus, and more trans double bonds led to faster elution in the CP-Sil 88 column.
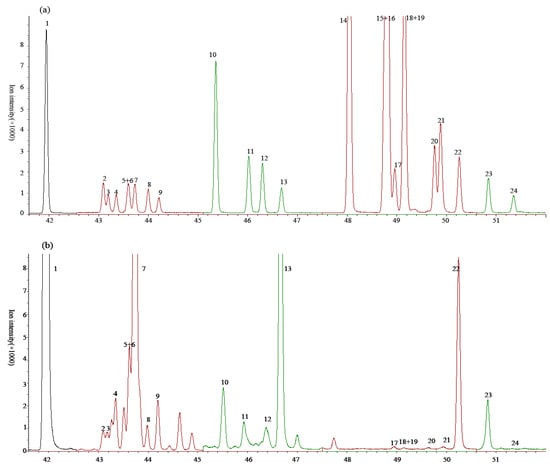
Figure 1.
Total ion chromatogram of 24 eighteen-carbon fatty acids methyl esters (C18 FAMEs) by GC-MS. (a) Standards in n-hexane; (b) in raw milk. The number of FAMEs in Table 1 are labeled on the peaks.
We focused on the predominant C18:1 and C18:2 FAs in milk, as listed in previous literature [32], as well as the C18:3 FA isomers, which have gained increasing attention due to their potential health benefits [1,10]. Besides the chromatogram (Figure 1b), we attempted various oven temperature and column pressures to separate the C18 FAMEs from the milk samples. The co-eluted peak shapes hardly changed with the resolution, which indicated other isomers were at extremely low levels or seldom existed in the co-eluted peaks.
In the literature, a few research works have focused on multiple-injection methods for good separation of all C18 FAMEs [21,23,33,34,35,36], but this was not the direction of our research, where a single-injection method with satisfactory resolution was pursued. Related research using a single-injection method is limited in the literature; Teng et al. reported a SP-2560 column was used to separate eleven C18 FAMEs, where four co-eluted peaks of C18:1 FAMEs existed [32].
Therefore, with the resolution being improved, a high-throughput GC-MS method was established to simultaneously determine C18 FAs in milk.
3.2. Methylation
The C18 FAME yields of the samples under different methylations, especially CLA, were analyzed and compared. As seen in Figure 2, with the application of additional acid-catalyzed methylation, the yields of the CLA methyl esters (CLAMEs) C18:2 c9,t11 and C18:2 t10,c12 were not obviously increased compared with the control group, and presented a fluctuation or even a slight reduction.
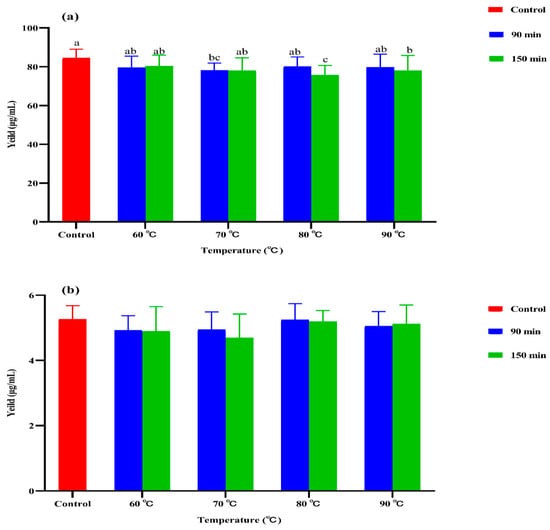
Figure 2.
CLA yields of the samples under different methylations (n = 8). (a) C18:2 c9,t11, (b) C18:2 t10,c12. The samples only treated by base-catalyzed methylation (50 °C for 20 min) were used as control. The additional acid-catalyzed methylation was performed under different reaction temperatures (60 °C, 70 °C, 80 °C, and 90 °C) and durations (90 min and 150 min). Different lowercase letters indicate a significant difference (p < 0.05). Error bars are standard deviations.
It was indicated that the additional acid-catalyzed methylation had no obvious positive effects on the yields of CLAMEs, which was consistent with the literature [27,37]. In addition, the other C18 FAs presented the same results as with CLA. As the free FAs were less than 1% of FAs in milk [38], base-catalyzed methylation was considered sufficient.
Therefore, additional acid-catalyzation was proven unnecessary in the methylation protocol C18 FA determination in milk, and the base-catalyzed methylation at 50 °C for 20 min was sufficient and considered the only required step in this method; in view of its easy-operation, and being time- and labor-saving.
3.3. Method Validation
As shown in Table 2, the LODs of C18:0, C18:1, C18:2, and C18:3 FAMEs were 9.0, 149.4~168.8, 84.9~103.0, and 30.4~44.7 μg/L, respectively. The LOQs of C18:0, C18:1, C18:2, and C18:3 FAMEs were 30.1, 498.0~562.7, 283.0~343.4 and 101.2~148.9 μg/L, respectively, which corresponded to a quantitation of at least 0.6, 9.5~10.7, 5.4~6.5, and 1.9~2.8 mg/L from milk. In that case, the relative contents corresponding to C18:0, C18:1, C18:2, and C18:3 FAs were 0.001, 0.024~0.027, 0.013~0.016, and 0.005~0.007 g/100 g total FAs, assuming a total milk fat content of about 4%.
Table 2.
Linearity, sensitivity, and precision of the proposed method.
The regression equations of all C18 FAME standard curves were established in a wide range, from 0.15 to 400 μg/mL, with their determination coefficients all above 0.998, and the linear ranges of individuals corresponding to the actual determination requirements of C18 FAs in milk. The equations were quite similar when using the same quantitative ion, especially for C18:1, C18:2, and C18:3 isomers; thus the corresponding equations were used in the quantitation of the individuals in co-eluted peaks. Due to their great abundance, C18:0 and C18:1 c9, as the two major FAs in milk, required a linear range at high levels, whereas the others were at low levels; and in this study the upper limits of calculation of C18:0 and C18:1 c9 were set at 400 μg/mL, while the lower limits of calculation of others were 0.15–0.6 μg/mL.
Based on the detected C18 FAs in the milk samples (Table 2), the inter-day RSD ranged from 2.1% to 4.6%, and the intra-day RSD ranged from 1.8% to 4.9%. According to the recovery experiments (Table 3), the recoveries ranged from 95.5% to 105.8% with variable coefficient (CV) levels of 1.8%–5.1%.
Table 3.
Recovery experiments with 4 TAGs spiked in whey solution (n = 4).
Therefore, the linearity, sensitivity, accuracy, and precision of the proposed method were satisfactory.
3.4. The Analysis of C18 FAs in Milk Samples
The contents of the C18 FAs in 20 raw milk, 15 PAS milk, and 15 UHT milk samples are listed in Table 4. In the profile of C18 FAs in these milk samples, the three greatest C18 FAs were C18:1 c9, 18:0, and C18:2 c9,c12, and the highest contents were found in raw milk samples, at 6086.4, 3026.3, and 898.1 μg/mL, respectively. The mean contents of C18:0, ∑C18:1, ∑C18:2 (excluding CLAs), and ∑C18:3 were highest in raw milk samples, while lowest in UHT milk samples. The dominated trans C18 FA was C18:1 t11, whose content was much higher in PAS milk samples and further related to the cis/trans ratio of C18:1; while these ratios were 15.1, 17.0, and 17.3 in PAS, UHT, and raw milk samples, respectively. CLA has drawn great scientific interest due to its benefits for the prevention of cardiovascular disease and modulation of immune system [1,39,40]. In our results, the mean content of ∑CLA was 135.7 μg/mL in raw milk samples from a dairy farm in Tianjin, while it was 137.4 μg/mL in PAS milk samples, and 125.9 μg/mL in UHT milk samples from Beijing markets.
Table 4.
C18 FAs content in raw milk (n = 20), PAS milk (n = 15), and UHT milk samples (n = 15).
Based on the C18 FA profile of each sample, PCA (Figure 3) was used to explore the relationships between our observations and any variables. As shown in Figure 3, the cumulative contribution rate of the first three principal components (PCs) was 69.0% (PC1(34.4%), PC2(23.4%), PC3(11.2%)). There were some overlaps between raw milk and PAS milk samples, whereas UHT milk samples were distinguished from the other milk samples. The results showed that the composition of C18 FAs was significantly affected by UHT treatment, which was reported by Ajmal et al., where UHT treatment reduced the C18:1, C18:2, and C18:3 contents of raw milk [41]. In addition, PAS treatment had little effect on the composition of C18 FAs, which was proven by Rodriguez-Alcala et al. [42]. Based on the present study, it was indicated that excessive heating could change the C18 FAs profile.
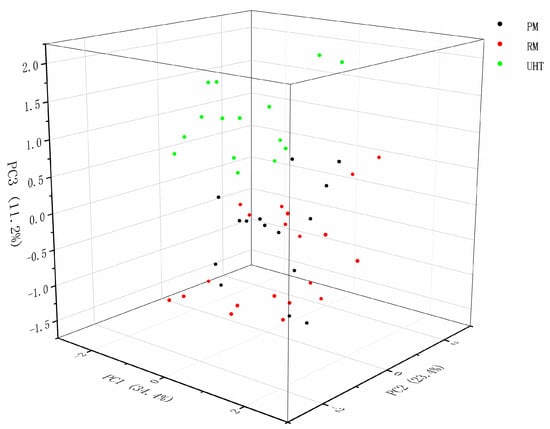
Figure 3.
The PCA score plot for the composition of C18 FAs of raw milk (n = 20), PAS milk (n = 15), and UHT milk samples (n = 15).
4. Conclusions
A GC-MS method was established for the simultaneous determination of C18 FAs in milk, with improved resolution and high sensitivity. It was proven that the base-catalyzation at 50 °C for 20 min was sufficient for methylation of C18 FAs in milk, whereas an additional acid-catalyzation was not necessary. The proposed method was validated with good sensitivity, linearity, accuracy, and precision. It achieved lower LOQs by SIM and more reasonable linear ranges, particularly the C18:0 and C18:1 c9 FAs were linear at 0.60~400 μg/mL, corresponding to their high levels in milk. The proposed method was then applied in determining C18 FAs in 20 raw milk and 30 commercial milk samples. UHT milk presented a different profile of C18 FAs from raw milk and PAS milk samples, which indicated that excessive heating could change the profile. Overall, the proposed method is a high-throughput alternative approach for the determination of C18 FAs in milk, and which presents an improvement in chromatographic resolution and sensitivity, as well as a simplification of methylation.
Author Contributions
Conceptualization, J.W.; Formal analysis, M.C.; Investigation, M.C., Y.Z.; Methodology, M.C., Y.Z., F.W., J.W.; Project administration, N.Z.; Resources, N.Z.; Supervision, Y.Z., N.Z.; Visualization, Y.Z.; Writing–original draft, M.C.; Writing–review & editing, F.W., J.W. All authors have read and agreed to the published version of the manuscript.
Funding
This research was funded by the Agricultural Science and Technology Innovation Program (ASTIP-IAS12), China Agriculture Research System of MOF and MARA, and the Scientific Research Project for Major Achievements of the Agricultural Science and Technology Innovation Program (CAAS-ZDXT2019004).
Institutional Review Board Statement
Not applicable.
Informed Consent Statement
Not applicable.
Data Availability Statement
Not applicable.
Conflicts of Interest
The authors declare no conflict of interest.
References
- Gómez-Cortés, P.; Juárez, M.; de la Fuente, M.A. Milk fatty acids and potential health benefits: An updated vision. Trends Food Sci. Technol. 2018, 81, 1–9. [Google Scholar] [CrossRef]
- Wei, W.; Jin, Q.; Wang, X. Human milk fat substitutes: Past achievements and current trends. Prog. Lipid Res. 2019, 74, 69–86. [Google Scholar] [CrossRef] [PubMed]
- Amores, G.; Virto, M. Total and Free Fatty Acids Analysis in Milk and Dairy Fat. Separations 2019, 6, 14. [Google Scholar] [CrossRef]
- Yoshinaga, K.; Asanuma, M.; Mizobe, H.; Kojima, K.; Nagai, T.; Beppu, F.; Gotoh, N. Characterization of cis- and trans-octadecenoic acid positional isomers in edible fat and oil using gas chromatography–flame ionisation detector equipped with highly polar ionic liquid capillary column. Food Chem. 2014, 160, 39–45. [Google Scholar] [CrossRef] [PubMed]
- Yoshinaga, K.; Asanuma, M.; Xu, C.; Mizobe, H.; Kojima, K.; Nagai, T.; Beppu, F.; Gotoh, N. Resolution Behavior of cis- and trans-Octadecenoic Acid Isomers by AOCS Official Method Using SP-2560 Column. J. Oleo Sci. 2013, 62, 781–788. [Google Scholar] [CrossRef][Green Version]
- Buccioni, A.; Rapaccini, S.; Antongiovanni, M.; Minieri, S.; Conte, G.; Mele, M. Conjugated linoleic acid and C18:1 isomers content in milk fat of sheep and their transfer to Pecorino Toscano cheese. Int. Dairy J. 2010, 20, 190–194. [Google Scholar] [CrossRef]
- Kramer, J.K.G.; Cruz-Hernandez, C.; Deng, Z.; Zhou, J.; Jahreis, G.; Dugan, M.E.R. Analysis of conjugated linoleic acid and trans 18:1 isomers in synthetic and animal products. Am. J. Clin. Nutr. 2004, 79, 1137S–1145S. [Google Scholar] [CrossRef]
- Shingfield, K.J.; Bernard, L.; Leroux, C.; Chilliard, Y. Role of trans fatty acids in the nutritional regulation of mammary lipogenesis in ruminants. Animal 2010, 4, 1140–1166. [Google Scholar] [CrossRef] [PubMed]
- Lanier, J.S.; Corl, B.A. Challenges in enriching milk fat with polyunsaturated fatty acids. J. Anim. Sci. Biotechnol. 2015, 6, 26. [Google Scholar] [CrossRef] [PubMed]
- Hanuš, O.; Samková, E.; Křížová, L.; Hasoňová, L.; Kala, R. Role of Fatty Acids in Milk Fat and the Influence of Selected Factors on Their Variability—A Review. Molecule 2018, 23, 1636. [Google Scholar] [CrossRef]
- Dewanckele, L.; Toral, P.; Vlaeminck, B.; Fievez, V. Invited review: Role of rumen biohydrogenation intermediates and rumen microbes in diet-induced milk fat depression: An update. J. Dairy Sci. 2020, 103, 7655–7681. [Google Scholar] [CrossRef] [PubMed]
- Waktola, H.D.; Zeng, A.X.; Chin, S.-T.; Marriott, P.J. Advanced gas chromatography and mass spectrometry technologies for fatty acids and triacylglycerols analysis. TrAC Trends Anal. Chem. 2020, 129, 115957. [Google Scholar] [CrossRef]
- Hewavitharana, G.G.; Perera, D.; Navaratne, S.; Wickramasinghe, I. Extraction methods of fat from food samples and preparation of fatty acid methyl esters for gas chromatography: A review. Arab. J. Chem. 2020, 13, 6865–6875. [Google Scholar] [CrossRef]
- Wei, G.-L.; Zeng, E.Y. Gas chromatography-mass spectrometry and high-performance liquid chromatography-tandem mass spectrometry in quantifying fatty acids. TrAC Trends Anal. Chem. 2011, 30, 1429–1436. [Google Scholar] [CrossRef]
- Perna, A.M.; Intaglietta, I.; Simonetti, A.; Gambacorta, E. The influence of casein haplotype on morphometric characteristics of fat globules and fatty acid composition of milk in Italian Holstein cows. J. Dairy Sci. 2016, 99, 2512–2519. [Google Scholar] [CrossRef]
- Trigueros, L.; Sendra, E. Fatty acid and conjugated linoleic acid (CLA) content in fermented milks as assessed by direct methylation. LWT Food Sci. Technol. 2015, 60, 315–319. [Google Scholar] [CrossRef]
- Cattani, M.; Mantovani, R.; Schiavon, S.; Bittante, G.; Bailoni, L. Recovery of n-3 polyunsaturated fatty acids and conjugated linoleic acids in ripened cheese obtained from milk of cows fed different levels of extruded flaxseed. J. Dairy Sci. 2014, 97, 123–135. [Google Scholar] [CrossRef] [PubMed]
- Tzamaloukas, O.; Orford, M.; Miltiadou, D.; Papachristoforou, C. Partial suckling of lambs reduced the linoleic and conjugated linoleic acid contents of marketable milk in Chios ewes. J. Dairy Sci. 2015, 98, 1739–1749. [Google Scholar] [CrossRef]
- Firl, N.; Kienberger, H.; Rychlik, M. Validation of the sensitive and accurate quantitation of the fatty acid distribution in bovine milk. Int. Dairy J. 2014, 35, 139–144. [Google Scholar] [CrossRef]
- Ariko, T.; Kass, M.; Henno, M.; Fievez, V.; Kärt, O.; Kaart, T.; Ots, M. The effect of replacing barley with glycerol in the diet of dairy cows on rumen parameters and milk fatty acid profile. Anim. Feed Sci. Technol. 2015, 209, 69–78. [Google Scholar] [CrossRef]
- Kramer, J.K.G.; Hernandez, M.; Cruz-Hernandez, C.; Kraft, J.; Dugan, M.E.R. Combining Results of Two GC Separations Partly Achieves Determination of All cis and trans 16:1, 18:1, 18:2 and 18:3 Except CLA Isomers of Milk Fat as Demonstrated Using Ag-Ion SPE Fractionation. Lipids 2008, 43, 259–273. [Google Scholar] [CrossRef] [PubMed]
- De la Fuente, M.A.; Rodríguez-Pino, V.; Juárez, M. Use of an extremely polar 100-m column in combination with a cyanoalkyl polysiloxane column to complement the study of milk fats with different fatty acid profiles. Int. Dairy J. 2015, 47, 52–63. [Google Scholar] [CrossRef][Green Version]
- Dreiucker, J.; Vetter, W. Fatty acids patterns in camel, moose, cow and human milk as determined with GC/MS after silver ion solid phase extraction. Food Chem. 2011, 126, 762–771. [Google Scholar] [CrossRef]
- Ecker, J.; Scherer, M.; Schmitz, G.; Liebisch, G. A rapid GC–MS method for quantification of positional and geometric isomers of fatty acid methyl esters. J. Chromatogr. B Anal. Technol. Biomed. Life Sci. 2012, 897, 98–104. [Google Scholar] [CrossRef] [PubMed]
- Zhang, L.; Li, P.; Sun, X.; Hu, W.; Wang, X.; Zhang, Q.; Ding, X. Untargeted fatty acid profiles based on the selected ion monitoring mode. Anal. Chim. Acta 2014, 839, 44–50. [Google Scholar] [CrossRef]
- Liu, Z.; Rochfort, S.; Cocks, B. Milk lipidomics: What we know and what we don’t. Prog. Lipid Res. 2018, 71, 70–85. [Google Scholar] [CrossRef]
- Liu, Z.; Ezernieks, V.; Rochfort, S.; Cocks, B. Comparison of methylation methods for fatty acid analysis of milk fat. Food Chem. 2018, 261, 210–215. [Google Scholar] [CrossRef]
- Association of Official Analytical Chemists. AOAC Fat (Total, Saturated, and Unsaturated) in Foods. Hydrolytic Extraction Gas Chromatographic Method; AOAC Official Method 996.06; AOAC International: Arlington VA, USA, 2002. [Google Scholar]
- Serafim, V.; Tiugan, D.A.; Andreescu, N.; Mihailescu, A.; Paul, C.; Velea, I.; Puiu, M.; Niculescu, M.D. Development and Validation of a LC-MS/MS-Based Assay for Quantification of Free and Total Omega 3 and 6 Fatty Acids from Human Plasma. Molecules 2019, 24, 360. [Google Scholar] [CrossRef]
- ICH Harmonized Tripartite Guideline. Validation of Analytical Procedures: Text and Methodology Q2(R1); ICH: Geneva, Switzerland, 2005. [Google Scholar]
- Li, T.; Guo, Q.; Qu, Y.; Li, Y.; Wang, X.; Sun, Z.; Wang, Q. An improved gas chromatography-based approach for characterisation of fatty acids in fresh basil seed oil. Int. J. Food Sci. Technol. 2021, 56, 2492–2503. [Google Scholar] [CrossRef]
- Teng, F.; Wang, P.; Yang, L.; Ma, Y.; Day, L. Quantification of Fatty Acids in Human, Cow, Buffalo, Goat, Yak, and Camel Milk Using an Improved One-Step GC-FID Method. Food Anal. Methods 2017, 10, 2881–2891. [Google Scholar] [CrossRef]
- Ratnayake, W.M.N.; Hansen, S.L.; Kennedy, M.P. Evaluation of the CP-Sil 88 and SP-2560 GC columns used in the recently approved AOCS official method Ce 1h-05: Determination of cis-, trans-, saturated, monounsaturated, and polyunsaturated fatty acids in vegetable or non-ruminant animal oils and fats by capillary GLC method. J. Am. Oil Chem. Soc. 2006, 83, 475–488. [Google Scholar]
- Hauff, S.; Vetter, W. Quantitation of cis- and trans-Monounsaturated Fatty Acids in Dairy Products and Cod Liver Oil by Mass Spectrometry in the Selected Ion Monitoring Mode. J. Agric. Food Chem. 2009, 57, 3423–3430. [Google Scholar] [CrossRef] [PubMed]
- Delmonte, P.; Kia, A.-R.F.; Kramer, J.K.; Mossoba, M.M.; Sidisky, L.; Rader, J.I. Separation characteristics of fatty acid methyl esters using SLB-IL111, a new ionic liquid coated capillary gas chromatographic column. J. Chromatogr. A 2011, 1218, 545–554. [Google Scholar] [CrossRef]
- Delmonte, P.; Fardin-Kia, A.R.; Kramer, J.K.; Mossoba, M.M.; Sidisky, L.; Tyburczy, C.; Rader, J.I. Evaluation of highly polar ionic liquid gas chromatographic column for the determination of the fatty acids in milk fat. J. Chromatogr. A 2012, 1233, 137–146. [Google Scholar] [CrossRef]
- Liu, Z.; Wang, J.; Li, C.; Rochfort, S. Development of one-step sample preparation methods for fatty acid profiling of milk fat. Food Chem. 2020, 315, 126281. [Google Scholar] [CrossRef] [PubMed]
- Haug, A.; Høstmark, A.T.; Harstad, O.M. Bovine milk in human nutrition—A review. Lipids Health Dis. 2007, 6, 25. [Google Scholar] [CrossRef] [PubMed]
- Fuke, G.; Nörnberg, J.L. Systematic evaluation on the effectiveness of conjugated linoleic acid in human health. Crit. Rev. Food Sci. Nutr. 2015, 57, 1–7. [Google Scholar] [CrossRef] [PubMed]
- Shokryazdan, P.; Rajion, M.A.; Meng, G.Y.; Boo, L.J.; Ebrahimi, M.; Royan, M.; Sahebi, M.; Azizi, P.; Abiri, R.; Jahromi, M.F. Conjugated linoleic acid: A potent fatty acid linked to animal and human health. Crit. Rev. Food Sci. Nutr. 2015, 57, 2737–2748. [Google Scholar] [CrossRef]
- Ajmal, M.; Nadeem, M.; Imran, M.; Junaid, M. Lipid compositional changes and oxidation status of ultra-high temperature treated Milk. Lipids Health Dis. 2018, 17, 227. [Google Scholar] [CrossRef] [PubMed]
- Rodríguez-Alcalá, L.M.; Alonso, L.; Fontecha, J. Stability of fatty acid composition after thermal, high pressure, and microwave processing of cow milk as affected by polyunsaturated fatty acid concentration. J. Dairy Sci. 2014, 97, 7307–7315. [Google Scholar] [CrossRef]


Publisher’s Note: MDPI stays neutral with regard to jurisdictional claims in published maps and institutional affiliations. |
© 2021 by the authors. Licensee MDPI, Basel, Switzerland. This article is an open access article distributed under the terms and conditions of the Creative Commons Attribution (CC BY) license (https://creativecommons.org/licenses/by/4.0/).