Abstract
Smokeless tobacco products and nicotine-containing tobacco-free oral pouches have increased in popularity in recent years. They are associated with far fewer health hazards compared to cigarettes. Nicotine pouches are filled with non-tobacco filler and nicotine. The nicotine used in nicotine pouches usually comes from the extraction of tobacco; thus, related alkaloids may be found as impurities at low levels. Moreover, nicotine degradation products are formed because of microbial action, flavor oxidation, exposure to high temperatures etc. Currently, there are no published or recommended methods for the analysis of nicotine degradants in nicotine pouches. Here, we present a sensitive and selective liquid chromatography–tandem mass spectrometry method for the simultaneous determination of seven nicotine-related impurities. All seven analytes and corresponding deuterated internal standards were separated within 3.5 min, including 1 min equilibration. The method was fully validated, showing good linearity with correlation coefficients >0.996 for all analytes, good extraction yields ranging from 78% to 110%, limits of detection between 0.08 and 0.56 µg/g and limits of quantification between 0.27 and 2.04 µg/g. Although the method was mainly developed to determine the degradants of nicotine in nicotine pouches, it was validated and performed well on a broader range of tobacco-containing products.
1. Introduction
Nicotine-containing tobacco-free oral pouches belong to a new product category that has gained market shares in recent years [1]. The nicotine pouches are similar to snus, but they contain different non-tobacco fillers and nicotine instead of tobacco leaves. Additionally, the nicotine pouches usually contain pH adjusters, processing aids, artificial sweeteners, flavors, fibers (pouch material) and stabilizers. These products come in a variety of flavors and nicotine content, as well as brand names such as ZYN®, Velo and on!®, manufactured by different manufacturers. Although the long-term health effects of nicotine pouches have not been established yet, it is suggested that they are less harmful than cigarettes [2].
The nicotine used in the manufacturing of nicotine pouches is usually extracted from the tobacco plant; thus, related alkaloids (e.g., nornicotine, anatabine and anabasine) may be found as impurities in small quantities [3]. Moreover, due to environmental factors such as temperature, humidity, light and storage containers, the degradation of nicotine may occur, giving rise to the formation of nicotine degradation products (e.g., cotinine, nicotine-N’-oxide, myosmine and β-nicotyrine) [4]. In the US and European pharmacopoeias, there are recommendations for the purity of nicotine used in pharmaceutical products [5,6] but not in other nicotine-containing products. The nicotine impurities are specified in the European Pharmacopoeia monograph 1452 as nicotine-N’-oxide, cotinine, nornicotine, anatabine, myosmine, anabasine and β-nicotyrine, while the US Pharmacopeia (USP)-grade nicotine requires single impurities to be less than 0.5% (5 mg/g) and total impurities to be less than 1% (10 mg/g) [5,6].
There are several methods to determine the levels of nicotine and its metabolites (e.g., cotinine, nicotine-N’-oxide, nornicotine) using liquid chromatography coupled to tandem mass spectrometry (LC–MS/MS) in human urine [7,8,9] as well as plasma, semen and sperm by using LC–Orbitrap–MS [10]. Nicotine and related alkaloids (anabasine, anatabine) have also been determined using gas chromatography coupled to flame ionization detection (FID), nitrogen–phosphorus detection (NPD) and MS in tobacco-containing products and tobacco smoke [11,12,13,14]. Several methods are also available for the analysis of nicotine-related alkaloids and impurities in electronic cigarette liquids, cartridges and aerosols [4,15,16,17].
However, there are currently no published or recommended methods available for the analysis of nicotine impurities in nicotine pouches. The above-mentioned methods have not been investigated, and may not be entirely suitable for the analysis of nicotine pouches due to differences in their matrix composition. In this paper, we describe a sensitive and selective method using LC–MS/MS for the simultaneous determination of seven nicotine impurities in four nicotine pouch products, as well as five tobacco products (namely, CORESTA Smokeless Tobacco Reference Products CRP 1.1, CRP 2.1, CRP 3.1, CRP 4.1 and a cigar). Although there are no regulatory requirements or recommendations for these impurities in nicotine products, the method can be used for quality control purposes (e.g., to check the purity of nicotine, as well as for stability studies of nicotine pouches by monitoring the degradation of nicotine).
2. Materials and Methods
2.1. Standards and Reagents
Standards of nicotine-N’-oxide, nornicotine, anabasine, anatabine, cotinine, myosmine, β-nicotyrine, nicotine-N’-oxide-d3, nornicotine-d4, anabasine-d4, anatabine-d4, cotinine-d3, myosmine-d4 and β-nicotyrine-d3 (purity >95% for all standards) were purchased from Toronto Research Chemicals (Toronto, ON, Canada). Acetonitrile (ACN) (HPLC grade), isopropanol (HPLC grade), formic acid (98–100%, p.a. grade), ammonium formate (LC–MS grade), ammonium hydroxide (25%, LC–MS grade) and acetic acid (LC–MS grade) were obtained from VWR, Radnor, PA, USA. Methanol (MeOH) (HPLC grade) was purchased from Fisher Scientific, Waltham, MA, USA. Water was purified using a Milli-Q® Integral 3 (Millipore SAS, Molsheim, France) water purification system equipped with a Millipak® Express 40 0.22 µm membrane filter (Millipore Corp., Burlington, MA, USA).
Stock solutions with concentrations of approximately 1 mg/mL in methanol were prepared for all the standards and the internal standards, respectively. Intermediate standard solutions were prepared from the stock solutions at three concentration levels, 1, 20 and 200 µg/mL. An intermediate standard solution was prepared for the internal standards as well, containing 18.75 μg/mL of β-nicotyrine-d3 and myosmine-d4 and 6.25 μg/mL of residual internal standards. Six (seven for nicotine-N’-oxide) calibration standards dissolved in 0.2% ammonium hydroxide were also prepared. Stock solutions and intermediate standard solutions were stored in a freezer (−18 °C). Calibration standard solutions were stored in a refrigerator (4–6 °C).
2.2. Sample Handling and Preparation
The CRP samples were stored at approximately −20 °C until analyses were performed, as recommended by CORESTA [18]. Prior to analysis, the CRPs were placed in a refrigerator for 24 h and then equilibrated to ambient conditions before opening. After opening, the samples were placed in a sealed container for short-term storage in the refrigerator. The nicotine pouches and cigar were handled in the same way as the CRPs. It was also noticed that the storage of nicotine pouches prior to re-analysis played a significant role in obtaining accurate results. After opening, it is not recommended to store these samples in the freezer.
An amount of 1.0 ± 0.2 g sample was weighed out in a 100 mL Erlenmeyer flask. The nicotine and CRP 1.1 pouches were cut in two lengthwise. CRP 2.1, CRP 3.1 and CRP 4.1 were weighted out as is, without grinding, while the cigar was ground to obtain a homogeneous sample. A total of 100 μL of internal standard solution and 50 mL of extraction solution (100 mM ammonium formate buffer (pH 3)) were added to the sample. The sample was then shaken on an orbital shaker for 40 min at 130 rpm and then allowed to settle for about 5 min to facilitate filtering. A total of 100 μL of sample solution was transferred to a filter vial (0.2 μm Whatman Mini-UniPrep, Fisher Scientific, USA), while 400 μL 0.3 M ammonium hydroxide was added with Multipette.
2.3. Chromatographic and Mass Spectrometric Conditions
The analyses were performed on a UPLC system from Waters Corp., Milford, CT, USA, consisting of an Acquity I-Class UPLC with binary pumps, fitted with an Acquity Sample manager with a cooling system, an auto-injector with a flow-through needle injection and a column switch with a column oven. The chromatographic separation was performed on a Waters Acquity UPLC BEH C18 column, 2.1 mm × 100 mm, 1.7 µm particle size (Part # 186002352) connected to a Waters pre-filter (Assay, Frit, 0.2 µm, 2.1 mm, part. No. 289002078). Mobile phase A was 0.1% ammonium hydroxide, 10 mM ammonium acetate buffer in MQ water; mobile phase B was 0.1% ammonium hydroxide, 10 mM ammonium acetate buffer in ACN. The injection volume was 1 μL, and the mobile phase flow rate was set to 600 μL/min. The gradient condition used was as follows: initial 7% B, 0.2 min 7% B, 1.25 min 45% B, 1.80 min 45% B, 2.20 min 98% B, 2.50 min 98% B and 2.51 min 7% B. The system was equilibrated for 1 min with 7% B before each run.
The MS system was a Waters Xevo TQ-XS, and the MS parameters were set as follows: capillary voltage 0.50 kV, cone voltage 30 V, desolvation 1000 L/h, cone 150 L/h, nebulizer 7 bar, collision gas flow 0.15 mL/min, desolvation temperature 600 °C and source temperature 150 °C. The dwell time for each transition was 0.150 s, except for the transitions of β-nicotyrine and β-nicotyrine-d3 that had dwell times of 0.041 s. Quantitative analyses were performed in MS/MS mode. The analyte-specific parameters are shown in Table 1. Data were acquired and processed with Waters MassLynx (Ver. 4.2.; Waters Corp., Milford, CT, USA).

Table 1.
Collision energies, retention times, quantification and confirmation traces.
3. Results and Discussion
3.1. UPLC–MS/MS Analysis
The analytes were separated within 2.0 min with a total run time of 3.5 min (including 1 min equilibration) and most peaks were well resolved. Example chromatograms with multiple reaction monitoring (MRM) transitions for the analytes in a standard mixture are shown in Figure 1. Only anabasine and myosmine could not be separated; however, due to different MRM transitions, each of them could be correctly quantified.
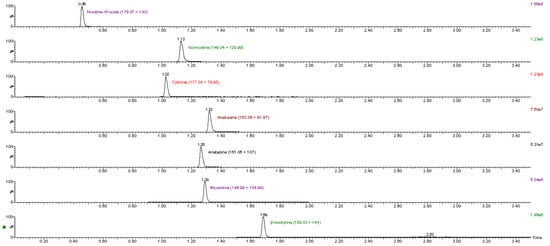
Figure 1.
MRM transitions for all analytes in calibration standard 3.
The ionization of the analytes was examined in both positive and negative modes. However, ionization was better in positive mode for all the analytes. The optimal instrumental parameters for each analyte were obtained by tuning, using direct infusion of individual standard solutions. The analytes and the deuterated internal standards were divided into three time windows in order to increase the dwell times and the signal intensity of each compound. Two MRM transitions were generated, for quantification and confirmation purposes, respectively. The identification of the analytes in samples was based on a comparison of MRM transitions and retention times with pure standard solutions. Individual deuterated internal standards were used for each analyte.
3.2. Method Validation
Samples of nine different matrices were used in the method validation procedure, four nicotine pouch products described in Table 2, Swedish-style snus pouches (CRP 1.1), American-style loose moist snuff (CRP 2.1), American-style loose dry snuff powder (CRP 3.1), American-style loose leaf chewing tobacco (CRP 4.1) and a cigar. Since most of the analytes were not detected in the nicotine pouches, the pouches were spiked before the extraction using the intermediate standard solutions. All the matrices were included in the validation experiments to determine repeatability, detection and quantification limits, matrix effects and extraction recoveries. An extended validation was performed using three of the matrices (CRP 1.1, CRP 2.1 and nicotine pouch product 1 (NP1)) to also determine within-laboratory precision and accuracy of the method.
Table 2.
Description of nicotine pouch products.
3.2.1. Linearity and Detection Limits
Linearity was investigated by analyzing six standard solutions three times in a row on the same day in concentrations of 4–800 ng/mL for nornicotine, anatabine and anabasine; in concentrations of 4–400 ng/mL for myosmine, β-nicotyrine and cotinine; and in concentrations of 4–1000 ng/mL for nicotine-N’-oxide. The linearity of all analytes was good with a correlation coefficient >0.996, while the relative residuals were less than 15% when the standard curves were weighted by 1/y.
The limits of detection (LODs) and limits of quantification (LOQs) for the different analytes were calculated in all matrices. The signal/noise (S/N) ratio was measured with RMS (root mean square) in the MassLynx software and was used to calculate the LOD and the LOQ. For the analytes with concentrations <LOD in some matrices, the S/N was calculated from the accuracy data (spiked level 1). The LOD was determined as the concentration where S/N = 3. Similarly, the LOQ was determined as the concentration where S/N = 10. The LOD and the LOQ varied in the different matrices, but Table 3 shows the highest LOD and LOQ values for each analyte.
Table 3.
LOD and LOQ for all analytes in μg/g.
3.2.2. Repeatability, Within-Laboratory Precision and Accuracy
Repeatability was estimated by preparing and analyzing six replicates for each matrix at one time point. The pooled relative standard deviations (%RSDs) are listed in Table 4. For nicotine pouches, due to analyte concentrations <LOD, the estimation of %RSD was based on spiked samples.
Table 4.
%RSD pool for repeatability.
Within-laboratory precision was determined by four laboratory technicians analyzing three replicates of three matrices (CRP 1.1, CRP 2.1 and NP1) at six different time points. New extraction solutions, mobile phases and internal standard solutions were also prepared and used. The %RSDs for the different matrices are listed in Table 5 and were higher in NP1 compared to the other two matrices, probably because the same cans were used and re-opened several times during the time the analyses were carried out.
Table 5.
Within-laboratory precision (%RSD).
Accuracy was determined by spiking three matrices (CRP 1.1, CRP 2.1 and NP1) with all analytes at three concentration levels. Six replicates at each level and six unspiked replicates were analyzed. The analyte concentrations for accuracy experiments were calculated using internal standards and relative response factors. Table 6 provides a summary of the accuracy of all analytes in the three matrices. Cotinine for CRP 2.1 had the lowest accuracy, between 52% and 63%, which is probably due to the matrix composition.
Table 6.
Accuracy data (%) for CRP 1.1, CRP 2.1 and NP1.
3.2.3. Matrix Effects and Extraction Yields
In order to investigate the matrix effects and extraction yields, all matrices were spiked with each analyte prior to sample preparation, in prepared extracts and in pure extraction solution.
The absolute matrix effects were determined by comparing the areas of analytes in matrices spiked after sample preparation with areas in standards in pure extraction solution without using the internal standards, by single-point calculation. Unfortified extracts were used for area subtraction for the analytes. The matrix effects are presented in Table 7 and were at reasonable levels for CRP 2.1, CRP 4.1 and the nicotine pouches for most analytes. Ion suppression was observed for CRP 3.1 and cigar matrices for some analytes, while ion enhancement was observed for CRP 1.1 for some analytes. However, the deuterated internal standards compensated well for the matrix effects.
Table 7.
Matrix effects (%) for all matrices.
The extraction yields (irrespective of matrix effects in the detector) were determined by comparing the peak areas of analytes in matrices spiked before sample preparation with peak areas in samples spiked after the sample preparation, without using the internal standards, by single point calculation. The extraction yields were good, ranging between 78% and 110% for all analytes and matrices. The extraction yields are presented in Table 8.
Table 8.
Extraction yields (%) for all matrices.
3.2.4. Cross Talk/Carry-Over
To verify that cross talk did not occur, the analyte solutions were injected without internal standards, and the MRM transitions for the analytes and internal standards were monitored to verify that no ions were detected from the analytes giving rise to a peak for the internal standards and the reverse. No (negligible, <1% of the standard peak) peaks were detected; consequently, it can be concluded that cross talk did not occur.
Carry-over was checked by injecting the strongest calibration standard. A blank was injected after the calibration standard. No (negligible, <1% of the standard peak) peaks were detected in the blank injections, which is consistent with no carry-over effect.
3.2.5. Stability of Sample Extracts and Standard Solutions
The stability of the prepared samples in the auto-injector (4 °C) or refrigerator (4–6 °C) was investigated by analyzing samples immediately after preparation and after 3, 7 and 14 days. The samples were stored in vials with perforated and unperforated septa. The results revealed that the samples were stable for at least seven days in vials with unperforated septa and only three days in vials with perforated septa.
The stability of stock and calibration standard solutions was investigated as well, showing a shelf life of 1 year for stock and intermediate solutions stored in a freezer (−18 °C) and 6 months for the calibration standards stored in a refrigerator (4–6 °C).
3.3. Analysis of Samples
As mentioned above, nine different matrices were used in the method validation procedure. All the analytes were detected in the tobacco-containing matrices (CRP 1.1–CRP 4.1 and cigar). Most of the analytes were also detected in the nicotine pouch products, however, they were at lower levels compared to tobacco-containing matrices. Nicotine-N’-oxide was detected in all nicotine pouch products, while β-nicotyrine was not detected in any of the nicotine pouch products. Almost all the analytes (except for β-nicotyrine) were detected in NP4, while only nicotine-N’-oxide was detected in NP1. The analyte concentrations of nicotine-N’-oxide ranged from 2.6 μg/g to 820 μg/g, for nornicotine from 2.1 to 340 μg/g, for anatabine from 1.2 to 260 μg/g, for cotinine from 1.2 to 130 μg/g, for β-nicotyrine from 3.3 to 59 μg/g, for anabasine from 2.9 to 56 μg/g and for myosmine from 1.3 to 10 μg/g in the different matrices. Table 9 shows a summary of all analytes and their concentrations in the nine matrices. A representative chromatogram of a sample, CRP 1.1, is shown in Figure 2. The highest analyte concentrations were detected in the cigar and CRP 3.1 matrices, except for nornicotine, with the highest concentration detected in CRP 4.1. Except for nicotine pouches, CRP 1.1 had the lowest concentrations of all analytes.
Table 9.
Determined concentrations (μg/g) of the analytes (n = 3) in the different matrices.
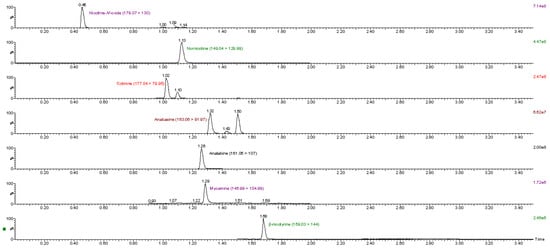
Figure 2.
MRM transitions of analytes detected in CRP 1.1.
4. Conclusions
A simple and rapid method for the analysis of nicotine-related impurities using UPLC–MS/MS was developed in the present study for nicotine pouch products and five other tobacco-containing matrices. The simultaneous determination of seven nicotine impurities and seven internal standards with a total run time of 3.5 min could be performed with high precision and low LOD and LOQ. Extraction recoveries were good, and matrix effects were small for most of the matrices used in the validation. Although the method was mainly developed to determine nicotine impurities in nicotine pouches, it was validated and performed well for a broader range of nicotine-containing matrices. All the analytes were detected in varying concentrations in the different matrices; however, the concentrations of analytes were lower in the nicotine pouch products compared to the tobacco-containing matrices. There are several methods available for the determination of nicotine degradants, metabolites and alkaloids in various matrices, but this method was developed and adjusted for the analysis of nicotine pouches and the relatively low concentrations of analytes that might be present there [5,6]. Another advantage of this method is that the corresponding deuterated internal standards were used for all the analytes, which compensate well for both the losses in the extraction procedure and the matrix effects. This method could be useful for quality control purposes (e.g., to check the purity of nicotine), as well as for stability studies of nicotine pouches by monitoring nicotine degradation. The method could also be used to compare nicotine pouches with tobacco-containing products (e.g., CRPs).
Author Contributions
Conceptualization, R.A. and J.L.; methodology, R.A. and M.S.; formal analysis, R.A.; validation, R.A.; writing—original draft preparation, R.A.; writing—review and editing, R.A., M.S. and J.L.; visualization, M.S. All authors have read and agreed to the published version of the manuscript.
Funding
This research received no external funding.
Institutional Review Board Statement
Not applicable.
Informed Consent Statement
Not applicable.
Data Availability Statement
Data can be provided by authors upon request.
Acknowledgments
Johan Patring, Johan Redeby and Anna Masser are acknowledged for kindly reading and reviewing the article.
Conflicts of Interest
The authors declare no conflict of interest.
References
- Delnevo, C.D.; Hrywna, M.; Miller Lo, E.J.; Wackowski, O.A. Examining market trends in smokeless tobacco sales in the United States: 2011–2019. Nicotine Tob. Res. 2020. [Google Scholar] [CrossRef] [PubMed]
- Fisher, M.T.; Tan-Torres, S.M.; Gaworski, C.L.; Black, R.A.; Sarkar, M.A. Smokeless tobacco mortality risks: An analysis of two contemporary nationally representative longitudinal mortality studies. Harm. Reduct. J. 2019, 16, 27. [Google Scholar] [CrossRef] [PubMed]
- Hukkanen, J.; Jacob, P.; Benowitz, N.L. Metabolism and Disposition Kinetics of Nicotine. Pharmacol. Rev. 2005, 57, 79–115. [Google Scholar] [CrossRef] [PubMed]
- Etter, J.F.; Zäther, E.; Svensson, S. Analysis of refill liquids for electronic cigarettes. Addiction 2013, 108, 1671–1679. [Google Scholar] [CrossRef]
- United States Pharmacopeia and the National Formulary. USP 38-NF 33; The United States Pharmacopeial Convention Inc.: Rockville, MD, USA, 2015. [Google Scholar]
- Council of Europe. European Pharmacopoeia 7.0; European Directorate for the Quality of Medicines and Healthcare: Strasbourg, France, 2012. [Google Scholar]
- Marclay, F.; Saugy, M. Determination of nicotine and nicotine metabolites in urine by hydrophilic interaction chromatography–tandem mass spectrometry: Potential use of smokeless tobacco products by ice hockey players. J. Chromatogr. A 2010, 1217, 7528–7538. [Google Scholar] [CrossRef]
- Xu, X.; Iba, M.M.; Weisel, C.P. Simultaneous and sensitive measurement of anabasine, nicotine, and nicotine metabolites in human urine by liquid chromatography–tandem mass spectrometry. Clin. Chem. 2004, 50, 2323–2330. [Google Scholar] [CrossRef] [PubMed][Green Version]
- Meger, M.; Meger-Kossien, I.; Schuler-Metz, A.; Janket, D.; Scherer, G. Simultaneous determination of nicotine and eight nicotine metabolites in urine of smokers using liquid chromatography–tandem mass spectrometry. J. Chromatogr. B 2002, 778, 251–261. [Google Scholar] [CrossRef]
- Abu-awwad, A.; Arafat, T.; Schmitz, O.J. Simultaneous determination of nicotine, cotinine, and nicotine N-oxide in human plasma, semen, and sperm by LC-Orbitrap MS. Anal. Bioanal. Chem. 2016, 408, 6473–6481. [Google Scholar] [CrossRef] [PubMed]
- Sheng, L.Q.; Ding, L.; Tong, H.W.; Yong, G.P.; Zhou, X.Z.; Liu, S.M. Determination of nicotine-related alkaloids in tobacco and cigarette smoke by GC-FID. Chromatographia 2005, 62, 63–68. [Google Scholar] [CrossRef]
- Cai, J.; Liu, B.; Lin, P.; Su, Q. Fast Analysis of Nicotine Related Alkaloids in Tobacco and Cigarette Smoke by Megabore Capillary Gas Chromatography. J. Chromatogr. A 2003, 1017, 187–193. [Google Scholar] [CrossRef] [PubMed]
- Yang, S.S.; Smetena, S.I.; Huang, C. Determination of Tobacco Alkaloids by Gas Chromatography with Nitrogen–Phosphorus Detection. Anal. Bioanal. Chem. 2002, 373, 839–843. [Google Scholar] [CrossRef] [PubMed]
- Lisko, J.G.; Stanfill, S.B.; Duncan, B.W.; Watson, C.H. Application of GC-MS/MS for the Analysis of Tobacco Alkaloids in Cigarette Filler and Various Tobacco Species. Anal. Chem. 2013, 85, 3380–3384. [Google Scholar] [CrossRef] [PubMed]
- Liu, X.; Joza, P.; Rickert, B. Analysis of nicotine and nicotine-related compounds in electronic cigarette liquids and aerosols by liquid chromatography-tandem mass spectrometry. Beiträge Tab. Int. Contrib. Tob. Res. 2017, 27, 154–167. [Google Scholar] [CrossRef]
- Famele, M.; Palmisani, J.; Ferranti, C.; Abenavoli, C.; Palleschi, L.; Mancinelli, R.; Fidente, R.M.; de Gennaro, G.; Draisci, R. Liquid chromatography with tandem mass spectrometry method for the determination of nicotine and minor tobacco alkaloids in electronic cigarette refill liquids and second-hand generated aerosol. J. Sep. Sci. 2017, 40, 1049–1056. [Google Scholar] [CrossRef] [PubMed]
- Flora, J.W.; Wilkinson, C.T.; Sink, K.M.; McKinney, D.L.; Miller, J.H. Nicotine-related impurities in e-cigarette cartridges and refill e-liquids. J. Liq. Chrom. Relat. Tech. 2016, 39, 821–829. [Google Scholar] [CrossRef]
- CORESTA. Available online: https://www.coresta.org/coresta-smokeless-tobacco-reference-products (accessed on 6 April 2021).


Publisher’s Note: MDPI stays neutral with regard to jurisdictional claims in published maps and institutional affiliations. |
© 2021 by the authors. Licensee MDPI, Basel, Switzerland. This article is an open access article distributed under the terms and conditions of the Creative Commons Attribution (CC BY) license (https://creativecommons.org/licenses/by/4.0/).