Article

Sintered Glass Monoliths as Supports for Affinity Columns

1
Division 1.5 Protein Analysis, Federal Institute for Materials Research and Testing (BAM), Richard-Willstätter-Strasse 11, 12489 Berlin, Germany
2
Division 6.3 Structure Analysis, Federal Institute for Materials Research and Testing (BAM), Richard-Willstätter-Strasse 11, 12489 Berlin, Germany
*
Author to whom correspondence should be addressed.
Separations 2021, 8(5), 56; https://doi.org/10.3390/separations8050056
Submission received: 9 March 2021 / Revised: 7 April 2021 / Accepted: 25 April 2021 / Published: 30 April 2021

Abstract

:
A novel stationary phase for affinity separations is presented. This material is based on sintered borosilicate glass readily available as semi-finished filter plates with defined porosity and surface area. The material shows fast binding kinetics and excellent long-term stability under real application conditions due to lacking macropores and high mechanical rigidity. The glass surface can be easily modified with standard organosilane chemistry to immobilize selective binders or other molecules used for biointeraction. In this paper, the manufacturing of the columns and their respective column holders by 3D printing is shown in detail. The model system protein A/IgG was chosen as an example to examine the properties of such monolithic columns under realistic application conditions. Several specifications, such as (dynamic) IgG capacity, pressure stability, long-term performance, productivity, non-specific binding, and peak shape, are presented. It could be shown that due to the very high separation speed, 250 mg antibody per hour and column can be collected, which surpasses the productivity of most standard columns of the same size. The total IgG capacity of the shown columns is around 4 mg (5.5 mg/mL), which is sufficient for most tasks in research laboratories. The cycle time of an IgG separation can be less than 1 min. Due to the glass material’s excellent pressure resistance, these columns are compatible with standard HPLC systems. This is usually not the case with standard affinity columns, limited to manual use or application in low-pressure systems. The use of a standard HPLC system also improves the ability for automation, which enables the purification of hundreds of cell supernatants in one day. The sharp peak shape of the elution leads to an enrichment effect, which might increase the concentration of IgG by a factor of 3. The final concentration of IgG can be around 7.5 mg/mL without the need for an additional nanofiltration step. The purity of the IgG was > 95% in one step and nearly 99% with a second polishing run.

Graphical Abstract

1. Introduction

Many different stationary phases or supports have been used for sample preparation and chromatographic applications. In the field of HPLC, silica-based materials are prevailing; in FPLC, dextran- or agarose-based materials seem to be used most frequently. For affinity separations [1,2], crosslinked dextrans, agaroses [3], celluloses, silica materials, acrylic, and epoxide polymers [4], porous glass, and many others can be used, all with their pros and cons [5,6]. Also, cryogels, hydrogels, and hybrid materials have been suggested [7]. The emergence of monolithic materials was considered a major step for more advanced stationary phases [8,9,10,11,12]. Their usefulness for affinity separations was acknowledged, and the main solid supports were discussed in a review [13]. Although some commercial products are available [14], they could not gain a large market share yet. Some of their drawbacks seem to be their difficult manufacturing and the occurrence of radial pore gradients. Their low back-pressure was acknowledged as an advantage. However, their overall performance was not superior to conventional materials, particularly compared to modern UHPLC materials with small particles or core-shell structures. For affinity separations, soft materials in the form of beads are most common, which require quite low flow rates and very limited pressure. This also requires relatively large bead diameters, which causes peak broadening and hence slow kinetics. Also, most materials are not suitable for high-resolution separations and are not compatible with high-pressure systems, such as HPLC or UHPLC systems. Therefore, we aimed to develop a stationary phase mainly for affinity applications [15,16], which would overcome these limitations. First, we tried to use porous glass [17] for this purpose, which turned out to be an excellent material for affinity separations. However, the problematic commercial availability and high cost motivated us to look for alternatives. Among other materials, we tested sintered borosilicate glass (Figure 1), which is a proven material for filtration (fritted glass) and other purposes for many decades. These products are based on cheap borosilicate glass powder and are produced commercially in high volumes. Hence, the price of such materials is quite low.
Another advantage is the nearly complete lack of spatial inhomogeneity due to the bulk preparation of the semi-finished sintered plates, from which the monolithic borosilicate cylinders are drilled with a diamond tool. Here, we show the preparation of affinity columns in a step-by-step protocol, their respective holders, and their coating with biochemical ligands, such as protein A and the application for the analytical determination of IgG and the preparative isolation of IgG from human plasma (see Supplementary Material). The same columns were used both in low-pressure (FPLC) and high-pressure (HPLC) systems. Reproducibility and other characteristic parameters were determined. High-speed separations down to 60 s could be shown, and 100 regeneration cycles have been performed without significant activity losses. Extrapolated from these data, the system might be useful for several thousand separation cycles. These columns can be used for semipreparative purposes, such as the fast and automated purification of some milligrams of an antibody, or for analytical purposes to quantify IgG precisely in a sample or lab-scale product.

2. Materials and Methods

2.1. Biochemicals

LyoPlas N-w (lyophilized human plasma) was obtained from Deutsches Rotes Kreuz (Essen, Germany). Recombinant protein A was obtained from ProSpec (Staphylococcal Protein-A 41 kDa, pro-774). Adalimumab (Humira obtained from Evidentic, Berlin, Germany, 100 mg/mL); Albumin from Bovine Serum (BSA, Sigma-Aldrich, Taufkichen, Germany, A7906-100G); Bevacizumab (Avastin obtained from Evidentic, 25 mg/mL); Serva Triple Color Protein standard III (Serva, Heidelberg, Germany, 39258.01). Buffers: PBS (10× powder, from AppliChem, Darmstadt, Germany, A0965,9010); binding buffer: Na2HPO4 · 2 H2O (8.7 mM), NaH2PO4 · 2 H2O (3.3 mM), pH 7.4; elution buffer: NaH2PO4 · 2 H2O (6.0 mM), H3PO4 (6.0 mM), pH 2.3; 4x loading buffer for SDS-PAGE (non-reducing): glycerol (40%), Tris-Base (1 M, pH 6.8) (25%), sodium dodecyl sulfate SDS (8%), bromophenol blue (0.02%); SDS running buffer (10×): tris-base (250 mM), glycine (1.92 M), SDS (1%); Tris-HCl buffer (Tris-base, 100 mM, pH 6.0 with HCl, Promega, Mannheim, Germany H5131). Solvents: Ethanol (absolute for HPLC, LabsoluteBerlin, Germany, 2222).

2.2. Other Reagents

EDTA disodium salt 2-hydrate (AppliChem, 131669.1209); formaldehyde (Sigma, 252549-25ML); (3-glycidoxypropyl)methyldimethoxysilane (Sigma-Aldrich, 539252, CAS 65799-47-5); (3-glycidyloxypropyl)trimethoxysilane (Sigma-Aldrich, 440167, CAS 2530-83-8); hydrochloric acid (ChemSolute, Berlin, Germany, 857,1011); Mucasol® (Brand, Wertheim, Germany, 230091); potassium hydroxide (AppliChem, A1575,1000); silver nitrate (Carl Roth, Karlsruhe, Germany, 9370.4); sodium carbonate (AppliChem, AP141648.1211); sodium chloride (Acros Organics, Geel, Belgium, 446212500); sodium cyanoborohydride (Sigma-Aldrich, 156159); sodium hydroxide (Sigma-Aldrich, 30620-1KG-R); sodium periodate (Sigma-Aldrich, S1878, CAS 7790-28-5); sodium thiosulfate (Roth, HN25.1); sulfuric acid (AppliChem, A0655,1000GL); Tween 20 (Serva, 37470.01). The water used was purified by an Milli-Q Reference A+ Ultra-Pure Water System from Merck KGaA (Darmstadt, Germany), with a resistivity of 18.2 MΩ·cm. Columns: For comparison, a column HiTrap rProtein A FF, 1 mL (Cytiva, Freiburg, Germany, 29-0485-81) was used.

2.3. Preparation of the Monolithic Raw Column

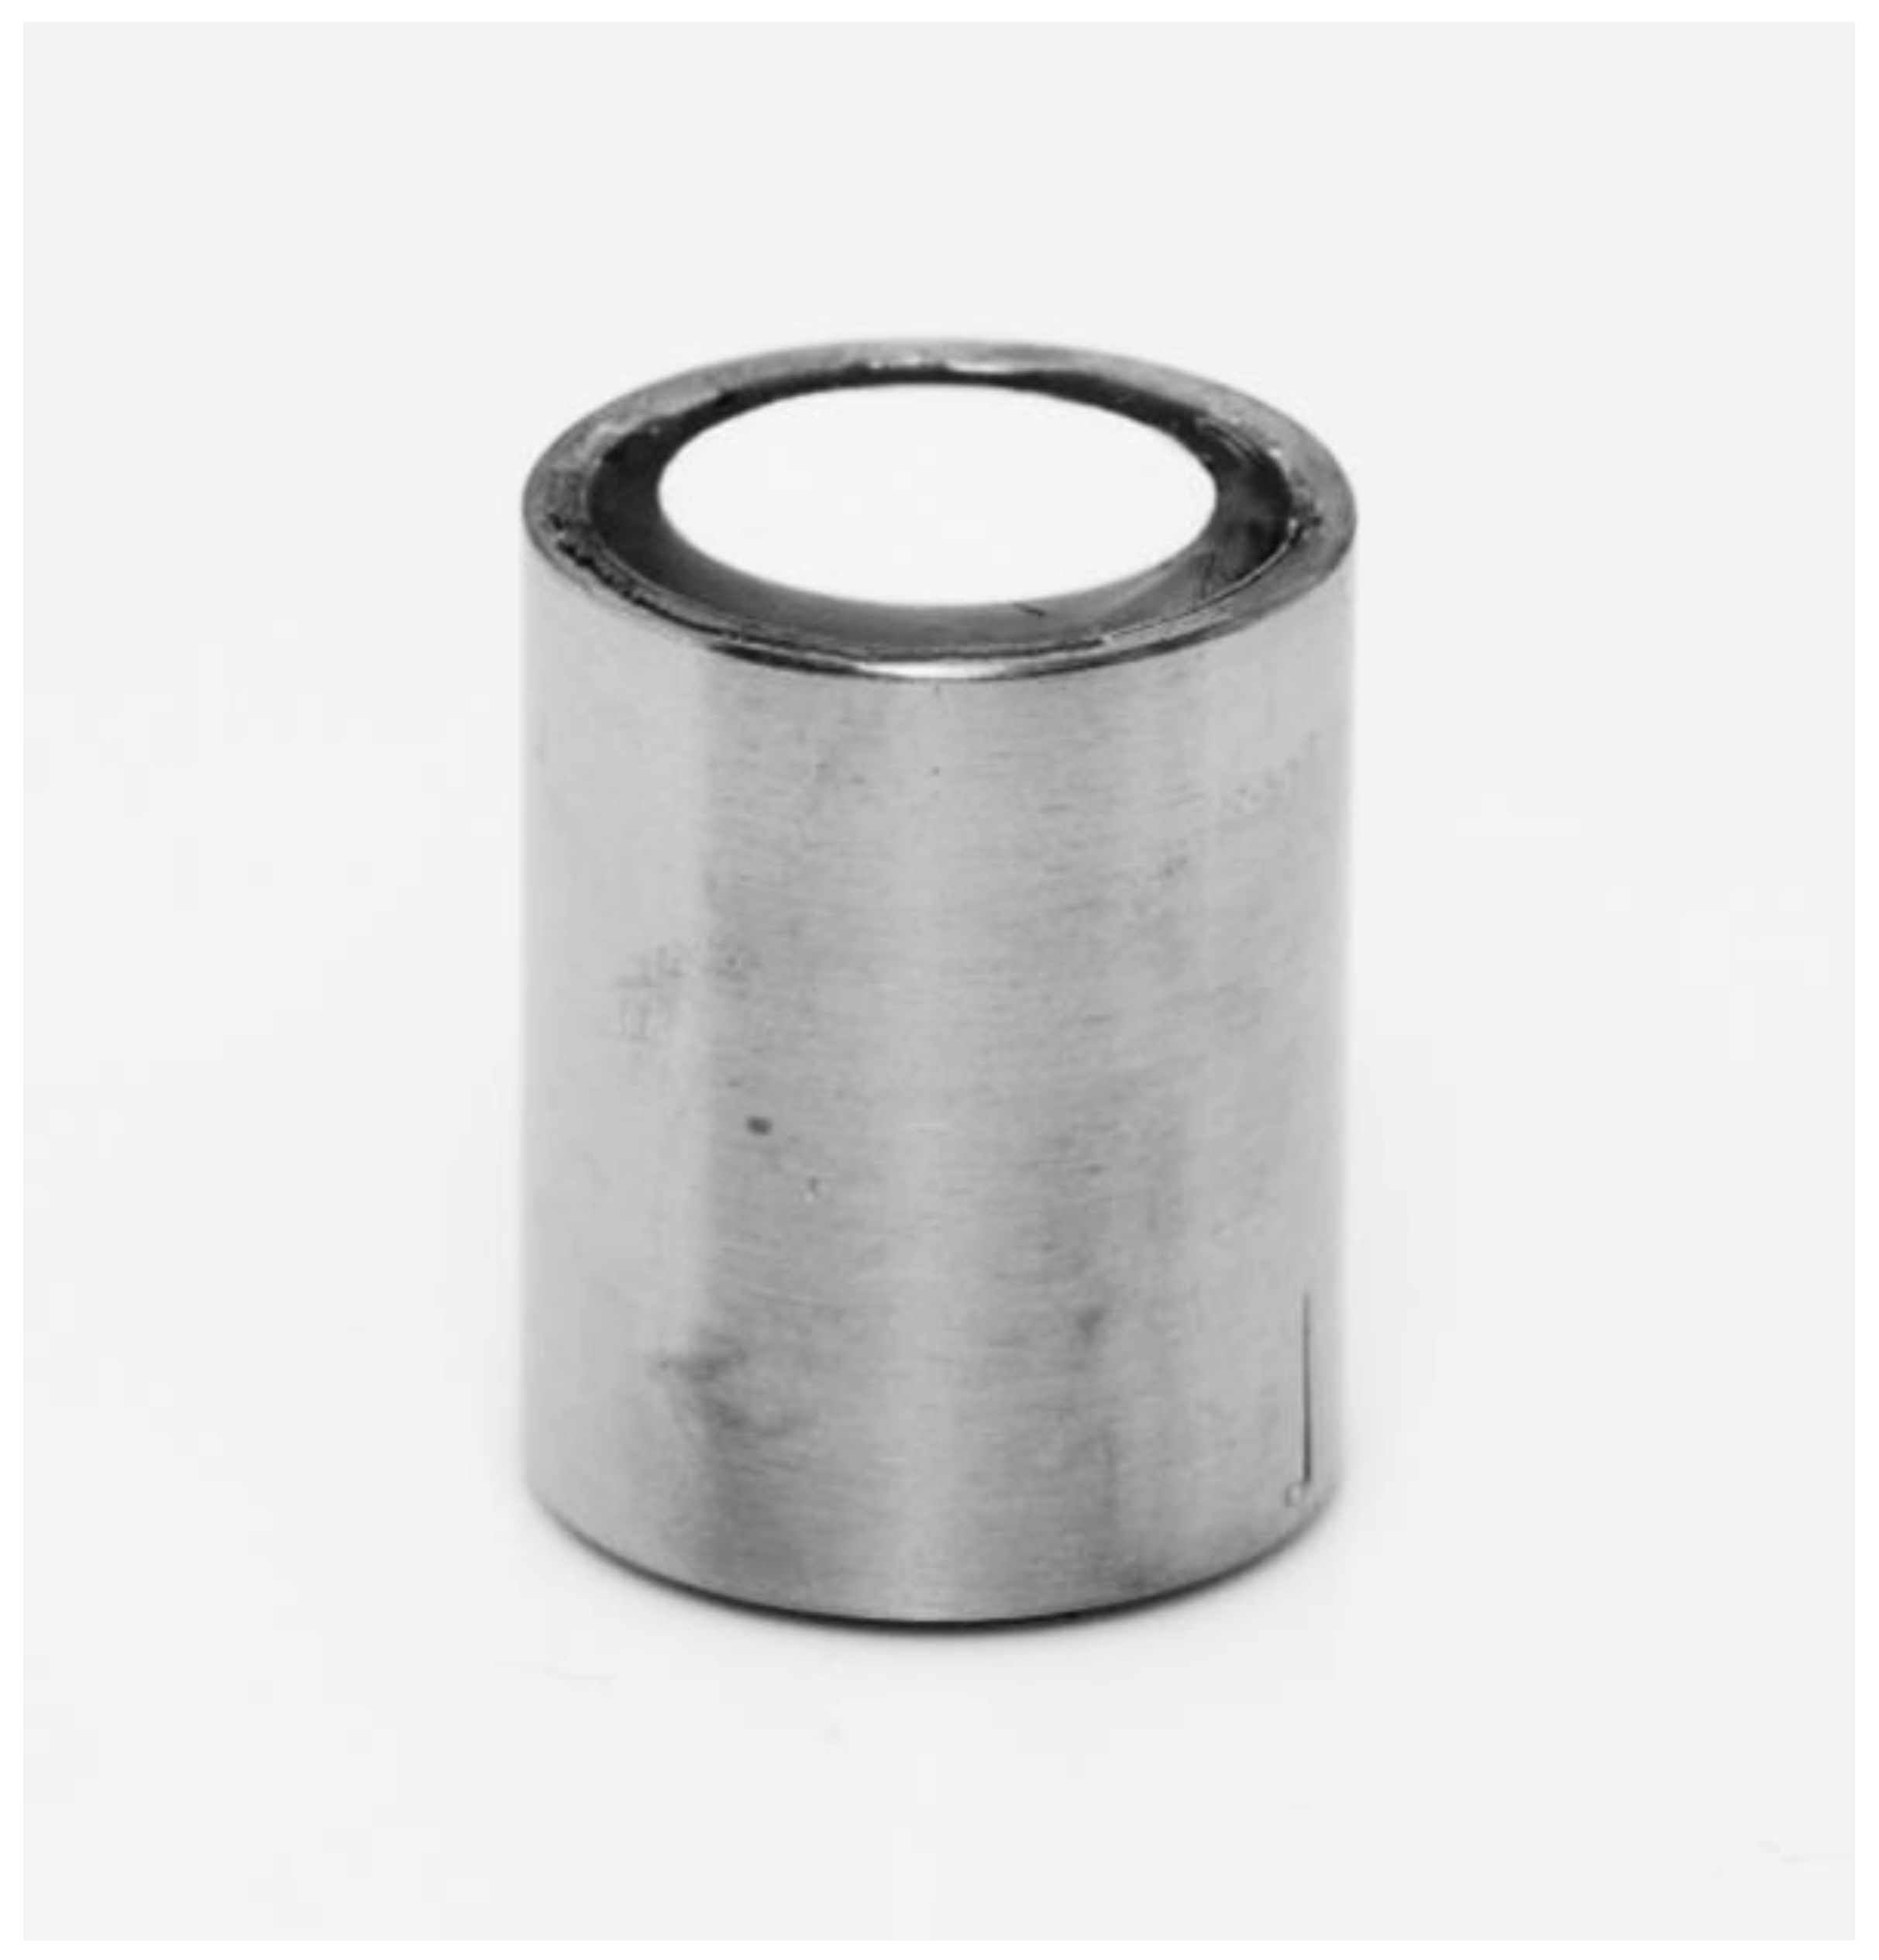
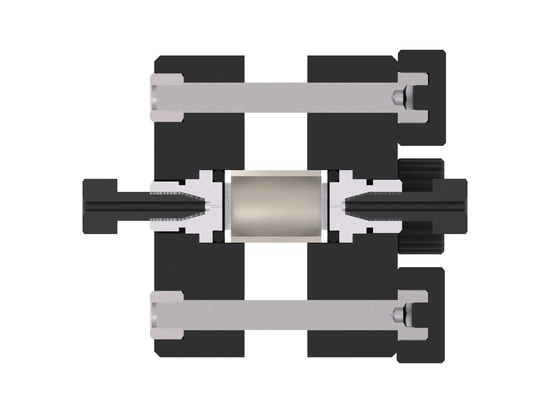
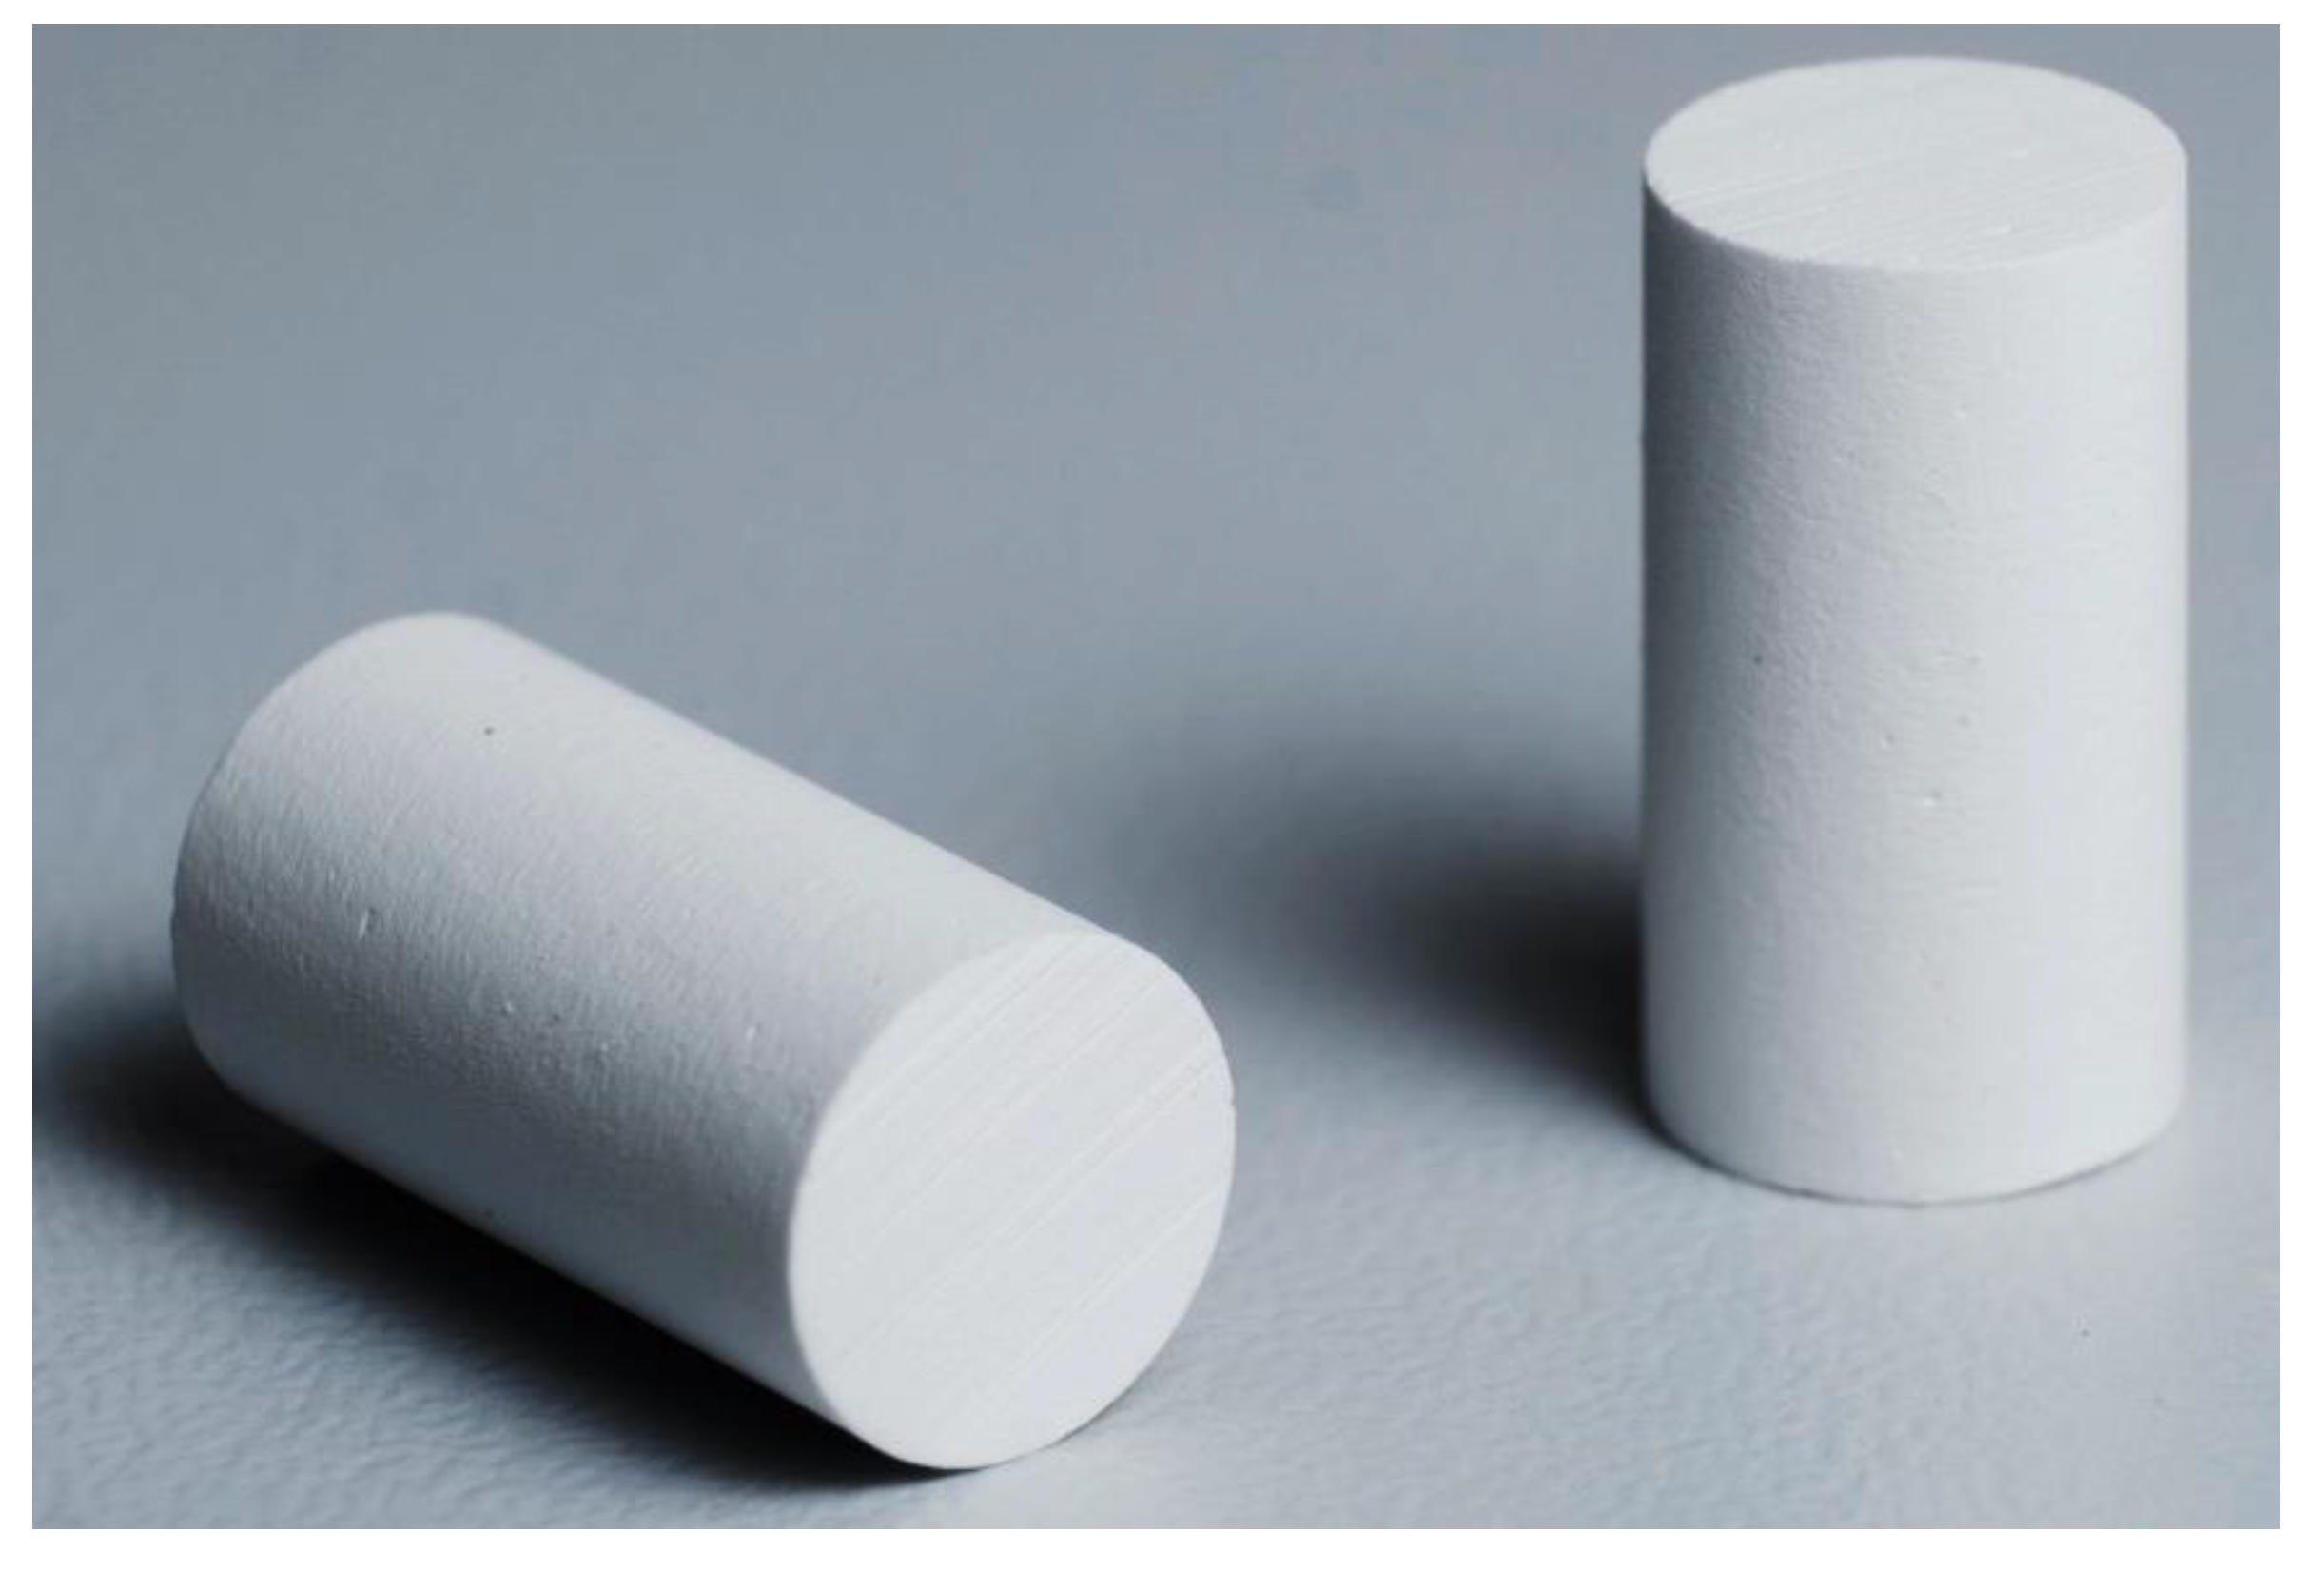
The sintered borosilicate cylinders were obtained from ROBU Glasfilter-Geräte GmbH (Hattert, Germany). They are based on glass filters of the porosity classes Por. 5 (P 1.6, Ultrafine, pore size 1–1.6 µm) or Por. 4 (P 16, Medium, pore size 10–16 µm) made of borosilicate glass 3.3. These classes are defined in ISO 4793-80 (International Standard) and ASTM EI28-99 (American Standard). The monolithic cylinders are prepared by custom order with the designation VitraPOR 5 or 4, diameter 8 mm, length 15 mm, front surfaces finely sawn. These raw cylinders of around 0.75 mL (Figure 2) are glued into short tubes made of titanium grade 2 with outer dimensions of 15.2 mm × 12.0 mm and a wall thickness of 1.0 mm, respectively (Figure 3). The tubes were cleaned and roughened with sodium hydroxide solution. A silicone glue with a suitable viscosity and chemical stability is needed, such as silicon F liquid, obtainable from WEICON (Münster, Germany, 13200310). The metal tube and the monolith are fixed concentrically on an adhesive tape. The interspace is filled with liquid silicone glue gently not to loosen the fixed monolith. To avoid that the second front face is contaminated with silicone, the second front should be protected with a round patch, cut from adhesive tape, which can be removed after the polymerization of the silicone. A column holder was prepared by additive manufacturing from acrylonitrile-butadiene-styrene-polymer (ABS) with a Zortrax M200 system (Olsztyn, Poland). The detailed description of the construction and manufacturing of the column and the column holder is shown in the Supplementary Material supported by a picture story.

2.4. Optimized Coating Protocol of the Borosilicate Surface with Protein A

The assembled column system was connected to a syringe pump (Standard Infusion Only Pump 11 Elite from Harvard Apparatus, Holliston, MA, USA), and several reagents and washing solutions were pumped through the column. If not indicated otherwise, a flow rate of 1 mL/min was used, and the reactions took place at room temperature.
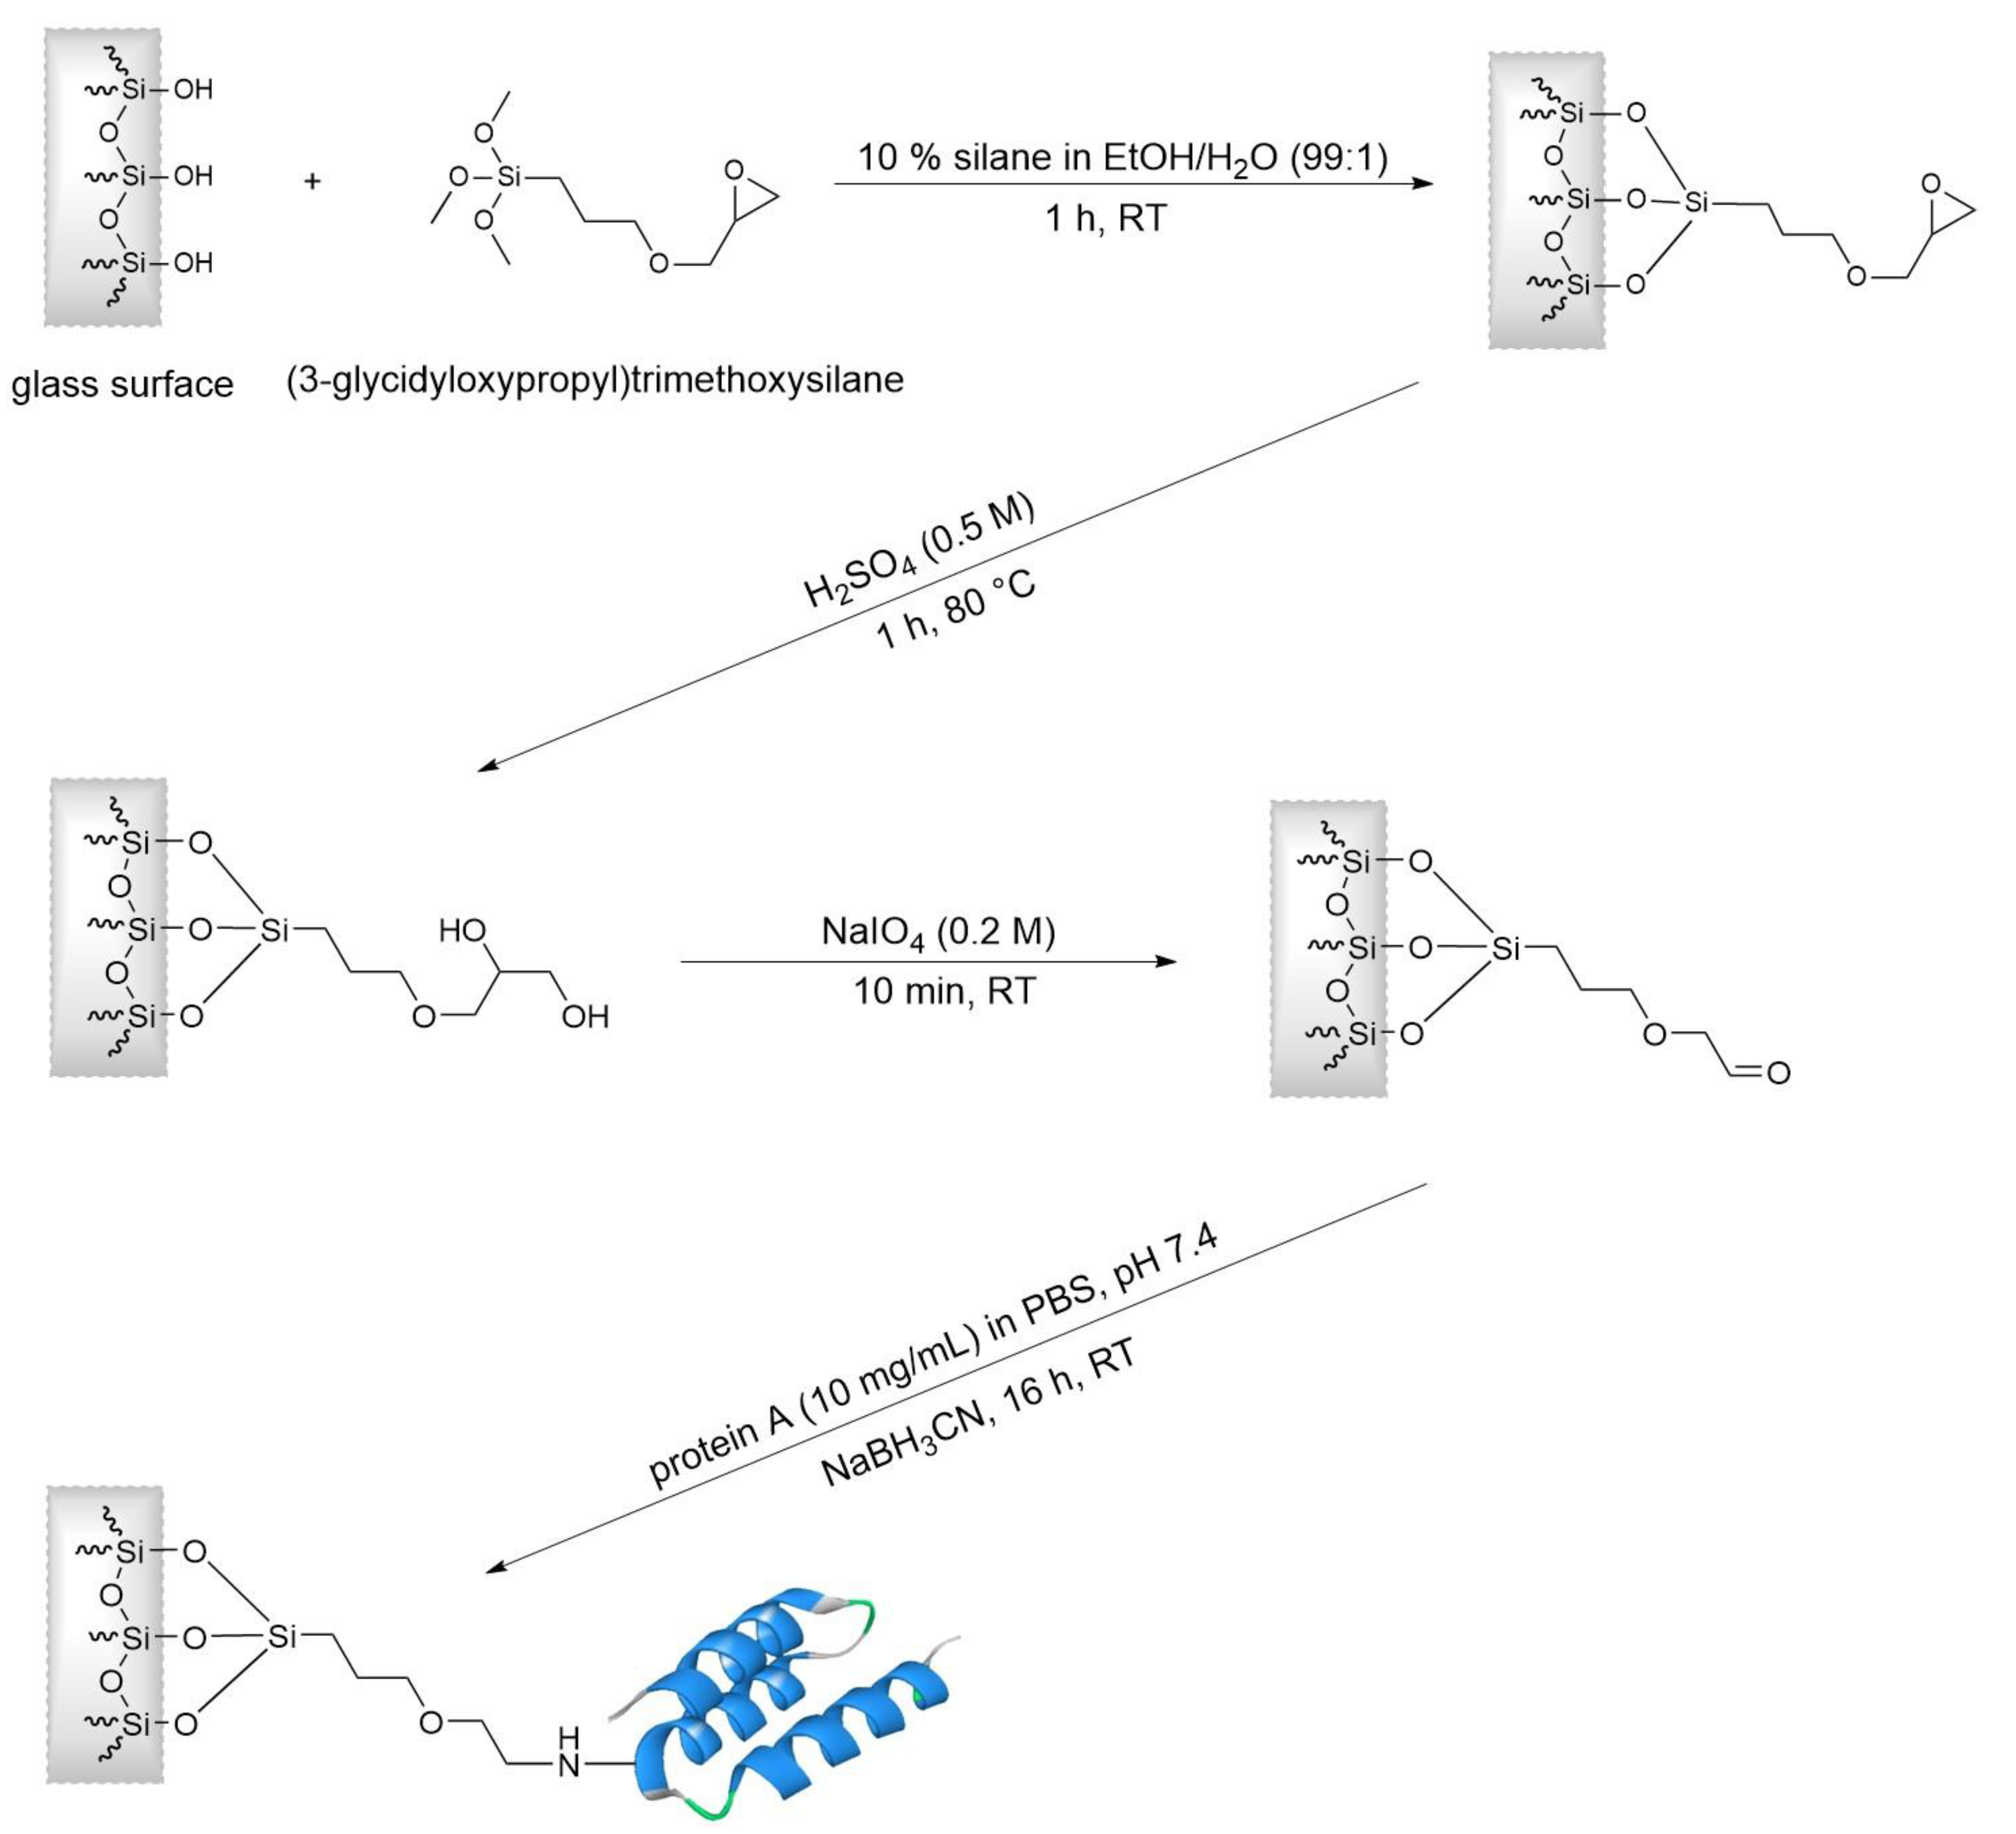
In order to clean the glass surface, 10 mL of KOH (20%) was pumped through the column. Afterward, the column was washed with 10 mL of PBS to obtain a neutral pH before the column was equilibrated with 10 mL of EtOH/H2O (99:1). As the first reaction step (Figure 4), 10 mL of (3-glycidyloxypropyl) trimethoxysilane (10% in EtOH/H2O 99:1) was pumped through the column for 10 min. The column was sealed on both sides and incubated for 1 h. After a washing step with 10 mL of EtOH/H2O (99:1), the column was flushed with 3 mL of water and 10 mL of H2SO4 (0.5 M) and sealed on both sides. The column was placed in a drying oven (UNB 200, Memmert, Schwabach, Germany) to incubate for 1 h at 80 °C. In this step, the epoxide groups were hydrolyzed to form a diol surface. After flushing the column with 10 mL of PBS to remove the acid and to achieve a neutral pH, the column was flushed with 10 mL of sodium periodate (0.2 M of NaIO4). Subsequently, the column was washed with 10 mL of PBS, and the remaining PBS was pushed out with nitrogen. Later, 3 mL of a protein A solution (10 mg/mL in PBS) was run through the column. The column was sealed on both sides and incubated overnight. On the next morning, 10 mL of a blocking and reduction solution (10% of BSA + 10 mM of Tris + 150 mM of NaCl + 50 mM of NaBH3CN, pH adjusted to 7.4 with HCl) was flushed through the column with a flow rate of 0.166 mL/min for 1 h. Subsequently, the column was washed with 10 mL of PBS-T (0.05% of Tween 20). Finally, the column was flushed with 10 mL of H2O, 10 mL of EtOH (20% in H2O) was stored in the fridge until use.

2.5. Analytical IgG Determination on an HPLC System

The HPLC experiments were performed on a bio-inert Infinity 1260 HPLC system from Agilent (Santa Clara, CA, USA). The HPLC experiments were performed on a bio-inert Infinity 1260 HPLC system from Agilent, and absorption was monitored at 280 nm. The maximum flow rate of 5 mL/min was used throughout. Lyophilized human plasma was reconstituted in water (100 mg/mL) and diluted in binding buffer (pH 7.4). The obtained solution was micro-filtered (0.22 µm). The column was connected to the system and then equilibrated with water, elution buffer, and binding buffer. A method was programmed and used for all future runs: The method injects 10–100 µL of the human plasma (diluted in binding buffer), then flushes the column with 2.5 mL of binding buffer to remove non-binding components before eluting IgG with 5.0 mL of elution buffer (pH 2.3) and eventually equilibrating the column back to pH 7.4 with 5.0 mL of binding buffer, and absorption was monitored at 280 nm. The maximum flow rate of 5 mL/min was used throughout. Lyophilized human plasma was reconstituted in water (100 mg/mL) and diluted in binding buffer (pH 7.4). The obtained solution was micro-filtered (0.22 µm). The column was connected to the system and then equilibrated with water, elution buffer, and binding buffer. A method was programmed and used for all future runs: The method injects 10–100 µL of the human plasma (diluted in binding buffer), then flushes the column with 2.5 mL of binding buffer to remove non-binding components before eluting IgG with 5.0 mL of elution buffer (pH 2.3) and eventually equilibrating the column back to pH 7.4 with 5.0 mL of binding buffer.

2.6. Preparative IgG Isolation on an FPLC System

The FPLC experiments were performed on an ÄKTA pure 25 L from GE Healthcare Life Sciences (Freiburg, Germany), and absorption was monitored at 280 nm. Flow rates between 5–25 mL/min were used, depending on the experiments performed. Lyophilized human plasma was reconstituted in water (100 mg/mL) and diluted in binding buffer (pH 7.4). The obtained solution was micro-filtered (0.22 µm) and then filled into the super loop (up to 10 mL) of the system.
The column was connected to the system and then equilibrated with water, elution buffer, and binding buffer. In general, all methods injected between 0.5–5 mL of the human plasma (typically diluted 1:10) at flow rates between 5–25 mL/min. In a typical method, the column was first equilibrated with 2.5 mL of binding buffer, and then the sample was injected. After a washing step with 10.0 mL of binding buffer to remove loosely bound components, IgG was eluted with 3.0 mL of elution buffer (pH 2.3). Finally, the column was re-equilibrated with 8.0 mL binding buffer back to a pH of 7.4.

2.7. Pressure Characterization of the System

In order to determine the maximum pressure limits, the column was connected directly to the FPLC pump to avoid any back-pressure from the system itself. A solution of 20% ethanol was flushed through the column with 1 mL/min, and the flow rate was then increased by 1 mL/min every 12 s until the maximum system flow rate of 25 mL/min was reached.

2.8. Determination of the Monolith Capacity (IgG on Protein A)

This experiment was performed on the FPLC system. From a stock solution of the therapeutic antibody Avastin (25 mg/mL), several dilutions were prepared (0/2/4/6/8/10 mg/mL). For each run, 500 µL was injected with a flow rate of 5 mL/min, and the peak areas of the resulting elution peaks were compared (UV, 280 nm).

2.9. Reversal of Flow Direction (Counterflow)

This experiment was also performed on the FPLC system at a flow rate of 5 mL/min. 1 mL of human plasma (diluted 1:20 in binding buffer) was injected, and the bound antibodies were eluted in the normal flow direction (up-flow) with elution buffer (pH 2.3). Eventually, the same run was performed, but with a reversed elution direction (counterflow).

2.10. Examination of the Dynamic Capacity

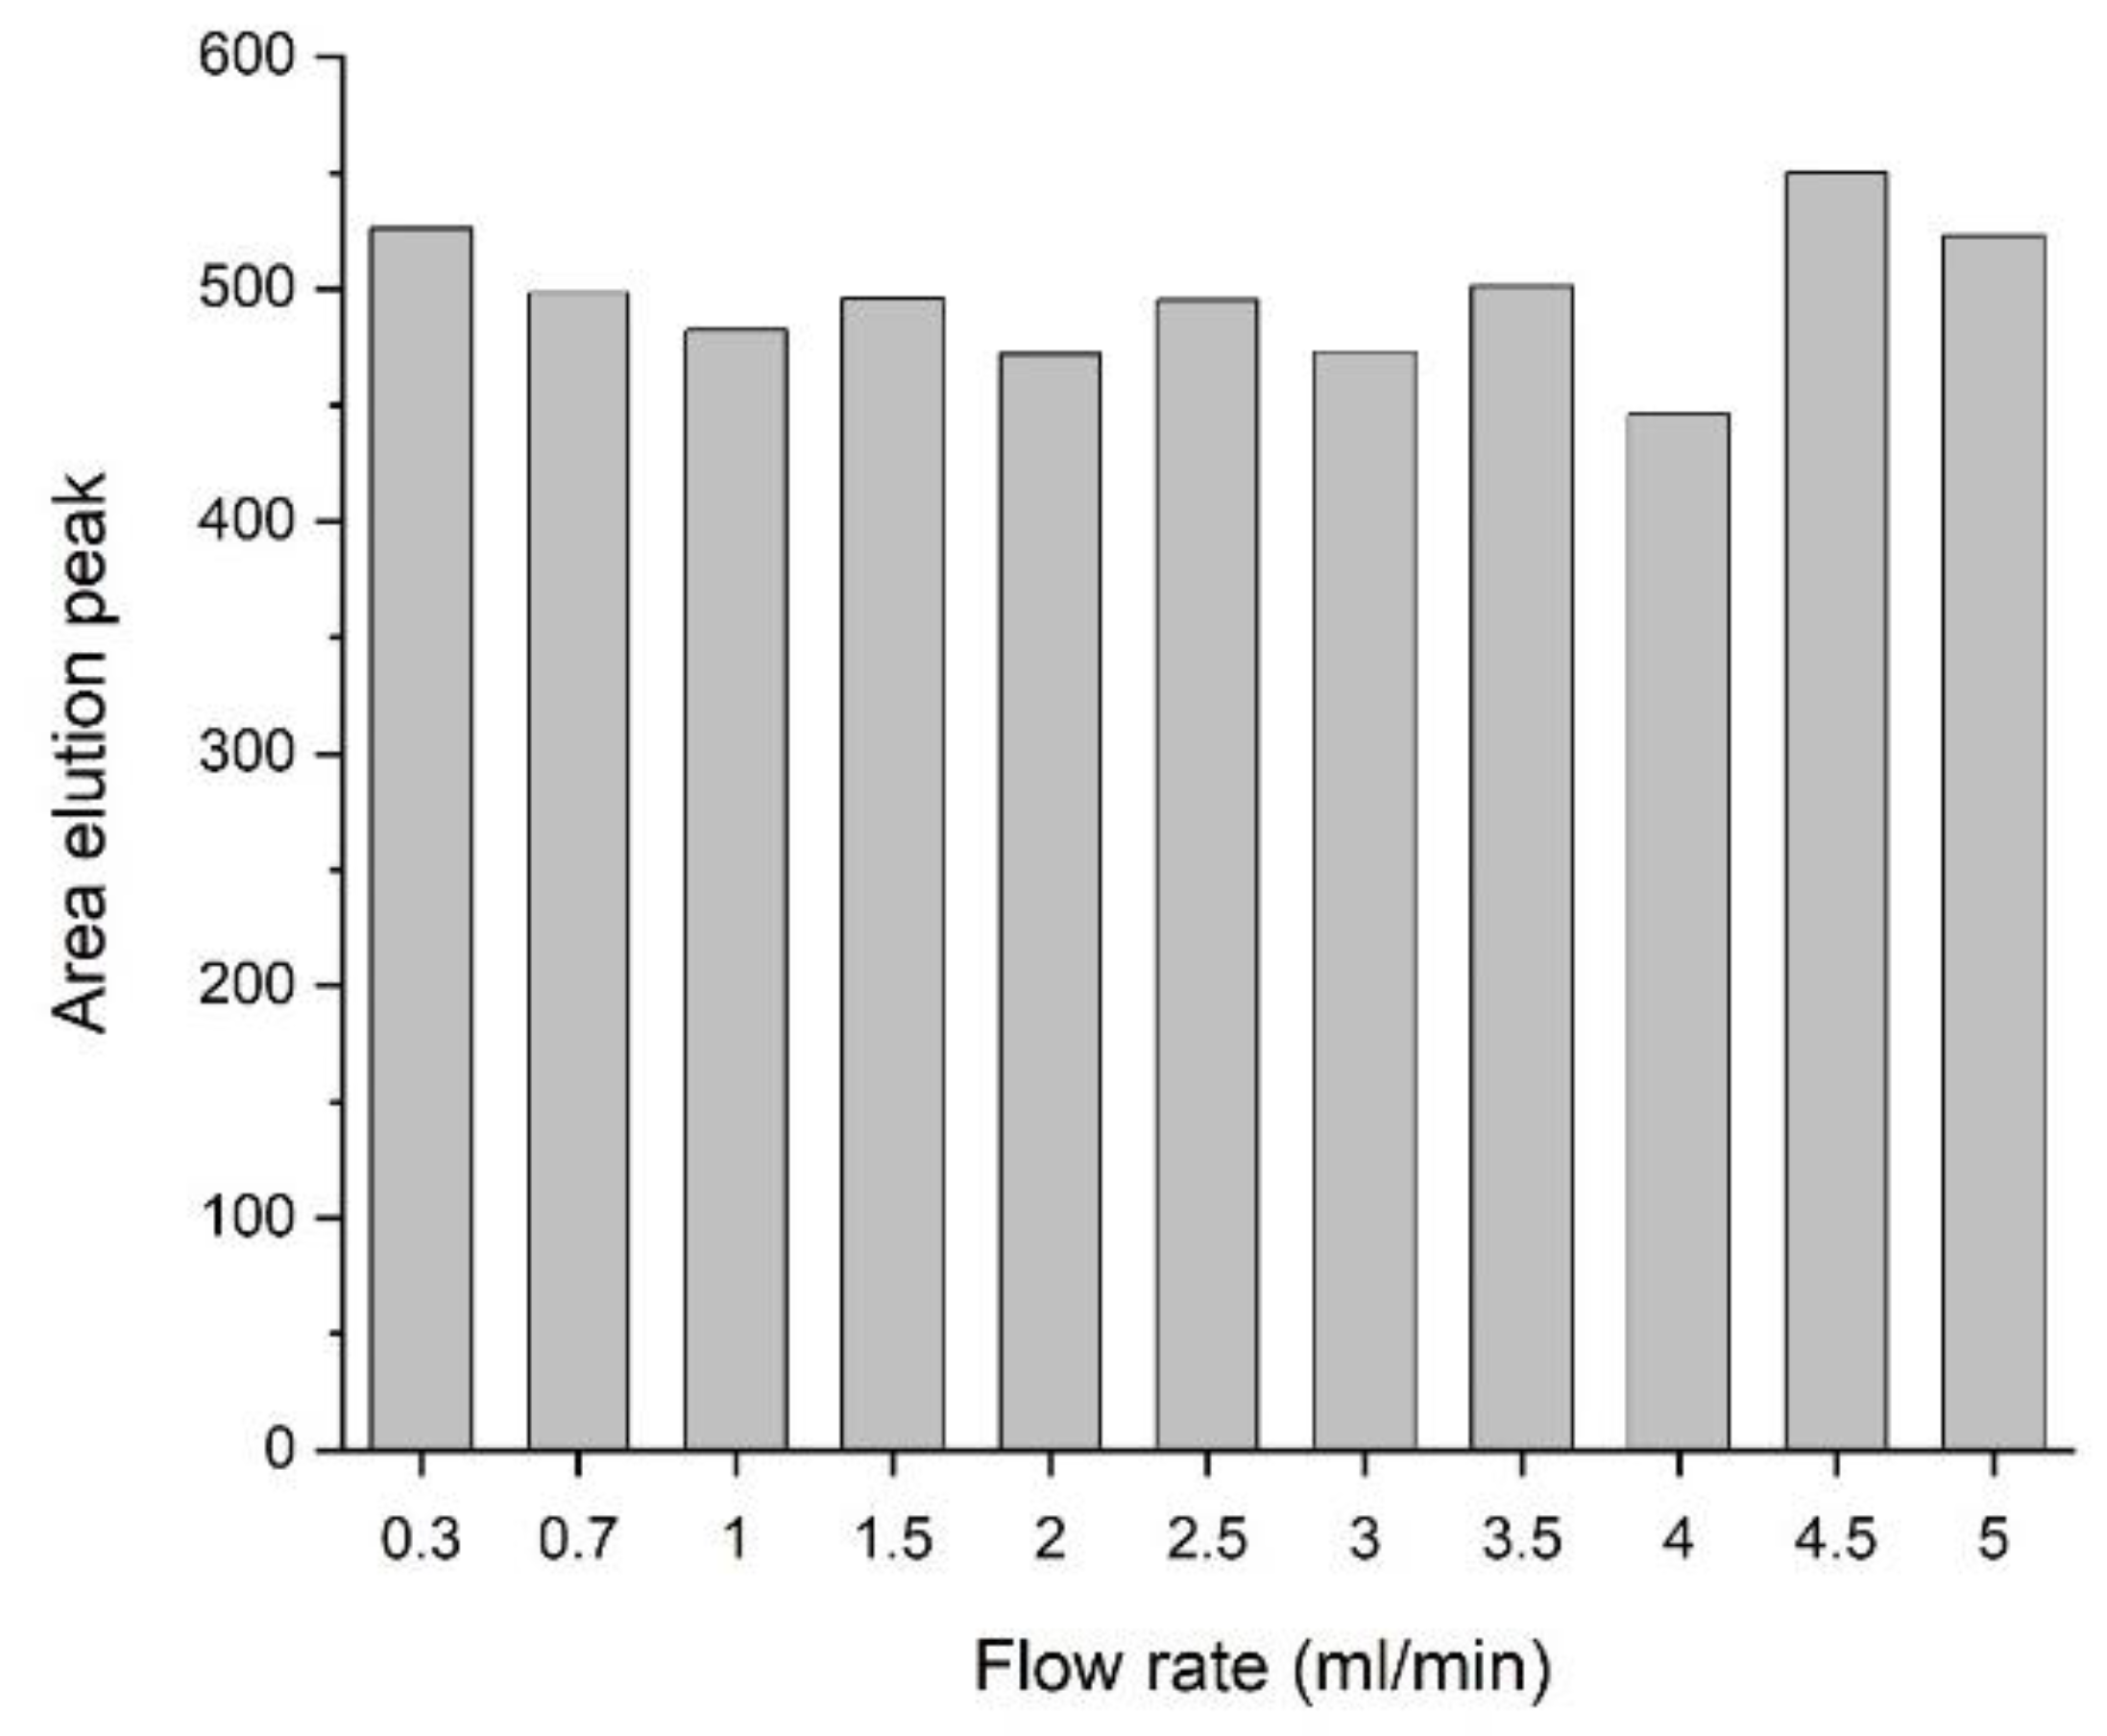
This experiment was performed on the HPLC system. Human plasma was diluted 1:2 in binding buffer, and 10 µL were injected. The flow rates of each run were varied between 0.33 and 5 mL/min. The flow-rate corrected areas of each elution peak were compared. This experiment used only a fraction of the total column binding capacity.

2.11. Repeatability Test (100 Cycles)

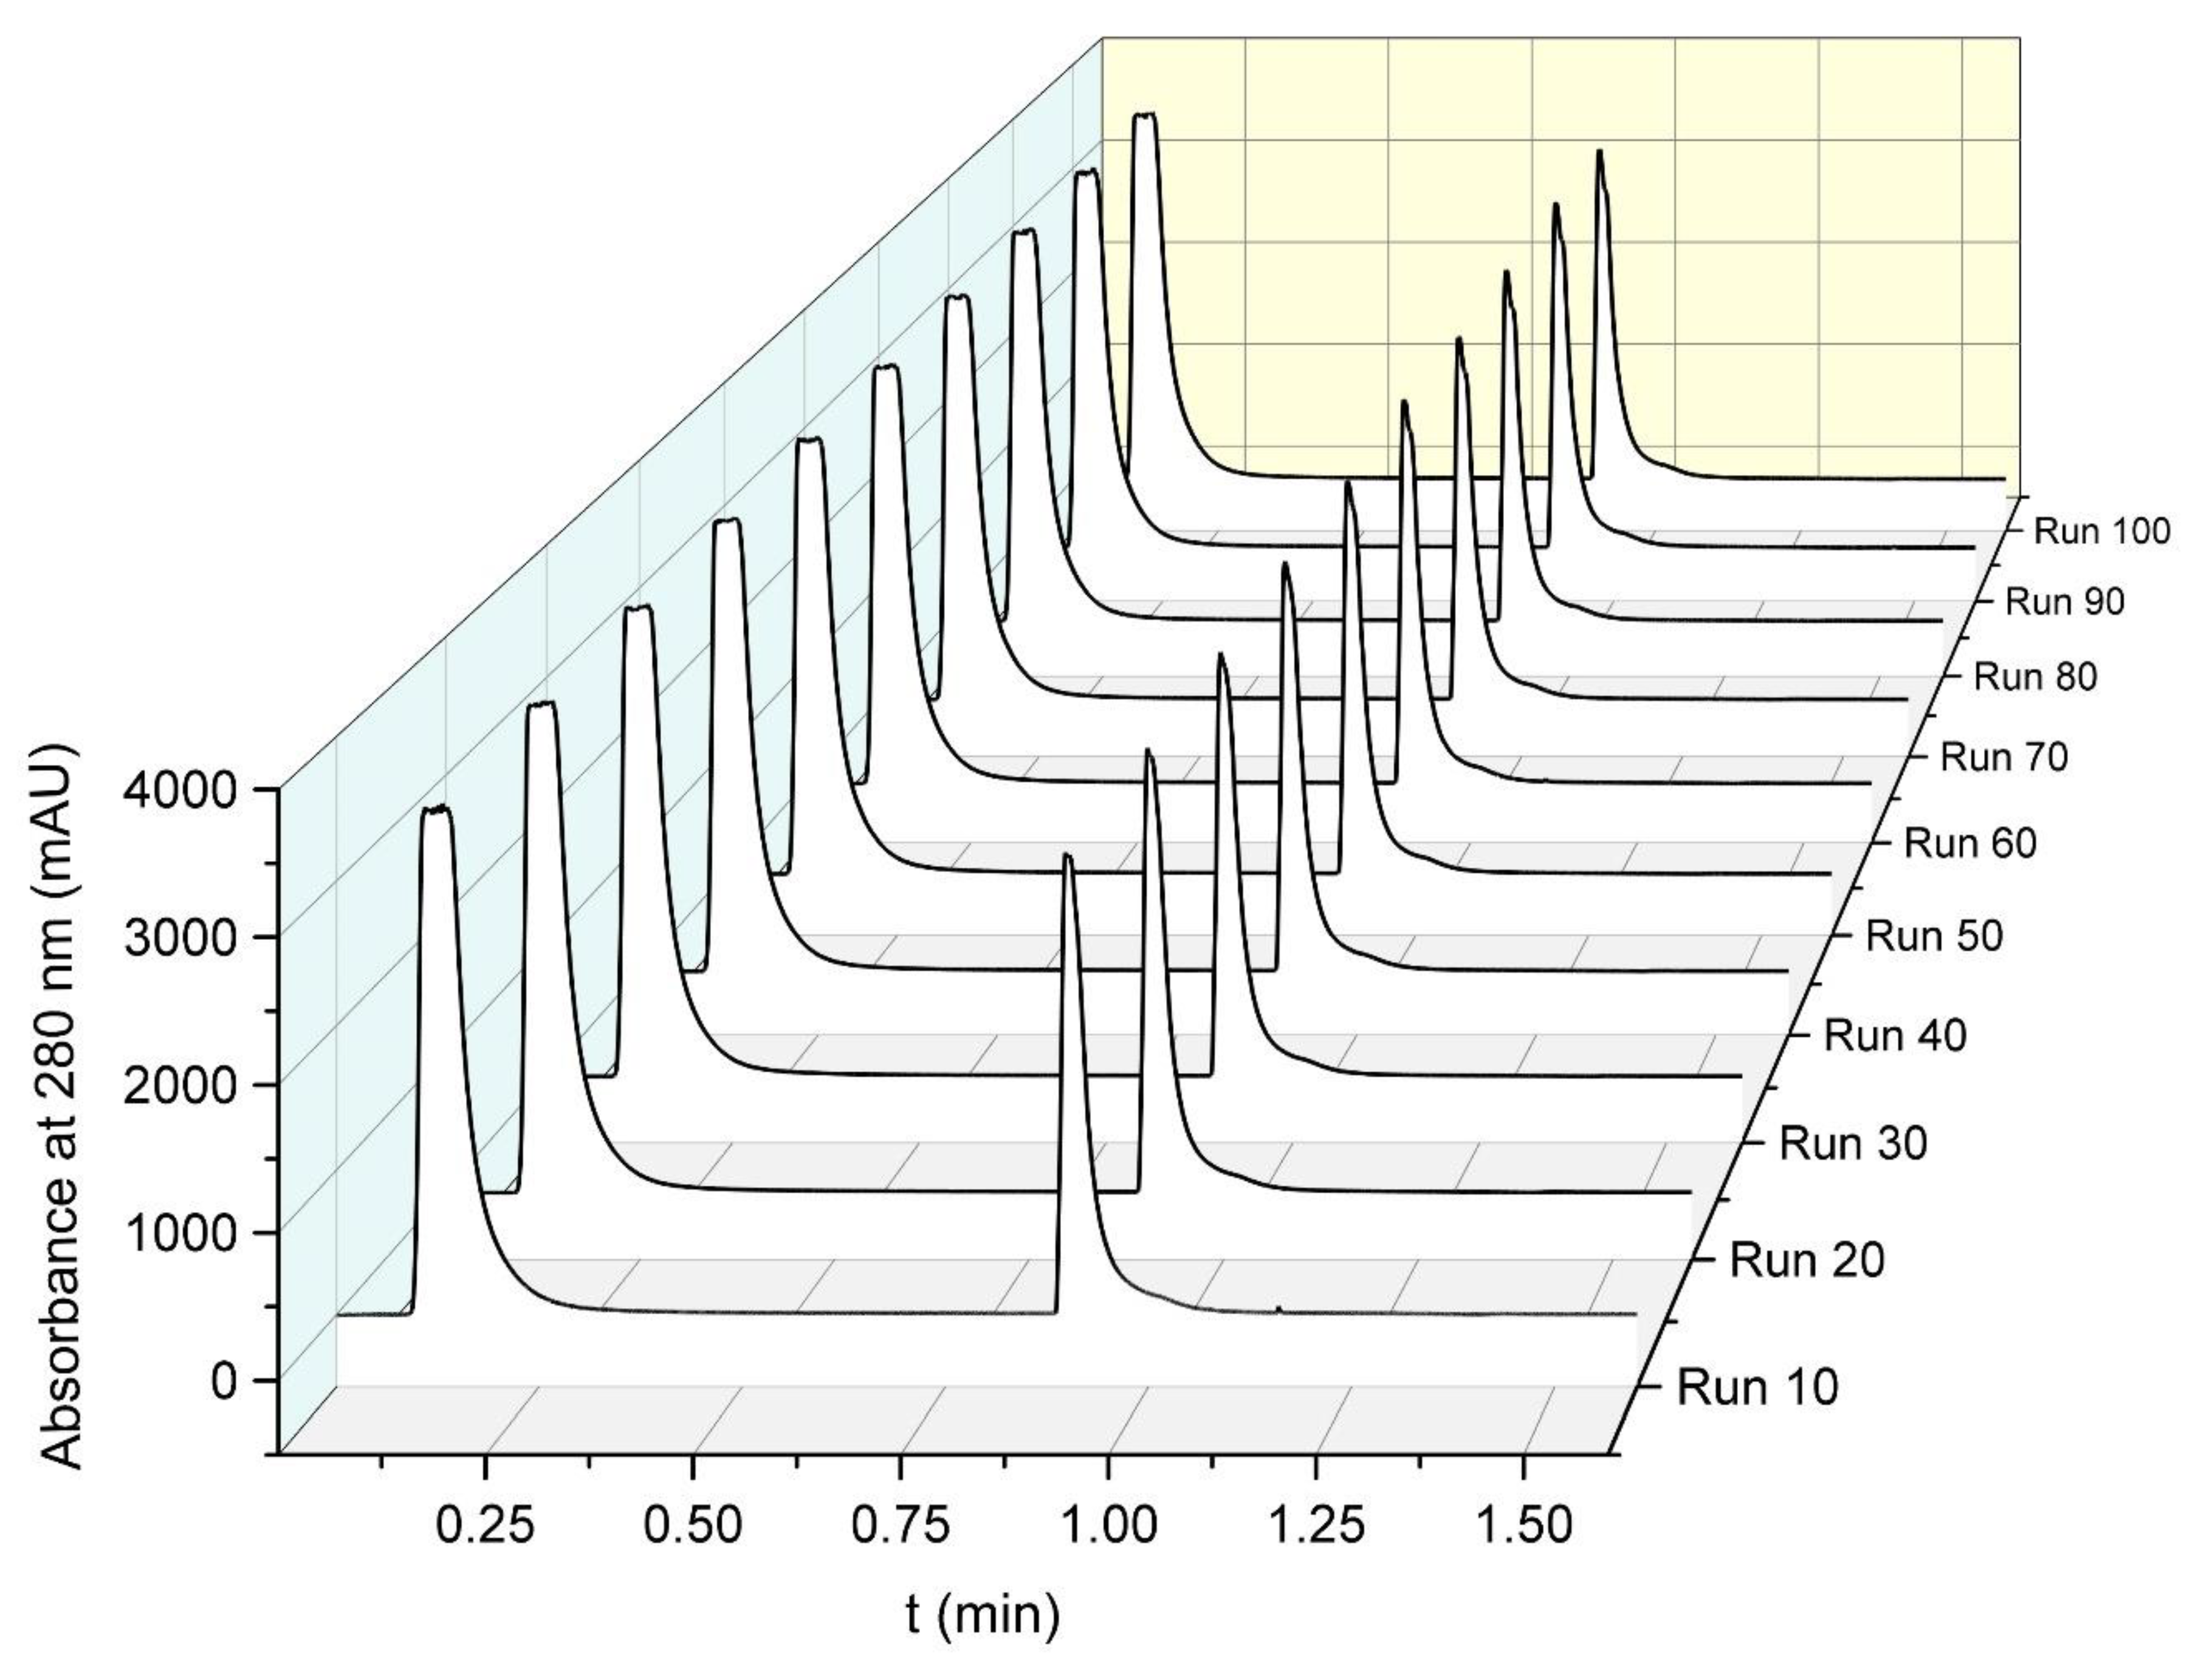
This experiment was performed on the HPLC system. Human plasma was diluted 1:10 in binding buffer. A method was programmed, which injected 80 µL of plasma solution at 5 mL/min. This method was run 100 times successively without human intervention.

2.12. Productivity Test (Amount of Purified IgG per Hour)

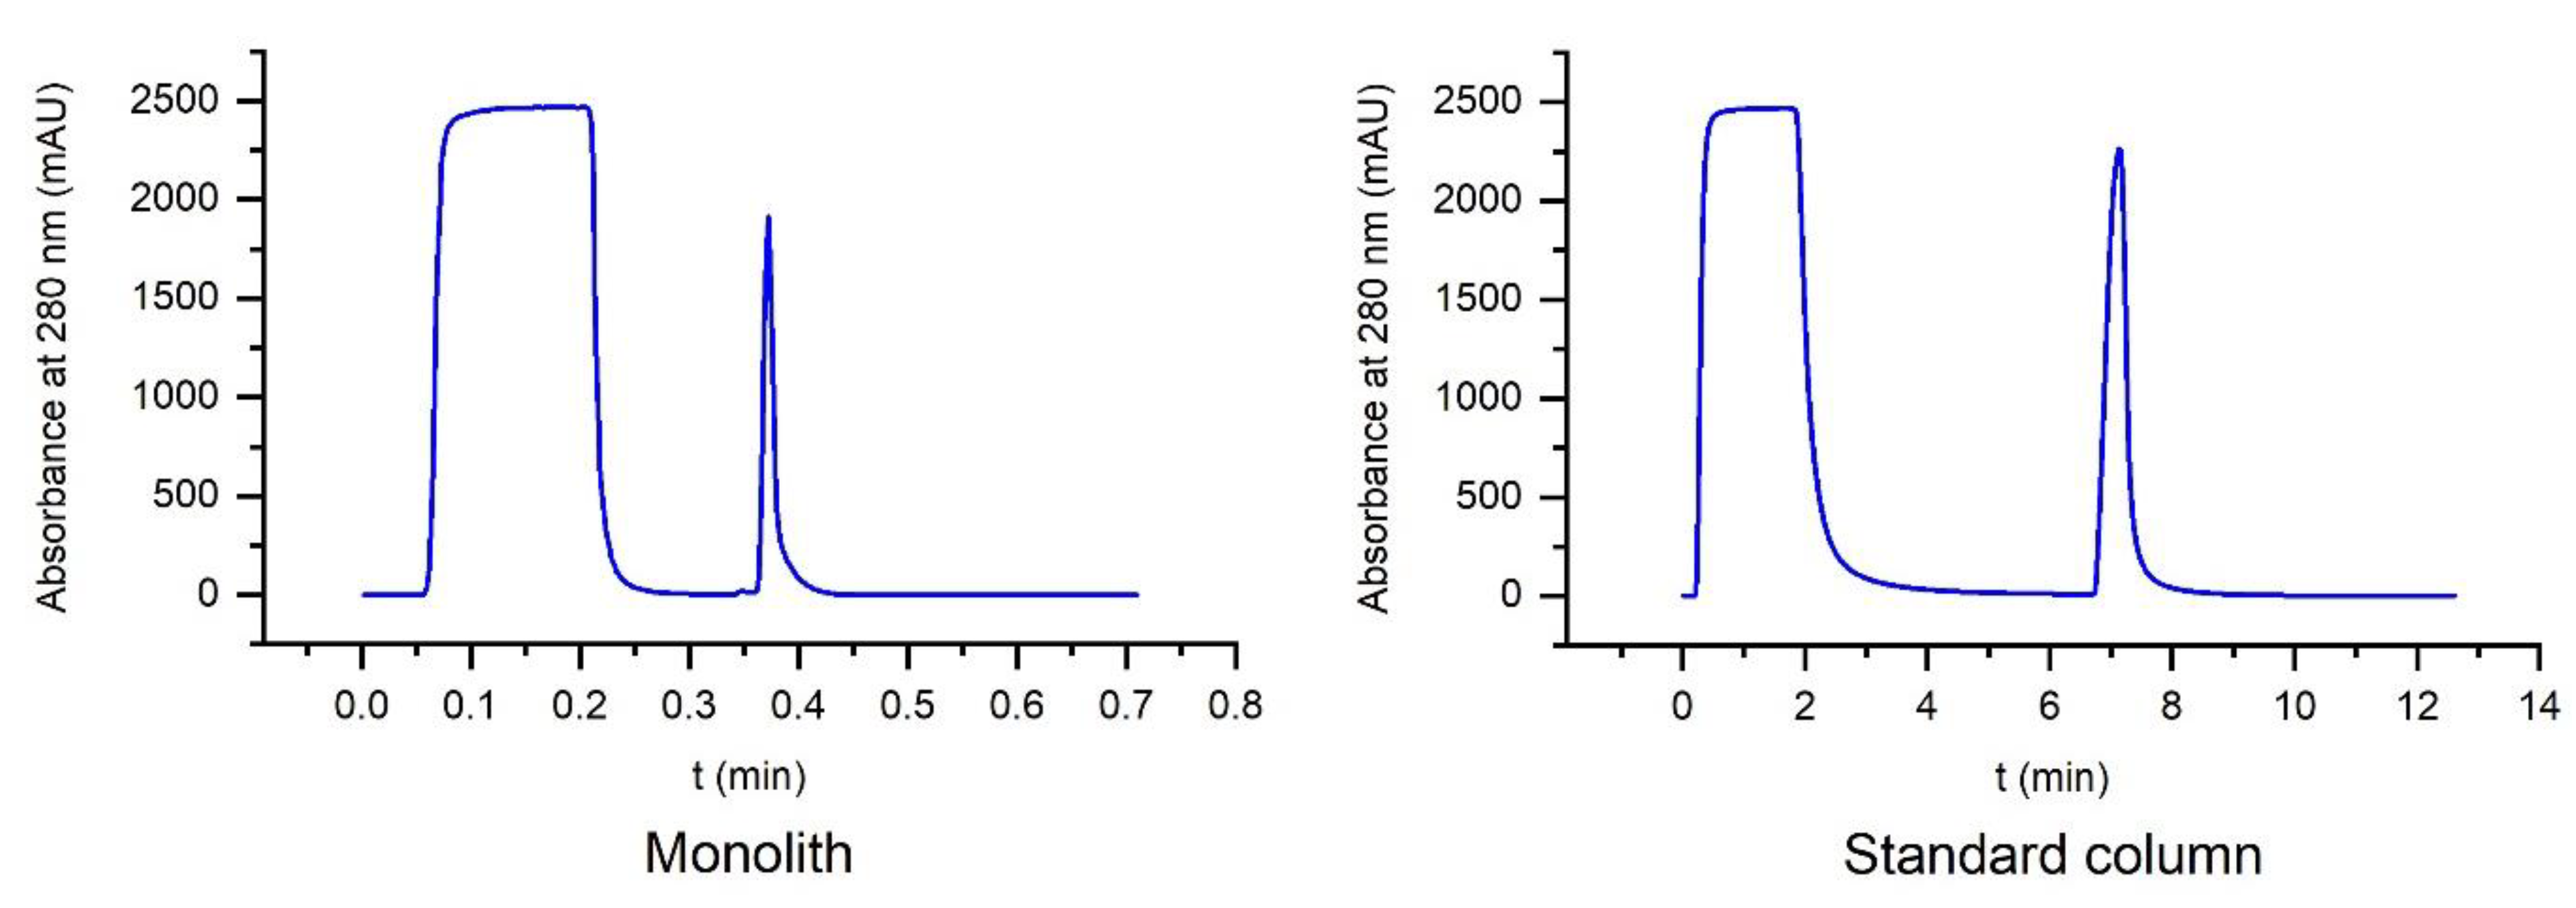
This experiment was performed on the FPLC system. It was determined how much IgG from human plasma could be collected within one hour with each column at their respective maximum flow rates. Each column was connected to the FPLC, and the standard protocol was performed. For the monolith, a flow rate of 25 mL/min was chosen, which is also the maximum flow rate of the system (run duration of 0.7 min). The compared column from GE was limited to a flow rate of 4 mL/min (run duration 13 min). The IgG yield of each run was calculated by comparing the area of the elution peaks with a calibration line from calibration experiments and extrapolated up to one hour for each column.

2.13. Comparison of the Capacity of VitraPOR 4 and VitraPOR 5 Columns

This experiment was performed on the FPLC system. As a sample, 500 µL Adalimumab (Humira®, from Evidentic) with a concentration of 10 mg/mL was injected with a flow rate of 5 mL/min on a VitraPOR 4 (pore size 10–16 µm) and a VitraPOR 5 (pore size 1–1.6 µm) column. The IgG yield of each run was calculated by comparing the area of the elution peaks with a calibration line from calibration experiments.

2.14. Determination of IgG Purity

The chromatography was performed on the FPLC system and the following SDS-PAGE on a Hoefer SE260 with gels from Serva (SERVAGel™ TG PRiME™ 4–12%, 43273.01). Human plasma was diluted 1:10 in binding buffer, and 2 mL were injected on the FPLC with a run flow rate of 10 mL/min. The binding and elution peaks were fractionated, and the latter neutralized with 1 µL of NaOH (1 M) per 100 µL eluate. Of each fraction, 100 µL were used for the SDS-PAGE characterization. The rest of the obtained elution fraction was reinjected and run with the same method. Again, both peaks were collected, some aliquots were stored, and the elution fraction was injected again. Eventually, six samples were obtained: Three binding and three elution fractions. The three elution fractions were each diluted to a total volume of 2 mL with binding buffer. The three elution fractions and the first binding fraction were examined on a NanoPhotometer NP 80 (Implen, Munich, Germany) to estimate their IgG concentration, using its integrated method for human IgG. In total, 2 µL of the sample were used for the absorbance measurement at 280 nm.
For SDS-PAGE analysis, human plasma was diluted 1:100 in binding buffer. The flow-through fraction was diluted 1:10 in binding buffer. The three elution fractions were adjusted to the same IgG concentration based on NanoPhotometer determinations. Of all samples, 18 µL were taken and each supplemented with 6 µL of 4x loading buffer (non-reducing), mixed, and heated to 95 °C in a ThermoMixer C (Eppendorf, Hamburg, Germany, 5382000015) for 10 min. The samples were mixed again, and subsequently, 10 µL of each sample was loaded onto the gel, which was run with 400 mL of SDS running buffer in a fridge at 4 °C. Run times: 15 min at 70 V + 60 min at 180 V + 10 min at 200 V. The following silver staining protocol was applied to visualize protein bands: The gel was washed twice in water for 5 min each. Afterward, the gel was incubated in sodium thiosulfate Na2S2O3 (1.3 mM) for 1 min and then washed with water for 10 s. The gel was then transferred into a staining container containing freshly prepared AgNO3 (5.9 mM) and incubated for 30 min. The gel was washed twice with water for 10 s each and then incubated for 10 s with sodium carbonate Na2CO3 (236 mM). In the next step, the gel was incubated in a solution of Na2CO3 (236 mM) and formaldehyde (2.5 mM) for 10 min. After the completed staining, the gel was washed twice with water and then incubated in Na2EDTA (50 mM) for 20 min. Finally, the gel was washed twice with water, and a photograph of the final gel was taken.

2.15. Calibration Curve of IgG

The experiment was performed on the FPLC without a column connected. On each run, 500 µL of different concentrations of bovine γ-globulin (0/0.2/1.0/2/4/6/8/10/20 mg/mL) was injected at a flow rate of 5 mL/min. The obtained peak areas were compared, and a calibration line with a linear regression equation was prepared.

2.16. Determination of the Limit of Detection (LOD) for Human IgG

This experiment was performed on the HPLC system. A series of Avastin solutions (0/0.5/1/1.5 µg/mL) were prepared from the stock solution, and 100 µL of each solution was injected with a flow rate of 5 mL/min. Each sample was injected 10 times for statistical evaluation.

2.17. The Maximum Concentration of IgG in the Eluate

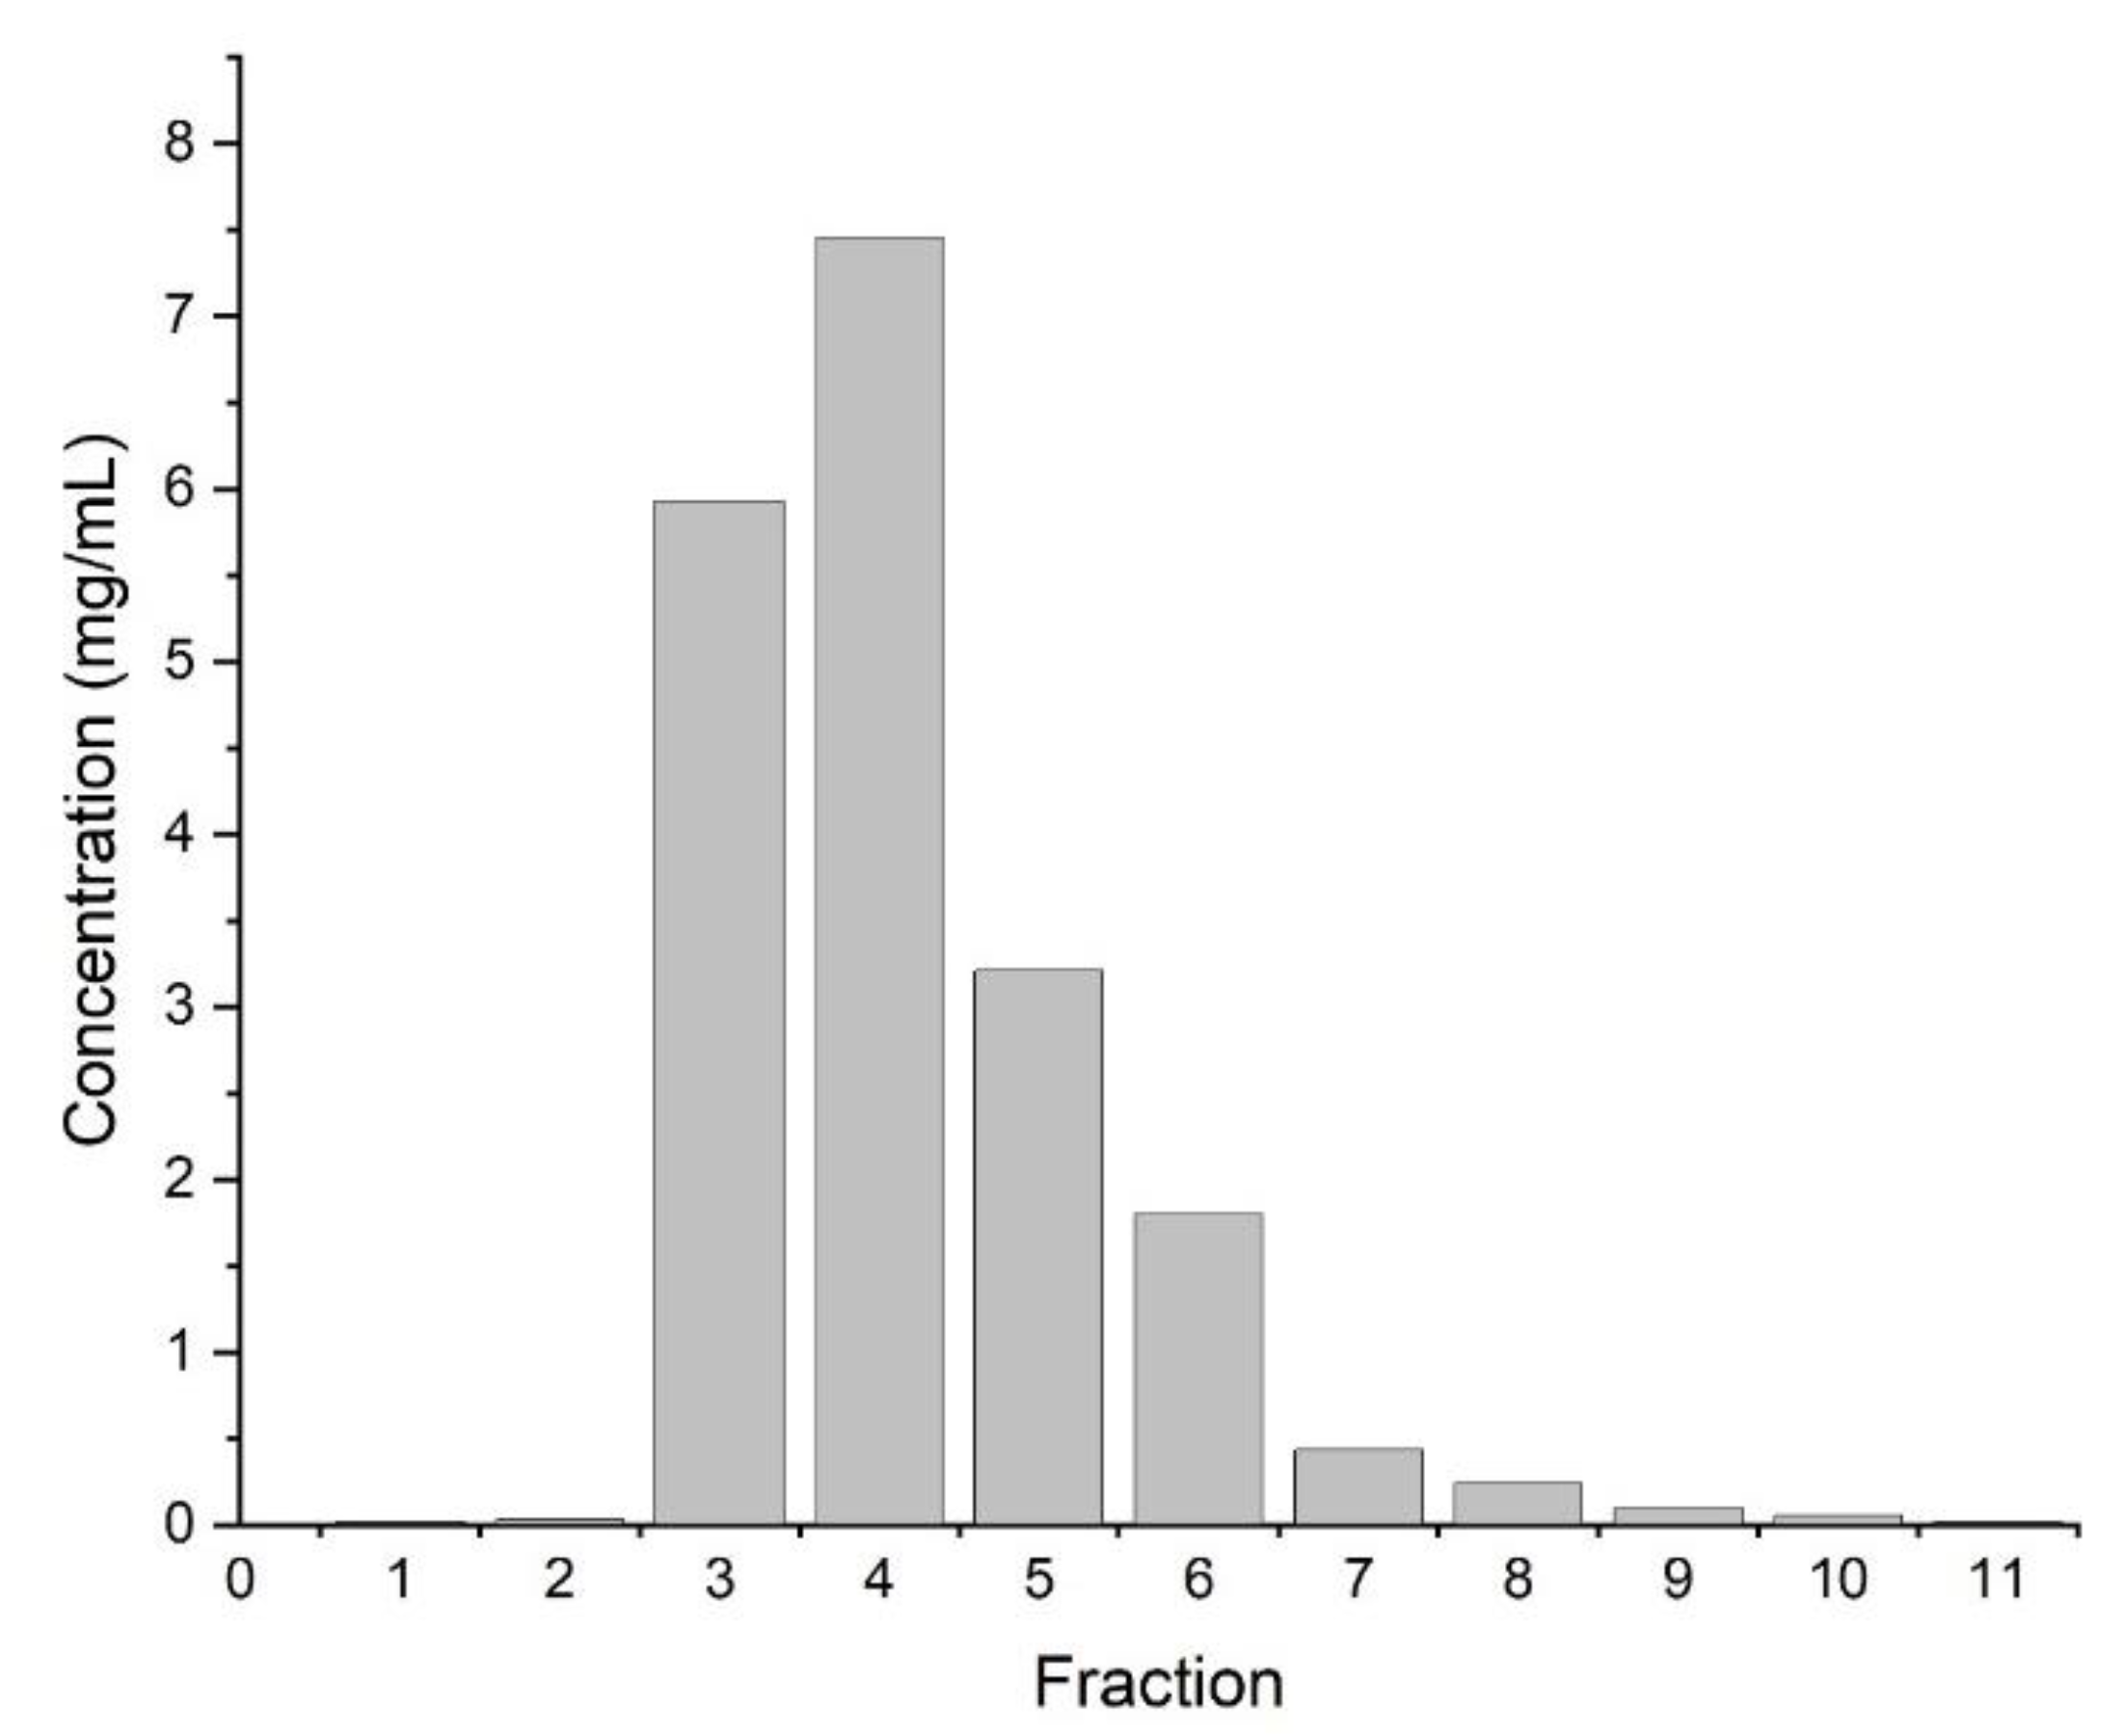
This experiment was performed on the FPLC system. Human plasma was diluted 1:5 in binding buffer, and 4 mL was injected onto the column with a flow rate of 5 mL/min. The elution peak was fractionated in 150 µL fractions and neutralized with 1 µL of NaOH (1 M) per 1 mL eluate. A calibration solution of γ-globulin from bovine in binding buffer (0/0.1/0.2/0.3/0.4/0.5 mg/mL) was diluted from a stock solution. The calibration samples and each FPLC fraction were examined on a UV/VIS-photometer at 280 nm (Evolution 220 from Thermo Fisher, Darmstadt, Germany). A calibration line was created to determine the concentration of each fraction.

3. Results

3.1. Pressure Tests

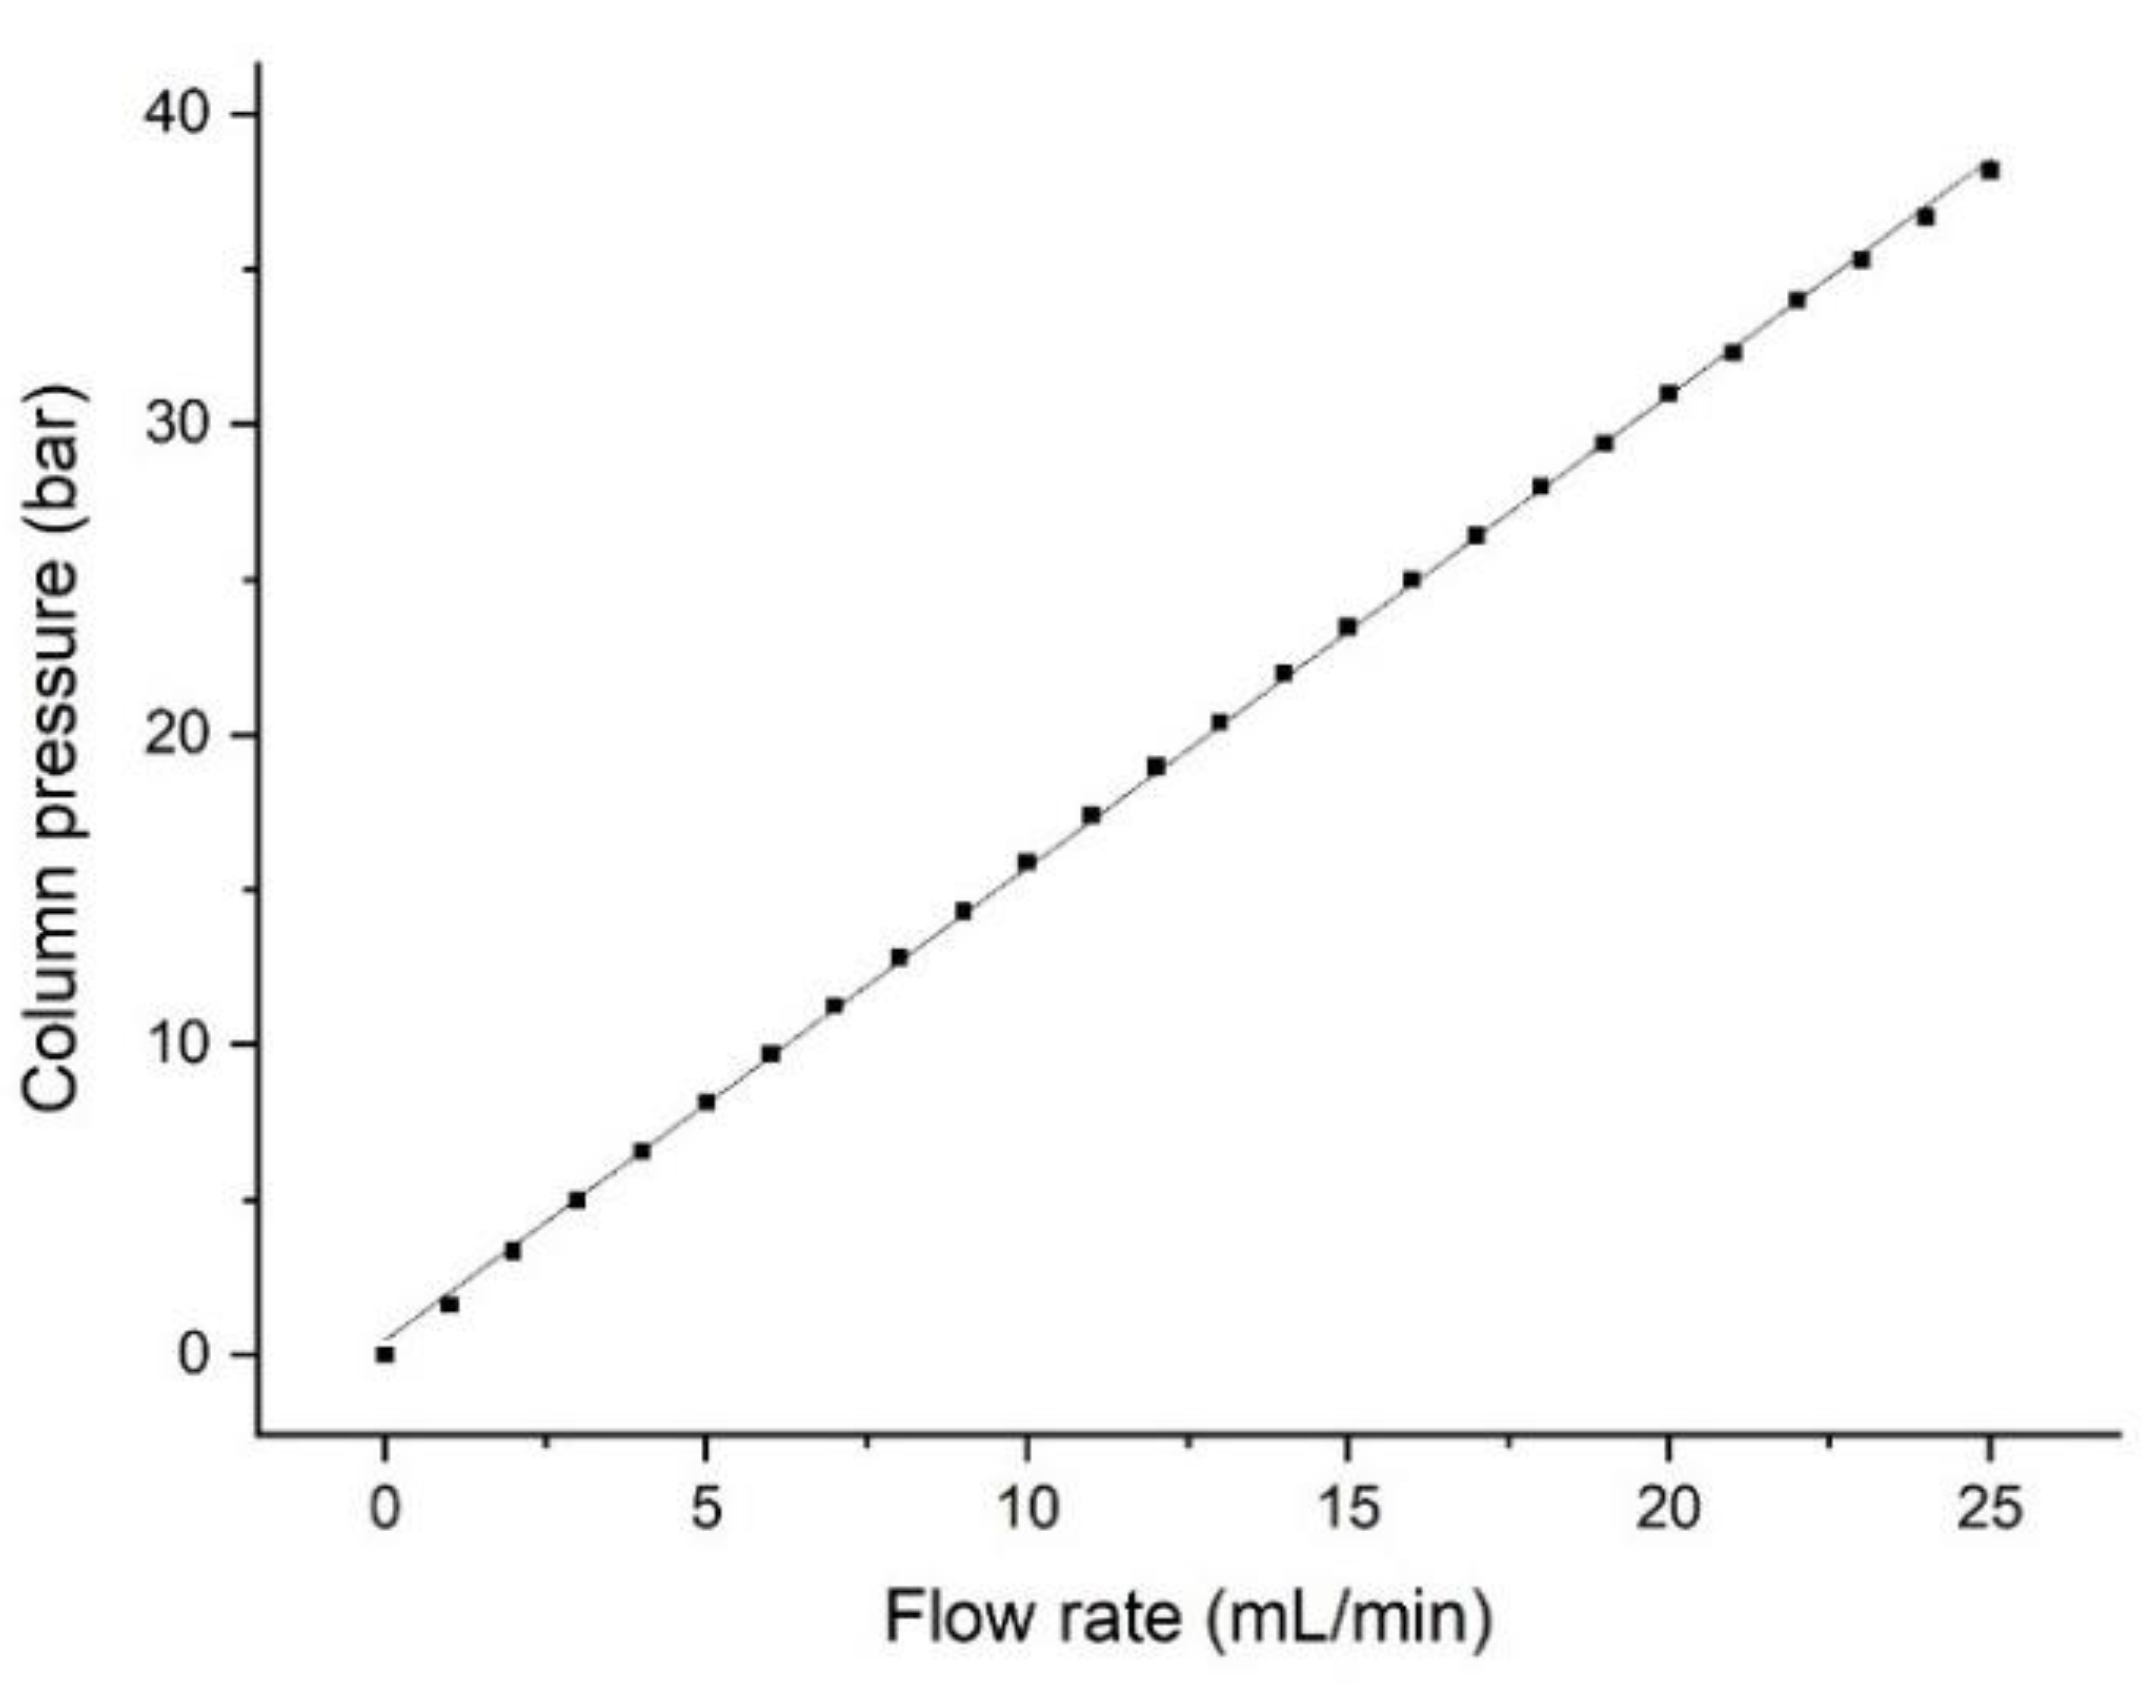
First of all, the flow characteristics and pressure resistance were determined to prove the leak-free gluing of the raw cylinder into the metal tubing. In Figure 5, the system pressure in relation to an increasing flow rate is shown. A strictly linear relationship was obtained. Considering the relatively small particles of the sintered monolith, the back-pressure is surprisingly low. This can be attributed to the irregular shape of the glass particles of VitraPOR5 (Figure 1), which leads to a relatively high void volume of 48% or 45.6% (according to the manufacturer, or by mercury intrusion), which is much higher compared to an ideal packing of spheres (26%).

3.2. Determination of the Monolith Capacity (IgG on Protein A)

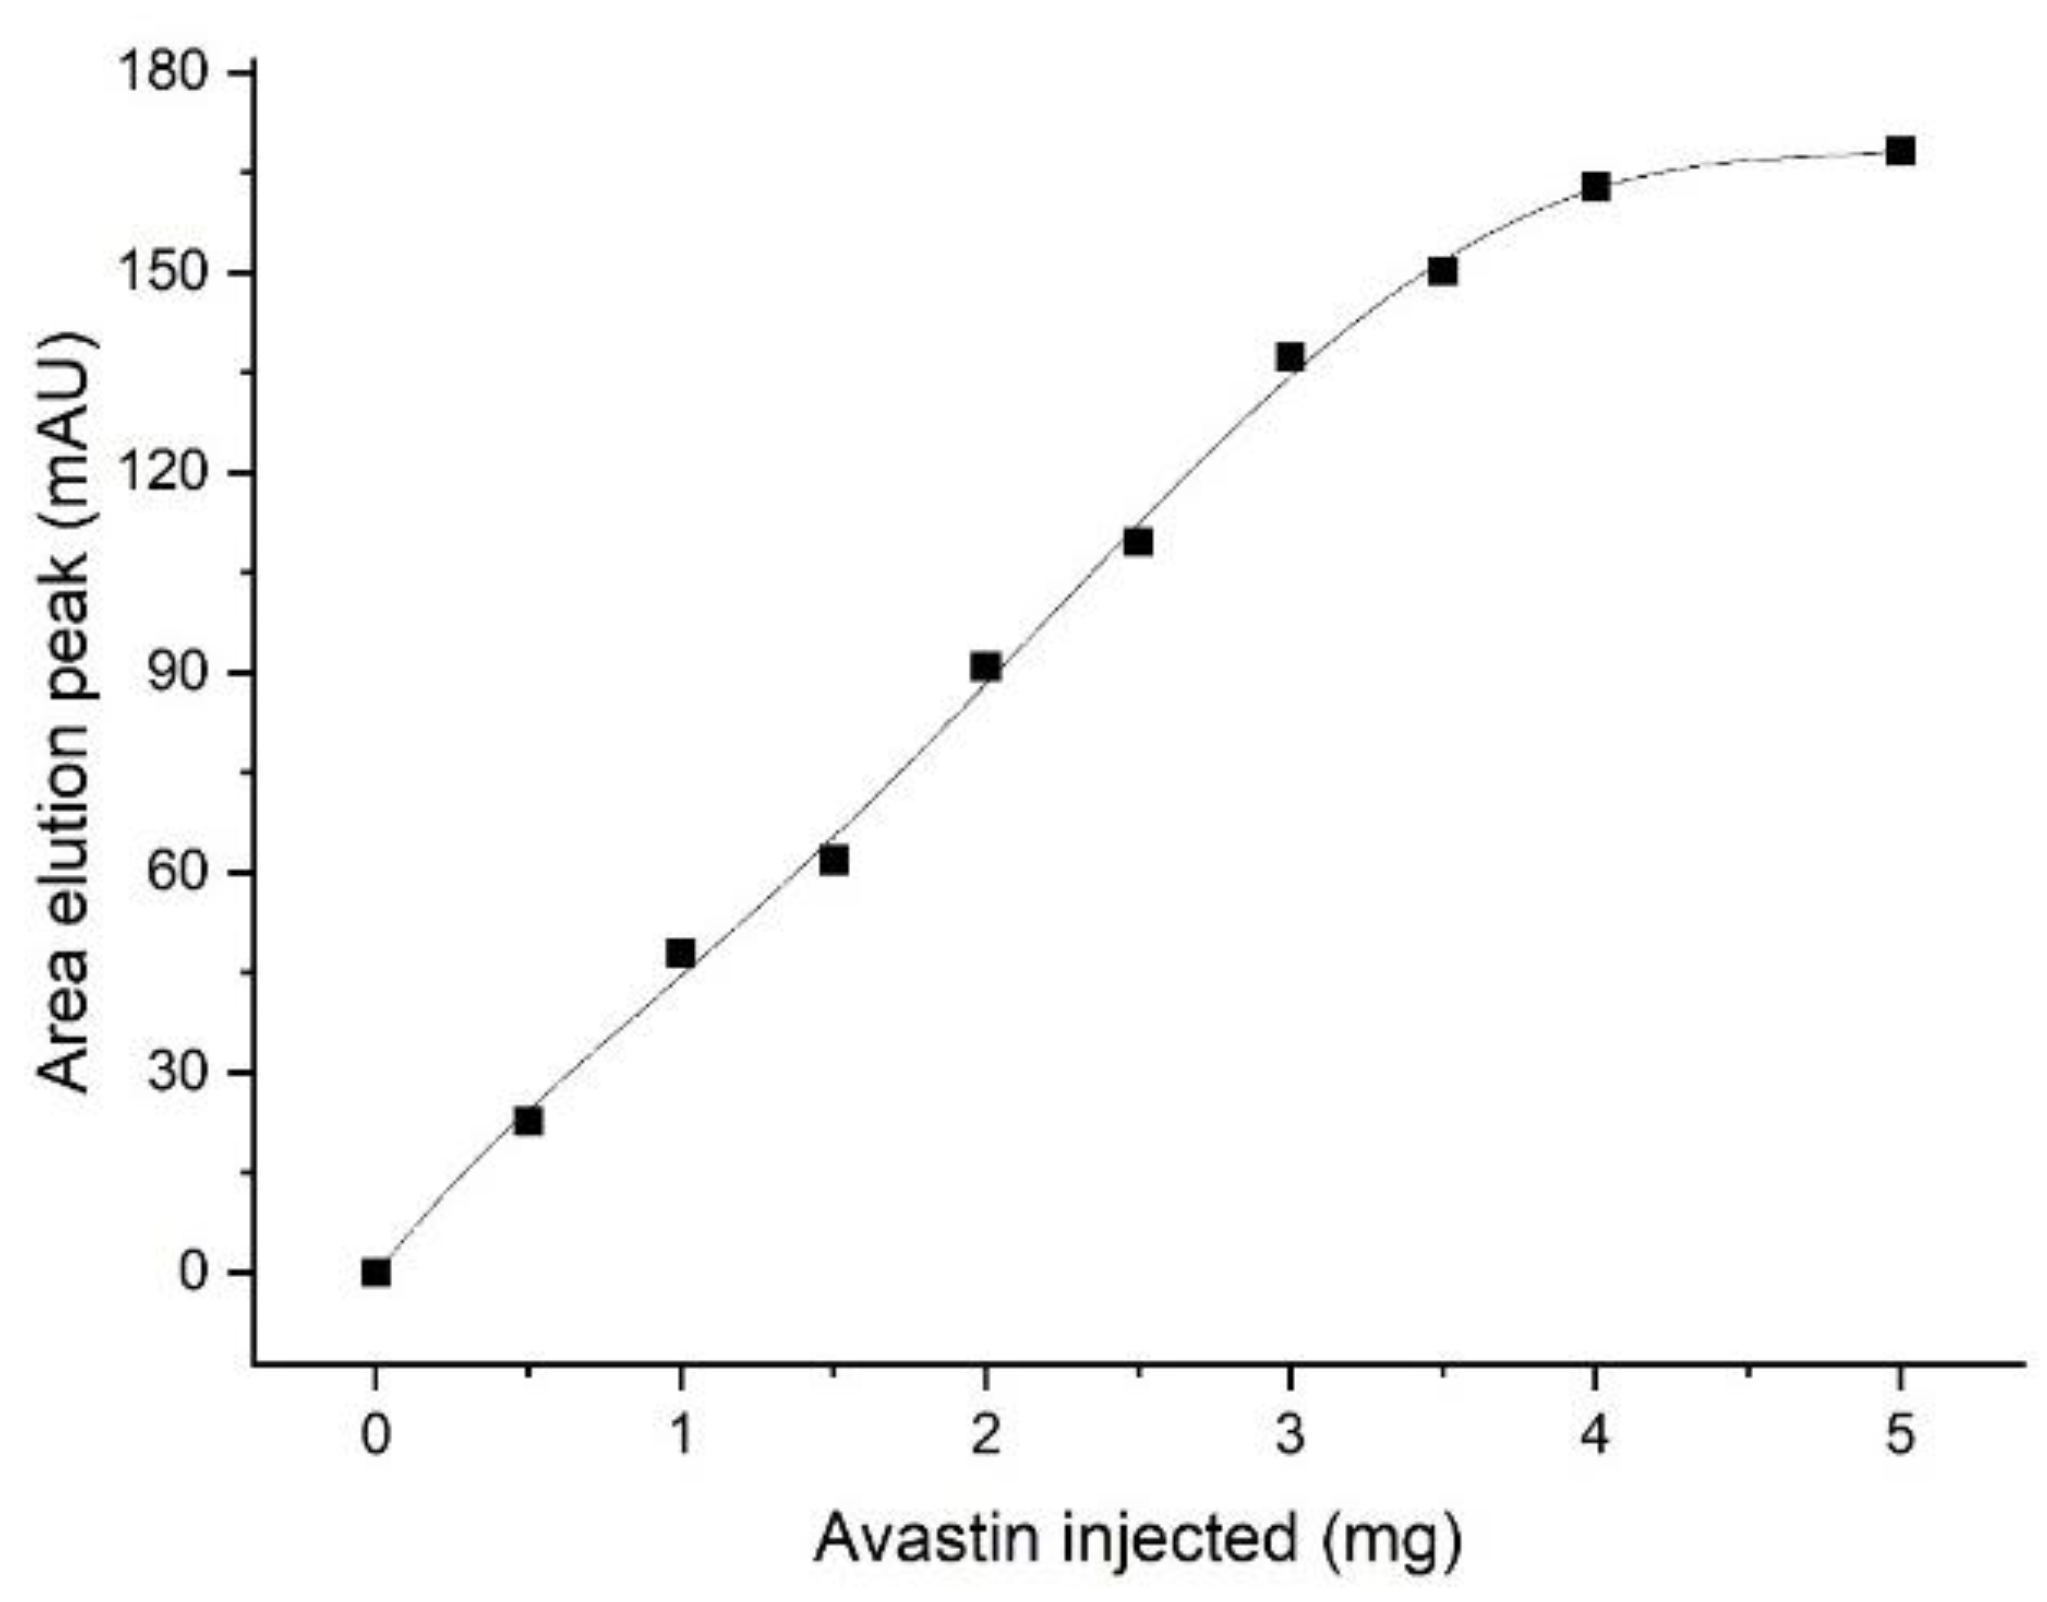
The capacity was estimated by injection of increasing amounts of human IgG. In Figure 6 the amount of injected IgG was increased stepwise until 5 mg were reached. Up to about 3 mg, the peak area increased proportionally. Saturation was achieved at about 5 mg of injected IgG.

3.3. Reversal of Flow Direction

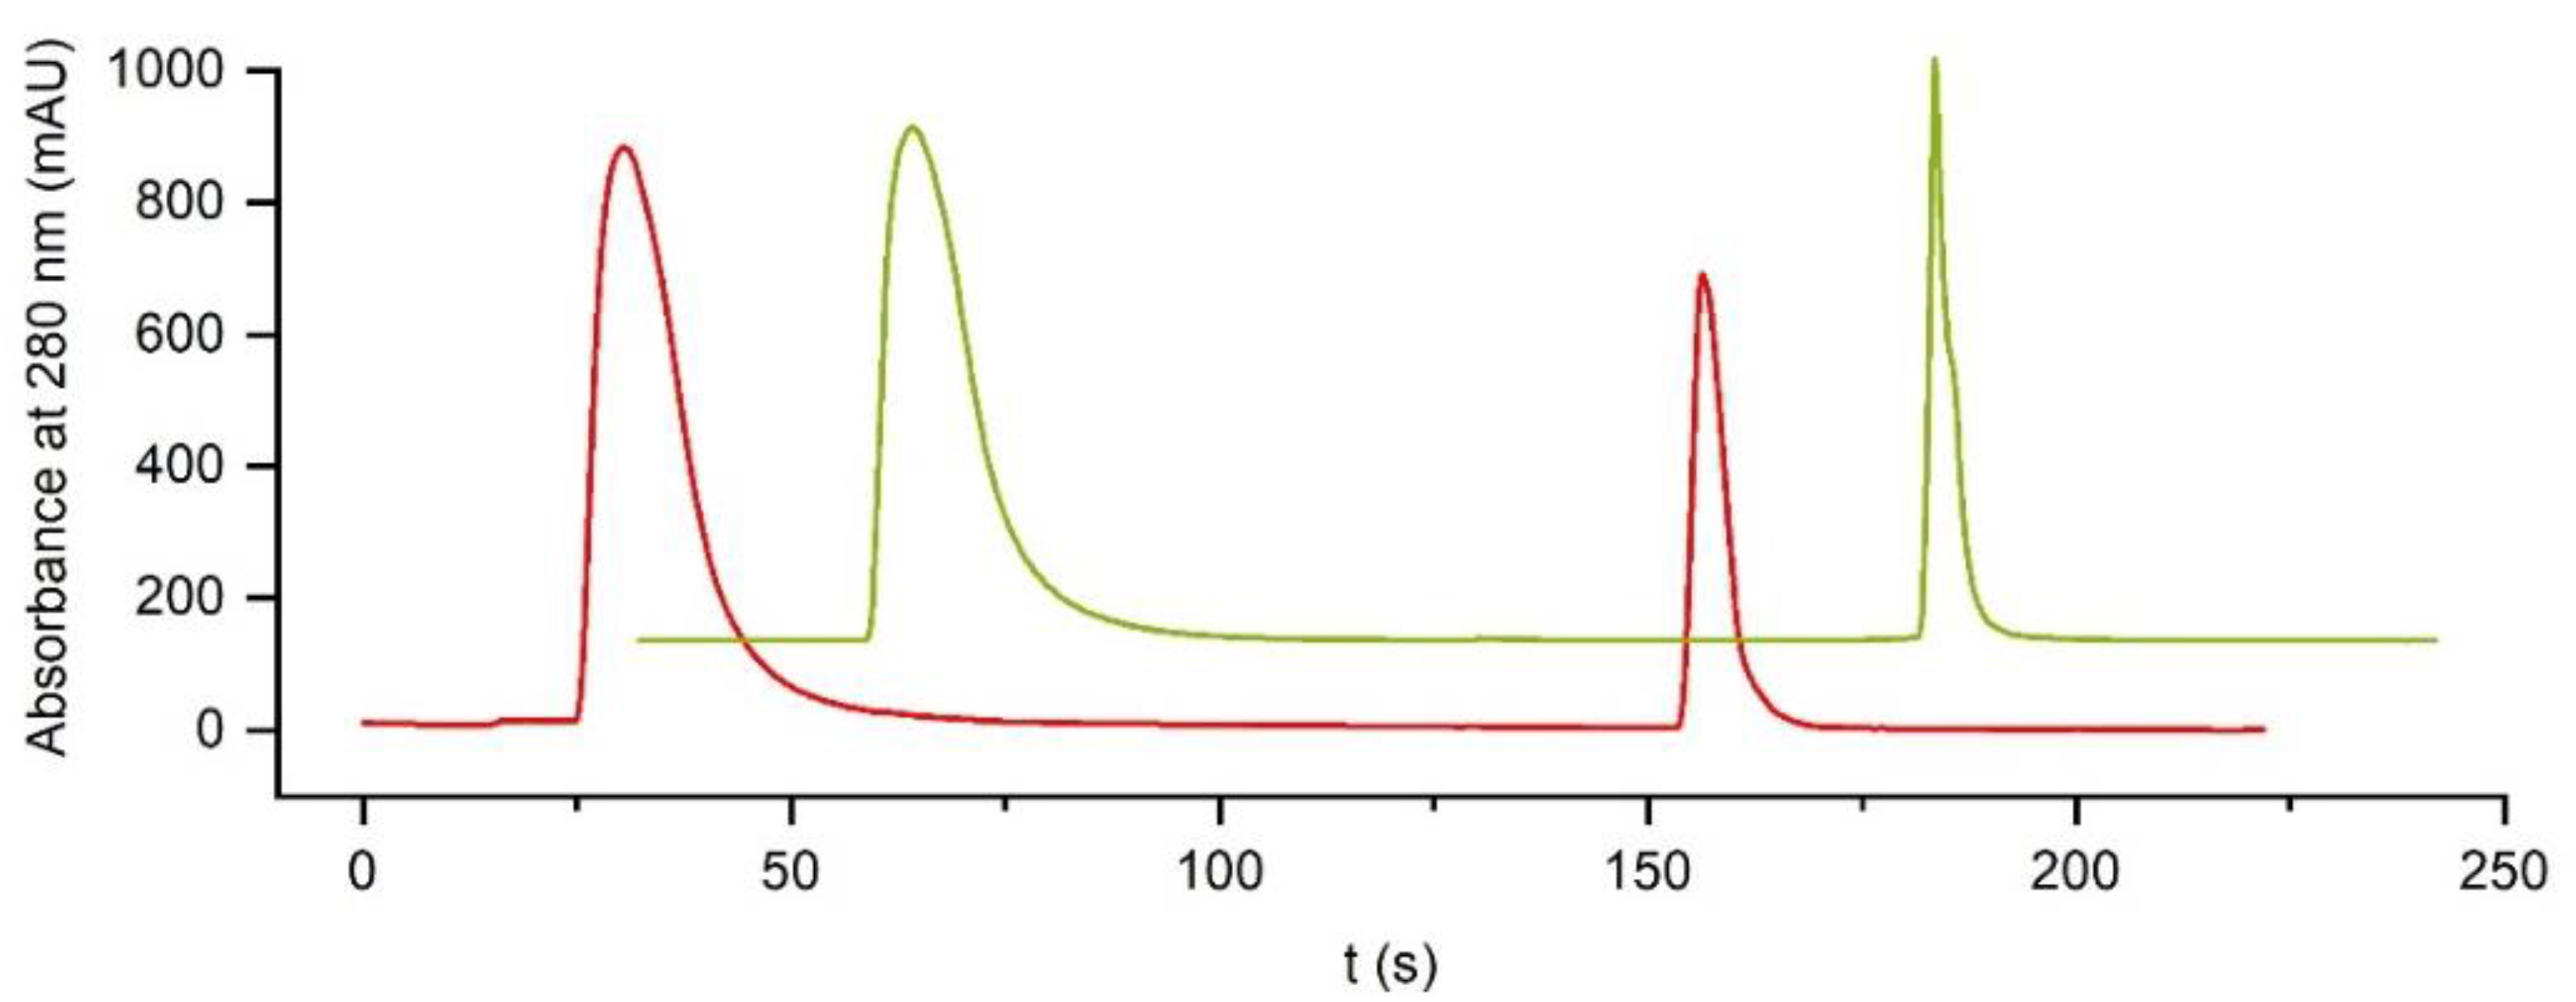
It is well-known from standard affinity systems that a reversed elution direction might reduce peak broadening. This is caused by the situation that only the head of the column is used in partially loaded columns. In a reversed elution step, the product directly leaves the column and does not need to pass through the rest of the column, leading to unnecessary peak broadening. In Figure 7, the sharper elution could be confirmed. Based on these results, the reversed elution direction was defined as the standard protocol. However, it should be considered that in cases when the column is completely saturated, this effect cannot be expected. We also observed this in our experiments (results not shown). Another advantage of the reversed elution direction is the partial removal of debris or other particles, which might clog the monolith after some time. On the other hand, these particles might end up in the final product without a filtration step, which might be seen as a disadvantage.

3.4. Examination of the Dynamic Capacity

In this experiment, the effect of different flow rates was examined (Figure 8). It could be shown that there is no difference in the corrected areas. This underlines the very good binding kinetics, which is due to the lack of any internal pore volume. As a consequence, these monoliths can be used at high flow rates without compromising their performance. This contrasts with many gel-based materials, which display poor binding kinetics and at high speeds even have the possibility of their destruction if their pressure limit is exceeded.

3.5. Repeatability Test (100 Cycles)

In order to show the long-term stability of the system, an experiment with 100 repetitions of an IgG determination from human plasma was performed (Figure 9). This shows that the affinity column is stable even when real samples are used. The extraordinary reproducibility improves the practical application since no manual intervention is necessary as the lifetime of such a column seems to be very long, and hence, no column exchange is required. In addition, the running costs of such a system are reduced compared to other known systems, which often can be used only very few times, and sometimes even any reuse is discouraged from the manufacturer.

3.6. Productivity Test (Amount of Purified IgG per Hour)

In this experiment, we tried to compare the productivity of a system based on a glass monolith to a standard system with a Sephadex column (Figure 10). Due to the low back-pressure, the high-pressure resistance, and the excellent binding kinetics, the monolith system is much faster, requiring only 0.7 min for a run compared to the Sephadex system with 13 min. Even considering the lower absolute capacity of the monolith, this system can purify about 250 mg IgG per hour, in contrast to 80 mg per hour in the Sephadex system, which is a productivity gain of 300%, if the column volume is considered.

3.7. Comparison of VitraPOR 4 and VitraPOR 5 Columns

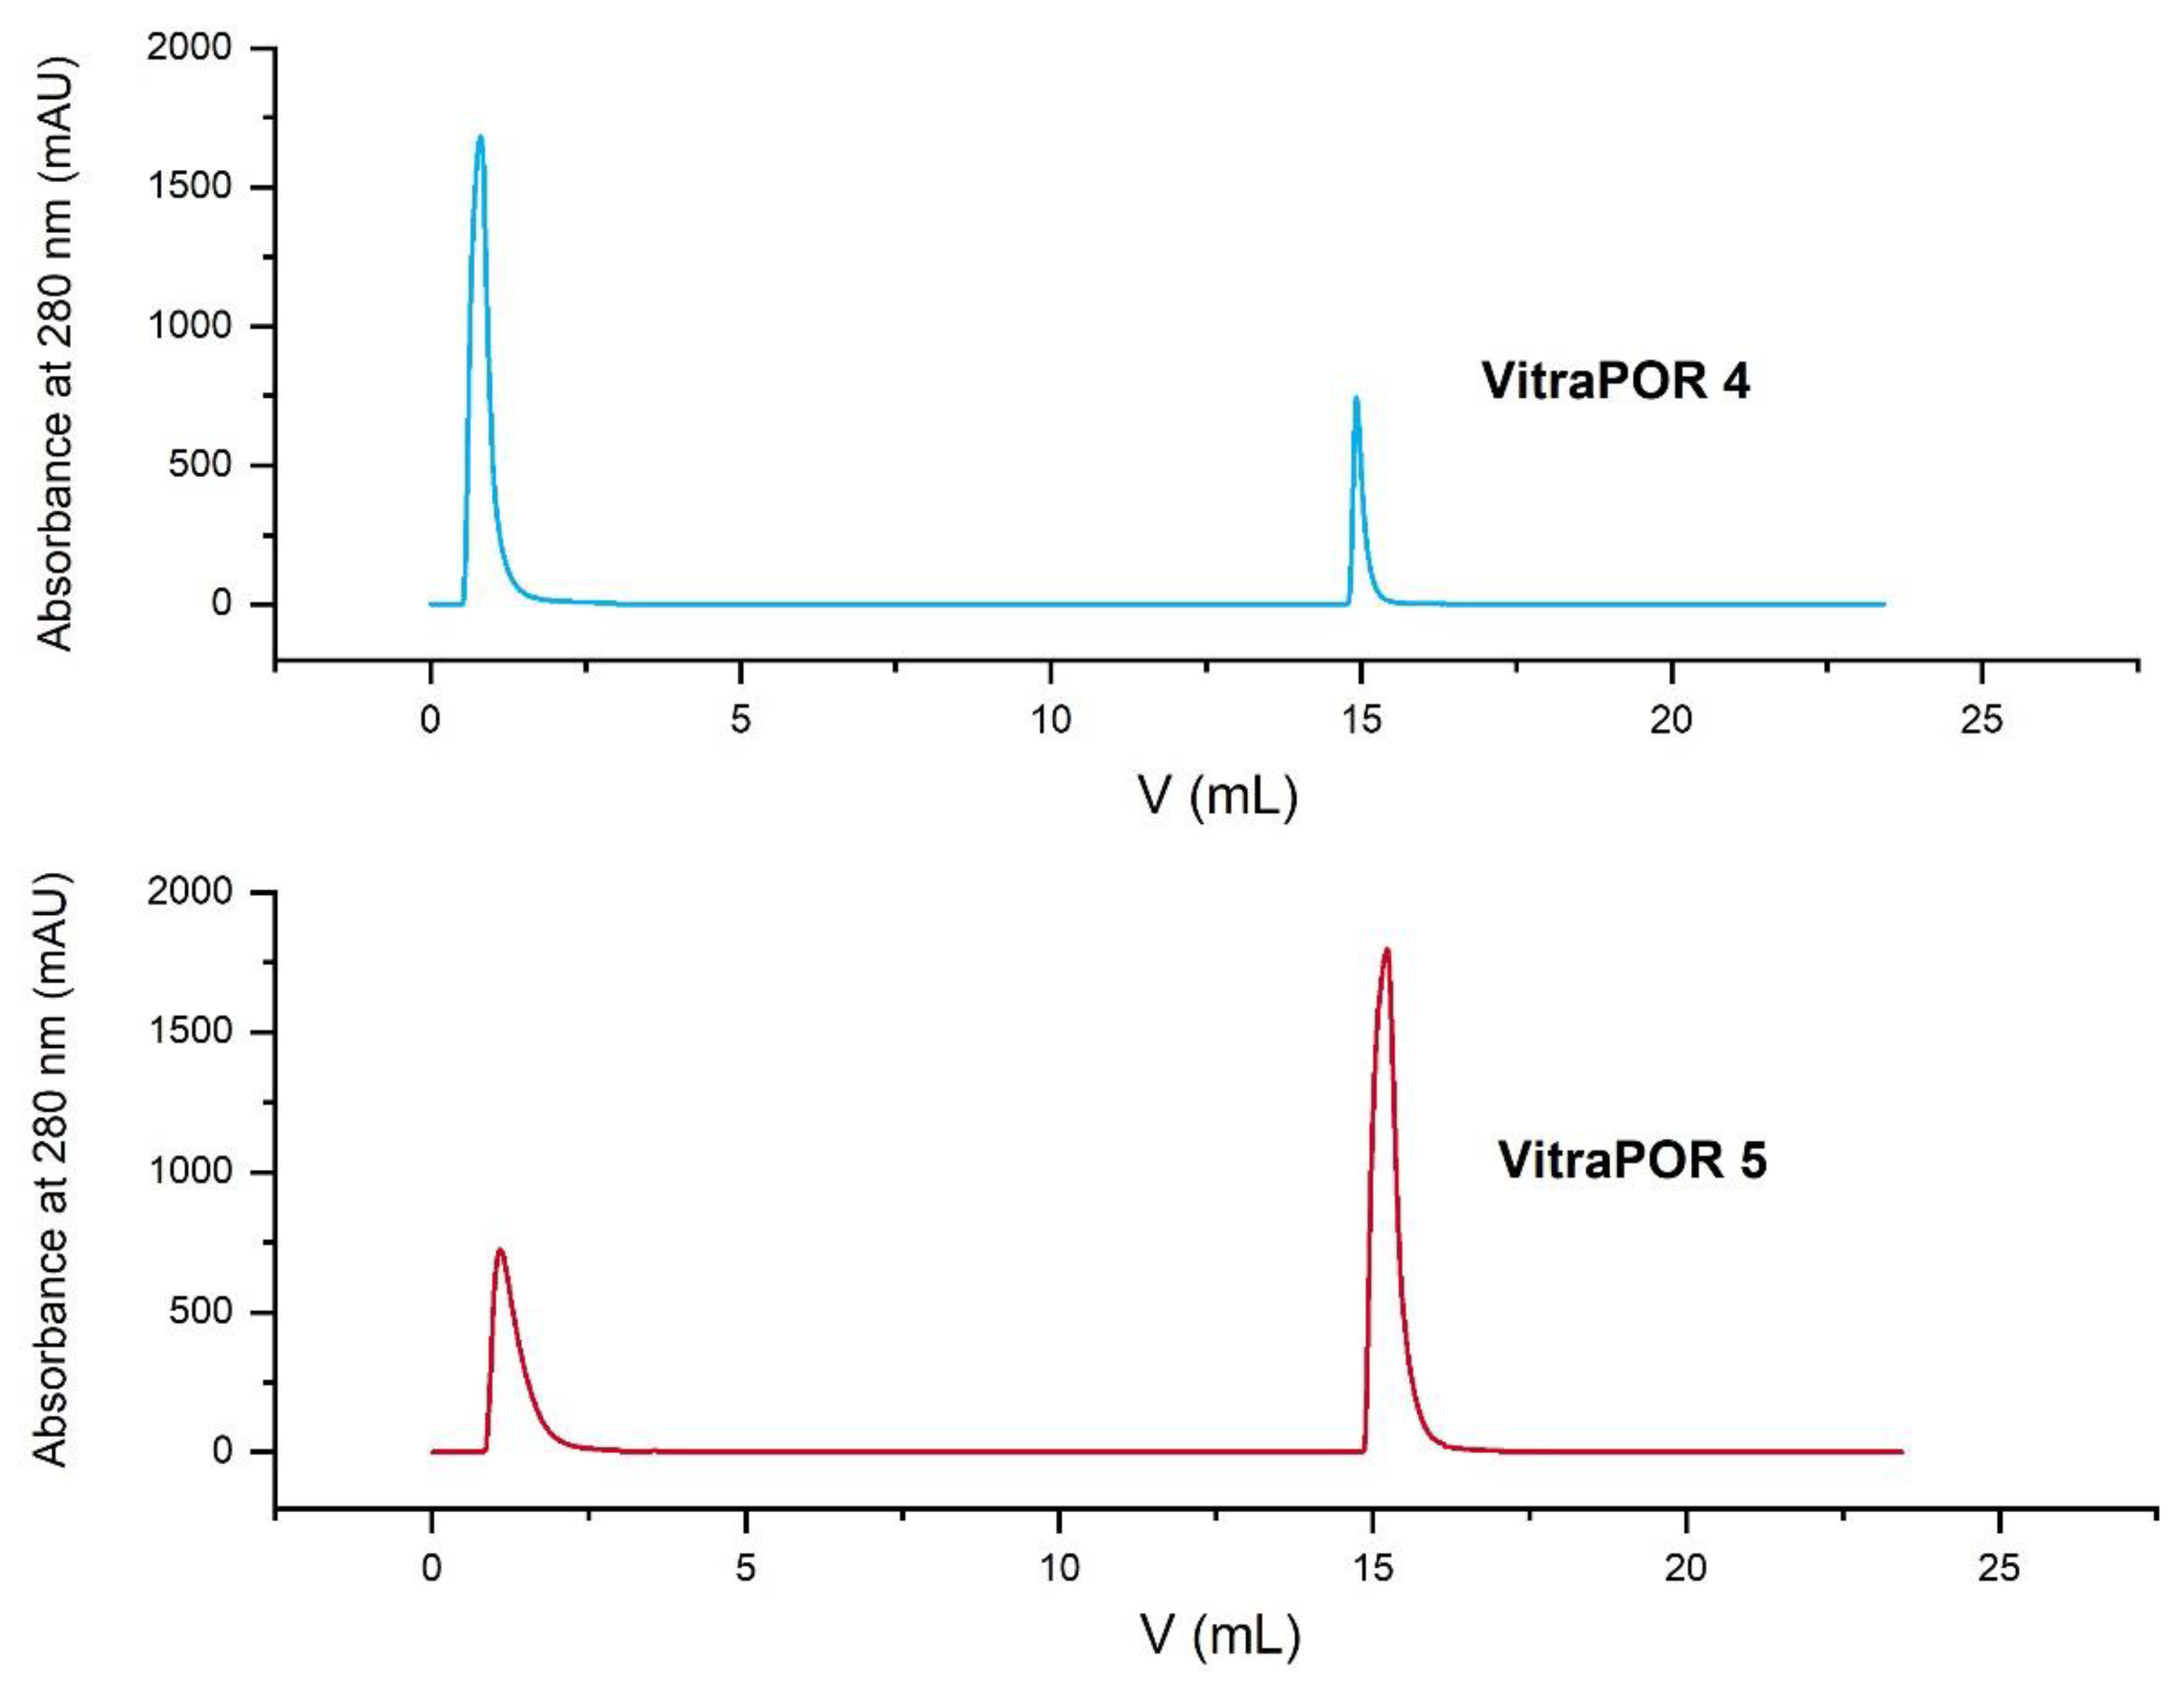
VitraPOR 4 and VitraPOR 5 are materials made of the same raw material but are manufactured from different particle sizes. VitraPOR 4 is specified with a pore size of 10–16 µm, a void volume of 42%, and an inner surface of 0.5 m2/g. VitraPOR 5 is specified with 1–1.6 µm, a void volume of 48%, and an inner surface of 1.75 m2/g. The different surface areas influence the maximum capacity of the columns (Figure 11). This effect was examined in the subsequent experiment.

3.8. Determination of IgG Purity

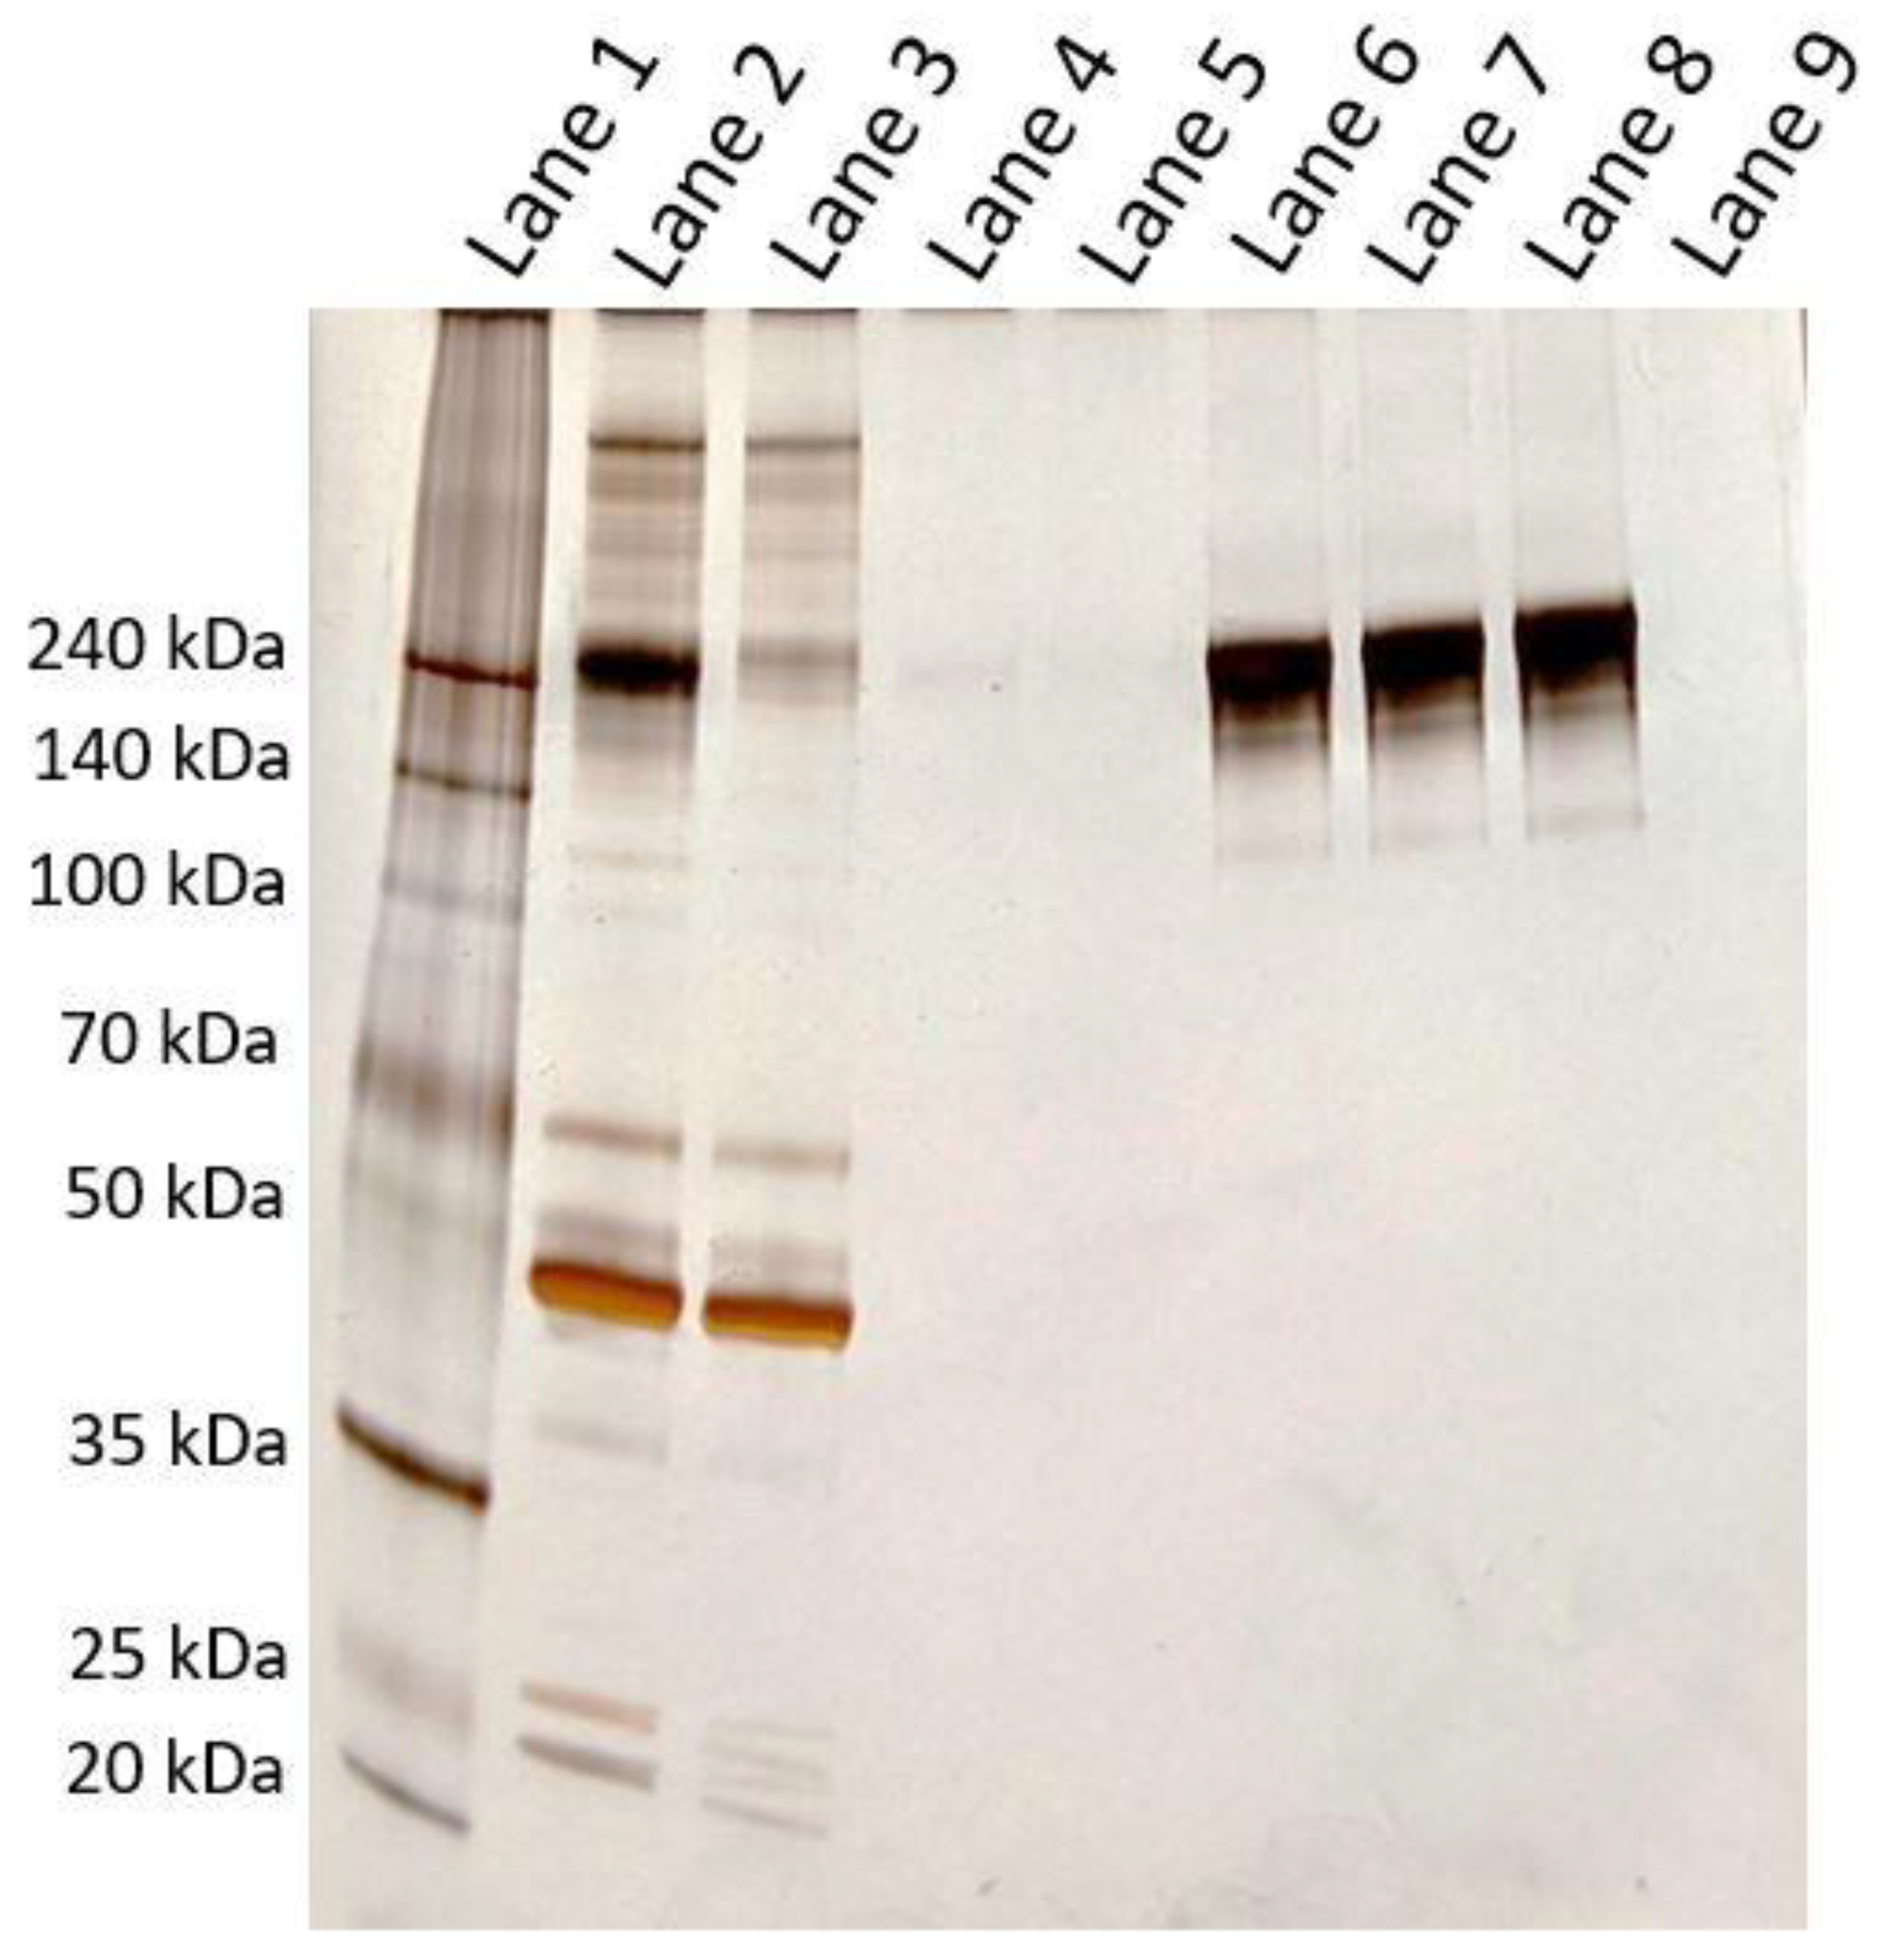
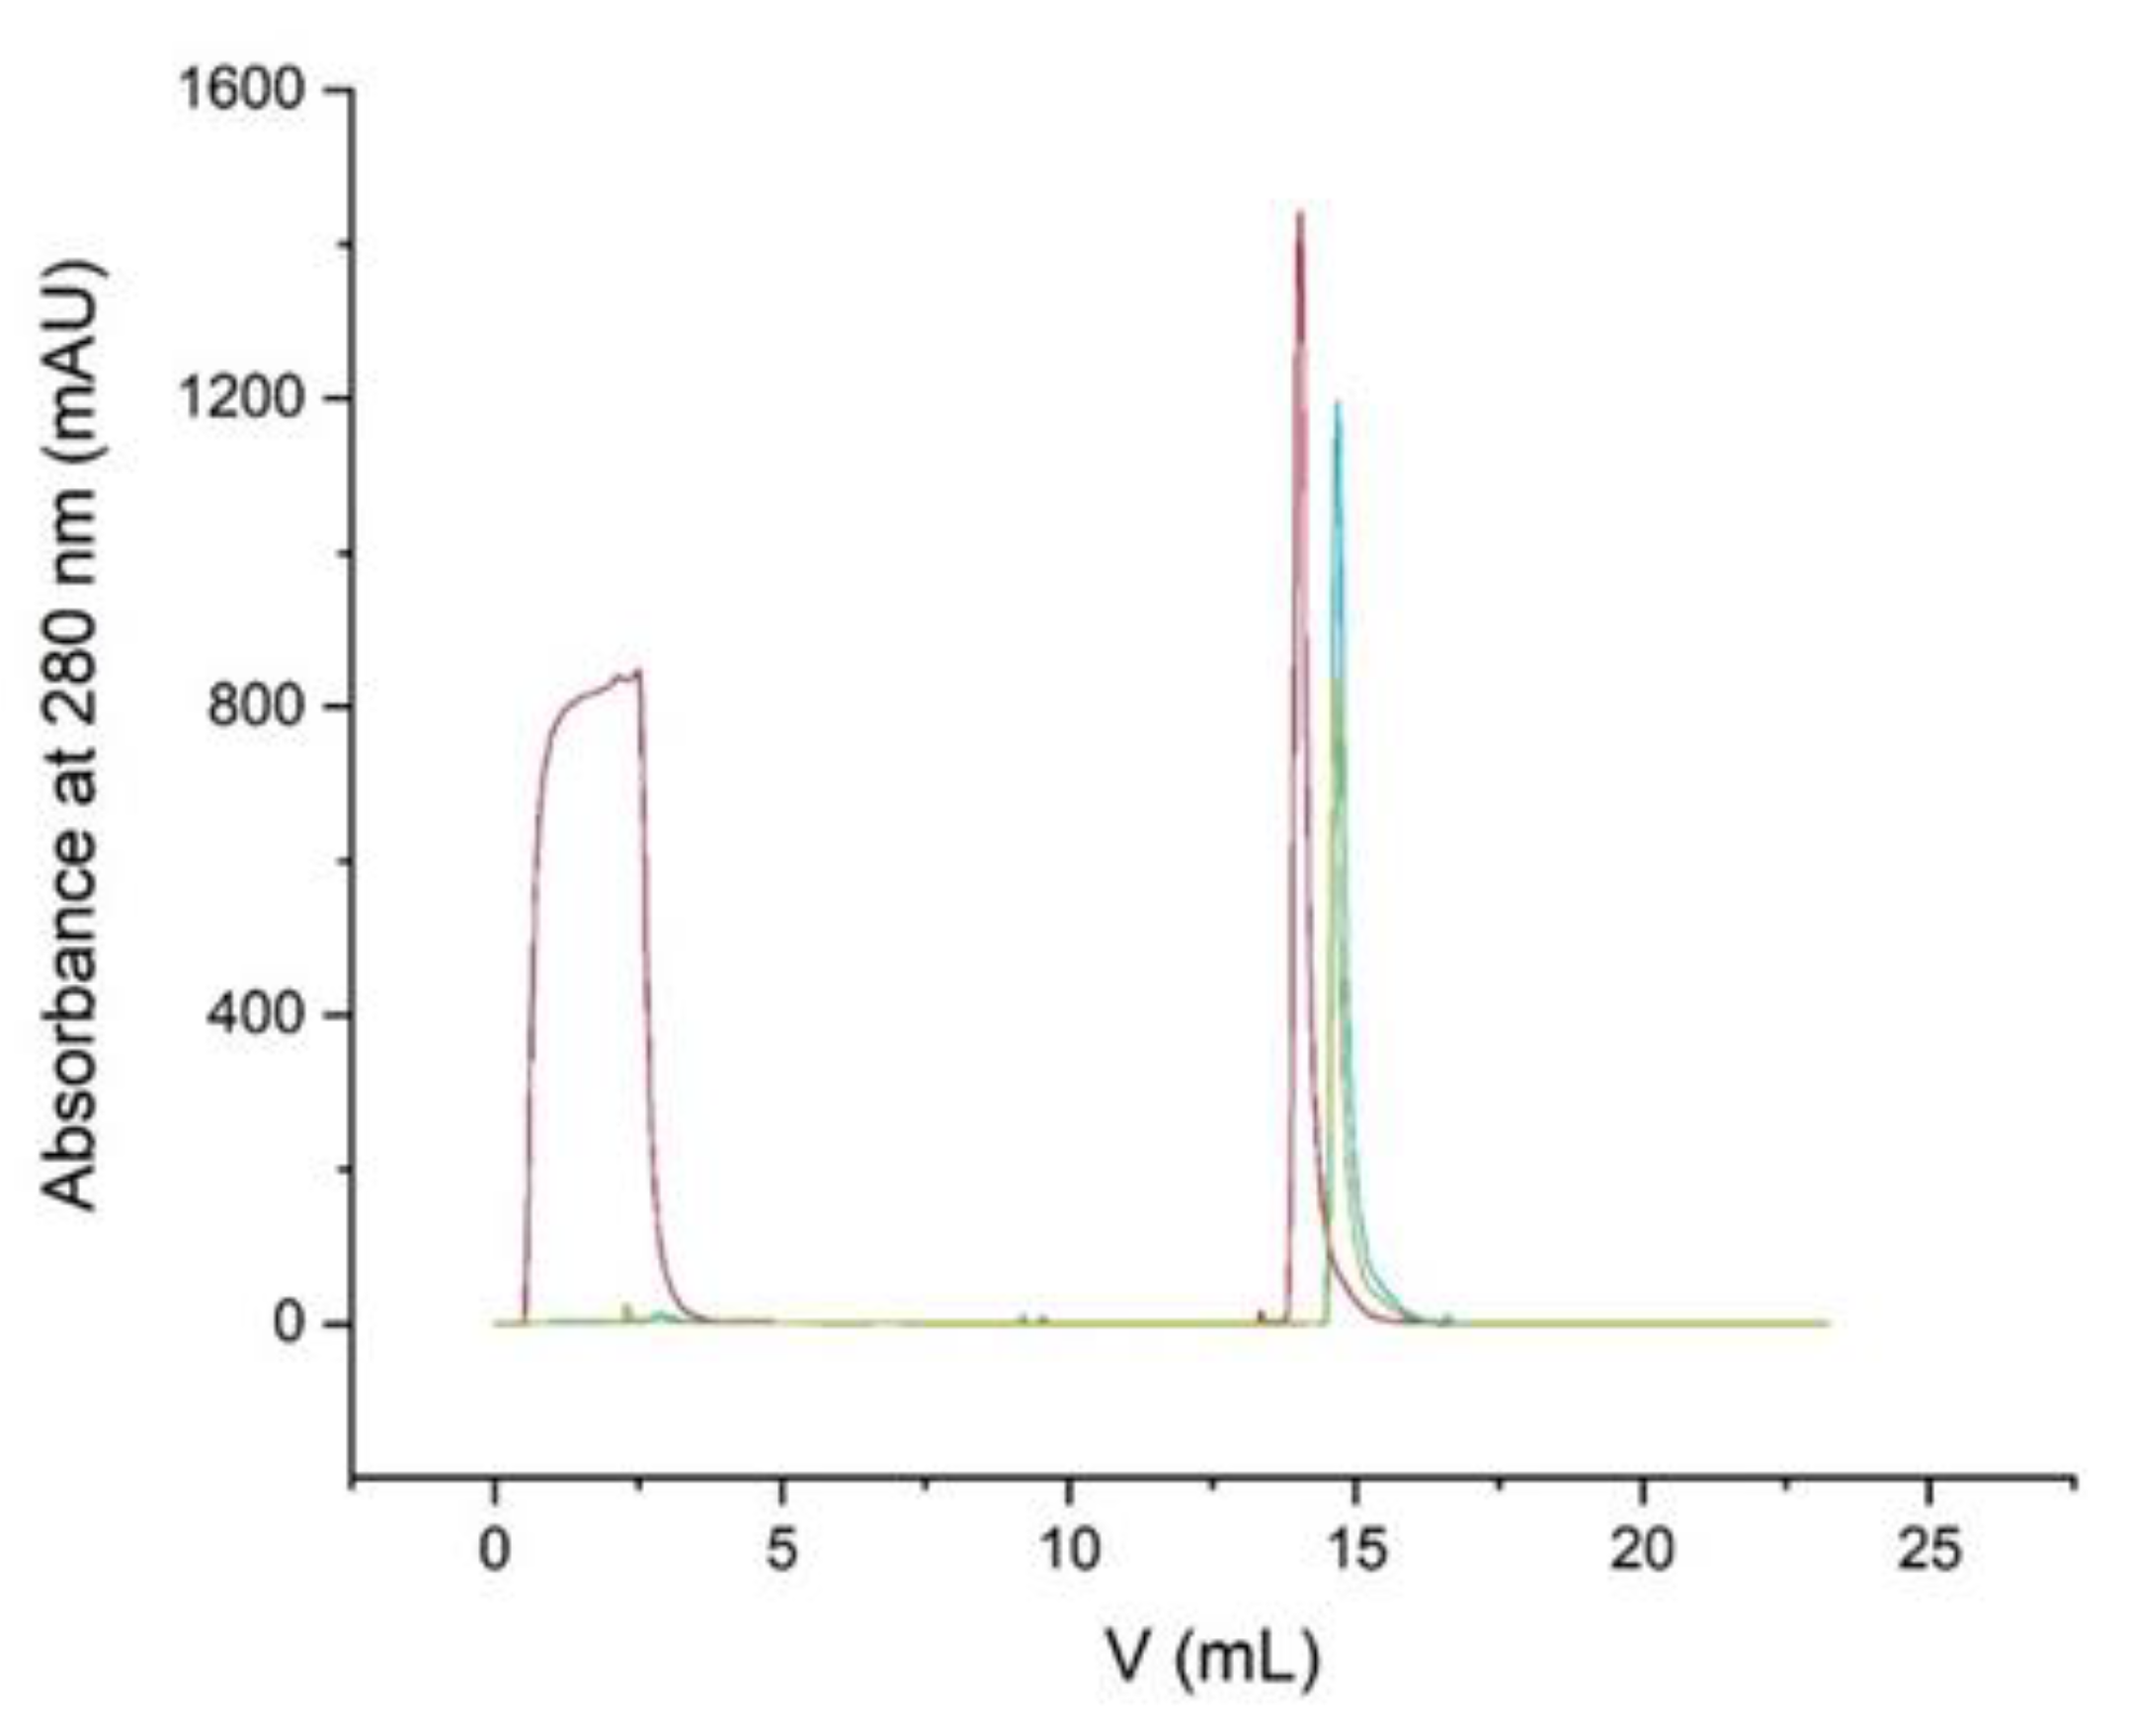
Although the purity of the isolated IgG is not only dependent on the stationary phase in a separation system, this property was examined to show that non-specific adsorption is not an issue of this system. The purity was determined by SDS-PAGE and highly sensitive silver staining, which would identify impurities in a semi-quantitative way. No additional bands could be identified (Figure 12). Furthermore, the isolated IgG from human plasma was reinjected onto the protein A column. Any non-specific impurities would lead to a significant void peak (Figure 13).

3.9. Calibration Curve of IgG

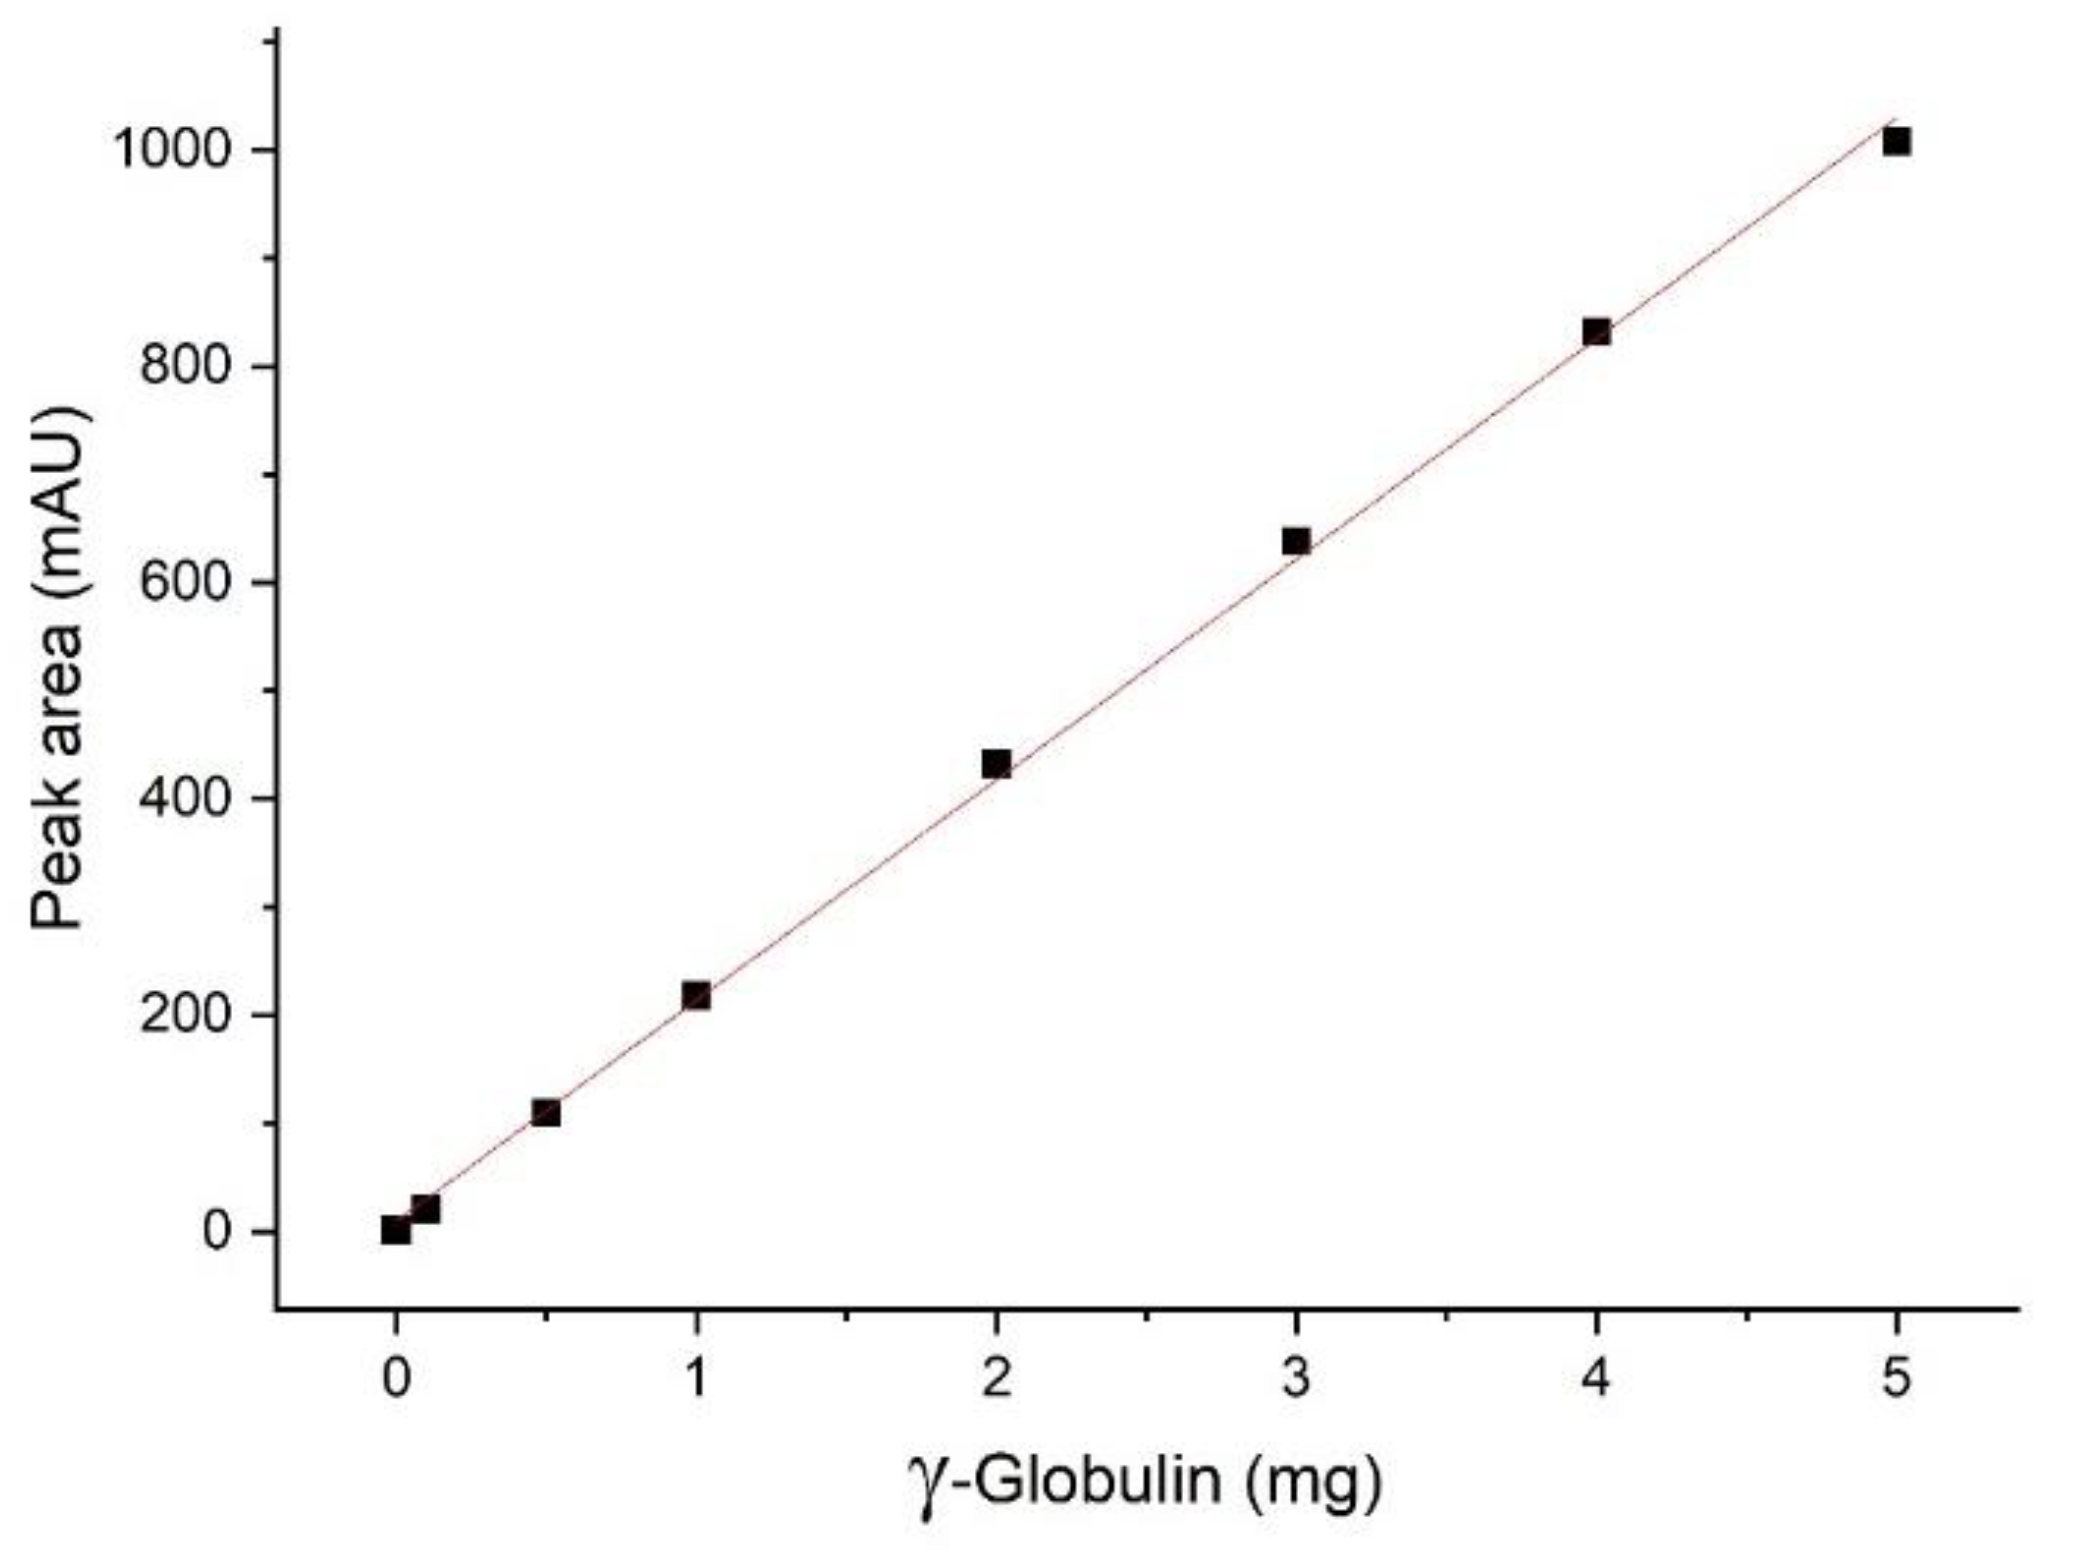
One of the most obvious applications of this monolithic column may be the fast determination of the IgG content of a sample. Such experiments can be performed by an FPLC or an HPLC system. The calibration curve in Figure 14 was performed on a low-pressure liquid chromatography system. This experiment is much faster than an ELISA, which might be considered as an alternative, as long as only a few samples are to be examined. Here, bovine γ-globulin was used in a concentration range between 0 and 20 mg/mL. Direct injection of the protein without a column was used for calibration.

3.10. Enrichment Effect

In many cases, an additional step needs to be performed after the IgG elution to achieve a sufficient product concentration. This enrichment step might be unnecessary when monolithic columns are used due to the very narrow peak shape. A concentration of up to 7.5 mg/mL was achieved directly (Figure 15). For most applications, this should be adequate.

4. Discussion

In this paper, a novel monolithic support is presented, which was tested with affinity separations of IgG from human plasma. This monolithic material, based on sintered borosilicate glass 3.3, has shown excellent kinetic properties and pressure resistance; 38 bar (550 psi) was tested successfully. Due to the very economical production and long lifetime, this affinity material seems to be an attractive alternative to more expensive and less robust stationary phases. Surface chemistry based on organosilanes [18,19] opens up innumerable options for ligand immobilization and surface modification. Protein A [20,21,22] as a binder was examined as a model system. A total capacity of about 4 mg IgG per column was determined. In regeneration experiments, not even a minimal decay of the performance can be noticed during 100 cycles. This also means that the cost of the column per run is extremely low. Due to the very fast separation speed in relation to gel-based columns, a productivity gain of 300% (up to 250 mg/h) can be achieved with the monolith. As expected, a reversed elution direction leads to a sharper elution peak, with concentrations of up to 7.5 mg/mL of IgG. The excellent commercial availability of the raw monoliths and the application of 3D printing for the column holder make this approach feasible for many laboratories. Mainly the automated small-scale purification of antibodies (0.1–10 mg) or the quantitative determination of IgG from complex samples seems to be a preferential application of this system.
Nevertheless, the upscaling of such columns might be feasible. Raw monoliths up to a volume of 7 L are commercially available. Even larger columns may be possible. Due to the very good stability of these columns, they may be used for years without the need for replacement. The development and production of monolithic columns from large plates of sintered materials, not only borosilicate glass and quartz but also metal powders, polymers or ceramics, might be a superior way to manufacture monoliths with excellent homogeneity and low cost. This might overcome the limited availability and market share of monolithic separation systems. Finally, similar monoliths might be useful not only in separation science but also for biosensors [23], sample clean-up, online immunocapture applications [24,25], monolithic bed enzyme reactors [26], or other biochemical and biotechnological applications, such as adherent cell culture.

Supplementary Materials

The following are available online at https://www.mdpi.com/article/10.3390/separations8050056/s1, Supplement_1.pdf: Manufacturing monolithic glass columns and a compatible column holder produced by 3D printing, Supplement_2.zip: Construction views, Supplement_3.zip: Construction data.

Author Contributions

Conceptualization, M.G.W.; methodology, M.W. and M.G.W.; investigation, M.W. and M.G.W.; writing—original draft preparation, M.G.W.; writing—review and editing, M.W., B.R., M.P. and M.G.W.; project administration, M.G.W.; construction and engineering drawings, B.R. and M.P. All authors have read and agreed to the published version of the manuscript.

Funding

This research received no external funding.

Informed Consent Statement

Not applicable.

Data Availability Statement

Not applicable.

Acknowledgments

We would like to thank Knauer Wissenschaftliche Geräte GmbH for early support of this project. Furthermore, we thank Weicon GmbH for the supply of silicone glue. Also, we acknowledge Ines Feldmann (BAM division 4.2) for the preparation of ESEM images. Finally, we are indebted to Franziska Diezmann, Peter Taube, Annett Zimathies, and Thomas Schmid for their contributions to this project.

Conflicts of Interest

The authors declare no conflict of interest.

References

  1. Li, Z.; Rodriguez, E.; Azaria, S.; Pekarek, A.; Hage, D.S. Affinity monolith chromatography: A review of general principles and applications. Electrophoresis 2017, 38, 2837–2850. [Google Scholar] [CrossRef] [PubMed]
  2. Delaunay, N.; Pichon, V.; Hennion, M.C. Immunoaffinity solid-phase extraction for the trace-analysis of low-molecular-mass analytes in complex sample matrices. J. Chromatogr. B 2000, 745, 15–37. [Google Scholar] [CrossRef]
  3. Cuatrecasas, P. Protein purification by affinity chromatography - Derivatizations of agarose and polyacrylamide beads. J. Biol. Chem. 1970, 245, 3059–3065. [Google Scholar]
  4. Pecher, H.S.; Zimathies, A.; Weller, M.G. Oligoepoxide-Based monoliths: Synthesis and application as affinity capillary column for enrichment of immunoglobulin G. Macromol. Chem. Phys. 2012, 213, 2398–2403. [Google Scholar] [CrossRef]
  5. Narayanan, S.R.; Crane, L.J. Affinity-Chromatography supports—A look at performance requirements. Trends Biotechnol. 1990, 8, 12–16. [Google Scholar] [CrossRef]
  6. Ayyar, B.V.; Arora, S.; Murphy, C.; O’Kennedy, R. Affinity chromatography as a tool for antibody purification. Methods 2012, 56, 116–129. [Google Scholar] [CrossRef] [PubMed]
  7. Spross, J.; Sinz, A. Monolithic media for applications in affinity chromatography. J. Sep. Sci. 2011, 34, 1958–1973. [Google Scholar] [CrossRef] [PubMed]
  8. Svec, F. Monolithic columns: A historical overview. Electrophoresis 2017, 38, 2810–2820. [Google Scholar] [CrossRef] [PubMed]
  9. Miyabe, K.; Guiochon, G. Characterization of monolithic columns for HPLC. J. Sep. Sci. 2004, 27, 853–873. [Google Scholar] [CrossRef]
  10. Svec, F.; Frechet, J.M.J. Continuous rods of macroporous polymer as high-performance liquid-chromatography separation media. Anal. Chem. 1992, 64, 820–822. [Google Scholar] [CrossRef]
  11. Peters, E.C.; Petro, M.; Svec, F.; Frechet, J.M.J. Molded rigid polymer monoliths as separation media for capillary electrochromatography. Anal. Chem. 1997, 69, 3646–3649. [Google Scholar] [CrossRef] [PubMed]
  12. Minakuchi, H.; Nakanishi, K.; Soga, N.; Ishizuka, N.; Tanaka, N. Octadecylsilylated porous silica rods as separation media for reversed-phase liquid chromatography. Anal. Chem. 1996, 68, 3498–3501. [Google Scholar] [CrossRef] [PubMed]
  13. Pfaunmiller, E.L.; Paulemond, M.L.; Dupper, C.M.; Hage, D.S. Affinity monolith chromatography: A review of principles and recent analytical applications. Anal. Bioanal. Chem. 2013, 405, 2133–2145. [Google Scholar] [CrossRef] [PubMed] [Green Version]
  14. Cabrera, K. Applications of silica-based monolithic HPLC columns. J. Sep. Sci. 2004, 27, 843–852. [Google Scholar] [CrossRef] [PubMed]
  15. Hage, D.S. Affinity chromatography: A review of clinical applications. Clin. Chem. 1999, 45, 593–615. [Google Scholar] [CrossRef] [PubMed]
  16. Weller, M.G. Immunochromatographic techniques—A critical review. Anal. Bioanal. Chem. 2000, 366, 635–645. [Google Scholar] [CrossRef]
  17. Schnabel, R.; Langer, P. Controlled-Pore glass as a stationary phase in chromatography. J. Chromatogr. 1991, 544, 137–146. [Google Scholar] [CrossRef]
  18. Buszewski, B.; Jezierska, M.; Welniak, M.; Berek, D. Survey and trends in the preparation of chemically bonded silica phases for liquid chromatographic analysis. Hrc J. High Res. Chrom. 1998, 21, 267–281. [Google Scholar] [CrossRef]
  19. Kirkland, J.J.; Glajch, J.L.; Farlee, R.D. Synthesis and characterization of highly stable bonded phases for high-performance liquid-chromatography column packings. Anal. Chem. 1989, 61, 2–11. [Google Scholar] [CrossRef]
  20. Chollangi, S.; Parker, R.; Singh, N.; Li, Y.; Borys, M.; Li, Z.J. Development of robust antibody purification by optimizing protein-A chromatography in combination with precipitation methodologies. Biotechnol. Bioeng. 2015, 112, 2292–2304. [Google Scholar] [CrossRef] [PubMed]
  21. Ramos-de-la-Pena, A.M.; Gonzalez-Valdez, J.; Aguilar, O. Protein A chromatography: Challenges and progress in the purification of monoclonal antibodies. J. Sep. Sci. 2019, 42, 1816–1827. [Google Scholar] [CrossRef] [PubMed]
  22. Schroeder, B.; Le Xuan, H.; Völzke, J.L.; Weller, M.G. Preactivation crosslinking—An efficient method for the oriented immobilization of antibodies. Methods Protoc. 2019, 2, 35. [Google Scholar] [CrossRef] [Green Version]
  23. Paul, M.; Tscheuschner, G.; Herrmann, S.; Weller, M.G. Fast detection of 2,4,6-Trinitrotoluene (TNT) at ppt Level by a laser-induced immunofluorometric biosensor. Biosensors 2020, 10, 89. [Google Scholar] [CrossRef] [PubMed]
  24. Kellie, J.; Szapacs, M. Quantitative immunocapture MS: Current status and challenges in drug discovery. Bioanalysis 2014, 6, 2335–2337. [Google Scholar] [CrossRef] [PubMed]
  25. Bernevic, B.; El-Khatib, A.H.; Jakubowski, N.; Weller, M.G. Online immunocapture ICP-MS for the determination of the metalloprotein ceruloplasmin in human serum. BMC Res. Notes 2018, 11, 213. [Google Scholar] [CrossRef] [PubMed]
  26. Krenkova, J.; Svec, F. Less common applications of monoliths: IV. Recent developments in immobilized enzyme reactors for proteomics and biotechnology. J. Sep. Sci. 2009, 32, 706–718. [Google Scholar] [CrossRef] [PubMed] [Green Version]
Figure 1. Environmental scanning electron microscopy (ESEM) of a sintered borosilicate monolith (VitraPOR 5).
Separations 08 00056 g001
Figure 2. Close-up of the raw cylinder based on the partially sintered borosilicate glass VitraPOR 5, diameter 8 mm, length 15 mm, volume 0.75 mL.
Separations 08 00056 g002
Figure 3. Raw cylinder, glued into a titanium tube, outer diameter 12 mm, inner diameter 10 mm (details see Supplementary Materials).
Separations 08 00056 g003
Figure 4. Scheme of the optimized column conjugation procedure: Surface functionalization with epoxysilane, hydrolysis with sulfuric acid, periodate oxidation, and conjugation of protein A via reductive amination.
Separations 08 00056 g004
Figure 5. The system pressure of a VitraPOR 5 column with an increasing flow rate.
Separations 08 00056 g005
Figure 6. Avastin saturation curve of the VitraPOR 5 monolith coated with protein A.
Separations 08 00056 g006
Figure 7. Effect of a reversed elution on a VitraPOR 5 column. To optimize the peak shape of the eluted product, a reversed elution (green curve) was tested in comparison to the normal elution in the usual flow direction (red curve).
Separations 08 00056 g007
Figure 8. Examination of the dynamic capacity for IgG of a VitraPOR 5 column. The area was corrected for the different flows.
Separations 08 00056 g008
Figure 9. Representation of 100 extraction/elution cycles of the VitraPOR 5 column. This graph shows an overlay of IgG determinations from human plasma.
Separations 08 00056 g009
Figure 10. Comparison of a standard Sephadex-based system with the glass monolith. Please note the very different time scales of the separations. The standard column had a total volume of 1 mL, the monolith around 0.75 mL.
Separations 08 00056 g010
Figure 11. IgG capacity of the column materials VitraPOR 4 (medium) and VitraPOR 5 (ultra fine). In both experiments, the same amount of immunoglobulin was injected (5 mg). For VitraPOR 4, a capacity of 0.7 mg IgG (0.93 mg/mL), and for VitraPOR 5, a capacity of 4.1 mg IgG (5.5 mg/mL) was determined, which is a factor of about 6.
Separations 08 00056 g011
Figure 12. SDS-PAGE analysis of the IgG eluates of the protein A column in three subsequent runs (purification and two reinjections). Lane 1: Size standards, Lane 2: Raw plasma, Lane 3: Flow-through peak of raw plasma injection, Lane 4: Flow-through peak (reinjection 1), Lane 5: Flow-through peak (reinjection 2), Lane 6: IgG eluate of raw plasma injection, Lane 7: IgG eluate after first reinjection, Lane 8: IgG eluate after second reinjection. The first passage shows nearly all concomitant proteins from the human plasma in the void peak (Lane 3). Nearly all IgG was removed from the plasma (150 kDa). In the second and third passages, only low amounts of protein could be detected in the void peaks. The purity of the product peak (human IgG) seems to be very similar in all three runs (Lanes 6, 7, 8). Lane 9: Binding buffer as a blank.
Separations 08 00056 g012
Figure 13. The purity of the isolated human IgG was examined by two reinjections of the first passage (UV absorbance detection, 280 nm). The area of the void peak (retention time around 2.5 min) in relation to the product peak (retention time around 15 min) revealed a content of 20.6% of IgG (raw human plasma), 96.1% in the first isolation step, and 98.7% after a polishing step performed by reinjection.
Separations 08 00056 g013
Figure 14. Calibration line for the quantification of IgG. Different concentrations of bovine IgG were injected directly into the system without a column.
Separations 08 00056 g014
Figure 15. IgG concentrations were obtained directly by fractionation without an enrichment step.
Separations 08 00056 g015
Publisher’s Note: MDPI stays neutral with regard to jurisdictional claims in published maps and institutional affiliations.