Article

Comparison of the Fitting Performance of Retention Models and Elution Strength Behaviour in Hydrophilic-Interaction and Reversed-Phase Liquid Chromatography

by
Ester Peris-García
,
María José Ruiz-Angel
*,
Juan José Baeza-Baeza
and
María Celia García-Alvarez-Coque
Departament de Química Analítica, Universitat de València, c/Dr. Moliner 50, 46100 Burjassot, Valencia, Spain
*
Author to whom correspondence should be addressed.
Separations 2021, 8(4), 54; https://doi.org/10.3390/separations8040054
Submission received: 22 February 2021 / Revised: 11 April 2021 / Accepted: 14 April 2021 / Published: 20 April 2021

Abstract

:
Hydrophilic interaction liquid chromatography (HILIC) is able to separate from polar to highly polar solutes, using similar eluents to those in the reversed-phase mode (RPLC) and a polar stationary phase, where water is adsorbed onto its surface. It is widely accepted that multiple modes of interaction take place in the HILIC environment, which can be far more complex than the interactions in an RPLC column. The behaviour in HILIC should be adequately modelled to predict the retention with optimisation purposes and improve the understanding on retention mechanisms, as is the case for RPLC. In this work, the prediction performance of several retention models is studied for seven HILIC columns (underivatised silica, and silica containing diol, amino and sulfobetaine functional groups, together with three columns recently manufactured with neutral, anionic, and cationic character), using uracil and six polar nucleosides (adenosine, cytidine, guanosine, thymidine, uridine, and xanthosine) as probe compounds. The results in HILIC are compared with those that were offered by the elution of several polar sulphonamides and diuretics analysed with two C18 columns (Chromolith Speed ROD and Zorbax Eclipse XDB). It is shown that eight retention models, which only consider partitioning or both partitioning and adsorption, give similar good accuracy in predictions for both HILIC and RPLC columns. However, the study on the elution strength behaviour, at varying mobile phase composition, reveals similarities (or differences) between RPLC and HILIC columns of diverse nature. The particular behaviour for the HILIC and RPLC columns was also revealed when the retention, in both modes, was fitted to a model that describes the change in the elution strength with the modifier concentration.

1. Introduction

Since the introduction of bonded phases, reversed-phase liquid chromatography (RPLC) has become one of the most important analytical techniques, owing to its separation capability, versatility, and reliability. However, the analysis of highly polar compounds by RPLC remains a challenge due to their poor retention [1,2]. A solution to succeed in the separation of polar compounds is replacing conventional C18 bonded phases by more polar phases where water is adsorbed, in the so-called hydrophilic interaction liquid chromatography (HILIC) [3,4,5,6,7,8]. The retention mechanism in HILIC is more complex when compared to RPLC. Conventional non-bonded phases in normal phase liquid chromatography (NPLC), such as pure silica, can be used in HILIC. However, the elution with hydro-organic mobile phases (more similar to those in RPLC) clearly differentiates HILIC from NPLC. In HILIC, the water-rich layer that covers the surface of the polar stationary phase creates a liquid/liquid extraction system, with a mobile phase containing a high concentration of organic solvent (usually acetonitrile). Although the complete retention mechanism is still not clarified, it is known that multiple interactions, including partitioning into the adsorbed water-rich layer, and polar and electrostatic (ion-exchange) effects are possible in a HILIC stationary phase.
In the last decade, there has been great interest in modelling the retention behaviour in HILIC columns, versus the mobile phase composition, based on different theoretical basis [9,10,11,12,13,14,15,16]. However, no clear conclusions have been reached regarding the most accurate retention model(s), when considering the large variety of HILIC columns that are marketed. Therefore, there was a need to make a thorough revision of the fitting performance of the models used in HILIC, which have been proposed for RPLC, NPLC, and HILIC, as well as models that consider mixed retention mechanisms. In previous work [17], the chromatographic performance of seven HILIC columns (underivatised silica, and silica containing diol, amino, and sulfobetaine functional groups of different nature, together with three recently commercialised columns of neutral, anionic, and cationic character) was compared in terms of retention, selectivity, peak shape, and resolution, using acetonitrile-water mixtures of diverse composition as mobile phases. For this purpose, uracil and six polar nucleosides, which are the most popular probe compounds for column testing in HILIC [18], were used. We thought that it could be interesting to evaluate the fitting performance of retention models that were proposed in HILIC, using the large amount of data obtained in our laboratory for all of these columns, and eventually improve the data treatment. One of the models included in this study was recently developed in our laboratory [19], and had not been applied to HILIC columns of diverse character. This model has the particular feature of containing a parameter that characterises the way the elution strength varies with the modifier concentration.
Several of the models examined in this work are also common to describe the retention in RPLC. Thus, it was considered to be of interest to compare the fitting performance in HILIC with that achieved using RPLC C18 columns for the analysis of polar compounds (sulphonamides and diuretics). Because model fitting, which was assisted by the Solver tool of Excel, made convergence rather difficult, the reported retention models were transformed, so that the coordinates for the maximal retention in the experimental design were taken as the starting point, instead of the data for the condition in the absence of modifier (acetonitrile in RPLC and water in HILIC). To our knowledge, there is no previous report on the modelling performance in HILIC with the number of retention models and diverse columns evaluated in this work. This work includes, finally, a study to reveal similarities (or differences) in the retention mechanisms of solutes with the different columns (HILIC of diverse nature and RPLC), based on the measurement of the elution strength for the polar compounds as the concentration of modifier (water in HILIC and acetonitrile in RPLC) changes.

2. Theory

The modelling of retention based on the composition of the mobile phase is a common task in the chromatographic practice [9,12,13,16,19,20,21,22,23,24,25,26,27,28,29,30,31,32,33]. The accurate description of retention is of great importance in liquid chromatography to find the optimal conditions of separation, and understand the retention mechanisms of solutes. In RPLC, when the retention mechanism is exclusively or mainly partitioning, the change in retention with the concentration of organic modifier is usually described by the linear solvent strength (LSS) model [29]:
k = e ln k w S φ
where φ is the volumetric fraction of organic modifier in the mobile phase, kw is the extrapolated value of the retention factor at φ = 0 (pure water), and S is a parameter that describes the elution strength of the modifier, with a particular value for each solute. The retention factor is calculated according to:
k = t R t 0 t 0
with tR and t0 being the retention and hold-up times, respectively.
The LSS model usually works well for sufficiently small ranges of modifier concentration. For wide ranges, the model should be more complex. One of such models is an extension of the LSS model (the so-called quadratic logarithmic model) [20]:
k = e ln k w a φ + b φ 2
A logarithmic–hyperbolic relationship has also been proposed to describe the retention [24]:
k = e ln k w a φ 1 + b φ
which can be simplified by assigning a value of 1.42 to parameter b, for mobile phases of acetonitrile-water, and 0.47 for methanol-water mixtures [28]. When the predominant mechanism is adsorption, models that are similar to those used in NPLC have been proposed [16,22,31]:
k = ( a φ ) m
k = ( a + b φ ) m
where a, b, and m are the model parameters.
Combined models considering mixed retention mechanisms have also been suggested [9,13,27]:
k = ( φ ) m e a + b φ
k = ( 1 + b φ ) m e a + c φ
Recently, a global retention model has been derived based on Equation (1) [19]:
d k d φ = S k
where the dependence of the elution strength with the modifier concentration is linear. For non-linear dependences, Equation (9) should be adapted, as follows:
d k d φ = S g k g
where Sg is a constant parameter describing the elution strength. The integration of Equation (10) yields:
k w k d k k g = k 1 g k 0 1 g 1 g = 0 φ S g d φ = S g φ
from which:
k = k w [ 1 + ( g 1 ) k w g 1 S g φ ] 1 / ( 1 g ) = k w [ 1 + ( g 1 ) k w g 1 S g φ ] 1 / ( g 1 )
Equation (12) is similar to Equation (6) [19], but it includes the parameter g that quantifies the variation of the elution strength with φ, and it tends to Equation (1) when g tends to 1.
The fitting of the retention models described above, for the HILIC and RPLC columns that are indicated in Section 3.2, was carried out by minimising the following function:
χ = i = 1 N ( t R i , exp t R i , pred ) 2
where N is the number of experimental points, tRi,exp the experimental retention time, and tRi,pred the predicted retention time, obtained from:
t R i , pred = t 0 ( 1 + k i , pred )
ki,pred being the retention factor predicted from a given model. The fitting performance was measured by the determination coefficient R2. The mean fitting relative error was calculated as:
ε r ( % ) = i = 1 N | t R i , exp t R i , pred | i = 1 N t R i , exp × 100

3. Materials and Methods

3.1. Reagents

Uracil (Acros Organics, Geel, Belgium) and six nucleosides (adenosine, cytidine, guanosine, thymidine, uridine, and xanthosine), all from Sigma (St. Louis, MO, USA), were used as probe compounds to study the behaviour of the HILIC columns. In RPLC, the probe compounds were four sulphonamides (sulphamerazine, sulphachloropyridazine, sulphisoxazole, and sulphaquinoxaline from Sigma for the Chromolith column, and five diuretics (furosemide, althiazide, and trichloromethiazide from Sigma; ethacrynic acid from Merck, Sharp & Dohme, Madrid, Spain; and, xipamide from Lacer, Barcelona, Spain) for the Zorbax column. The structures, acidity constants (pKa), and octanol-water partition coefficients (log Po/w) of the probe compounds can be found in Table S1 in the Supplementary Materials. The log Po/w range is −2.1 to −1.0 for nucleosides, 0.11 to 1.45 for sulphonamides, and 1.0 to 2.2 for diuretics. Log Po/w for uracil is −0.7.
Stock solutions of approximately 100 μg/mL of the probe compounds were prepared by dissolving the solids in a small amount of acetonitrile (VWR Chemicals, Radnor, PA, USA), with the aid of an Elmasonic IT-H ultrasonic bath (Elma, Singen, Germany), and dilution with nanopure water (Barnstead, Sybron, Boston, MA, USA). The solutions remained stable during at least two months, kept at 4 °C. In HILIC, the 100 μg/mL solutions were diluted with acetonitrile to get 20 μg/mL solutions and, in RPLC, the solutions were diluted with nanopure water up to 10 μg/mL.
In HILIC, mobile phases were prepared with acetonitrile at increasing concentration of aqueous buffered solution (10, 15, 20, 25, 30, 35, 40, and 45% v/v), containing 0.01 M ammonium formate (Sigma). The hydro-organic mixtures were fixed at pH 3 with formic acid (Acros Organics), being measured with a pH-meter standardised with aqueous buffers. In RPLC, the hydro-organic mobile phases were also prepared with acetonitrile (10, 15, 20, 25, 30, 35, 40, and 45% v/v for Chromolith, and 28, 34, 40, 46, 52, and 58% v/v for Zorbax), buffered at pH 3 with 0.01 M sodium dihydrogen phosphate (Fluka, Buchs, Switzerland) and HCl (Scharlab, Barcelona, Spain) before the addition of the organic solvent. The retention for the Zorbax column was higher with respect to the Chromolith column. Therefore, the range was moved to higher acetonitrile content to obtain comparable retention.
All of the drug solutions and mobile phases were filtered through 0.45 μm Nylon membranes (Micron Separations, Westboro, MA, USA), and thrnthen degassed in an ultrasonic bath.

3.2. Instrumentation and Columns

The chromatographic system (Agilent, Waldbronn, Germany) was equipped with quaternary pump (Series 1200), autosampler (Series 1100), thermostated column compartment (Series 1260) set at 25 °C, and UV-visible detector of variable wavelength (Series 1100). Nucleosides were detected at 260 nm, sulphonamides at 254 nm, and diuretics at 274 nm. Triplicate injections of 20 μL were made.
Data acquisition was controlled by an OpenLAB CDS LC ChemStation (Agilent, C.01.07 SR3). Mathematical treatment was carried out with the Solver function of Excel (Microsoft Office 2010, Redmond, WA, USA).
The modelling of the retention behaviour of seven HILIC columns (150 mm × 4.6 mm i.d. and 5 µm particle size) of different character was studied: underivatised silica (Excel 5 SIL from ACE, Aberdeen, UK), neutral (Betasil Diol-100 from Thermo Scientific, Waltham, MA, USA, and HILIC-N from ACE), anion exchanger (Excel 5 NH2 and HILIC-B, ACE), cation exchanger (HILIC-A, ACE), and zwitterionic containing a sulphobetaine group (Sequant ZIC-HILIC from Supelco, Bellefonte, PA, USA). The pore size was 100 Å for all HILIC columns, except for Sequant ZIC-HILIC, which was 200 Å. The zwitterionic column does not have net charge, but the negative charge on the sulphonate group is capable of inducing electrostatic interactions with charged solutes, due to its position at the distal end of the ligand [4]. HILIC-A, HILIC-B, and HILIC-N, with neutral, anionic, and cationic character, respectively, which were recently commercialised, are stationary phases that are based on ultra-pure silica. HILIC-A has an acidic character with an ionisable negative surface charge that depends on the mobile phase pH. At pH 3, the retention of the cationic nucleosides was low, therefore their acidic group should be protonated. HILIC-B is a basic stationary phase with ionisable positive charge, depending also on the mobile phase pH, and HILIC-N is a polyhydroxy phase. The flow rate was 1 mL/min. for bare silica, and the diol, amino, and zwitterionic columns, and 0.5 mL/min. for HILIC-A, HILIC-B, and HILIC-N.
In RPLC, a silica-based monolithic column (Chromolith Speed ROD C18, 50 mm × 4.6 mm i.d., Merck, Darmstadt, Germany), and a conventional micro-particulate column (Zorbax Eclipse XDB C18, 150 mm × 4.6 mm i.d. and 5 μm particle size, Agilent), were used. The pore size was 130 Å for Chromolith Speed ROD, and 80 Å for Zorbax Eclipse XDB. The flow rate was 1 mL/min. for both columns. In all cases, the hold-up time was measured from the first significant perturbation that was observed in the baseline (the average value obtained in the chromatograms of the probe compounds was taken) [34].

3.3. Column Conditioning and Regeneration

The time that is required to condition a HILIC column is usually longer when compared to RPLC, due to the need of maintaining the water layer adsorbed on the stationary phase surface stable. This time can be variable depending on the stationary phase nature, column length and flow rate, as well as the type of organic solvent that is used in the mobile phase, or buffer system. As a general rule, in RPLC, a column of standard dimensions (150 mm × 4.6 mm) requires at least 10 volumes of mobile phase for conditioning. Thus, working at a flow rate of 1 mL/min., the equilibration time will be ca. 15 min.
For HILIC, between 60 and 80 volumes are needed to achieve complete equilibration [35]. The HILIC columns in this work were brand-new, so an initial equilibration time of at least 12 h at 0.5 mL/min. was needed for conditioning. However, when the columns were regenerated, a 12 h period was also used for conditioning. Column equilibration was checked by making 60 min. cycles of five consecutive injections of cytidine, until the retention time reached stable values. Cytidine was injected at the beginning and end of each working day in order to check the reproducibility of the measurements. Column conditioning was shorter (around 30 min.), when the water content in the mobile phase was higher.
Following the manufacturer’s recommendations, before storage, HILIC columns were first flushed with 70:30 v/v acetonitrile:water to remove all of the buffer salts and, afterwards, with 2-propanol at low flow rate.

4. Results and Discussion

4.1. Retention Behaviour with HILIC and RPLC Columns

The retention times of several polar compounds separated with seven HILIC columns and two RPLC columns were used to evaluate the performance of the retention models that are described in Section 2, and measure the elution strength behaviour in each column. In HILIC, the hold-up times were 1.38 ± 0.32, 1.61 ± 0.09, 1.22 ± 0.12, 1.40 ± 0.11, 3.12 ± 0.20, 2.7 ± 0.4, and 2.74 ± 0.14 min. for the diol, silica, amino, zwitterionic, HILIC A, HILIC-B, and HILIC-N columns, respectively, whereas the retention time ranges for uracil and the group of nucleosides were 2.04–4.61, 2.01–4.73, 1.60–6.52, 1.90–11.76, 4.00–6.94, 3.44–20.19, and 3.40–15.89 min., respectively. The relative standard deviations (%) of retention times for each column varied, as follows: 0.02–0.14 for silica, 0.03–0.25 for diol, 0.02–0.13 for amino, 0.02–0.11 for zwitterionic, 0.02–0.08 for HILIC-A, 0.02–0.08 for HILIC-B, and 0.02–0.06 for HILIC-N. For the RPLC Chromolith and Zorbax columns, the hold-up times were 1.18 ± 0.05 and 0.81 ± 0.02 min., the retention time ranges, 1.57–40.26 min. (sulphonamides), and 1.08–45.04 (diuretics), and the relative standard deviations (%) for the retention times, 0.9 and 0.7, respectively.
Representative chromatograms for the mixture of probe compounds (uracil and the six nucleosides) are depicted in Figures S1 and S2 in the Supplementary Materials, for the HILIC columns. The mobile phase compositions to obtain the chromatograms were chosen to allow similar analysis times for all columns. Each HILIC column showed a particular behaviour, with changes in elution order among columns. In HILIC, diverse interactions besides those depending on solute polarity (mainly electrostatic attraction and repulsion between ions, dipole–dipole interactions, and hydrogen bonding) can explain the different behaviours. In all assayed HILIC columns, uracil and thymidine were usually the least retained compounds. The most retained compound was more variable: guanosine showed high retention in most assayed columns, and the retention of cytidine was also high, except with the amino, HILIC-N, and HILIC-A columns. Meanwhile, xanthosine showed an intermediate retention with all columns.
With comparison purposes, Figure S3 shows chromatograms for the four sulphonamides that were analysed with the Chromolith C18 column, and the five diuretics with the Zorbax C18 column, where the compounds eluted mainly according to their polarity (Table S1).
Figures S4–S6 in the Supplementary Materials depict the variation in ln k at increasing modifier concentration (water in HILIC and acetonitrile in RPLC). The k ranges for the probe compounds (in HILIC, uracil and the six nucleosides, and in RPLC, the four sulphonamides for the Chromolith column and five diuretics for the Zorbax column) were the following: diol (0.48–2.34), silica (0.25–1.94), amino (0.32–4.39), zwitterionic column (0.35–7.34), HILIC-A (0.29–1.24), HILIC-B (0.27–6.45), HILIC-N (0.24–4.80), Chomolith (0.33–33.12), and Zorbax (0.33–54.60).
For both HILIC and RPLC, non-linear behaviour is observed when ln k is represented versus the percentage of modifier in the mobile phase, with a curvature and elution strength that was appreciably more pronounced for the RPLC columns. For these columns, the elution order at varying mobile phase composition was always the same for sulphonamides and diuretics (the lines did not cross each other). In HILIC, the elution order was often the same. The most remarkable behaviour was found for cytidine with the amino, HILIC-B, and HILIC-N columns, whose retention was strongly reduced at increasing percentage of water, giving rise to peak reversals.

4.2. Fitting Performance of the Retention Models

There is an extensive literature on the proposal of equations for the prediction of retention in HILIC [9,11,12,13,16]. One of the aims of this work was checking the performance of a variety of models (Equations (1), (3)–(8), and (12)), for columns of different nature. The model parameters were obtained by performing non-linear least-squares fitting of the experimental retention times, according to Equations (13) and (14), using the Solver tool of Excel to make the fittings. However, it was found that convergence to the solutions was rather difficult, requiring initial values that were very close to the optimal solution to carry out the iterations. Therefore, it was thought that the fitting process could be highly improved by transforming the equations, so that the coordinates for the maximal retention in the experimental design was taken as starting point, instead of the data for φ = 0 (the absence of modifier). In this way, non-linear fitting of the experimental data to obtain the model parameters was much easier, since convergence was facilitated. Additionally, with this transformation, the initial value of ln k (ln ko) is reliably known, as it agrees with the retention factor for the mobile phase of the weakest elution strength in the experimental design, φo. It should be noted that the model parameters change, depending on the starting point and, therefore, this should be known if the data are compared with those in other reports or situations. Because the new parameters depend on the organic solvent content in the reference point, in order to obtain the true model parameters, these should be referred to the true origin, as shown in the Supplementary Materials.
Table 1 shows the transformed equations (Equations (16)–(22); the transformation of the original models is explained in the Supplementary Materials: Equations (S1), (S5), (S11), (S12), (S14), (S15), and (S19), respectively). Equations (16) and (19) have two parameters, Equations (17), (18), (20), and (21), three parameters, and Equation (22), four parameters. Table 2 provides the mean relative errors (Equation (15)) obtained in the fitting of the data for uracil and six nucleosides in HILIC, and four sulphonamides and five diuretics in RPLC, for each assayed column. The RPLC columns offered significantly larger errors with the LSS model (Equation (16)), which can be at least partially explained by the wider range in the retention times (see Figures S4–S6).
Table 1. Transformed retention models and fitted model parameters a.
EquationsModelsParameters
Equation (16) b k = e ln k o S Δ φ ln ko, S
Equation (17) c k = e ln k o c Δ φ + b Δ φ 2 ln ko, c, b
Equation (18) d k = e ln k o c Δ φ 1 + d Δ φ ln ko, c, d
Equation (19) e k = e ln k o ( φ φ 0 ) m ln ko, m
Equation (20) f k = ( a o + b Δ φ ) m ao, b, m
Equation (21) g k = ( φ φ o ) m e ln k o + b Δ φ ln ko, b, m
Equation (22) h k = ( 1 + d Δ φ ) m e ln k o + c Δ φ ln ko, m, c, d
a The coordinates for maximal retention (ko, φo) in the experimental design were taken as starting point. b Obtained from Equation (1). c From Equation (3). d From Equation (4). e From Equation (5). f From Equation (6). g From Equation (7). h From Equation (8). See the transformations from the original models in the Supplementary Materials.
Equations (18) and (20) showed a slightly more accurate behaviour, with mean errors of 0.7% and 0.6% for the HILIC columns, and 0.4% and 0.7%, for the RPLC columns, respectively. These equations have demonstrated excellent behaviour for RPLC [19,36,37]. The equation that was proposed by Neue and co-authors (Equation (18)) has a very good fitting performance, when the elution strength decreases at an increasing concentration of the modifier. Equation (20), as proposed by Jandera [31], combines both the LSS model and adsorption model. It is confirmed that the fitting performance is enhanced by increasing the number of model parameters, with a global mean error for the HILIC columns of 2.3% for the models with two parameters (Equations (16) and (19)), 0.8% for those with three parameters (Equations (17), (18), (20), and (21)), and 0.6% for those with four parameters (Equation (22)). For the RPLC columns, the global mean error was 3.7, 0.7, and 0.3%, for the models with two, three, and four parameters, respectively. Finally, it is important to note that the HILIC columns show slightly better fitting behaviour than the RPLC columns, with mean errors of 1.2% and 1.5%, respectively.

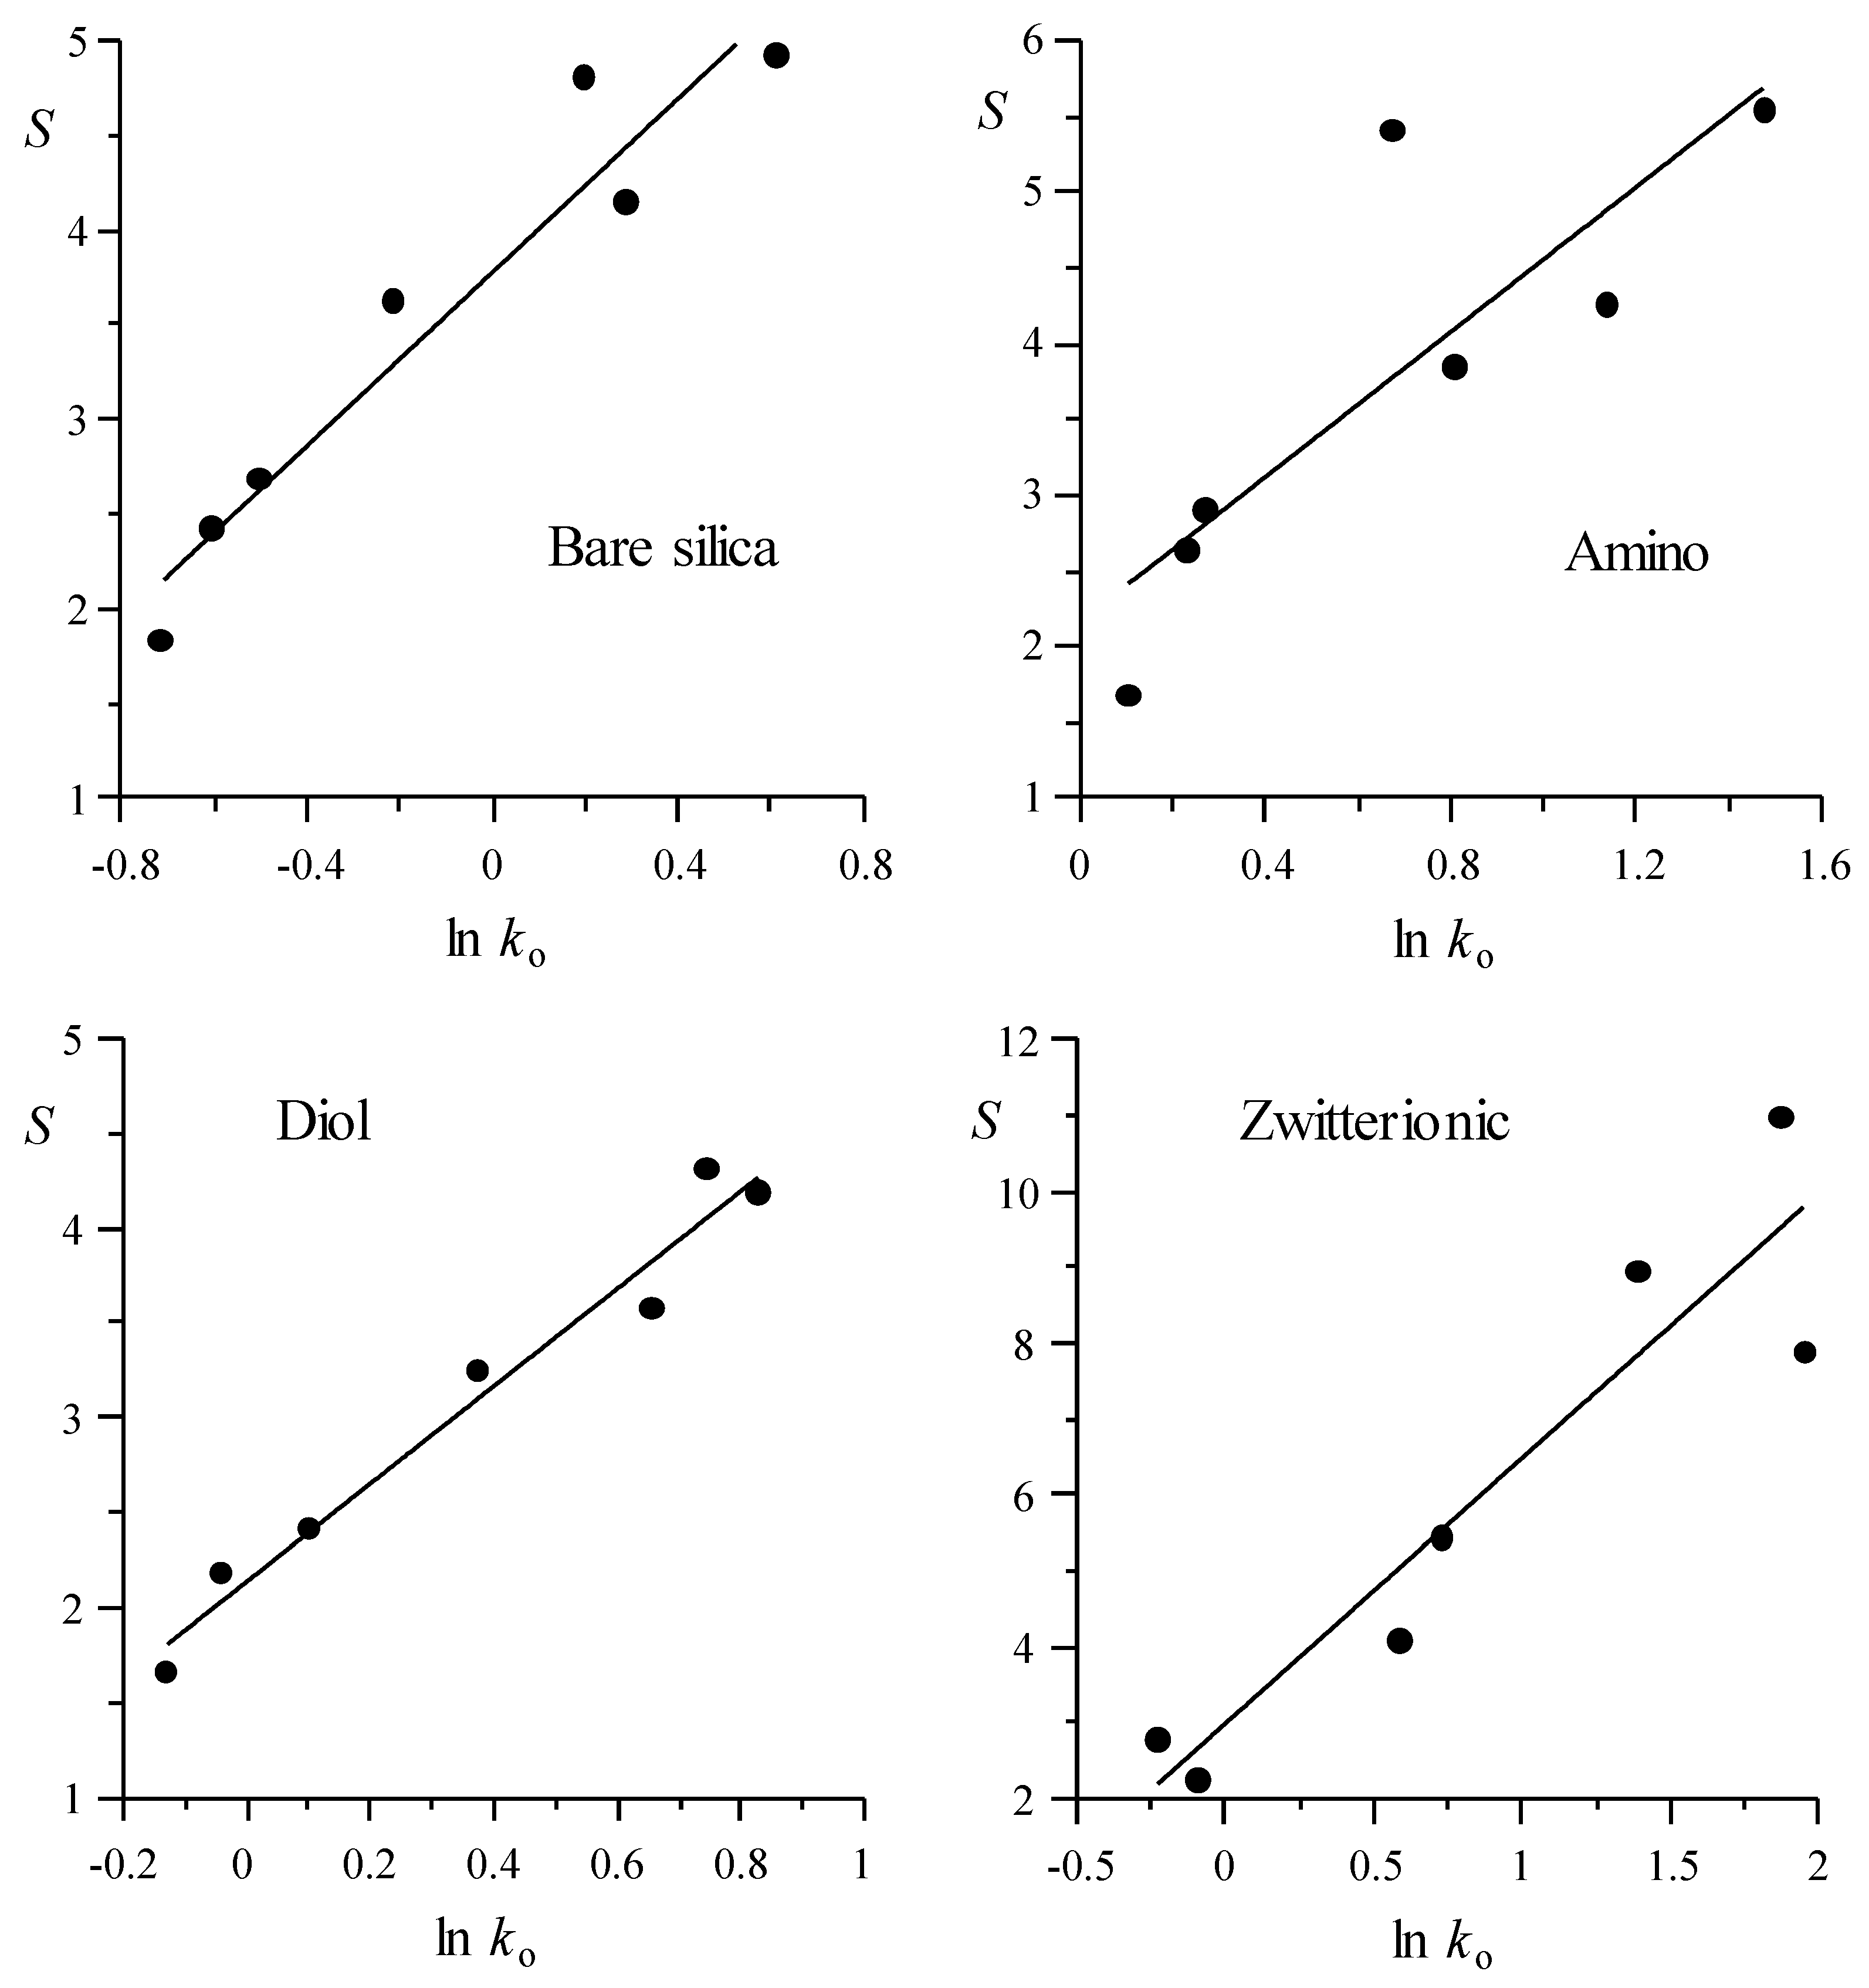
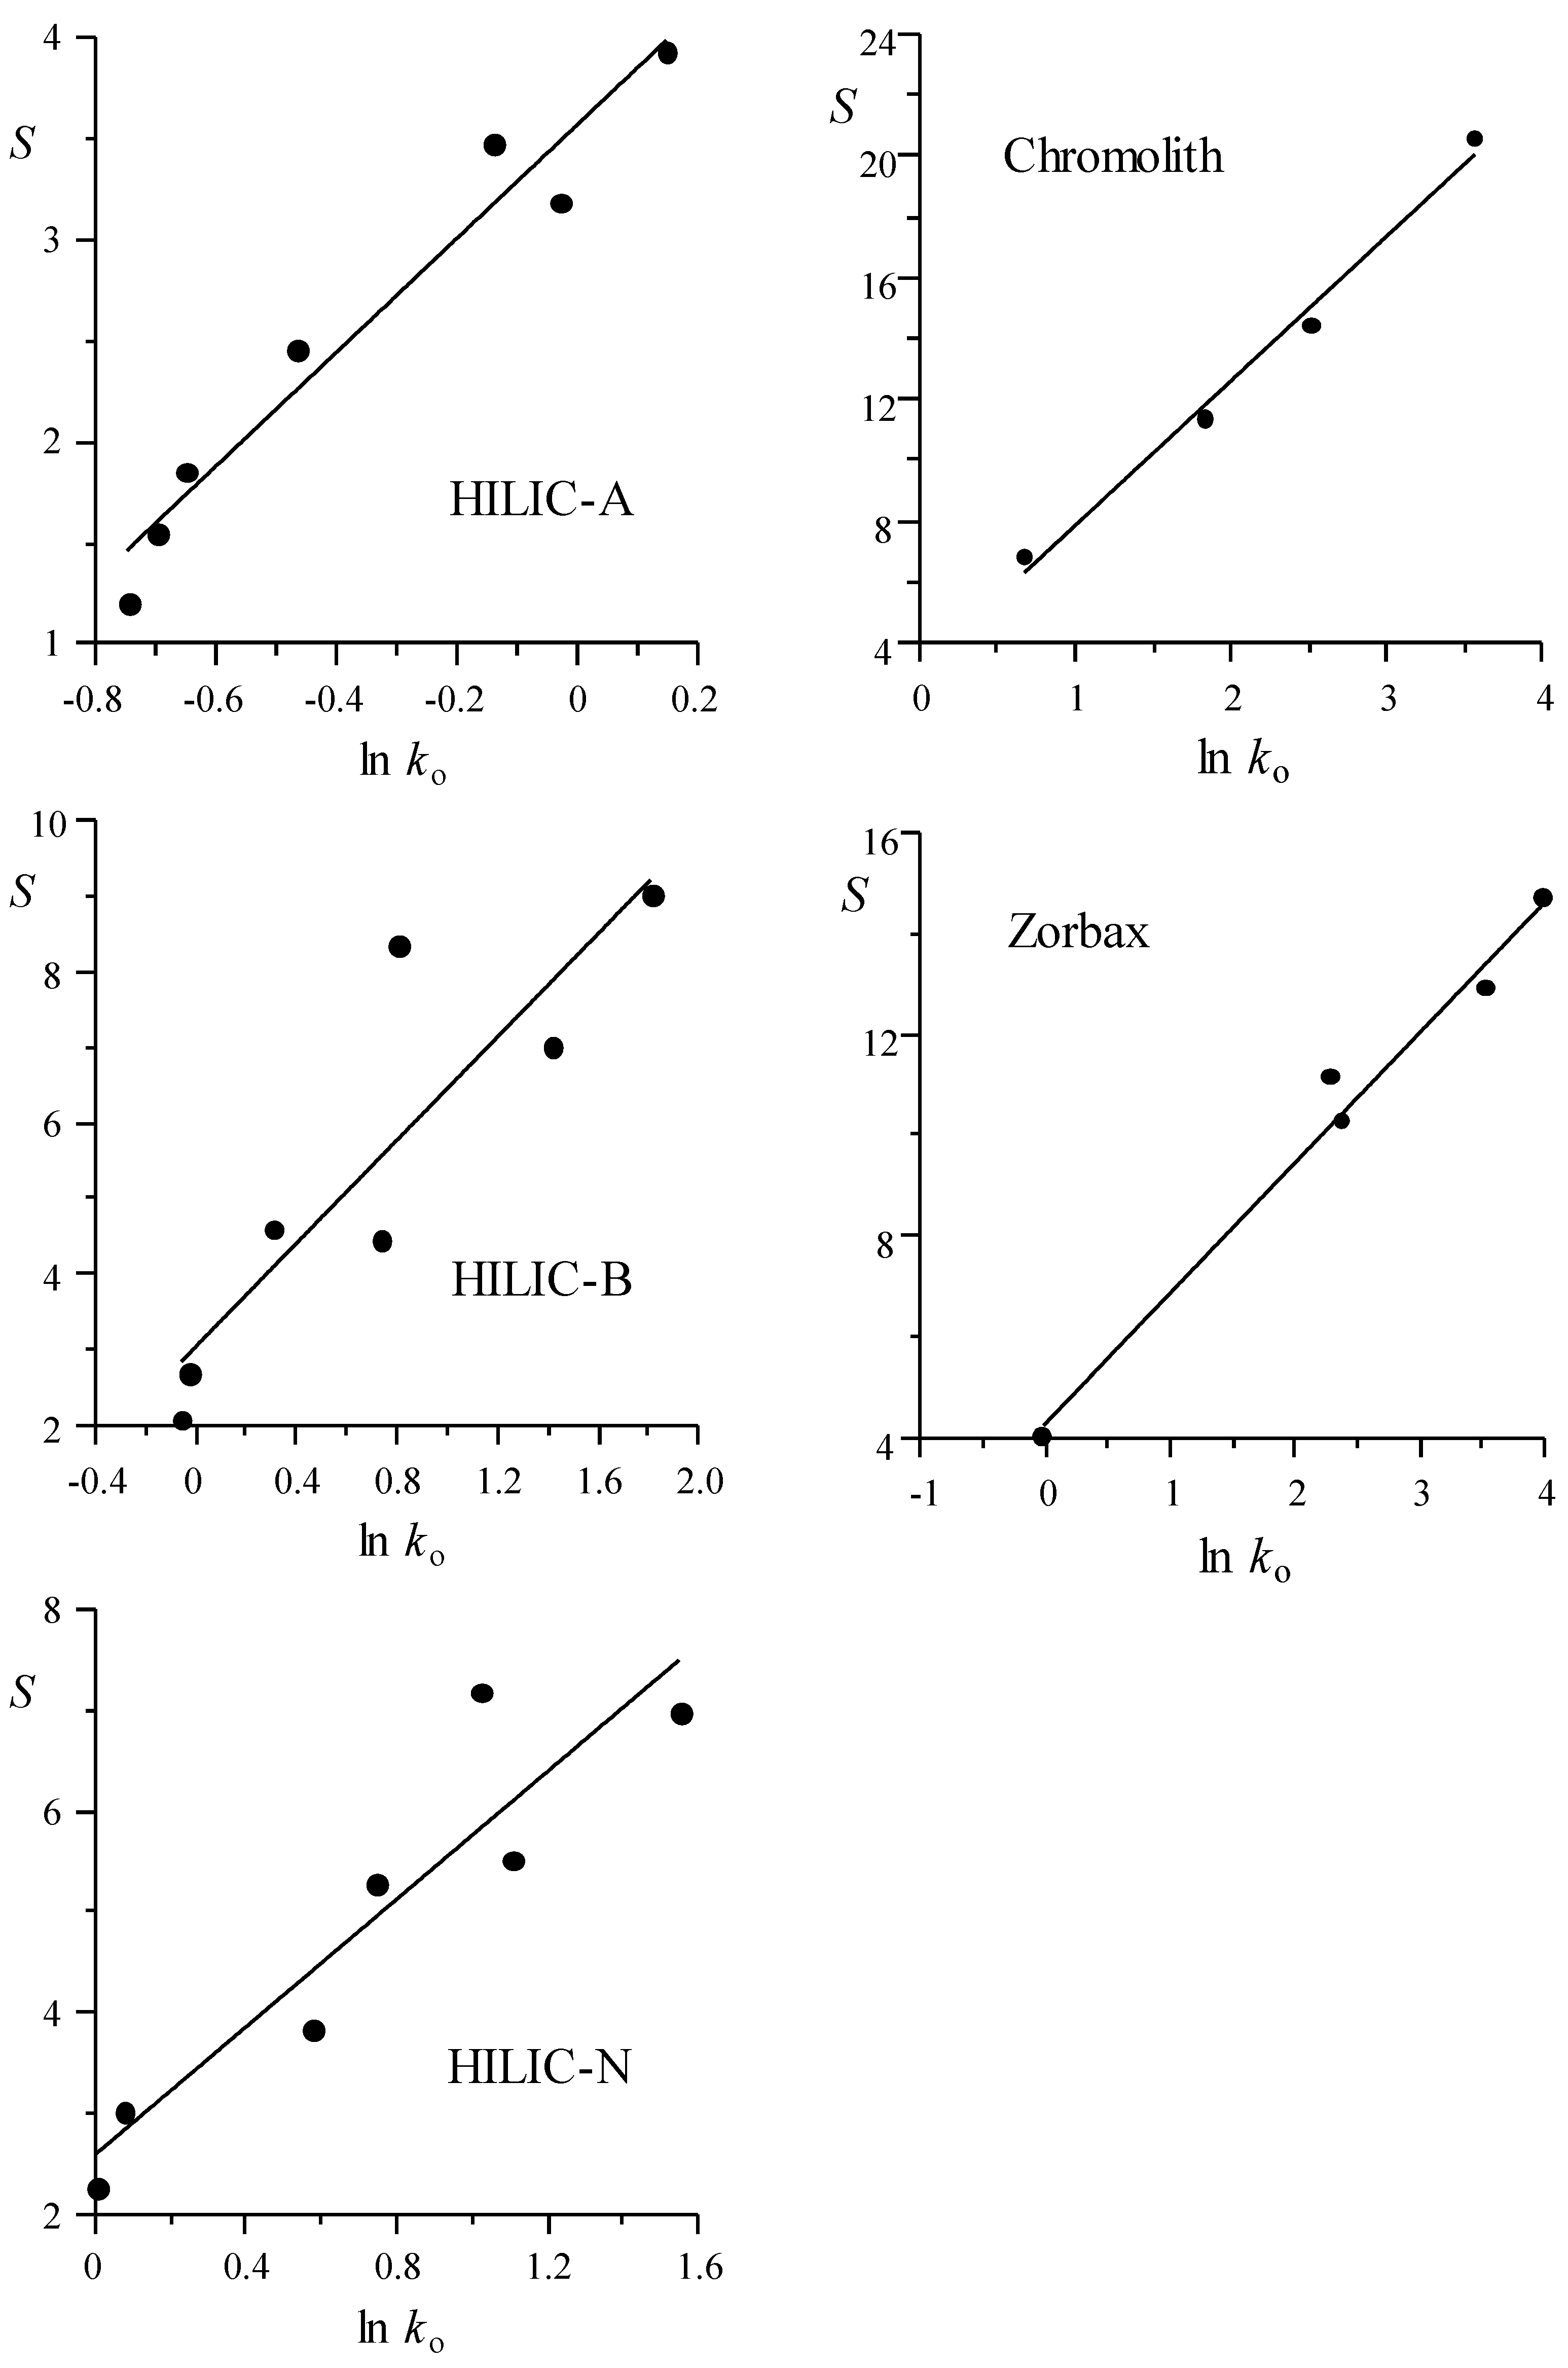
4.3. Correlation between the Parameters in the LSS Model

The retention mechanisms depend on the nature of packing materials, solutes, and eluent components. Good accuracy was found for all of the assayed retention models, which describe the retention mechanisms according to different perspectives (partitioning, adsorption, or mixed mechanisms). However, an accurate fitting is not enough to demonstrate the model is correctly describing the retention mechanism. In Section 4.3 and Section 4.4, the elution strength behaviour of the HILIC columns is studied in comparison with RPLC columns (for which the main mechanism is partitioning) to reveal any differences in the retention behaviour among the different assayed columns.
The ln k vs. modifier percentage plots (Figures S4–S6) show convex curvature, indicating decreased elution strength with increasing modifier concentration. In this section, the elution strength of each probe compound is evaluated according to the LSS model (Equation (1)). Because of its simplicity, this model has been extensively used to study the retention in RPLC. When the LSS model accurately describes the retention, it can be inferred that the predominant phenomenon in the column is partitioning. In the literature, such correlations have been used to reveal the similarities (or differences) in the retention mechanism of solutes [38,39]. A good correlation means that all of the compounds follow a similar mechanism (in the case of the LSS model, it refers to partitioning). When the correlation shows significant dispersion, additional interactions of the solutes should happen.
In Figure 1 and Figure 2, the values of elution strength (S in Equation (1)) are represented versus the logarithm of the retention factor for the mobile phase of weakest elution strength (ln ko), as measured by the LSS model for each probe compound analysed with the HILIC and RPLC columns, respectively. Positive correlation can be observed for the assayed columns: compounds with smaller retention (smaller ln ko value) are less affected by an increase in the concentration of modifier in the mobile phase (i.e., the elution strength is smaller). The depicted data show the behaviour of each probe compound. Note that the S values (that were obtained from the fitting of the retention data to the LSS model) can be considered as an average measurement of the elution strength, for each compound in the examined elution range. Table S2 shows the column behaviour through the parameters for the fitted lines depicted in Figure 1 and Figure 2 (S = n + m ln ko). The intercept n is the elution strength predicted for a compound with ko = 1, whereas the slope m describes the reduction in elution strength at decreasing ln ko: the smaller the m value, the smaller the effect of the modifier on the elution strength. For m = 0, all of the compounds would exhibit the same elution strength, at all modifier concentrations.
The best correlations (i.e., smaller dispersion) between S and ln ko were observed for the silica, diol, and HILIC-A columns in the HILIC mode, and Chromolith and Zorbax in RPLC. The largest dispersion corresponded to the amino, zwitterionic, HILIC-B, and HILIC-N columns. The similarity of behaviour between all assayed columns (Table S2) is noteworthy: the slopes of the fitted straight-lines are in the range between 2.29 and 3.39 for most HILIC and Zorbax columns, being somewhat larger for the zwitterionic (3.49) and Chromolith (4.72) columns, which indicates a larger decrease in the elution strength with ln ko for these columns.

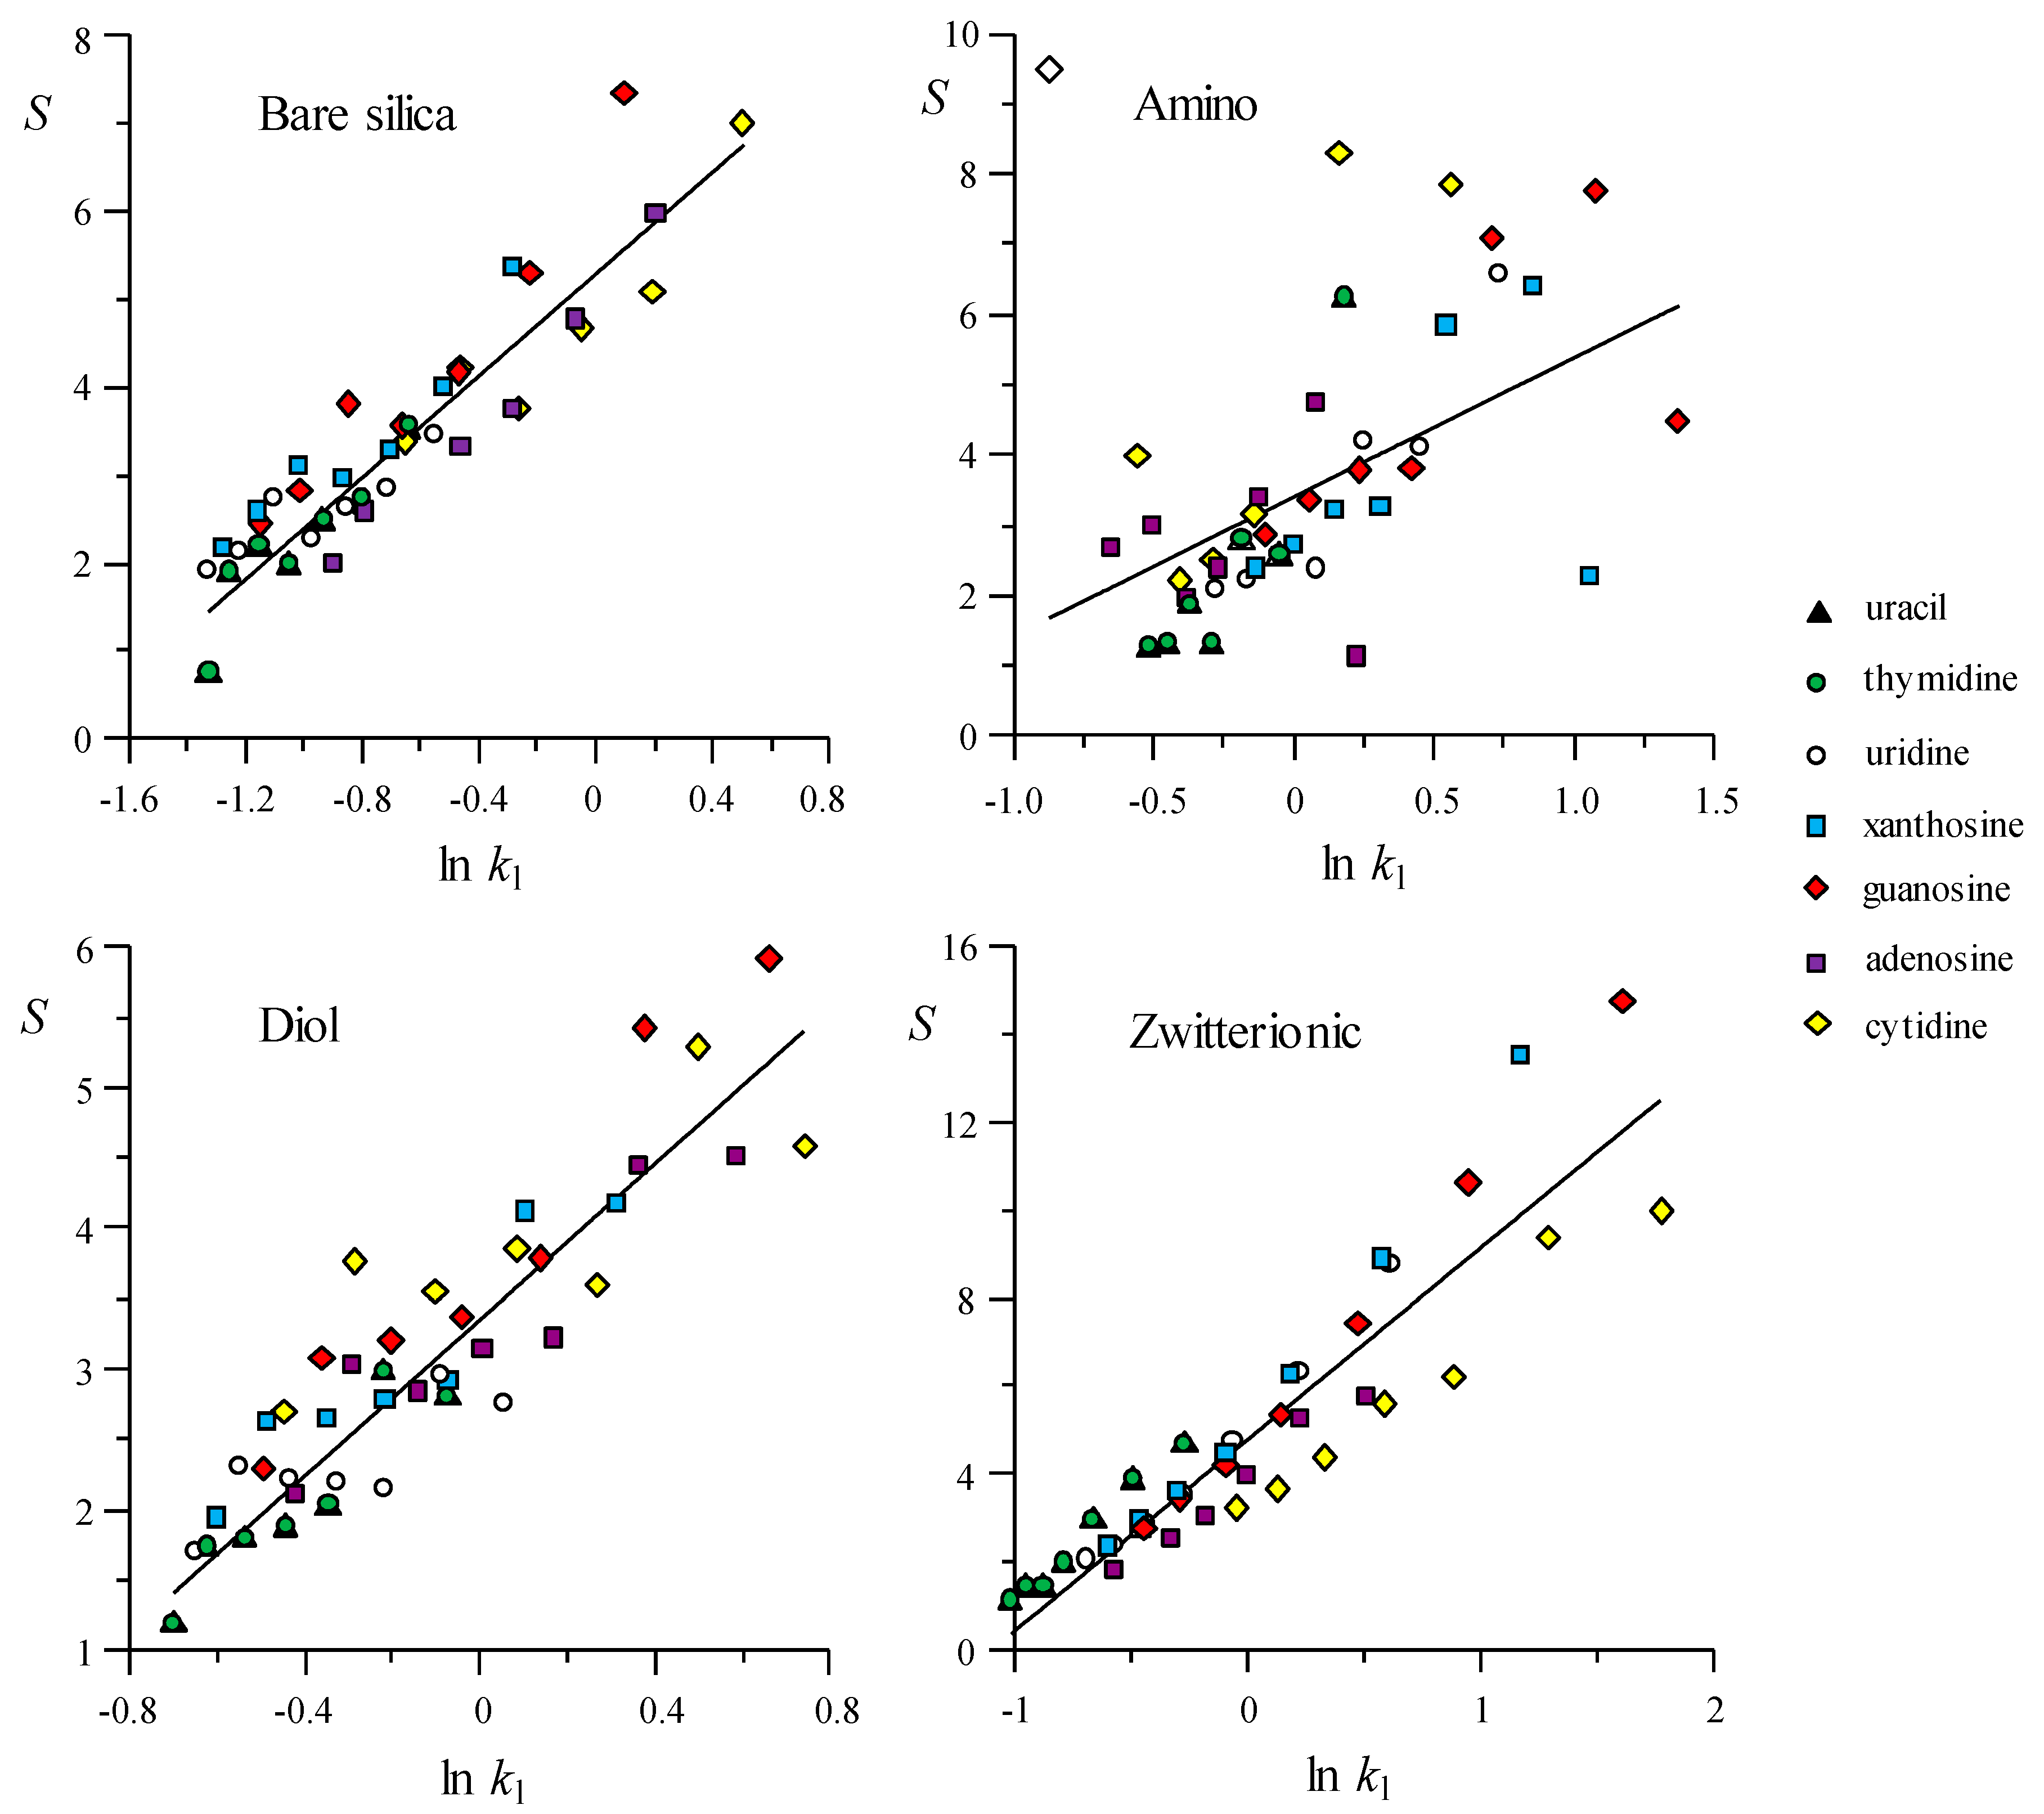
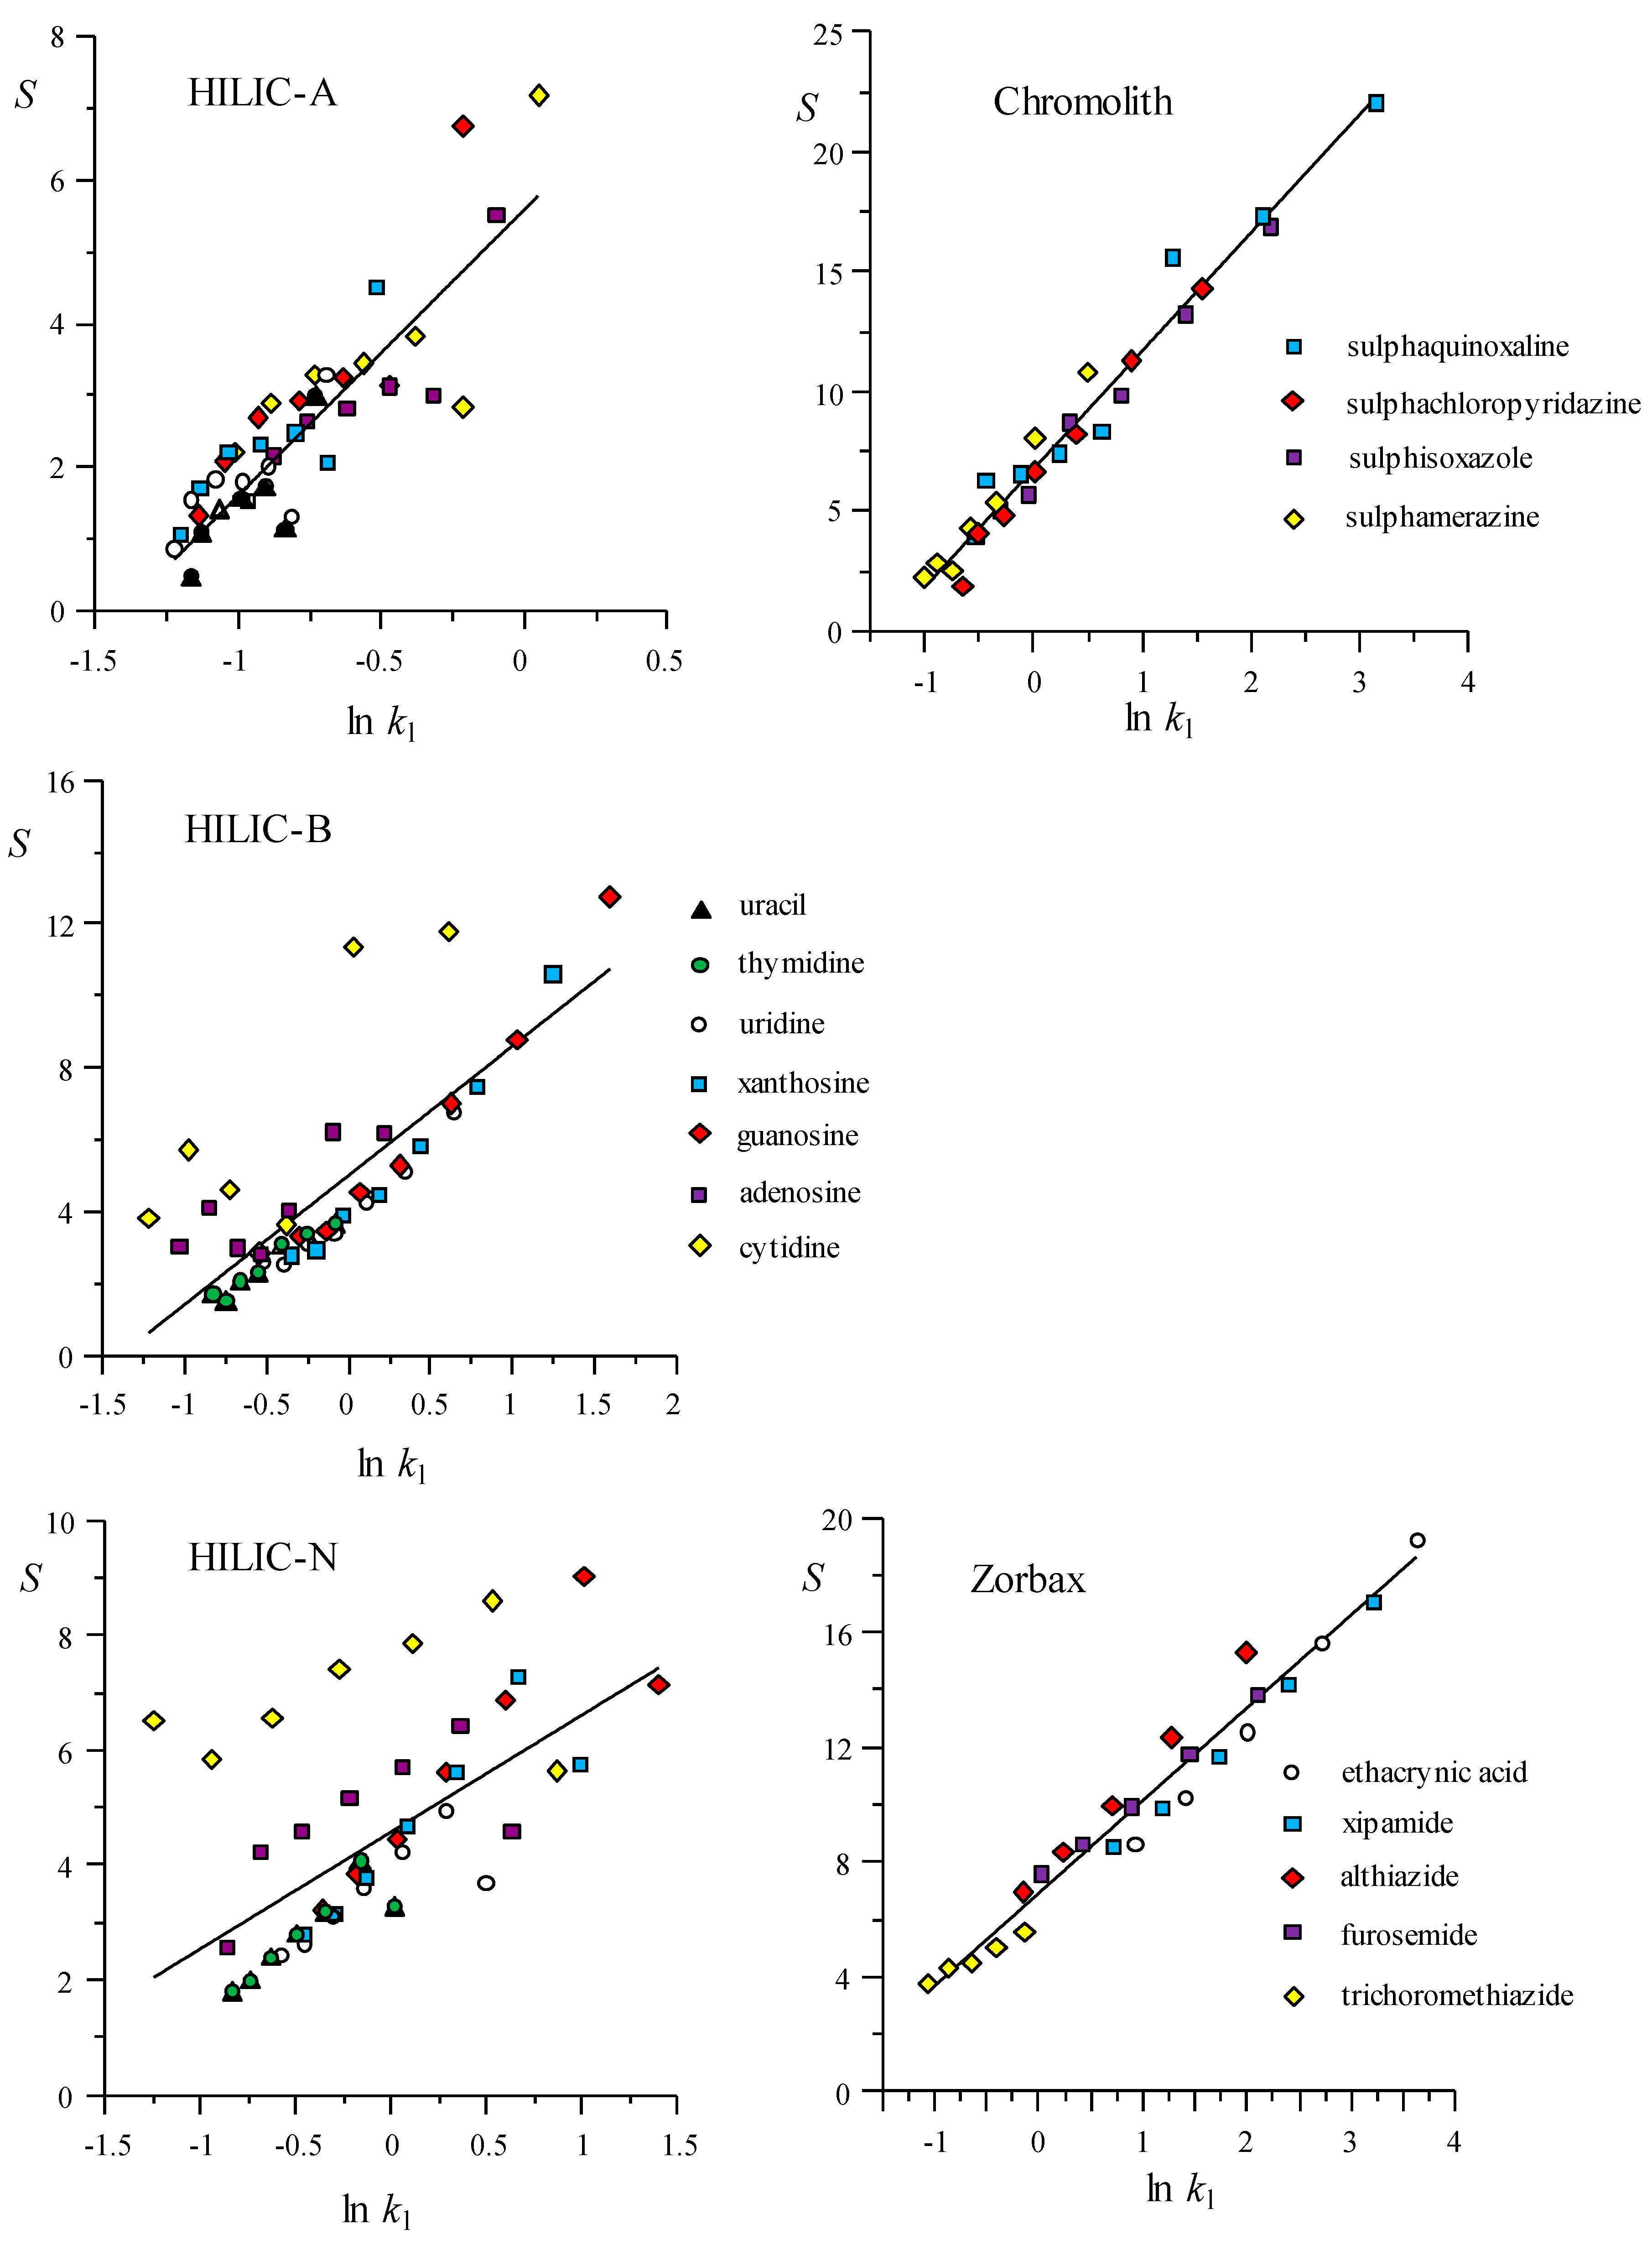
4.4. Changes in the Elution Strength with the Modifier Concentration

In RPLC, the elution strength has been measured, traditionally, as the slope (S) of the classical linear retention model that relates ln k with the concentration of the modifier (LSS model, see Section 4.3) [29]. This simple model assumes a constant elution strength. However, often, the LSS model does not accurately describe the retention, due to the complexity of the involved interactions in the chromatographic process (even in RPLC), which yields non-linear ln k versus φ trends. Therefore, the elution strength will vary with φ, as follows [40]:
S ( φ ) = d ln k d φ ln k u ln k l φ u φ l
where the subscripts u and l indicate the upper and lower values of the experimental range. In order to obtain more convenient values, in this work the concentration of modifier was expressed as volumetric fraction.
Equation (23) gives a numerical estimation of the elution strength and, therefore, it should be used with caution, since, for the same initial value of retention factor (kl), the elution capability depends on the modifier range (φuφl). Therefore, the comparison of the behaviour for different columns should be carried out using the same range of modifier concentration. The elution strength also depends on the analyte. Table 3 and Table 4 show the values of elution strength for the HILIC and RPLC columns, respectively, being estimated based on Equation (23), where the ranges of modifier concentration are indicated for each type of column. The data shown in Table 3 are related to the solvent strength in a narrow range (10–20% water), where the largest change in retention occurs. As observed, parameter S(φ) was always larger for cytidine and guanosine, which were usually the most retained compounds. Additionally, the largest and smallest values were obtained for the zwitterionic and HILIC-A columns, respectively.
In Figure 3 and Figure 4, the elution strength estimated according to Equation (23) is plotted versus the logarithm of the initial k value (kl), for several ranges of modifier (the parameters for the fitted lines, S = n + m ln kl, are given in Table S3 in the Supplementary Materials). In the figures, each compound is depicted with a particular symbol to highlight the differences in their behaviour. Again, it is noted that the correlation is significantly better for the RPLC columns, meaning similar behaviour for all compounds, since the interaction with the stationary phase is mainly hydrophobic. In contrast, the compounds that are eluted with the HILIC columns show a range of behaviours. A maximal dispersion in the correlations was observed for the amino and HILIC-N columns, and the smallest dispersion for bare silica. According to the data presented in Table S3, the slopes of the S(φ) versus ln kl dependences, in the considered ranges of modifier, varied between 1.66 and 4.90. The lowest slopes corresponded to the amino (1.97) and HILIC-N columns (1.66). Chromolith showed the highest slope (4.90), while the behaviour of the Zorbax column (3.24) was more similar to most of the HILIC columns.

4.5. Global Retention Model Describing Elution Strength Changes with the Modifier Concentration

The retention model presented in Equation (12) includes a parameter g, which has been called elution degree, which characterises the profile of the elution strength changes with the modifier concentration [19]. This parameter can be considered as a geometrical descriptor, with g > 1 when the elution strength decreases with the modifier concentration (the case of HILIC and RPLC). If the origin of coordinates of Equation (12) is moved to the experimental point for the minimal value of modifier concentration (φo), with retention factor ko, Equation (12) is transformed to:
k = k o [ 1 + ( g 1 ) k o g 1 S g ( φ φ o ) ] 1 / ( g 1 )
The model parameters shown in Equation (24), obtained from the fitting of the retention data for the probe compounds that were analysed with the HILIC and RPLC columns, are indicated in Tables S4 and S5 in the Supplementary Materials, respectively. The mean values of elution degree (g) for the HILIC columns were: 1.88 ± 0.23 for underivatised silica, 1.80 ± 0.30 for diol, 2.10 ± 0.80 for amino, 1.30 ± 0.60 for HILIC-N, 2.50 ± 0.40 for HILIC-A, 1.90 ± 0.30 for HILIC-B, and 2.00 ± 0.40 for the zwitterionic column (mean value for the HILIC columns: 1.90 ± 0.60). The mean values of elution degree (g) for the RPLC columns were: 1.60 ± 0.30 and 1.32 ± 0.06 for Chromolith and Zorbax, respectively (mean value for the RPLC columns: 1.40 ± 0.20). In all cases, the fitting error was very low (mean values): 0.23% for underivatised silica, 0.29% for diol, 1.2% for the amino and HILIC-N, 0.5% for HILIC-A, and HILIC-B, and 0.6% for the zwitterionic column (the mean value for the HILIC columns: 0.7%). The fitting error was 1.1% and 0.2% for Chromolith and Zorbax, respectively (therefore, the mean error for the RPLC columns was also 0.7%).
It should be noted that the retention factors summarise the relative contributions of particular retention mechanisms. Equation (12) was derived from the LSS model, which describes the retention in RPLC when the partition governs the retention mechanism. This equation reproduces the linear behaviour between ln k and modifier concentration, when g tends to 1. However, mixed mechanisms are usual in both HILIC and RPLC [41]. This work indicates that, for RPLC columns, where the partition mechanism is predominant, g is closer to 1 (1.40), while, for the HILIC columns with more diversity in the retention mechanisms, g is usually closer to 2 (1.90).

5. Conclusions

An extensive work is reported with seven HILIC columns, where the modelling performance of eight retention models (with two, three, or four parameters) has been checked for describing the retention of seven highly polar compounds (with log P in the −2.1 to −0.7 range). A comparison with the performance of the same models to describe the retention of polar compounds for two RPLC C18 columns (Chromolith and Zorbax) is also carried out. Because the estimation of the retention parameters requires non-linear fitting of the experimental data to the retention models (retention factors versus the modifier content in the mobile phase), all of the equations were transformed, so that the coordinates for the maximal retention in the experimental design were taken as starting point. This greatly facilitated the fitting process without losing any prediction accuracy. In general, the HILIC columns yielded better fittings, as compared to RPLC, partially due to the smaller range of variation of the data. The fitting quality increased with the number of model parameters, being Equations (18) and (20) (both with three parameters) and Equation (22) (with four parameters) the best, with fitting errors of 1% or less.
Models that are based on different retention mechanisms (considering only partitioning or both partitioning and adsorption) yielded similar good accuracy, indicating that all of them can be useful in predicting the retention with optimisation purposes, for both HILIC and RPLC columns. However, this similar good fitting performance does not clarify which model explains the retention mechanism the best, and does not indicate differences between HILIC and RPLC, or between the HILIC columns. In contrast, a comparison of the correlation plots between the elution strength, and the retention factor for the mobile phase of weakest elution strength, showed significant variability for the polar nucleosides that were analysed with the HILIC columns, especially when compared with the RPLC columns. In the literature, the correlation of the parameters of the LSS model (Equation (1)) has been extensively used to reveal the similarities in the retention mechanism of solutes in RPLC [32,38,39]. Good correlation means that all of the compounds follow a similar mechanism, in this case partitioning. When the correlation shows significant dispersion, a combined retention mechanism should exist, with diverse types of interactions among the solutes.
Because mixed mechanisms should occur with the HILIC columns, in Section 4.4 a non-linear description of the elution strength was used to carry out this study. The correlation found for the function that describes the changes in elution strength with mobile phase composition (S(φ)), versus the initial retention factor (ln kl) (Equation (23)), for several ranges of modifier content, was again fairly good for the RPLC columns. In HILIC, the behaviour for different probe compounds was similar for bare silica, diol, and HILIC-A columns in HILIC, and for Zorbax and Chromolith in RPLC, whereas a wide range of behaviours was observed for the amino and HILIC-N columns. Therefore, such correlation plots reveal the particular behaviour of the polar compounds that were analysed with the HILIC columns (with mixed mechanisms), and the RPLC columns (where the predominant phenomenon is partitioning, even for polar compounds as the assayed sulphonamides with log P = 0.11–1.45, and diuretics with log P = 1.0–2.2). This is explained by the existence of different proportions of hydrophilic and hydrophobic interactions between solutes that contain different molecular structures, and HILIC columns with variable polar and non-polar contributions.
The retention data for HILIC and RPLC were finally fitted to a retention model that includes a parameter (called elution degree, g), which characterises the way the elution strength varies with the modifier concentration (i.e., the curvature of the log k dependence). For an ideal case where the retention is governed by partitioning (LSS behaviour), g tends to 1, which means that the elution strength does not depend on the modifier concentration. However, as commented, mixed retention mechanisms are found in HILIC (even in RPLC) and, therefore, the mean g value for the assayed HILIC and RPLC columns is g > 1. The elution degree model is applied here for the first time to compare the retention behaviour of HILIC columns of diverse nature. The mean value was g = 1.9 for the assayed HILIC columns, and 1.4 for the RPLC columns.

Supplementary Materials

The following are available online at https://www.mdpi.com/article/10.3390/separations8040054/s1, Figure S1: Chromatographic peaks obtained for uracil and six nucleosides eluted from HILIC columns, with a mobile phase containing 10 % water for bare silica, 11 % water for diol, 20 % water for amino, and 25 % water for the zwitterionic, Figure S2: Chromatographic peaks obtained for uracil and six nucleosides eluted from HILIC columns, with a mobile phase containing 10 % water for HILIC A, and 20 % water for HILIC B and HILIC N, Figure S3: Chromatographic peaks obtained for sulphonamides and diuretics eluted from RPLC columns, with mobile phases containing 20 % and 46 % acetonitrile, respectively, Figure S4: Retention behaviour for uracil and nucleosides, eluted with HILIC columns at increasing concentration of water, Figure S5: Retention behaviour for uracil and nucleosides, eluted with HILIC columns at increasing concentration of water, Figure S6: Retention behaviour for sulphonamides and diuretics, eluted with the RPLC columns at increasing concentration of acetonitrile, Table S1: Acidity constants (pKa) and octanol-water partition coefficients (log Po/w), for the probe compounds, Table S2: Correlation of the parameters in the LSS model for the assayed HILIC and RPLC columns, Table S3: Correlation of S(φ) versus ln kl (lowest value in the considered experimental range), for the assayed HILIC and RPLC columns, Table S4: Fitting of the experimental retention data to the elution degree model (Equation (24)), for uracil and nucleosides, obtained in HILIC with different columns and water in acetonitrile as modifier, Table S5: Fitting of the experimental retention data to the elution degree model (Equation (24)), for sulphonamides and diuretics, obtained in RPLC with the Chromolith and Zorbax columns and acetonitrile in water as modifier.

Author Contributions

E.P.-G.: Conception, design of the analysis and performing of the analysis; M.J.R.-A.: Conception, design of the analysis and supervision; J.J.B.-B.: Conception, design of the analysis and supervision; M.C.G.-A.-C.: Funding acquisition, project administration, resources, conception, design of the analysis, supervision, writing-review & editing. All authors have read and agreed to the published version of the manuscript.

Funding

This work was supported by Project PID2019-106708GB-I00 (Ministerio de Ciencia, Innovación y Universidades, Spain, and FEDER funds), and PROMETEO/2016/128 (Direcció General d’Universitat, Investigació i Ciència, Generalitat Valenciana, Spain).

Institutional Review Board Statement

Not applicable.

Informed Consent Statement

Not applicable.

Data Availability Statement

Data are contained within the article and Supplementary Materials.

Acknowledgments

Ester Peris-García thanks the University of Valencia for the pre-doctoral grant UV INV-PREDOC16F1-384313.

Conflicts of Interest

All authors declare there are no financial/commercial conflict of interest in this work.

References

  1. García-Alvarez-Coque, M.C.; Baeza-Baeza, J.J.; Ramis-Ramos, G. Reversed phase liquid chromatography. In Analytical Separation Science Series; Anderson, J.L., Stalcup, A., Berthod, A., Pino, V., Eds.; Wiley-VCH: New York, NY, USA, 2015; Volume 1, pp. 159–197. [Google Scholar]
  2. Poole, C.F.; Lenca, N. Reversed phase liquid chromatography. In Liquid Chromatography: Fundamentals and Instrumentation, 2nd ed.; Fanali, S., Haddad, P., Poole, C.F., Riekkola, M.L., Eds.; Elsevier: Amsterdam, The Netherlands, 2017; pp. 91–123. [Google Scholar]
  3. Hemström, P.; Irgum, K. Hydrophilic interaction chromatography. J. Sep. Sci. 2006, 29, 1784–1821. [Google Scholar] [CrossRef]
  4. Guo, Y.; Gaiki, S. Retention and selectivity of stationary phases for hydrophilic interaction chromatography. J. Chromatogr. A 2011, 1218, 5920–5938. [Google Scholar] [CrossRef] [PubMed]
  5. Buszewski, B.; Noga, S. Hydrophilic liquid chromatography (HILIC): A powerful separation technique. Anal. Bioanal. Chem. 2012, 402, 231–247. [Google Scholar] [CrossRef] [PubMed] [Green Version]
  6. Jandera, P.; Janás, P. Recent advances in stationary phases and understanding of retention in hydrophilic interaction chromatography. J. Chromatogr. A 2017, 967, 12–32. [Google Scholar] [CrossRef] [PubMed]
  7. Cavazzini, A.; Catani, M.; Felinger, A. Hydrophilic interaction liquid chromatography. In Liquid Chromatography: Fundamentals and Instrumentation; Fanali, S., Haddad, P., Poole, C.F., Riekkola, M.L., Eds.; Elsevier: Amsterdam, The Netherlands, 2017; pp. 147–169. [Google Scholar]
  8. McCalley, D.V. Understanding and manipulating the separation in hydrophilic interaction liquid chromatography. J. Chromatogr. A 2018, 1523, 49–71. [Google Scholar] [CrossRef]
  9. Jin, G.; Guo, Z.; Zhang, F.; Xue, X.; Jin, Y.; Liang, X. Study on the retention equation in hydrophilic interaction liquid chromatography. Talanta 2008, 76, 522–527. [Google Scholar] [CrossRef]
  10. McCalley, D.V. Study of the selectivity, retention mechanisms and performance of alternative silica-based stationary phases for separation of ionised solutes in hydrophilic interaction chromatography. J. Chromatogr. A 2010, 1217, 3408–3417. [Google Scholar] [CrossRef]
  11. Karatapanis, A.E.; Fiamegos, Y.C.; Stalikas, C.D. A revisit to the retention mechanism of hydrophilic interaction liquid chromatography using model organic compounds. J. Chromatogr. A 2011, 1218, 2871–2879. [Google Scholar] [CrossRef]
  12. Tyteca, E.; Périat, A.; Rudaz, S.; Desmet, G.; Guillarme, D. Retention modeling and method development in hydrophilic interaction chromatography. J. Chromatogr. A 2014, 1337, 116–127. [Google Scholar] [CrossRef]
  13. Euerby, M.R.; Hulse, J.; Petersson, P.; Vazhentsev, A.; Kassam, K. Retention modelling in hydrophilic interaction chromatography. Anal. Bioanal. Chem. 2015, 407, 9135–9152. [Google Scholar] [CrossRef]
  14. Guo, Y. Recent progress in the fundamental understanding of hydrophilic interaction chromatography (HILIC). Analyst 2015, 140, 6452–6466. [Google Scholar] [CrossRef]
  15. Česla, P.; Vaňková, N.; Křenkováb, J.; Fischer, J. Comparison of isocratic retention models for hydrophilic interaction liquid chromatographic separation of native and fluorescently labeled oligosaccharides. J. Chromatogr. A 2016, 1438, 179–188. [Google Scholar] [CrossRef] [PubMed] [Green Version]
  16. Jandera, P.; Hájek, T.; Sromová, Z. Mobile phase effects in reversed-phase and hydrophilic interaction liquid chromatography revisited. J. Chromatogr. A 2018, 1543, 48–57. [Google Scholar] [CrossRef] [PubMed]
  17. Peris-García, E.; Burgos-Gil, R.; Ruiz-Angel, M.J.; Baeza-Baeza, J.J.; García-Alvarez-Coque, M.C. Protocol to compare column performance applied to hydrophilic interaction liquid chromatography. Microchem. J. 2019, 149, 103973. [Google Scholar]
  18. Mateos-Vivas, M.; Rodríguez-Gonzalo, E.; Domínguez-Alvarez, J.; García-Gómez, D.; Carabias-Martínez, R. Determination of nucleosides and nucleotides in baby foods by hydrophilic interaction chromatography coupled to tandem mass spectrometry in the presence of hydrophilic ion-pairing reagents. Food Chem. 2016, 211, 827–835. [Google Scholar] [CrossRef] [PubMed]
  19. Baeza-Baeza, J.J.; García-Alvarez-Coque, M.C. Extension of the linear solvent strength retention model including a parameter that describes the elution strength changes in liquid chromatography. J. Chromatogr. A 2020, 1615, 460757. [Google Scholar] [CrossRef] [PubMed]
  20. Schoenmakers, P.J.; Billiet, H.A.H.; de Galan, L. Description of solute retention over the full range of mobile phase compositions in reversed-phase liquid chromatography. J. Chromatogr. A 1983, 282, 107–121. [Google Scholar] [CrossRef]
  21. Valkó, K.; Snyder, L.R.; Glajch, J.L. Retention in reversed-phase liquid chromatography as a function of mobile-phase composition. J. Chromatogr. A 1993, 656, 501–520. [Google Scholar] [CrossRef]
  22. Jandera, P.; Kucerová, M.; Holíková, J. Description and prediction of retention in normal-phase high performance liquid chromatography with binary and ternary mobile phases. J. Chromatogr. A 1997, 762, 15–26. [Google Scholar] [CrossRef]
  23. García-Alvarez-Coque, M.C.; Torres-Lapasió, J.R.; Baeza-Baeza, J.J. Modelling of retention behaviour of solutes in micellar liquid chromatography. J. Chromatogr. A 1997, 780, 129–148. [Google Scholar] [CrossRef]
  24. Neue, U.D.; Phoebe, C.H.; Tran, K.; Cheng, Y.; Lu, Z. Dependence of reversed-phase retention of ionizable analytes on pH, concentration of organic solvent and silanol activity. J. Chromatogr. A 2001, 925, 49–67. [Google Scholar] [CrossRef]
  25. Gagliardi, L.G.; Castells, C.B.; Ràfols, C.; Rosés, M.; Bosch, E. Modeling retention and selectivity as a function of pH and column temperature in liquid chromatography. Anal. Chem. 2006, 78, 5858–5867. [Google Scholar] [CrossRef] [Green Version]
  26. García-Alvarez-Coque, M.C.; Torres-Lapasió, J.R.; Baeza-Baeza, J.J. Models and objective functions for the optimisation of selectivity in reversed-phase liquid chromatography. Anal. Chim. Acta 2006, 579, 125–145. [Google Scholar] [CrossRef] [PubMed]
  27. Nikitas, P.; Pappa-Louisi, A. Retention models for isocratic and gradient in reversed phase liquid chromatography. J. Chromatogr. A 2009, 1216, 1737–1755. [Google Scholar] [CrossRef] [PubMed]
  28. Rosés, M.; Subirats, X.; Bosch, E. Retention models for ionizable compounds in reversed-phase liquid chromatography: Effect of variation of mobile phase composition and temperature. J. Chromatogr. A 2009, 1216, 1756–1775. [Google Scholar] [CrossRef]
  29. Snyder, L.R.; Kirkland, J.J.; Dolan, J.W. Introduction to Modern Liquid Chromatography, 2nd ed.; John Wiley & Sons: New York, NY, USA, 2011. [Google Scholar]
  30. García-Alvarez-Coque, M.C.; Ramis-Ramos, G.; Torres-Lapasió, J.R.; Ortiz-Bolsico, C. Modeling of retention in reversed phase liquid chromatography. In Analytical Separation Science Series; Anderson, J.L., Stalcup, A., Berthod, A., Pino, V., Eds.; Wiley-VCH: New York, NY, USA, 2015; Volume 1, pp. 199–226. [Google Scholar]
  31. Jandera, P.; Hájek, T.; Růžičková, M. Retention models on core-shell columns. J. AOAC Int. 2017, 100, 1636–1646. [Google Scholar] [CrossRef]
  32. Navarro-Huerta, J.A.; Carrasco-Correa, E.J.; Torres-Lapasió, J.R.; Herrero-Martínez, J.M.; García-Alvarez-Coque, M.C. Modelling retention and peak shape of small polar solutes analysed by nano-HPLC using methacrylate-based monolithic columns. Anal. Chim. Acta 2019, 1086, 142–155. [Google Scholar] [CrossRef]
  33. Den Uijl, M.J.; Schoenmakers, P.J.; Pirok, B.W.J.; van Bommel, M.R. Recent applications of retention modelling in liquid chromatography. J. Sep. Sci. 2021, 44, 88–114. [Google Scholar] [CrossRef]
  34. Torres-Lapasió, J.R.; Baeza-Baeza, J.J.; García-Alvarez-Coque, M.C. On the measurement of dead time in micellar liquid chromatography. J. Liq. Chromatogr. Rel. Technol. 1996, 19, 1205–1228. [Google Scholar] [CrossRef]
  35. McCalley, D.V. A study of column equilibration time in hydrophilic interaction chromatography. J. Chromatogr. A 2018, 1554, 61–70. [Google Scholar] [CrossRef]
  36. Kensert, A.; Collaerts, G.; Efthymiadis, K.; Desmet, G.; Cabooter, D. Deep Q-learning for the selection of optimal isocratic scouting runs in liquid chromatography. J. Chromatogr. A 2021, 1638, 461900. [Google Scholar] [CrossRef] [PubMed]
  37. Navarro-Huerta, J.A.; Gisbert-Alonso, A.; Torres-Lapasió, J.R.; García-Alvarez-Coque, M.C. Testing experimental designs in liquid chromatography (I): Development and validation of a method for the comprehensive inspection of experimental designs. J. Chromatogr. A 2020, 1624, 461180. [Google Scholar] [CrossRef] [PubMed]
  38. Xiao, H.B.; Liang, X.M.; Lu, R.C. Classification of structurally related compounds from Astragalus extract by correlation of the log kw and S. Chromatographia 2000, 51, 212–220. [Google Scholar] [CrossRef]
  39. Poole, C.F. The Essence of Chromatography; Elsevier: Amsterdam, The Netherlands, 2003; pp. 303–304. [Google Scholar]
  40. Baeza-Baeza, J.J.; Dávila, Y.; Fernández-Navarro, J.J.; García-Alvarez-Coque, M.C. Measurement of the elution strength and peak shape enhancement at increasing modifier concentration and temperature in RPLC. Anal. Bioanal. Chem. 2012, 404, 2973–2984. [Google Scholar] [CrossRef] [PubMed]
  41. Poole, C.F. Influence of solvent effects on retention of small molecules in reversed-phase liquid chromatography. Chromatographia 2019, 82, 49–64. [Google Scholar] [CrossRef]
Figure 1. Linear fitting of the LSS elution strength parameter, S, versus ln ko (predicted retention factor for the mobile phase of weakest elution strength) for HILIC columns (model parameters and determination coefficient are given in Table S2 in the Supplementary Materials).
Separations 08 00054 g001
Figure 2. Linear fitting of the LSS elution strength parameter, S, versus ln ko (predicted retention factor for the mobile phase of weakest elution strength) for HILIC and RPLC columns (see also Table S2).
Separations 08 00054 g002
Figure 3. Behaviour of the experimental elution strength, S(φ) (Equation (23)), as a function of the initial retention factor, kl, for HILIC columns. S(φ) was estimated considering seven water ranges (data from top to bottom): 10–15%, 15–20%, 20–25%, 25–30%, 30–35%, 35–40%, and 40–45%. The plotted data were linearly fitted to show the proximity to the linear behaviour (parameters and determination coefficient for the lines are indicated in Table S3 in the Supplementary Materials).
Separations 08 00054 g003
Figure 4. Behaviour of the experimental elution strength, S(φ) (Equation (23)), as a function of the initial retention factor, kl, for HILIC and RPLC columns. The water ranges to estimate S(φ) for the HILIC columns are given in Figure 3. The acetonitrile ranges for the RPLC columns were: 10–15%, 15–20%, 20–25%, 25–30%, 30–35%, 35–40%, and 40–45% for Chromolith, and 28–34%, 34–40%, 40–46%, 46–52%, and 52–58% for Zorbax. The parameters and determination coefficient for the lines are indicated in Table S3 in the Supplementary Materials.
Separations 08 00054 g004
Table 2. Relative errors (%) obtained in the fitting of the retention factors of the probe compounds, for each assayed model and hydrophilic interaction liquid chromatography (HILIC) or reversed-phase liquid chromatography (RPLC) columns.
ColumnsEquation (16)Equation (17)Equation (18)Equation (19)Equation (20)Equation (21)Equation (22)
Silica1.680.440.280.960.230.190.16
Diol1.540.380.301.620.290.330.29
Amino3.231.931.182.651.171.791.54
Zwitterionic5.971.220.341.320.630.520.28
HILIC-A1.390.600.540.650.480.470.30
HILIC-B4.901.350.590.910.460.560.49
HILIC-N2.211.071.223.561.211.491.09
Mean error HILIC a3.0 ±1.81.0 ± 0.60.7 ± 0.51.7 ± 1.10.6 ± 0.40.8 ± 0.60.6 ± 0.5
Chromolith8.091.430.701.301.121.080.38
Zorbax4.620.470.100.830.220.240.20
Mean error RPLC a6.41.00.41.10.70.70.3
a According to Equation (15).
Table 3. Elution strength according to Equation (23), estimated for the HILIC columns and probe compounds (uracil and nucleosides), in the range 10–20% water a.
ColumnSilicaDiolAminoZwitterionic
CompoundklS(φ)klS(φ)klS(φ)klS(φ)
Cytidine1.946.052.344.942.098.097.349.68
Guanosine1.306.332.225.674.396.126.7612.69
Adenosine1.415.392.004.481.282.941.905.54
Xanthosine0.854.691.514.153.054.364.2511.21
Uridine0.623.161.132.872.415.362.2347.58
Thymidine0.573.160.992.901.384.430.854.31
Uracil0.502.290.902.081.142.370.943.01
HILIC-AHILIC-BHILIC-N
CompoundkiS(φ)klS(φ)klS(φ)
Cytidine1.245.012.3711.572.737.12
Guanosine0.944.946.4510.754.808.09
Adenosine1.034.261.436.202.105.51
Xanthosine0.663.294.399.013.086.52
Uridine0.542.312.215.941.804.31
Thymidine0.522.081.013.511.103.67
Uracil0.491.440.983.031.022.65
akl is the initial value of retention factor in the considered range and S(φ) is the parameter that indicates the change in the elution strength with mobile phase composition.
Table 4. Elution strength according to Equation (23) for the RPLC columns and probe compounds (sulphonamides and diuretics) a.
ColumnChromolith (10–20%) bChromolith (20–30%) b
CompoundklS(φ)klS(φ)
Sulphamerazine2.089.430.8084.81
Sulphachloropyridazine6.4012.781.787.44
Sulphisoxazole12.4315.022.779.26
Sulphaquinoxaline35.1619.684.9111.94
Zorbax (34–46%) bZorbax (46–58%) b
CompoundklS(φ)klS(φ)
Trichloromethiazide0.7513.960.4673.35
Althiazide4.669.291.536.36
Furosemide5.489.031.856.74
Xipamide14.7810.764.077.66
Ethacrynic acid20.9411.725.137.87
akl is the initial value of retention factor in the considered range, and S(φ), the parameter that indicates the change in the elution strength with mobile phase composition. b Upper and lower limits in the considered experimental range for the estimation of S(φ).
Publisher’s Note: MDPI stays neutral with regard to jurisdictional claims in published maps and institutional affiliations.

