Abstract
Waste or by-product use is in focus for reducing the environmental threat and acquiring wealth out of waste. The current study aim was to investigate the effects of ultrasound pretreatment on the extraction of bioactive compounds and composition of essential oils extracted from citrus waste. The response surface methodology (RSM) was used to optimize higher yield extraction parameters. Pretreatment of ultrasound-assisted extraction recovered 33% enhanced yield with reduced time and was economical as compared to conventional hydro-distilled process. The functional quality of essential oil was determined using FTIR and GC-MS. Antioxidants from citrus peel and pulp/pomace were extracted and analyzed by spectroscopic techniques. The quantification of bioactive compounds from citrus waste was performed using high performance liquid chromatography (HPLC). Mass transfer rate of antioxidants from peel and pomace were 30% increased as a result of ultrasound-assisted treatment. The significantly (p ≤ 0.05) higher TPC (735.54 mg/100 g) and antioxidant activity (44.26%) was recorded in Citrus sinensis Pulp and peel respectively. The bioactive compounds such as hesperidin (31.52 mg/100 g) was significantly higher in (p ≤ 0.05) in Citrus sinensis pulnd extract. Vanillin was found 1.21 mg/100 g in peel extract of citrus fruit, moreover vanillin was not detected in pulp extract. Myrecitin was not detected in both the samples. The bioactive natural compounds extracted from citrus peel can be used in food and pharma sector as natural anti-oxidantcompounds.
1. Introduction
Citrus is a valuable fruit crop grown worldwide and had 124.3 million ton production annually. Fruit and vegetable processing industries generate considerable amount of solid waste that contain highly valuable bioactive compounds [1,2,3]. These by-products are an excellent source of essential oil and bioactive compounds such as flavones and polyphenols. The trend for the use of fruit waste to extract valuable compounds and their useindeveloping functional and nutraceutical food products has been increased [4]. Citrus peels contain the highest amount of polymethoxylated flavones such as nobiletin and tangeretin, as compared to other parts [5,6]. Citrus flavonoids showed excellent functional properties such as antiviral, anticancer, anti-diabetic, neuro-protective, and anti-inflammatory activities, restricts human platelet aggregation atherosclerosis and reduces capillary fragility [7,8,9,10]. The flavonoids present in orange peel potential to reduced free radical scavenging activity and lipid per-oxidation [11]. Essential oils are complex mixtures obtained by physical process usually distillation or cold-pressing (expression) from a plant or any of its parts. Essential oils are secondary metabolites of plants and make up the aroma of the plant due to their fatty liquids that contain esters, aromatic and volatile compounds such as monoterpenes (n = 2), sesquiterpenes (n = 3), diterpenes (n = 4) with formula (C5H8)n [12,13]. Citrus essential oils can be incorporated in a wide range of products, such as beverages, foods, medicines, and cosmetics as flavoring agents as well as for aromatherapy. The polyphenols and essential oils are used as food additives in baked products such as cake, cookies, biscuits, and bread to increase the nutrient and flavoring agent. They possess anti-inflammatory, antidepressant, germicidal, antioxidant, anticarcinogenic atherosclerosis aphrodisiac, anti-septic, carminative, diuretic, tonic, sedative, and cholagouge properties.
In last decade, the importance has shifted to extraction of valuable bio-active compounds and their application as flavoring agent, health supplement, functional food, nutraceuticals products, food additives, food ingredients and as cosmetics ingredient. The development of new extraction techniques has received a lot of attention as previous techniques were not efficient and eco-friendly. Several extraction methods such as ultrasound, microwave assisted extraction (MAE), subcritical water, supercritical fluid extraction (SFE), hydro-distillation, electromagnetic, and control pressure drop process extraction are based on efficiency, quality, being economical in terms of time and energy, and having a safe and sustainable process [14,15]. The peel contains antimicrobial activity which can protect the fruit from pests and other microorganisms due to presence of bioactive compounds [16]. In recent years, the focal point of the researcher is to improvement of extraction methods and to findalternativeways of using fruit and vegetable wastes to extractvaluable compounds to use for commercial purposes. The ultrasound-assisted extraction (UAE) technique has been accepted for extract polyphenol and bioactive compounds from herbal oils (ginseng, saponins, carnosic acid, amaranth oil, carvone, soyabean oil, limonene, almond oil, gingerols, apricot oil), plants (tartaric acid, polyphenols, aroma compounds, anthocyanins, polysaccharides and functional compounds) or animal (leutin, chitin) materials, and proteins (soy protein) [17,18,19]. One of the major problems associated with extraction of the essential oils is oxidation at higher temperatures. Ultrasound has enormous uses in the food industry such as extraction, processing, preservation, emulsification, homogenization, etc. [20]. Ultrasound-assisted extraction is an advantageous alternative process due to a reduced adverse effect on extractable compound, reduction of organic solvents consumption and a reduction in the extraction time [17]. Ultrasound technology used for oil extraction from peel, seeds and pomace lead to increase in mass transfer by rupturing the cell wall and formation of micro cavities thus enhance the product yield [21,22]. UAE extraction method is cheap and rapid technology which resulted higher yield of extraction compared to other technologies such as SFE and MAE extraction methods moreover the UAE extraction method do not have any oxidative effects on oil [23,24,25].
The current investigation was undertaken to understand the effect of ultrasound pretreatment on the extraction of essential oil and bioactive compounds from peel and pulp/pomace of citrus fruit. Furthermore, the optimization of extraction process was performed using RSM and ANOVA. The characterizations were performed by spectrophotometric, GCMS, and HPLC techniques to understand the effect of ultrasound pretreatment on the phytochemicals, volatile composition of essential oil and bioactive compounds of citrus waste. The current investigation will be beneficial at commercial scale for developing new products and formulation using bioactive compounds from citrus waste.
2. Materials and Methods
2.1. Chemical Reagents
Analytical grade of chemical and reagents were procured from Sigma Aldrich Inc. Banglore, (India), Merk and Thermo Fisher, New Delhi (India).
2.2. Materials
The fresh harvested and homogenous oranges fruit (HybridKing) were purchased from Azadpurmandi, (New Delhi, India). Procured citrus fruit were thoroughly washed with 200 ppm of chlorinated water to removing surface contamination and peel off to separate albedo and flavedo. The flavedo part of the peel contains oil glands. Peels (after removal of albedo) and pulp (after extracting juice) were dried in a vacuum tray dryer at 30 °C and a pressure of 20 KPa for 48 h. The products were collected pulverized, transferred to an airtight zip lock bag and stored until further use.
2.3. Experimental Design and Statistical Analysis
The optimization of operating parameters of UAE extraction method was performed by RSM using central composite design and design expert software (10.0.6). The key factors chosen were time ‘A’ (5, 10, 15, 20 and 25 min), amplitude ‘B’ (30, 40, 50, 60 and 70%) and ratio of solvent/sample ‘C’ (2:1, 2.5:1, 3:1, 3.4:1 and 4:1) as independent variables. Preliminary experimental results were used to define the range and central point values of above mentioned three factors. Response surface with a secondorder polynomial model was used to correlate responses and changeable parameters. Mean values obtained from triplicate experiments were used as observed responses at each design point. The variables were coded according to Equation (1):
where X is the coded value, Xi is the corresponding actual value, X0 is the actual value in the center of the domain, and ΔX is the increment of Xi corresponding to the variation of 1 unit of X.
X = (Xi − X0)⁄ΔX
The mathematical model used for the three-variable CCD is given below Equation (2). The second order polynomial model, which relates response to the factors, consists of one intercept term, three squared terms, three two factor interaction terms and three linear terms:
where Y is a dependent variable (citrus extract yield), β0 is a model constant; β1, β2 and β3 are the linear coefficients; β11, β22 and β33 are the quadratic coefficients; β12, β13 and β23 are the interaction coefficient; A, B and C are the coded values of the independent variables.
Y = β0 + β1 A + β2 B + β3 C + β11 A2 + β22 B2 + β33 C2 + β12 AB + β13 AC + β23 BC
2.4. Ultrasound-Assisted Extraction (UAE)
UAE was carried out at a power of 500 W; working frequency 20 KHz in pulse mode, and using Ti-Al-V probe equipped Q500 sonicator. Pulse interval and pulse duration were kept constant for 2 s above mentioned sonication was applied to the mixture of peel powder sample with solvent. Under the variations of three different processing variables the extraction was conducted at room temperature (Tables 1 and 2). Ultrasound treated samples were subjected to hydro-distillation and the distillate was collected in a conical flask. The oil was then separated using a separating funnel.
Polyphenol extraction was carried out using orange peel/pulp powder and ethanol atthe ratio of 1:10 (sample to solvent ratio) and subjected to ultrasound treatment for 30 min. The mixture was homogenized and centrifuged at 10,000 rpm for 5 min and filtered through 0.22 µm poly-tetrafluorethylene (PTFE) filters. The extract was kept at −40 °C for further analysis. Diffusion of cell content through cell wall and washing out cell’s content after the cell wall breaks, are two phenomena which help in ultrasound-assisted extraction (Medina-Torres et al., 2017). The cavitation effect produced in the sample by the ultrasound waves expedites the release of extractable compounds and cell wall disruption enhances the mass transfer. Ethanol with low viscosity accelerates the mass transfer and results in reduced extraction time and increased extraction efficiency.
2.5. Hydro-Distillation
The hydro-distillation method was used to extraction of essential oil from orange peel powder according to methodology followed by Sikdar et al. [26] with slight modification. 50 g of orange peel powder was dissolved in 500 mL of distilled water and kept for hydro-distillation for 80 min at 96 °C. Subsequently, anhydrous sodium sulfate was used to dry the sample.EOs yield of extract was calculated using below equation:
Oil yield (%) = (Mass of essential oil (g)/(Weight of dried raw material (g)) × 100
2.6. Quantitative Phytochemical Analysis
Standard protocols were used to quantify the presence of bioactive compounds [27].
2.6.1. Total Phenolic Content (TPC)
TPC of the extract was determined using standard Folin-Ciocalteau (FC) reagent colorimetric method followed by Fawole et al. [28]. The diluted FC reagent and samples were mixed in equal amounts and allow standing for 2 min. Afterthat, 1 mL of sodium carbonate solution (7.5% w/v) was added in samples and allow incubating in the dark for 90 min. the absorbance of the mixture was recorded at 765 nm using UV-VIS spectrophotometer (SHIMADZU, UV-2600, Tokyo, Japan). The TPC of samples extract was calculated and results are expressed as gallic acid equivalent (mg/100 g) using standard curves of Gallic acid in various concentrations (20–100 mg/mL) (Figure 1).
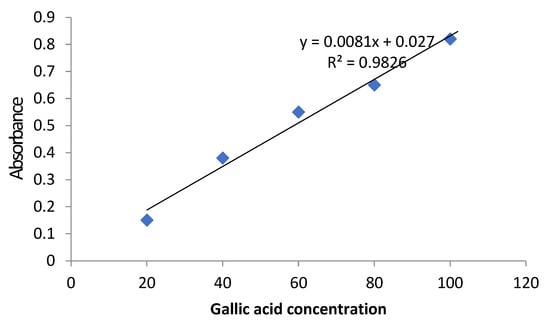
Figure 1.
Gallic acid standard curve for determination of TPC.
2.6.2. Antioxidant Activity (DPPHAssay)
DPPH (2,2diphenyl, 1pickrylhydrazyl) assay was used to determine the antioxidant activity of the samples [29]. 1 mL of sample was immersed with 5 mL of ethanol and then added 1 mL of DPPH solution (0.5 mM). The solution was mixed well and incubated for 60 min in dark at room temperature. The whole experiment was performed in the dark. The absorbance of the incubated mixture was recorded using UV-VIS spectrophotometer (SHIMADZU, UV-2600, Japan) at 517 nm. The DPPH solution was used as reference. Results of the DPPH were reported as percentage radical scavenging activity computed using the following equation:
DPPH (%) = (Control Abs − Sample Abs)/(Control Abs) × 100
The IC50 values were used to determine the quality of the radical scavenging property. IC50 (concentration providing 50% inhibition) values were calculated from percentage disappearance versus concentration plot.
2.7. FourierTransform Infrared (FT-IR) Analysis
The functional groups of essential oil extracted through hydro-distillation and ultrasound pretreated samples was analyzed by FTIR spectrometer (Agilent Cary 630) in a wave number range of 4000–400 cm−1 at room temperature with 32 scans and resolution of 8 cm−1. The IR spectra were reported in % transmittance and IR correlation charts were used to identify the functional groups. The peaks for both the samples were obtained at similar wave numbers indicating the presence of the same compounds in both the samples [30].
2.8. Gas Chromatography Mass Spectrometry (GCMS) Analysis of Citrus EO
Samples were analyzed with a Shimadzu GCMS–TQ 8040 instrument equipped with AOC—20i series auto-injector and MS detector. The column used for separation was the Restak Carbowax capillary column (RESTAK Pennsylvania, Bellefonte, PA, USA) with the standard length, diameter and film thickness of 30 m × 0.25 mm, and 0.25 μm respectively. Helium was used as carrier gas with a flow rate of 2.64 mL/min, and a split ratio of 20:1. The injection port temperature was kept at 230 °C and 1 μL of sample was injected through auto-injector. Column temperature was programmed from initial 40 °C with a holding time of 2 min, and then increased to 210 °C at the rate of 15 °C/min and finally held at this temperature for 5 min. Total analysis time for each sample was 18.33 min. Electron ionization (EI) system with ionization energy 70 eV, the ion source and the interface temperature maintained at 230 °C and detector voltage of 2 kV were employed for detection. The mass spectrum was acquired at a scan rate of 5553 scan/s and a mass range of 35–500 amu. The samples were analyzed in duplicate with solvent delay of 2 min. The data processing was done by GC-MS post run analysis software. The compounds identification was carried out using on-site NIST mass spectral library.
2.9. High Performance Liquid Chromatography (HPLC) Analysis of Phenolic Compounds
The Waters 2707-HPLC system equipped with thermostatically controlled column oven and 2996-PDA detector was used for separation and quantification of phenolic compounds in the extracted sample solution. The samples were filtered through Advantech filters before RP-HPLC analysis. Isocratic elution was performed in a RP18 column (250 × 4.6 mm × 5 µm) at room temperature and the flowrate of 1.1 mL/min. Acetonitrile with 0.1% acetic acid solvent was used as mobile phase. Samples were analyzed in triplicates using automatic sample injector. Data signals were measured at 360 nm of PDA detector. External standard method was used for identification and quantification of phenolic compounds and expressed as mg/100 g of extract [30,31].
2.10. Statistical Analysis
All the experiments were performed in triplicate and reported as Mean ± SD. SPSS (12.0) software was used to analyze the data using one way ANOVA. Duncan multiple range test was appointed to performed statistically significance (p < 0.05) difference. The extraction conditions were optimized using RSM contour plots and regression analysis of the dependent and independent variables.
3. Resultsand Discussions
3.1. Experimental Design Matrix
Experimental Design Matrix along with the response under study is shown in Table 1.

Table 1.
Experimental ranges and levels of three variables tested in Central Composite Design.
There are a total of three independent variables and dependent variables (response) selected under the study was % yield, which were studied by 20 runs (Table 2).The results indicate that the effect of the time of extraction, amplitude level, and solvent/sample ratio have equal contribution toward the extract recovery.
Table 2.
Experimental designs of the three levels and their experimental results and predictive values.
3.2. Effect on the Extraction Yield
Ultrasonic pretreatment has aneffect on the extraction yield at room temperature. Experimental results revealed that amplitude of 52.7%, solvent to sample ratio 3.2/1 and time 15.7 min yielded maximum (33.3% increased) essential oil. The higher extraction of essential oil by ultrasonic pretreatment might be possible due to increase in mass transfer by rupturing the cell wall and formation of micro cavities thus enhances the product yield [21,22]. The disruption of cell wall allows solvent to reach the oil inside the sample material leading to enhance extraction efficiency.
The least square technique was used to calculate linear, quadratic, and interaction terms of model and the regression coefficient of intercept were calculated. It was clear that linear and interaction parameters were insignificant (p > 0.05) and whereas all the quadratic parameters were significant (p < 0.05).The results indicated that the effect of the time of extraction, amplitude level and solvent/sample ratio have equal contribution toward the extract recovery.
The maximum extraction of 8.91% was obtained in run order 9 and minimum extraction of 3.90% was obtained in run order 7. Insignificant lack of fit as well as quadratic model’s best fit was suggested through Model fitting using Design Expert Software 10.0.2. Statistical analysis indicates that quadratic model with F value of 4.47 was significant. The respective lack of fit value of 4.59 further validates the fitness of model. The predicted second order polynomial model was:
Yield = 8.21 + 0.13∗A + 0.23∗B + 0.21∗C + 0.20∗AB + 0.05∗AC + 0.11∗BC − 0.63∗A2 − 0.51∗B2 − 1.20∗C2…
Equation (3) was used to construct 3D surface plots to determine the optimal levels of variable used.
Figure 2a represents the combined effect of extraction time and solvent to sample ratio on the extraction yield at the fixed amplitude. It was observed that moderate solvent/sample ratio with increase in extraction time gave high extraction yield. At the definite amplitude level, with increase in extraction time resulted in an increase in the extract recovery and reached a maximum and became constant. This is due to the rupture of the cell wall at optimum amplitude for 15.7 min that help in greater interaction of oil with solvent and maximize the extraction efficiency. The inner cell wall is at greater distance and hence the effect of ultrasonic reaches maximum at 15.7 min. With increase in the solvent/sample ratio, the extract yield increases up to the 3.2/1 and optimum time obtained was 15.7 min. The findings of current investigation are in line with findings of previous studies done by Sikdar et al. [26], Fakayode and Abobi, [32], and Giwa et al. [33].
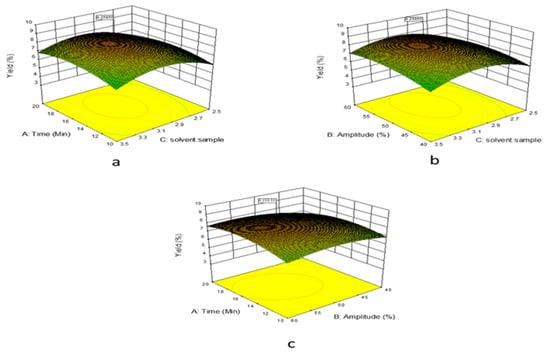
Figure 2.
(a) Effect of extraction time on the extraction yield; (b) Effect of solvent to sample ratio on the extraction yield; (c) Effect of amplitude level on the extraction yield.
The simultaneous effect of solvent to sample ratio and amplitude on the extract recovery at the fixed extraction time 15.7 min is shown in Figure 2b. Extraction yield increases gradually with increase in amplitude level and later became constant. The further increase of amplitude leads to the formation of bubbles; which reduces the extraction efficiency. The result shows that with increase in solvent/sample ratio there is an increase in extraction yield and maximum was obtained at 3.2/1 ratio and at 52.7% amplitude.
The combined effect of extraction time and amplitude level on the extract recovery at the fixed solvent/sample ratio of 3.2/1 is shown in Figure 2c. The response initially increased linearly with amplitude and later became constant with further increase in amplitude. Based on the responses collected, the extraction yield was maximized, and the optimal conditions obtained using RSM were: extraction time of 15.7 min, amplitude level of 52.7% and solvent/sample ratio of 3.2/1.
3.3. Extraction of Oil
The powdered orange peel was subjected to ultrasound pre-treatment using the optimized conditions obtained from RSM and was hydro-distilled. The yield of the oil from UAE pretreated hydro-distillation was 3.2 mL compared to 2.4 mL using the simple hydro-distillation method. Results show that the extraction increased by33% for ultrasonic pretreated method as compared to the conventional hydro-distillation method whereextraction time was reduced by 33%. Significant effect of sonication pretreatment on the % yield of extracted oil and time required for extraction was observed. The rupture of the cell wall and diffusion of cell content through the cell wall after the cell wall break are two phenomena that help in ultrasound-assisted extraction [34]. The cavitation effect produced in the sample by the ultrasound waves expedites the release of extractable compounds and cell wall disruption enhances the mass transfer. The constant value obtained is due to the equilibrium state reached by the system with no further increase in the extraction process.
The essential oil extraction was faster with theUAE pretreated hydro-distillation method. The extraction time was 80 min for UAE pretreated hydro-distillation while simple hydro-distillation required 120 min and the difference was quite significant which can be attributed due to cavitation effect produced in the sample by the ultrasound waves expedites the release of extractable compounds. Similar results were observed by Vilkhu, et al. [17]; Assami, et al. [35], and Morsy [36].
3.4. Fourier Transform Infra-Red (FTIR) Analysis
The FTIR analysis spectra for both the samples showed the similar results in terms of various functional groups present in the samples. These results show that the ultrasound pre-treatment does not affect the composition of the essential oil obtained from the citrus peel (Figure 3). Limonene was also detected by GC-MS analysis and briefly discussed in Section 3.5. The intense band of limonene occur at 885 cm−1 (out of plane bending of terminal methyl group), band at 1460.9 cm−1 (δCH2) and 1680(sh) cm−1 (νc = c). The band at 1630(sh) cm−1 (νc = c) is due to vinyl substituent of myrcene, along with two out of plane bending vibrations at 1121 cm−1 and 1033.8 cm−1 and sharp peak at 1513.1 cm−1 is due to νc = c vibrations of the double bond.
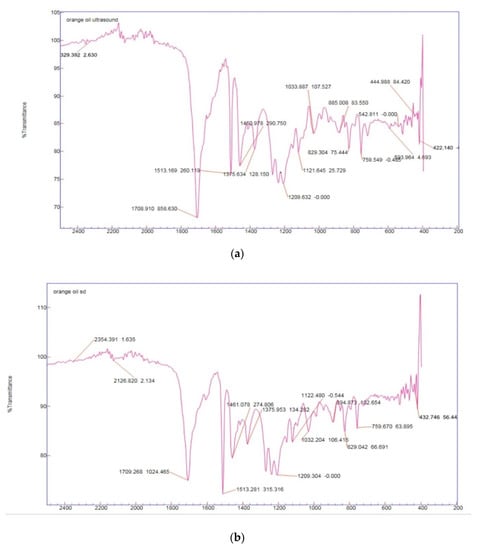
Figure 3.
FTIR graph of Ultrasound pretreated sample (a) and hydro-distilled sample (b).
The absorption of α-pinene observed at 759.5 cm−1 is attributed to out of plane bending, β-pinene absorption band occur at 885.0 cm−1 is due to methylene group and cyclohexane ring observed at 829.3 cm−1.Moreover, the significant carbonyl band of some key aroma compounds present in citrus oil such as octanal, decanal, citral, and sinensal was observed in the IR spectrum in the area of 1700–1720 cm−1.
3.5. Chemical Composition of Citrus EO by GCMS Analysis
GC-MS chromatography for citrus EOs prior to ultrasonic treatment and after the treatment is shown in GC-MS chromatograms (Table 3). Limonene was the principal compound of citrus EOs shown at the peak 6 and cover 69.42% of area, followed by β-myrcene (4.52%) and L-carvone (2.43%) at peak 5 and 21, respectively. Limonene is single-cyclic terpenenoid and hasa significant citrus odor and bitter taste, α-pinene, β-pinene and 3-carene are bi-cyclic terpenenoids and β-myrcene is a monoterpenoid and was found in both samples. The contents of other type terpenoids, such as sesquiterpenoids (bicycle[3.1.0]hexane, 4-methylene-1-(1-methylethyl) and 2-cyclohexen-1-one, 3-methyl-6-(1-methylethenyl)- cis), alcohols (β-linalool and α-terpineol), aldehydes (cis- and trans-citral), ketones (3-hydroxy-2-methyl-5(prop-1-en-2-yl)cyclohexanone), acids (octanoic acid) and oxides (cis- and trans-limonene oxide) were occupied low concentration (total amount is less than 20%).Previous studies with similar kinds have used different extraction methods of essential oil and our results were consistent with themin terms of major and minor component identified by GCMS analysis. The major component was limonene and minor components were β-myrcene, β-pinene, α-pinene, cymene, linalool etc. [37,38,39,40,41].
Table 3.
GC chromatograph data for hydro-distilled samples and ultrasound pre-treated samples.
3.6. Phytochemical Screening of Polyphenol Extract
The phytochemical screening of orange peel and pulp extract prepared using ethanol as a solvent revealedthe presence of some secondary metabolites such as flavanoids, saponins, terpenoids, tannins, alkaloids, steroids, and coumerins. Phlobatannins were not detected in the sample extract. The increase in percent amount extracted by UAE as compared to conventional solvent extraction method was 33% greater and time required for extraction was reduced to 50%.
3.6.1. Total Phenolic Content
The standard curve (y = 0.008x, R2 = 0.982) for determination of total phenol content was obtained by measuring absorbance of standard solution of Gallic acid (Figure 1). TPC of citrus peel and pulp extract are summed up in Table 4. Phenolic compounds present in large amount in peel and pulp waste in fruit is an important constituent due to their antioxidant activity [42]. The total phenolic content expressed as equivalent of Gallic acid (GAE) was found to be 258.67 ± 1.14 mg GAE/100 g for the peel extract and 735.54 ± 1.83 mg GAE/100 g for pulp extract of citrus sinensis respectively.Higher yield of TPC is in consistent with the Nayak et al. [43] and is attributed to the greater penetration in cell matrix and break down of cell wall to release phenolic components.
Table 4.
Total phenolic content and DPPH activity.
3.6.2. DPPH Activity
Hydroxyl groups present in sample are responsible for the DPPH free radical scavenging [44]. The lower the IC50 value the higher the antioxidant power. The results of the IC50 of different samples of citrus peel and pulp are summarized in Table 4. The IC50 value was found to be 44.26 ± 4.87% in citrus sinensis peel and 23.78 ± 3.53% for citrus sinensis pulp extract. The scavenging activity of sample extracts were in the order citrus sinensis pulp > citrus sinensis peel. The lower value of IC50 indicated the higher free radical scavenging activity. The results were consistent with the research of Perk et al. [45] and Malik et al. [46].
3.7. HPLC Analysis
HPLC analysis of the peel and pulp extract confirmed the presence of bioactive components i.e., caffeic acid, hesperidin, kaempferol, myrecitin, naringin, quercetin, and vanillin. Well separation of chromatogram peaks indicated that HPLC conditions were at an optimum, resulting in better efficiency of separation and quantification. Retention time was used for peak identification in the sample and the concentration of TPC was measured using the external standard method. Furthermore, TPC and TFC compounds were identified and quantified using HPLC.
The HPLC method was validated by means of linearity, limit of detection and limit of quantification. The limits of detection and quantification are summarized in Table 5. The method observed linearity ranging from 1.0 to 100.0 μg/g and correlation coefficients ranged from 0.997 to 0.999. The limit of detection ranged between 1.01–1.20 μg/g where the lowest and highest LoD were obtained for hesperidin and naringin, respectively. Furthermore, the limit of quantification values varied from 3.33–3.96 μg/g.
Table 5.
Bioactive compounds analyzed using HPLC.
The result revealed the presence of TPC compounds such as caffeic acid, naringin, vanillin, kaempferol, and quercetin. Table 5 showed the results of presence bioactive compounds in citrus peel and pulp on dry matter basis along with the limit of detection (LoD), and limit of quantitation (LoQ). Myrecitin was not detected in all samples while vanillin was not detected in pomace samples. The concentrations (mg/100 g DM) range found for polyphenols in citrus peel and pulp were: hesperidine (20.11 to 31.52 mg/100 g DM), kaempferol (0.51 to 5.62 mg/100 g DM), naringin (3.12 to 3.63 mg/100 g DM), caffeic acid (0.83 to 1.76 mg/100 g DM), and quercetin (1.06 to 1.13 mg/100 g DM). Vanillin (1.21 mg/100 g DM) was found in citrus peel but no detected in pulp extract.
The result revealed that the presence of TPC compounds such as caffeic acid, naringin, vanillin, kaempferol, and quercetin. Myrecitin was not detected in all samples while vanillin was not detected in pomace samples. The concentrations (mg/100 g) range found for polyphenols in citrus peel and pulp were;hesperidine (20.11 to 44.73), kaempferol (0.51 to 11.27), naringin (3.12 to 5.91), caffeic acid (0.83 to 3.85), quercetin (1.06 to 1.69) and vanillin (1.21 to 1.64).
Previous studies of a similar kind determined different classes of bioactive compounds; however, our results were consistent with those of Ma et al. [47], in terms of enhanced extraction by UAE, whichresulted in the release of free and bound bioactive compounds from peel and pulp of citrus sinesis. Hesperidin was found to be the highest concentration in comparison to other bioactive compounds [48].
4. Conclusions
The waste generated by citrus processing industries contains byproducts such as essential oil, polyphenols, and flavonoids. Valorizing waste increases the potential return and also helps in protecting the environment. The pretreatment ultrasound technique has the potential to be a modification technique for fast and efficient extraction and greater yield and thus save both energy and investment cost. It retains higher aroma antioxidant and antimicrobial properties. The release of essential oil from ultrasound pretreated sample contains essential oil volatiles, polyphenols, and flavonoids. The ultrasound pretreatment modification proved to be effective at the amplitude of 52.7%, solvent to sample ratio 3.2/1, and time 15.7 min. Thus, a combination of the emerging technology with conventional methods is an economical alternative according to the industry demands and sustainable development. The ethanol extracts contain the full spectrum of active compounds with excellent antioxidant properties, which make them beneficial ingredients for food and medicinal products too.
Author Contributions
H.K.S.: Conceptualization, Methodology, Investigation, Resources, Formal, P.S.: Methodology, Formal analysis, Visualization, Writing, N.K.: Visualization, Writing—review & editing, N.E.: Conceptualization, Methodology, Resources, Writing—review & editing, Visualization, Supervision, R.S., E.K. and A.A.M.A.-M.: Writing—review & editing, Article Processing Charge (APC) funding. All authors have read and agreed to the published version of the manuscript.
Funding
This research received no external funding.
Institutional Review Board Statement
Not applicable.
Informed Consent Statement
Not applicable.
Data Availability Statement
Available upon request from the corresponding author.
Acknowledgments
The authors are thankful to the National Institute of Food Technology Entrepreneurship and Management, Kundli- 131028 (Sonipat), Haryana, India, for their infrastructural/Technical support for conducting the experiments. Taif University Researchers Supporting Project Number (TURSP-2020/307), Taif University, Taif, Saudi Arabia. Additionally, the authors thank Prince Sattam Bin Abdulaziz University, Al-Kharj for their scientific contributions.
Conflicts of Interest
The authors declare no conflict of interest.
References
- Kumar, N.; Ojha, A.; Singh, R. Preparation and characterization of chitosan—Pullulan blended edible films enrich with pomegranate peel extract. React. Funct. Polym. 2019, 144, 104350. [Google Scholar] [CrossRef]
- Mahato, N.; Sharma, K.; Sinha, M.; Baral, E.R.; Koteswararao, R.; Dhyani, A.; Hwan Cho, M.; Cho, S. Bio-sorbents, industrially important chemicals and novel materials from citrus processing waste as a sustainable and renewable bioresource: A review. J. Adv. Res. 2020, 23, 61–82. [Google Scholar] [CrossRef]
- Kumar, N.; TrajkovskaPetkoska, A.; Khojah, E.; Sami, R.; Al-Mushhin, A.A. Chitosan Edible Films Enhanced with Pomegranate Peel Extract: Study on Physical, Biological, Thermal, and Barrier Properties. Materials. 2021, 14, 3305. [Google Scholar] [CrossRef] [PubMed]
- Kaur, K. Functional nutraceuticals: Past, present, and future. In Neutraceuticals; Grumezescu, A.M., Ed.; Academic Press: Cambridge, UK; Elsevier: London, UK, 2016; Volume 4, pp. 41–78. [Google Scholar]
- Manthey, J.A.; Grohmann, K. Phenolics in citrus peel byproducts. Concentrations of hydroxycinnamates and polymethoxylated flavones in citrus peel molasses. J. Agric. Food Chem. 2001, 49, 3268–3273. [Google Scholar] [CrossRef]
- Wang, L.; Wang, J.; Fang, L.; Zheng, Z.; Zhi, D.; Wang, S.; Zhao, H. Anticancer activities of citrus peel polymethoxyflavones related to angiogenesis and others. Biomed Res. Int. 2014, 2014, 453972. [Google Scholar] [CrossRef]
- Romagnolo, D.F.; Selmin, O.I. Flavonoids and cancer prevention: A review of the evidence. J. Nutr. Gerontol. Geriatr. 2012, 31, 206–238. [Google Scholar] [CrossRef] [PubMed]
- Meiyanto, E.; Hermawan, A.; Anindyajati, A. Natural products for cancer-targeted therapy: Citrus flavonoids as potent chemopreventive agents. Asian Pac. J. Cancer Prev. 2012, 13, 427–436. [Google Scholar] [CrossRef] [PubMed]
- Aruoma, O.I.; Landes, B.; Ramful-Baboolall, D.; Bourdon, E.; Neergheen-Bhujun, V.; Wagner, K.H.; Bahorun, T. Functional benefits of citrus fruits in the management of diabetes. Prev. Med. 2012, 54, S12–S16. [Google Scholar] [CrossRef]
- Hwang, S.L.; Shih, P.H.; Yen, G.C. Neuroprotective effects of citrus flavonoids. J. Agric. Food Chem. 2012, 60, 877–885. [Google Scholar] [CrossRef]
- Elhakem, A.H.; Benajiba, N.; Koko, M.Y.; Khojah, E.; Rok, A. DPPH, FRAP and TAEC Assays with Postharvest Cabbage (Brassica oleracea) Parameters During the Packaging Process. Pak. J. Agric. Sci. 2021, 24, 182–187. [Google Scholar] [CrossRef]
- El Tamer, M.K. Molecular Regulation of Plant Monoterpene Biosynthesis in Relation to Fragrance; 2002; Available online: https://edepot.wur.nl/121357 (accessed on 5 December 2021).
- Smith, D.C.; Forland, S.; Bachanos, E.; Matejka, M.; Barrett, V. Qualitative analysis of citrus fruit extracts by GC/MS: An undergraduate experiment. Chem. Educ. 2005, 6, 28–31. [Google Scholar] [CrossRef]
- Luque De Castro, M.D.; Jiménez-Carmona, M.M.; Fernández-Pérez, V. Towards more rational techniques for the isolation of valuable essential oils from plants. TrAC Trends Anal. Chem. 1999, 18, 708–716. [Google Scholar] [CrossRef]
- Lucchesi, M.E.; Chemat, F.; Smadja, J. Solvent-free microwave extraction of essential oil from aromatic herbs: Comparison with conventional hydro-distillation. J. Chromatogr. A. 2004, 1043, 323–327. [Google Scholar] [CrossRef]
- Zulkifli, K.S.; Abdullah, N.; Abdullah, A.; Aziman, N.; Kamarudin, W.S. Bioactive phenolic compounds and antioxidant activity of selected fruit peels. Int. Conf. Environ. Chem. Biol. 2012, 49, 66–70. [Google Scholar]
- Vilkhu, K.; Mawson, R.; Simons, L.; Bates, D. Applications and opportunities for ultrasound assisted extraction in the food industry—A review. Innov. Food Sci. Emerg. Technol. 2008, 9, 161–169. [Google Scholar] [CrossRef]
- Kumar, N.; Pratibha; Neeraj; Sharma, S. Effect of Solvents on Physiochemical Properties of Freeze-dried Pomegranate Seed (Cv. Bhagwa). Int. J. Fruit Sci. 2020, 20, 590–604. [Google Scholar] [CrossRef]
- Kumar, N.; Neeraj. Effect of Ultrasonic Assisted Extraction on the Properties of Freeze-Dried Pomegranate Arils. Curr. Nutr. Food Sci. 2020, 16, 83–89. [Google Scholar] [CrossRef]
- Chemat, F.; Zill-e-Huma; Khan, M.K. Applications of ultrasound in food technology: Processing, preservation and extraction. Ultrason. Sonochem. 2011, 18, 813–835. [Google Scholar] [CrossRef] [PubMed]
- Vinatoru, M. An overview of the ultrasonically assisted extraction of bioactive principles from herbs. Ultrason. Sonochem. 2001, 8, 303–313. [Google Scholar] [CrossRef]
- Cameron, M.; McMaster, L.D.; Britz, T.J. Impact of ultrasound on dairy spoilage microbes and milk components. Dairy Sci. Technol. 2010, 90, 119. [Google Scholar] [CrossRef][Green Version]
- Reverchon, E.; Ambruosi, A.; Senatore, F. Isolation of Peppermint Oil Using Supercritical CO2. Flavour Fragr. J. 1994, 9, 19–23. [Google Scholar] [CrossRef]
- Li, H.; Pordesimo, L.; Weiss, J. High intensity ultrasound-assisted extraction of oil from soybeans. Food Res. Int. 2004, 37, 731–738. [Google Scholar] [CrossRef]
- Zhang, Z.-S.; Wang, L.-J.; Li, D.; Jiao, S.-S.; Chena, Z.-H.M. Ultrasound-assisted extraction of oil from flaxseed. Sep. Purif. Technol. 2008, 62, 192–198. [Google Scholar] [CrossRef]
- Sikdar, D.C.; Menon, R.; Duseja, K.; Kumar, P.; Swami, P. Extraction of citrus oil from orange (Citrus sinensis) peels by steam distillation and its characterizations. Int. J. Tech. Res. Appl. 2016, 4, 2320–8163. [Google Scholar]
- Harborne, J.B. Phytochemical Methods a Guide to Modern Techniques of Plant Analysis, 5th ed.; Chapman and Hall Ltd.: London, UK, 1998. [Google Scholar]
- Fawole, O.A.; Opara, U.L.; Theron, K.I. Chemical and Phytochemical Properties and Antioxidant Activities of Three Pomegranate Cultivars Grown in South Africa. Food Bioprocess Technol. 2012, 5, 2934–2940. [Google Scholar] [CrossRef]
- Elhakem, A.H.; Almatra, M.M.; Benajiba, N.; Koko, M.Y.; Sami, R. Comparative Analysis of Bioactive Compounds, Antioxidant and Anti-inflammatory Activities of Apple Varieties. Asian J. Plant Sci. 2020, 20, 61–66. [Google Scholar] [CrossRef]
- Sami, R.; Khojah, E.; Mansour, A.M.A.; Al-Mushhin, A.A.M.; Elhakem, A.; El-Sherif, D.M.; Alkaltham, M.S.; Salamatullah, A.M. Nutritional Values, Microbial Population and Bioactive Components of Pomegranate (Punicagranatum L.) Peel Extracts. Int. J. Pharmacol. 2021, 17, 208–216. [Google Scholar] [CrossRef]
- Alkaltham, M.S.; Hayat, K.; Ahmed, M.A.; Salamatullah, A.M.; Sami, R.; Khojah, E.; Al-Mushhin, A.A.M. Bioactive Compounds, HPLC Screening of Phenolic Compounds and Antioxidant Potential Activity of Saffron(Crocus Sativus L.). J. Biobased Mater. Bioenergy. 2021, 15, 1–5. [Google Scholar]
- Fakayode, O.A.; Abobi, K.E. Optimization of oil and pectin extraction from orange (Citrus sinensis) peels: A response surface approach. J. Anal. Sci. Technol. 2018, 9, 1–16. [Google Scholar] [CrossRef]
- Giwa, S.O.; Muhammad, M.; Giwa, A. Utilizing orange peels for essential oil production. ARPN J. Eng. Appl. Sci. 2018, 13, 17–27. [Google Scholar]
- Medina-Torres, N.; Ayora-Talavera, T.; Espinosa-Andrews, H.; Sánchez-Contreras, A.; Pacheco, N. Ultrasound assisted extraction for the recovery of phenolic compounds from vegetable sources. Agronomy. 2017, 7, 47. [Google Scholar] [CrossRef]
- Assami, K.; Pingret, D.; Chemat, S.; Meklati, B.Y.; Chemat, F. Ultrasound induced intensification and selective extraction of essential oil from Carumcarvi L. seeds. Chem. Eng. Process. Process Intensif. 2012, 62, 99–105. [Google Scholar] [CrossRef]
- Morsy, N.F.S. A short extraction time of high quality hydrodistilled cardamom (Elettaria cardamomum L. Maton) essential oil using ultrasound as a pretreatment. Ind. Crops Prod. 2015, 65, 287–292. [Google Scholar] [CrossRef]
- Toan, T.Q.; Truc, T.T.; Le, X.T.; Quyen, N.T.; Tran, T.H. Study on extraction process and analysis of components in essential oils of Vietnamese orange peel (Citrus sinensis) by microwave assisted hydrodistillation extraction. In IOP Conference Series: Materials Science and Engineering 2020; IOP Publishing: Bristol, UK, 2020; Volume 991, p. 012125. [Google Scholar] [CrossRef]
- Yang, E.J.; Kim, S.S.; Oh, T.H.; Baik, J.S.; Lee, N.H.; Hyun, C.G. Essential oil of citrus fruit waste attenuates LPS-induced nitric oxide production and 272 inhibits the growth of skin pathogens. Int. J. Agri. Biol. 2009, 11, 791–794. [Google Scholar]
- Ferhat, M.A.; Meklati, B.Y.; Smadja, J.; Chemat, F. An improved microwave Clevenger apparatus for distillation of essential oils from orange peel. J. Chromatogr. A. 2006, 1112, 121–126. [Google Scholar] [CrossRef]
- Azhdarzadeh, F.; Hojjati, M. Chemical Composition and Biological Activities of Lemon (Citrus limon) Leaf Essential Oil. Nutr. Food Sci. Res. 2017, 3, 43–50. [Google Scholar]
- Sarrou, E.; Chatzopoulou, P.; Theriou, K.; Therios, I. Volatile Constituents and Antioxidant Activity of Peel, Flowers and Leaf Oils of Citrus aurantium L. Growing in Greece. Molecules. 2013, 18, 10639–10647. [Google Scholar] [CrossRef] [PubMed]
- Luximon-Ramma, A.; Bahorun, T.; Crozier, A. Antioxidant actions and phenolic and vitamin C contents of common Mauritian exotic fruits. J. Sci. Food Agric. 2003, 83, 496–502. [Google Scholar] [CrossRef]
- Nayak, B.; Dahmoune, F.; Moussi, K.; Remini, H.; Dairi, S.; Aoun, O.; Khodir, M. Comparison of microwave, ultrasound and accelerated-assisted solvent extraction for recovery of polyphenols from Citrus sinensis peels. Food Chem. 2015, 187, 507–516. [Google Scholar] [CrossRef]
- Arnao, M.B.; Cano, A.; Acosta, M. The hydrophilic and lipophilic contribution to total antioxidant activity. Food Chem. 2001, 73, 239–244. [Google Scholar] [CrossRef]
- Park, J.H.; Lee, M.; Park, E. Antioxidant activity of orange flesh and peel extracted with various solvents. Prev. Nutr. Food Sci. 2014, 19, 291. [Google Scholar] [CrossRef] [PubMed]
- Malik, A.; Czech, A.; Sosnowska, B.; Domaradzki, P. Bioactive Substances, Heavy Metals, and Antioxidant Activity in Whole Fruit, Peel, and Pulp of Citrus Fruits. Int. J. Food Sci. 2021, 2021. [Google Scholar] [CrossRef]
- Ma, Y.Q.; Chen, J.C.; Liu, D.H.; Ye, X.Q. Simultaneous extraction of phenolic compounds of citrus peel extracts: Effect of ultrasound. Ultrason. Sonochem. 2009, 16, 57–62. [Google Scholar] [CrossRef] [PubMed]
- Khan, M.K.; Abert-Vian, M.; Fabiano-Tixier, A.S.; Dangles, O.; Chemat, F. Ultrasound-assisted extraction of polyphenols (flavanone glycosides) from orange (Citrus sinensis L.) peel. Food Chem. 2010, 119, 851–858. [Google Scholar] [CrossRef]


Publisher’s Note: MDPI stays neutral with regard to jurisdictional claims in published maps and institutional affiliations. |
© 2021 by the authors. Licensee MDPI, Basel, Switzerland. This article is an open access article distributed under the terms and conditions of the Creative Commons Attribution (CC BY) license (https://creativecommons.org/licenses/by/4.0/).