Abstract
Growing consumer interest in hemp oilseed supplements requires quality control. Therefore, appropriate, effective and verified analytical methods are needed for the determination of some bioactive cannabinoids in them. The aim of the study is to present an extended (compared to our previous research) validated high performance liquid chromatography with diode array detection (HPLC-DAD) method for the determination of four cannabinoids (cannabidiol, cannabidiolic acid, cannabinol and delta-9-tetrahydrocannabinol) in an oil matrix, which was used to determine these cannabinoids in seven commercial hemp oil supplements. In our method, the isolation of the target compounds was based on liquid extraction with acetonitrile combined with the freezing (at −41 °C) of the oil phase. The results show that in some cases, the determined concentrations of cannabinoids in the tested supplements differ significantly from those declared by the manufacturers. As for the main medicinal cannabinoid (CBD) in hemp oil supplements, in two cases, the measured concentration was significantly lower (1.45 and 1.81%) than the declared (5 and 5%), and in the other supplements, the obtained results confirm the declared amount of CBD within the error range from 3.29 to 9.2%. Therefore, to ensure the safe and beneficial use of these supplements by consumers, it is necessary to monitor their cannabinoid composition.
1. Introduction
Hemp (Cannabis sativa L.) is a dioecious annual plant belonging to the cannabis family (Cannabaceae) [1]. This plant is popularly known from their psychoactive activity and recreational use [2].
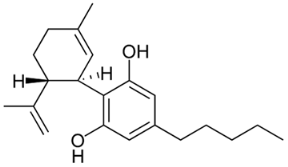
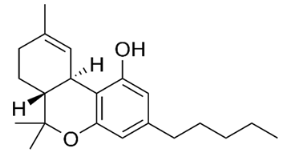
The most important group of bioactive compounds in cannabis is cannabinoids, of which cannabidiol (CBD), cannabidiolic acid (CBDA), cannabinol (CBN) and psychoactive delta-9-tetrahydrocannabinol (∆9-THC) are of particular importance. CBDA, a precursor to CBD, is found naturally in the leaves, and only under the influence of light or heat is transformed into a decarboxylated form (CBD) [3,4]. Generally, all these compounds are not dissolving in water but are well dissolved in organic solvents. Their hydrophobicity change in range of log P from 4.86 to 5.28 (6.99) (Table 1).

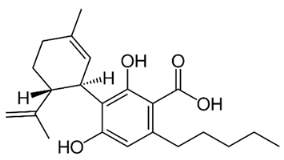
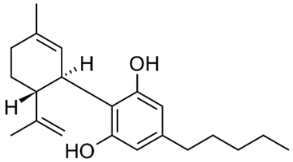
Table 1.
Structures and physicochemical properties of four cannabinoids: CBDA, CBD, CBN and ∆9-THC [5,6].
Cannabinoids interact in the body with the endocannabinoid system, which consists of CB1 and CB2 receptors and their ligands (cannabinoids). CB1 receptors are found mainly in the central nervous system, while CB2 receptors are found in the peripheral nervous system. The largest concentration of CB1 receptors is found in the brain, the liver, the pancreas and the digestive system, while CB2 receptors are more concentrated in cells of the immune and skeletal systems [7,8,9].
In recent decades, the therapeutic properties of cannabinoids have aroused the interest of scientists and physicians, as well as consumers. From among a variety of therapeutic activities of cannabis, especially analgesic, anti-cancer, anti-emetic and neuroprotective effects were reported [10,11,12,13,14,15,16,17].
The stimulation of CB1 receptors, which are found in many structures of the brain, is responsible for, e.g., the analgesic effect of cannabinoids [10,11]. The anti-cancer properties of cannabinoids include anti-proliferative, anti-metastatic, anti-angiogenic and anti-apoptotic properties in the treatment of lung, skin, breast, thyroid, pancreatic and prostate cancer [12,13]. These effects are due to the activation of CB1 and CB2 receptors by cannabinoids, the activation of which affects the biochemical and physiological state of cancer cells. Δ9-THC and its analogs have been shown to be effective in chemotherapy-induced nausea and vomiting [14,15]. The antiemetic mechanism of cannabinoids is explained by their action on CB1 receptors located in the medulla elongated brain stem, which controls gag reflexes.
The healing properties of cannabinoids can also be tried in the treatment of Parkinson’s and Alzheimer’s disease, glaucoma and multiple sclerosis [16,17].
Apart from the therapeutic effects described above, other positive therapeutic properties are mentioned, such as sedative, anxiolytic and hypnotic, without the associated side effects [18,19]. Thus, certain cannabinoids, especially CBD, CBDA and CBN, are widely accessible in the form of oil dietary supplements. Therefore, it is important to have appropriate reliable methods that will allow for control of the qualitative and quantitative composition of these preparations in terms of the cannabinoids content in them.
Cannabinoids were assayed predominantly by chromatographic methods, such as LC-MS [20,21], GC-MS [22], GC-FID [23], HPLC-DAD [24,25,26] and OPLC [27] or even using more sophisticated analytical techniques, for example NMR [28]. From among extraction techniques, UAE [25], dynamic maceration [29], SPME [30], MAE [31], QuEChERS [21] or SFE [32] were applied. A number of extraction solvents, such as ethanol [24], methanol [25], ethyl acetate/isopropanol (1/1, v/v) [33], methanol/chloroform (90/10, v/v) [34], hexane/isopropanol (9/1, v/v) [35] or methanol/water (80/20, v/v) [20], were also used. These compounds were mainly determined in plant materials [20,22,34,35] and hemp food [21,24,33,35], as well as in cosmetic and pharmaceutical [24,33] products.
At present, there is a relatively small number of papers presenting quantitative analysis of cannabinoids in oil matrices. The examples of determination of these bioactive compounds in oils may be indicated in several reports [24,25,33,36], which were published in recent years.
This work constitutes the extension of our previous examinations [37]. The present research is focused on the determination of main analytical parameters of the HPLC-DAD method for the determination of the next two cannabinoids (CBN and Δ9-THC) in an oil matrix, as well as analysis of seven commercial oil supplements, containing cannabinoids in various composition. To our knowledge, for the first time to isolate the tested cannabinoids from the oil matrix, liquid-liquid extraction was used with acetonitrile as an extraction solvent in combination with a freezing the oil phase at −41 °C.
2. Experimental
2.1. Standards and Reagents
The standard solutions of CBD, CBDA, CBN and Δ9-THC, each at concentration 1 mg per 1 mL of methanol or acetonitrile, were purchased from LGC Standards (London, UK). Methanol (MeOH) and acetonitrile (ACN), both of HPLC-gradient grade, were purchased from Merck (Darmstadt, Germany). Analytical grade 98.5% acetic acid was bought from Avantor (Gliwice, Poland). Deionized water was obtained from a demineralized water system HLP SUV (Hydrolab, Poznań, Poland).
2.2. Examined Materials
The standard oil samples were prepared from “Casa de Azeite” extra virgin olive oil, which came from the local market in Poland.
The following hemp oil supplements originating from different producers were subjected to the analysis. The declared composition of the supplements by the producers is given in brackets.
- Supplement I: dark yellow hemp oil (5% CBD);
- Supplement II: yellow-green hemp oil (5% CBD);
- Supplement III: dark yellow hemp oil (5% CBD);
- Supplement IV: dark brown hemp oil-resin (18.87% CBD, 27.01% CBDA, CBN 0.01%, 0.29% Δ9-THC)—this supplement was at the stage of implementation for sale and was not introduced to the market;
- Supplement V: light yellow hemp oil (10% CBD);
- Supplement VI: yellow hemp oil (5% CBD);
- Supplement VII: dark yellow hemp oil (10% CBD).
2.3. Apparatus and Laboratory Equipment, Chromatographic Conditions
The samples were prepared using the following equipment: analytical balance (Radwag, Radom, Poland), vortex (Techno-Kartell, Noviglio, Italy), multifunctional rocker shaker (Grant Instruments Ltd., Cambridge, UK), sonic bath (Sonic & Materials Inc., Newtown, CT, USA), as well as low temperature freezer (Poleko, Wodzislaw Slaski, Poland) with the temperature regulation range from −80 to −40 °C.
Chromatographic analyses were performed with the use of liquid chromatography system LaChrom D-7000 (Merck-Hitachy, Japan) equipped with autosampler L-7200, pomp L-7100 and DAD L-7455. Separation of cannabinoids were conducted on a column Spheri-5, type C18 (250 × 4.6 mm, 5 µm). A mixture of 0.5% acetic acid in water (phase A) and acetonitrile (phase B) was used as the mobile phase, which flow was 1 mL/min, in a gradient mode. The gradient started from 30% phase A and 70% phase B, then phase A degreased to 20% and phase B increased to 80% for 5 min, and finally the gradient returned to the starting conditions for 5 min. The total time of analysis was 20 min. The column was thermostated to 25 °C. A total of 20 µL of a sample or a standard solution was injected into the column. The cannabinoids were detected at two waves: 220 and 240 nm.
2.4. Standard Oil Samples Preparation
Six samples of approx. 100 mg of olive oil were accurately weighed in 2 mL Eppendorf tubes on an analytical balance. In order to establish the calibration curves, the olive oil samples were prepared containing four tested cannabinoids at six concentration levels for each cannabinoid, i.e., 25, 12.5, 6.25, 3.125, 1.563, 0.781 µg/mL, by adding 20 µL of the standard solution of each cannabinoid at the appropriate concentration to the oil sample. The spiked olive oil samples were vortexed by 1 min and incubated for 1 h at room temperature. Next, 420 µL acetonitrile (500 µL acetonitrile minus 80 μL of acetonitrile/methanol originating from four standard solutions) was added and the sample was shaken for 15 min using a rocker shaker. To freeze the oil layer, the sample was kept horizontally in a freezer at −41 °C for 15 min. After that time, a liquid acetonitrile layer was quickly pipetted into an autosampler 1.5 mL vessel and twice diluted with acetonitrile. The content was vortexed by 30 s and was placed in the autosampler for HPLC analysis.
2.5. Determination of Main Analytical Parameters of the Method
The validation parameters (range of linearity, LOD and LOQ, precision at two analyte concentration levels, extraction recovery at two analyte concentration levels and its repeatability) for the cannabinoids CBN and Δ9-THC studied herein were calculated analogously as in our previous research [37] concerning development of the method for determination of two cannabinoids: CBDA and CBD in an oil matrix.
2.6. Supplements Preparation
In a 2 mL Eppendorf tube, approximately 100 mg of each supplement was accurately weighed and subjected to the extraction procedure with 500 µL of acetonitrile. The next steps were analogous to those described in the section concerning preparation of standard oil samples. As the concentrations of the studied cannabinoids in supplements were varied, the obtained extracts were appropriately diluted before analysis for determination of a particular compound.
3. Results and Discussion
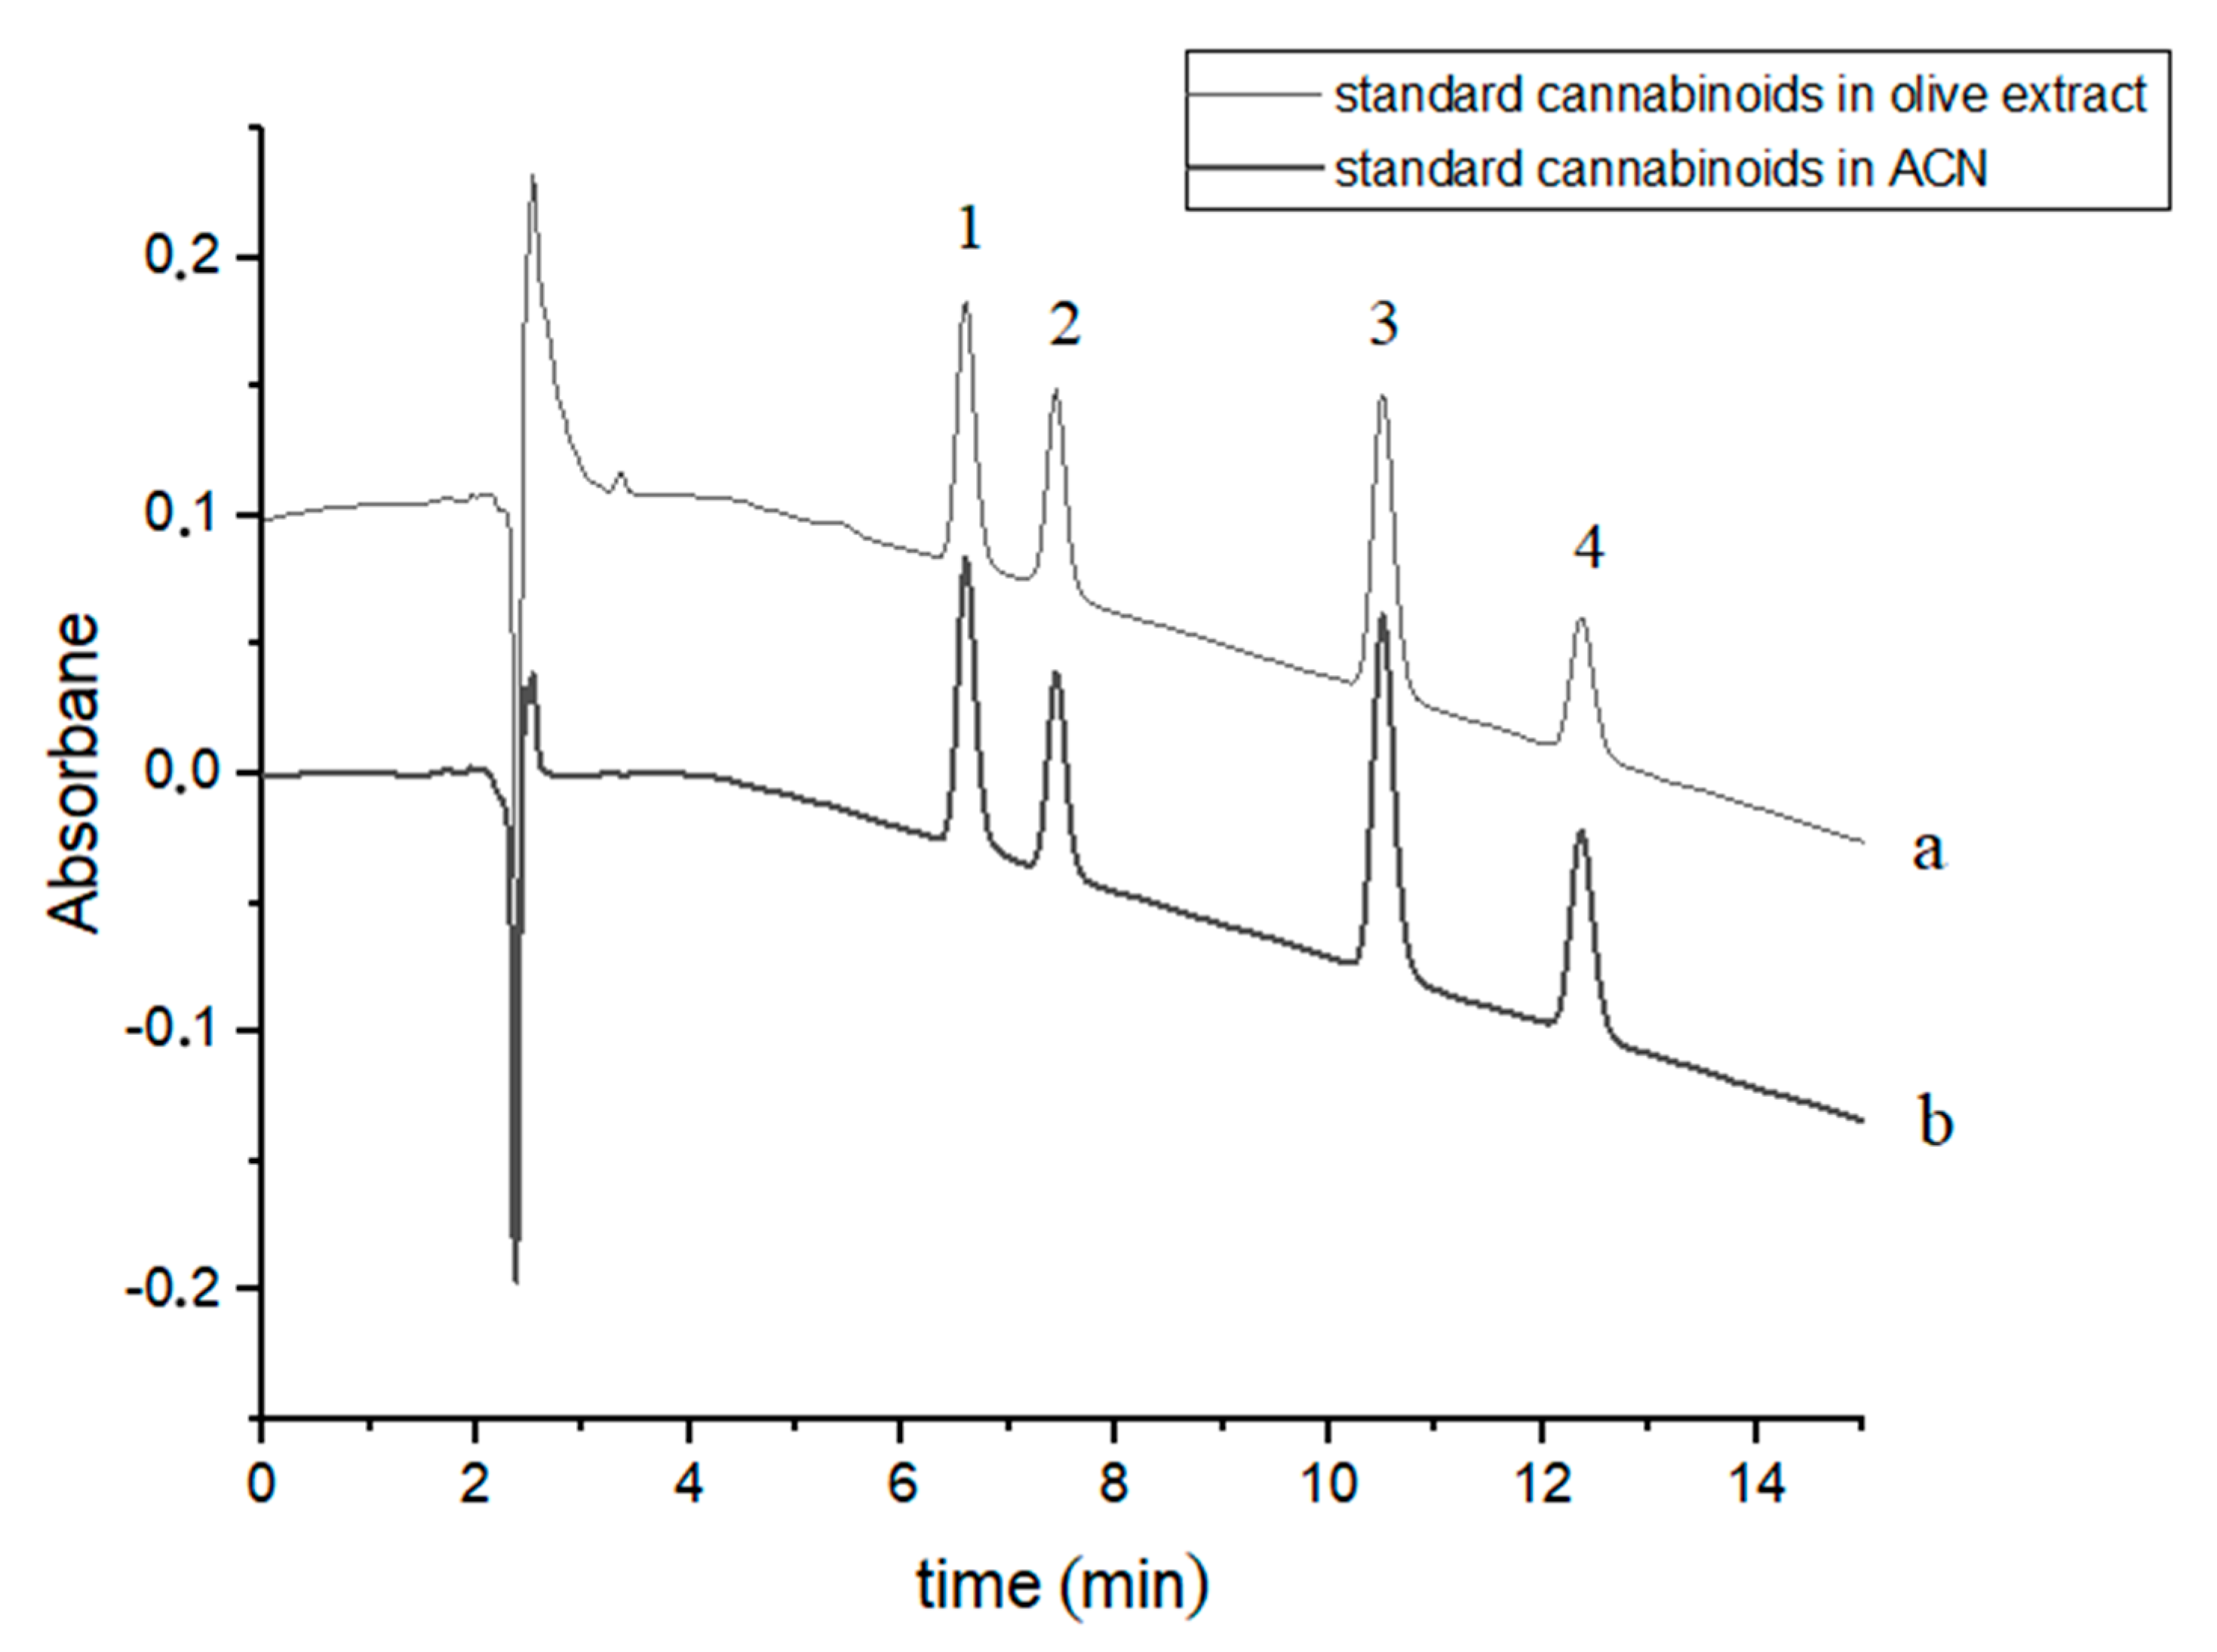
Four cannabinoids were chromatographically separated to baseline during c.a. 12.5 min using slightly modified gradient conditions [37]. The retention times of the studied cannabinoids were: 6.60, 7.44, 10.52 and 12.39 min for CBDA, CBD, CBN and Δ9-THC, respectively (Figure 1). The order of elution of the four cannabinoids in the chromatographic system used is due to their hydrophobicity (Table 1). Exemplary chromatograms of a mixture of four standard cannabinoids in acetonitrile and in olive extract with the addition of these compounds are shown in Figure 1.
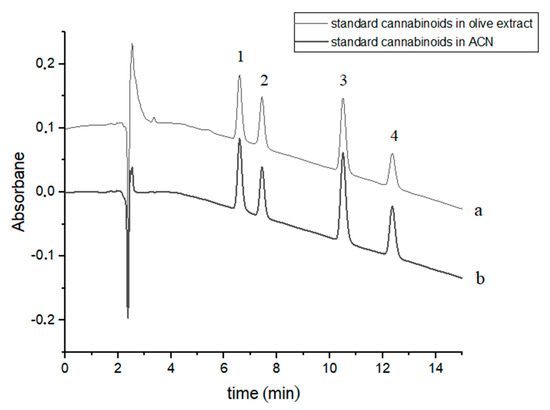
Figure 1.
Chromatograms of four cannabinoids - CBDA, CBD, CBN and Δ9-THC—(a) in an olive extract and (b) in acetonitrile (ACN). The compounds were detected at λ = 220 nm. 1—CBDA, 2—CBD, 3—CBN and 4—Δ9-THC.
Due to its bioactive properties, CBD is the chief and most important component of hemp oil supplements while the allowed concentration of the psychoactive Δ9-THC in these products is strongly limited and should be below 0.2% (w/w). The other two cannabinoids (CBDA and CBN) usually coexist in natural products of hemp, and may modify their therapeutic properties.
The RP-HPLC-DAD method for simultaneous identification and determination of the four cannabinoids in an oil (olive oil) matrix was developed. Main validation parameters of this method, such as range of linearity, precision at two concentration levels, limits of detection and determination, extraction recovery at two concentration levels and its repeatability for each compound (for CBDA and CBD) were reported in [37]) and presented in Table 2.
Table 2.
Validation parameters for determination of CBDA, CBD, CBN and ∆9-THC in oil matrix by HPLC-DAD.
The obtained extraction recovery values indicate that with the applied extraction solvent (acetonitrile), the best extraction results are for CBD, and the other cannabinoids give similar and a little bit lower extraction yields, which can be set in the following descending order: CBN > CBDA > ∆9-THC. This phenomenon is not quite in agreement with the increasing order of hydrophobicity of the cannabinoids: CBDA < CBD < CBN < ∆9-THC (Table 1) and, consequently, theoretically decreasing solubility of these compounds in polar solvents (e.g., ethanol or acetonitrile). It may only be indicated that the cannabinoids CBD and CBN, which are characterized by intermediate (in relation to the other two) hydrophobicity, are better extracted into the used relatively polar solvent. However, a similar relationship in extraction yield into a polar solvent, with the exception of ∆9-THC, may be found in the paper [24], where extraction (with 95% ethanol) efficiency decreased in the following order: CBD > CBN > CBDA.
The values of determined analytical parameters (Table 2) indicate that the proposed method is suitable for the study of hemp oil supplements. On the basis of a literature review, it may be generally stated that there is not a large number of reports publishing the results of cannabinoids analysis in oil matrix, and in most cases, there is lack of main validation data of the used analytical methods. Some available literature data were presented and compared with those of the proposed method in Table 3.
Table 3.
Comparison of the proposed method with other methods for HPLC-DAD determination of cannabinoids in oil matrix.
Due to the low admissible concentration level of Δ9-THC (0.2%, w/w) in hemp supplements, especially essential is the value of LOD/LOQ for this cannabinoid, which in our method is an appropriately low concentration level (0.65/1.95 μg/mL) and it is comparable with those cited in literature [33,36,38]. The proposed method requires a small amount of extraction solvent (0.5 mL) per sample, which is lower than those cited by other authors (5–10 mL). The simplicity and time consuming of the presented sample preparation method is comparable with those of other methods [24,25,33,36,38]; however, in one reported case [36], sample preparation was easier and only dilution with 2-propanol and IS solution was applied before injecting the sample to chromatograph. Although the precision of our method is slightly lower, especially in the case of CBDA and Δ9-THC, comparing its efficiency with that of other authors’ methods [24,25,33,36,38], it can be generally concluded that the proposed method is suitable for the analysis of hemp oil supplements to monitor the four cannabinoids tested. To verify the developed method on real samples, seven hemp oil supplements were subjected to analysis by this method. The obtained results were presented in Table 4.
Table 4.
The contents of the four cannabinoids in the analyzed supplements.
In order to perform correct identification of the cannabinoids in the examined supplements, the retention times of standard cannabinoids in an olive matrix, as well as UV spectra corresponding to the compounds of interest, were considered. Analysis of each supplement was repeated at least three times. In all the supplements, three cannabinoids: CBDA, CBD and CBN were detected, but Δ9-THC was identified only in two supplements (IV and V). CBD, the main healing compound, was found in the analyzed products: I–VII in the following concentrations: 1.45; 4.82; 1.81; 18.25; 10.25; 4.54 and 10.28% (w/w), respectively. Comparing these results with the declared CBD content by the manufacturers, the conclusion is that in the case of the two supplements (I and III), the determined concentrations were considerably lower (1.45 and 1.81%) than the declared ones (5 and 5%). In the rest of the supplements, the obtained results confirm the declared CBD amount within the error range from 3.29 to 9.2%. In the case of one supplement (IV—oil-resin) the producer also provided information on concentrations of CBDA, CBN and Δ9-THC. The obtained results show that concentrations of CBDA, CBN and Δ9-THC were 25.75, 0.35 and 0.84%, respectively. Thus, it may be concluded that concentration of CBDA was lower but concentrations of CBN and Δ9-THC were higher than those declared. Especially, the concentration of Δ9-THC was higher than the permissible concentration level of this psychoactive compound in commercial hemp supplements.
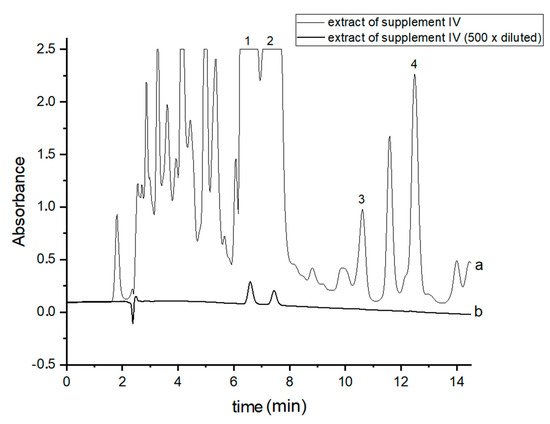
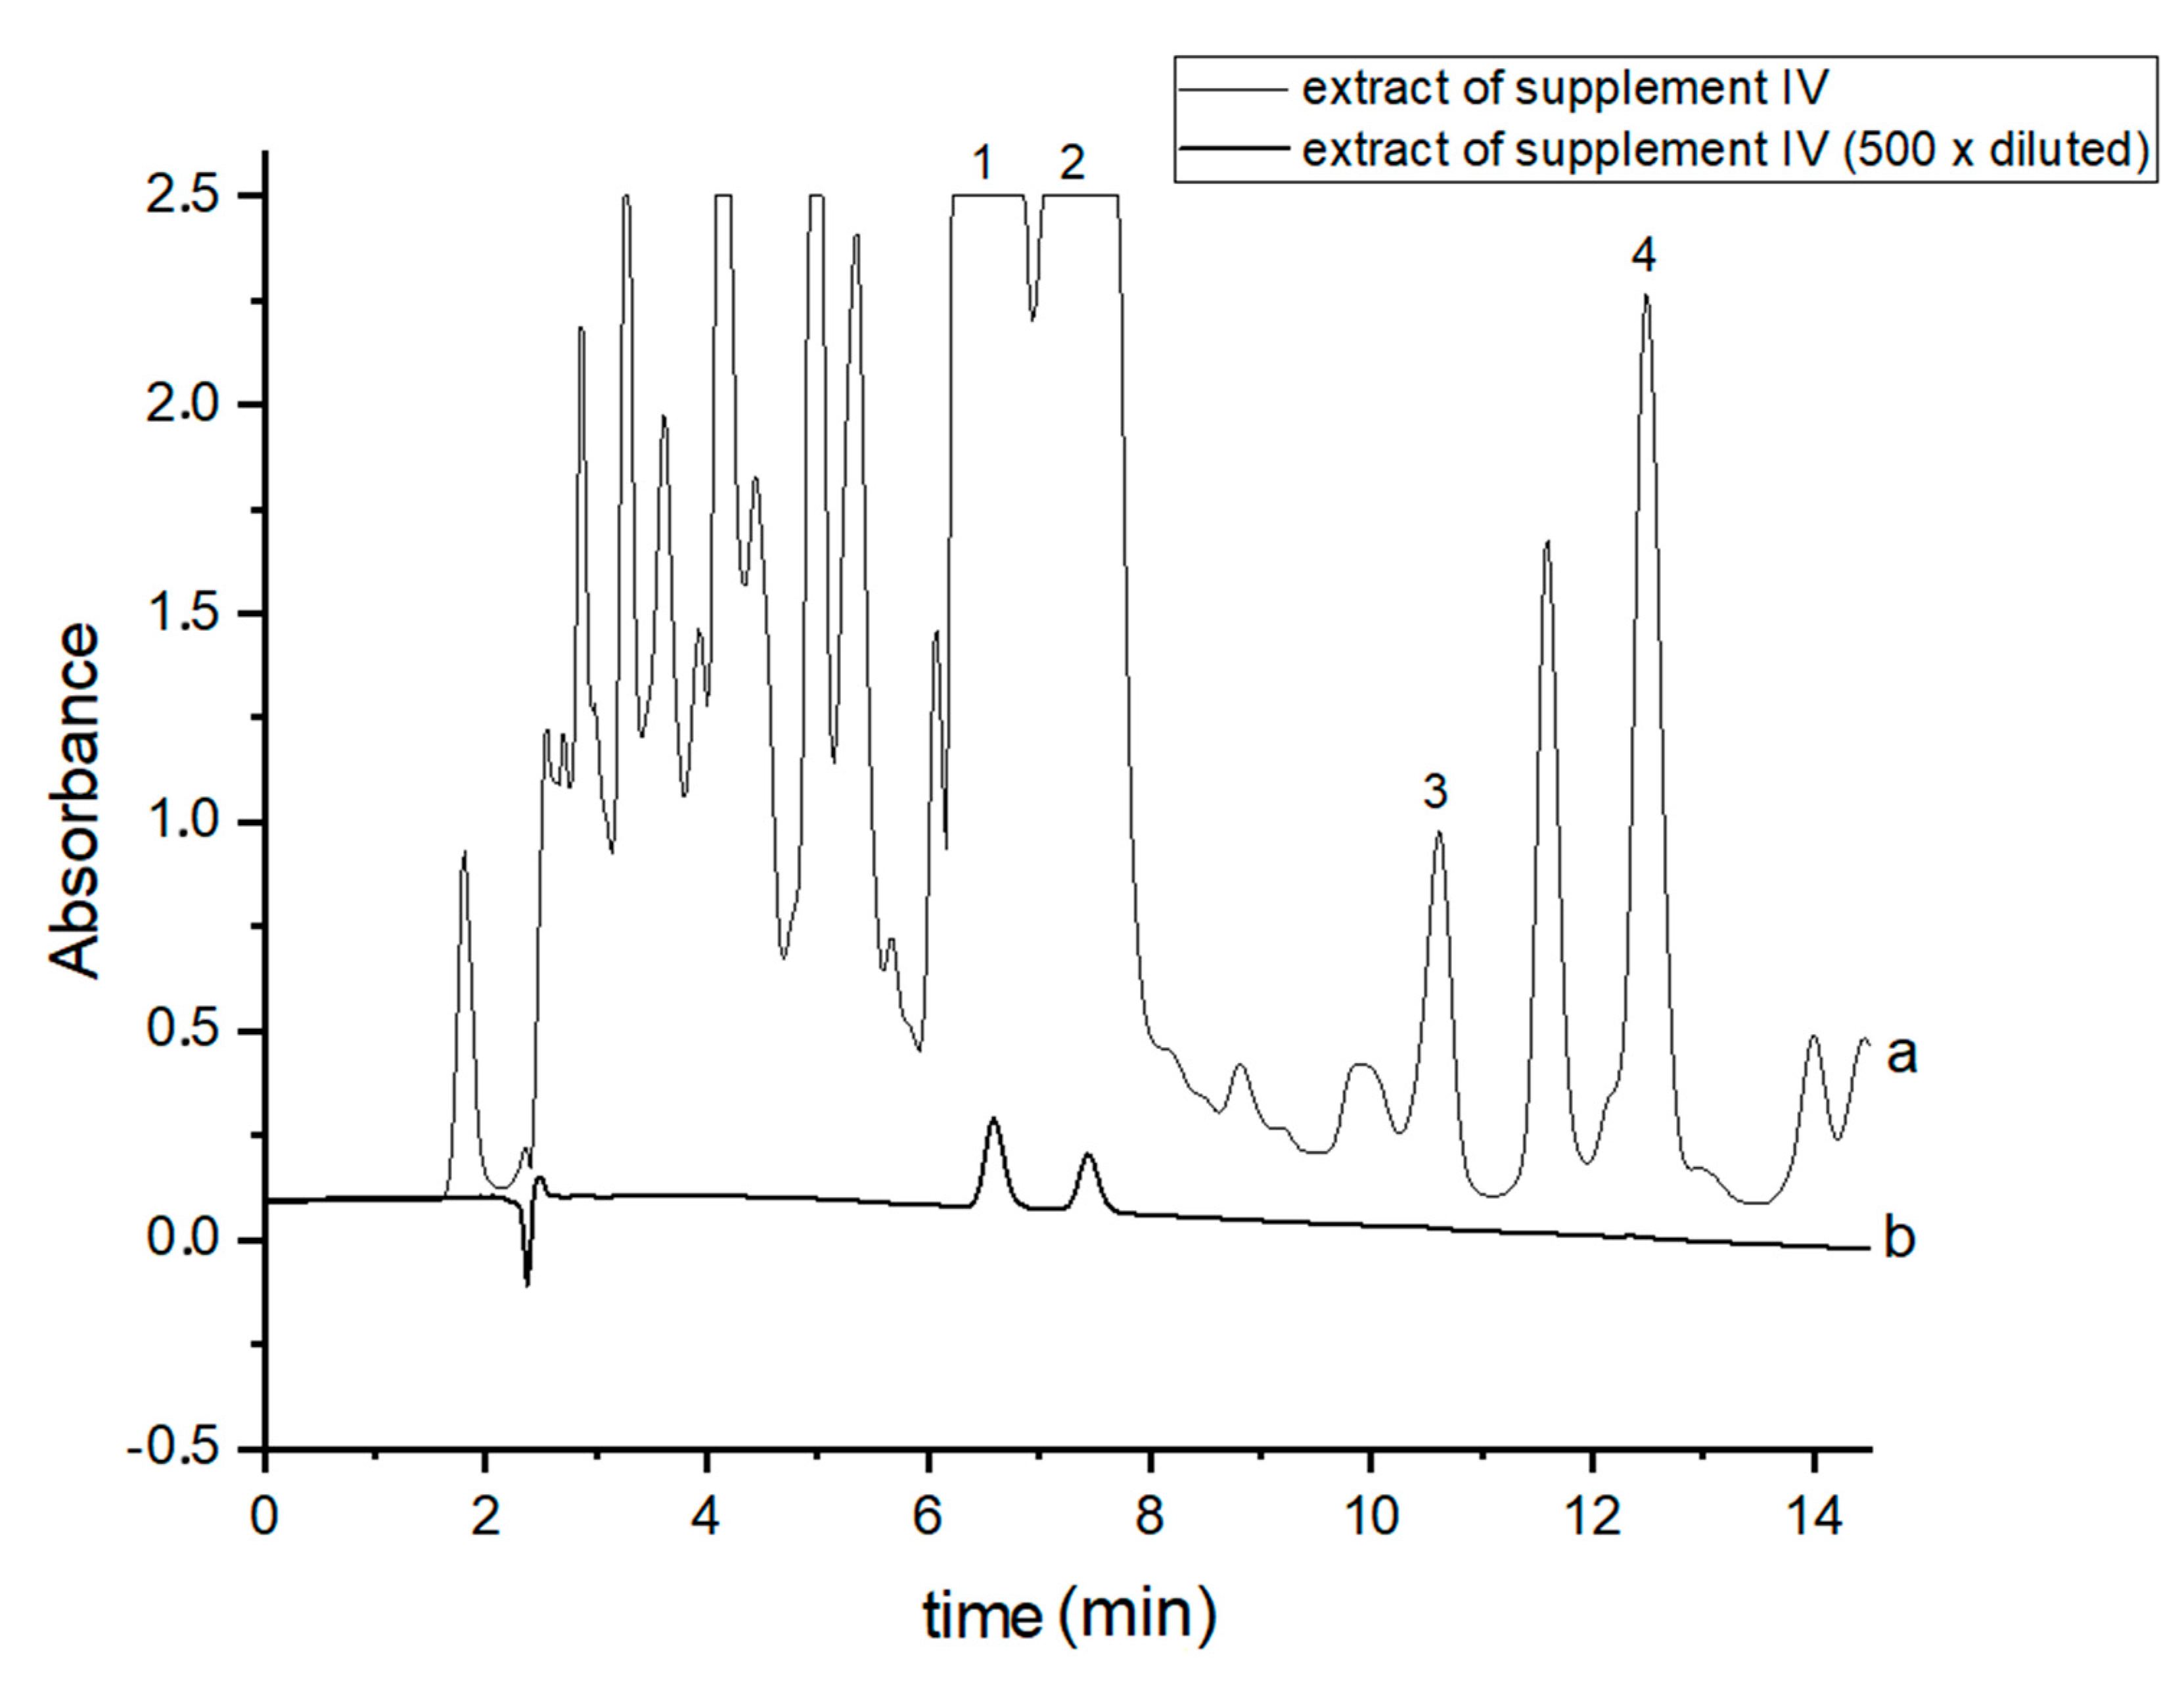
Figure 2.
Chromatograms of the analyzed oil-resin supplement IV- (a) original extract and (b) 500 times diluted extract. The compounds were detected at λ = 220 nm. 1—CBDA, 2—CBD, 3—CBN and 4—Δ9-THC.
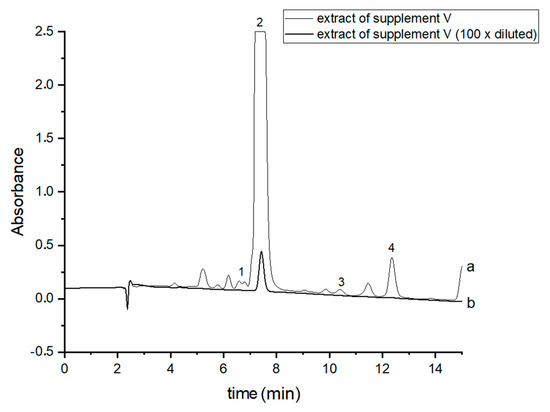
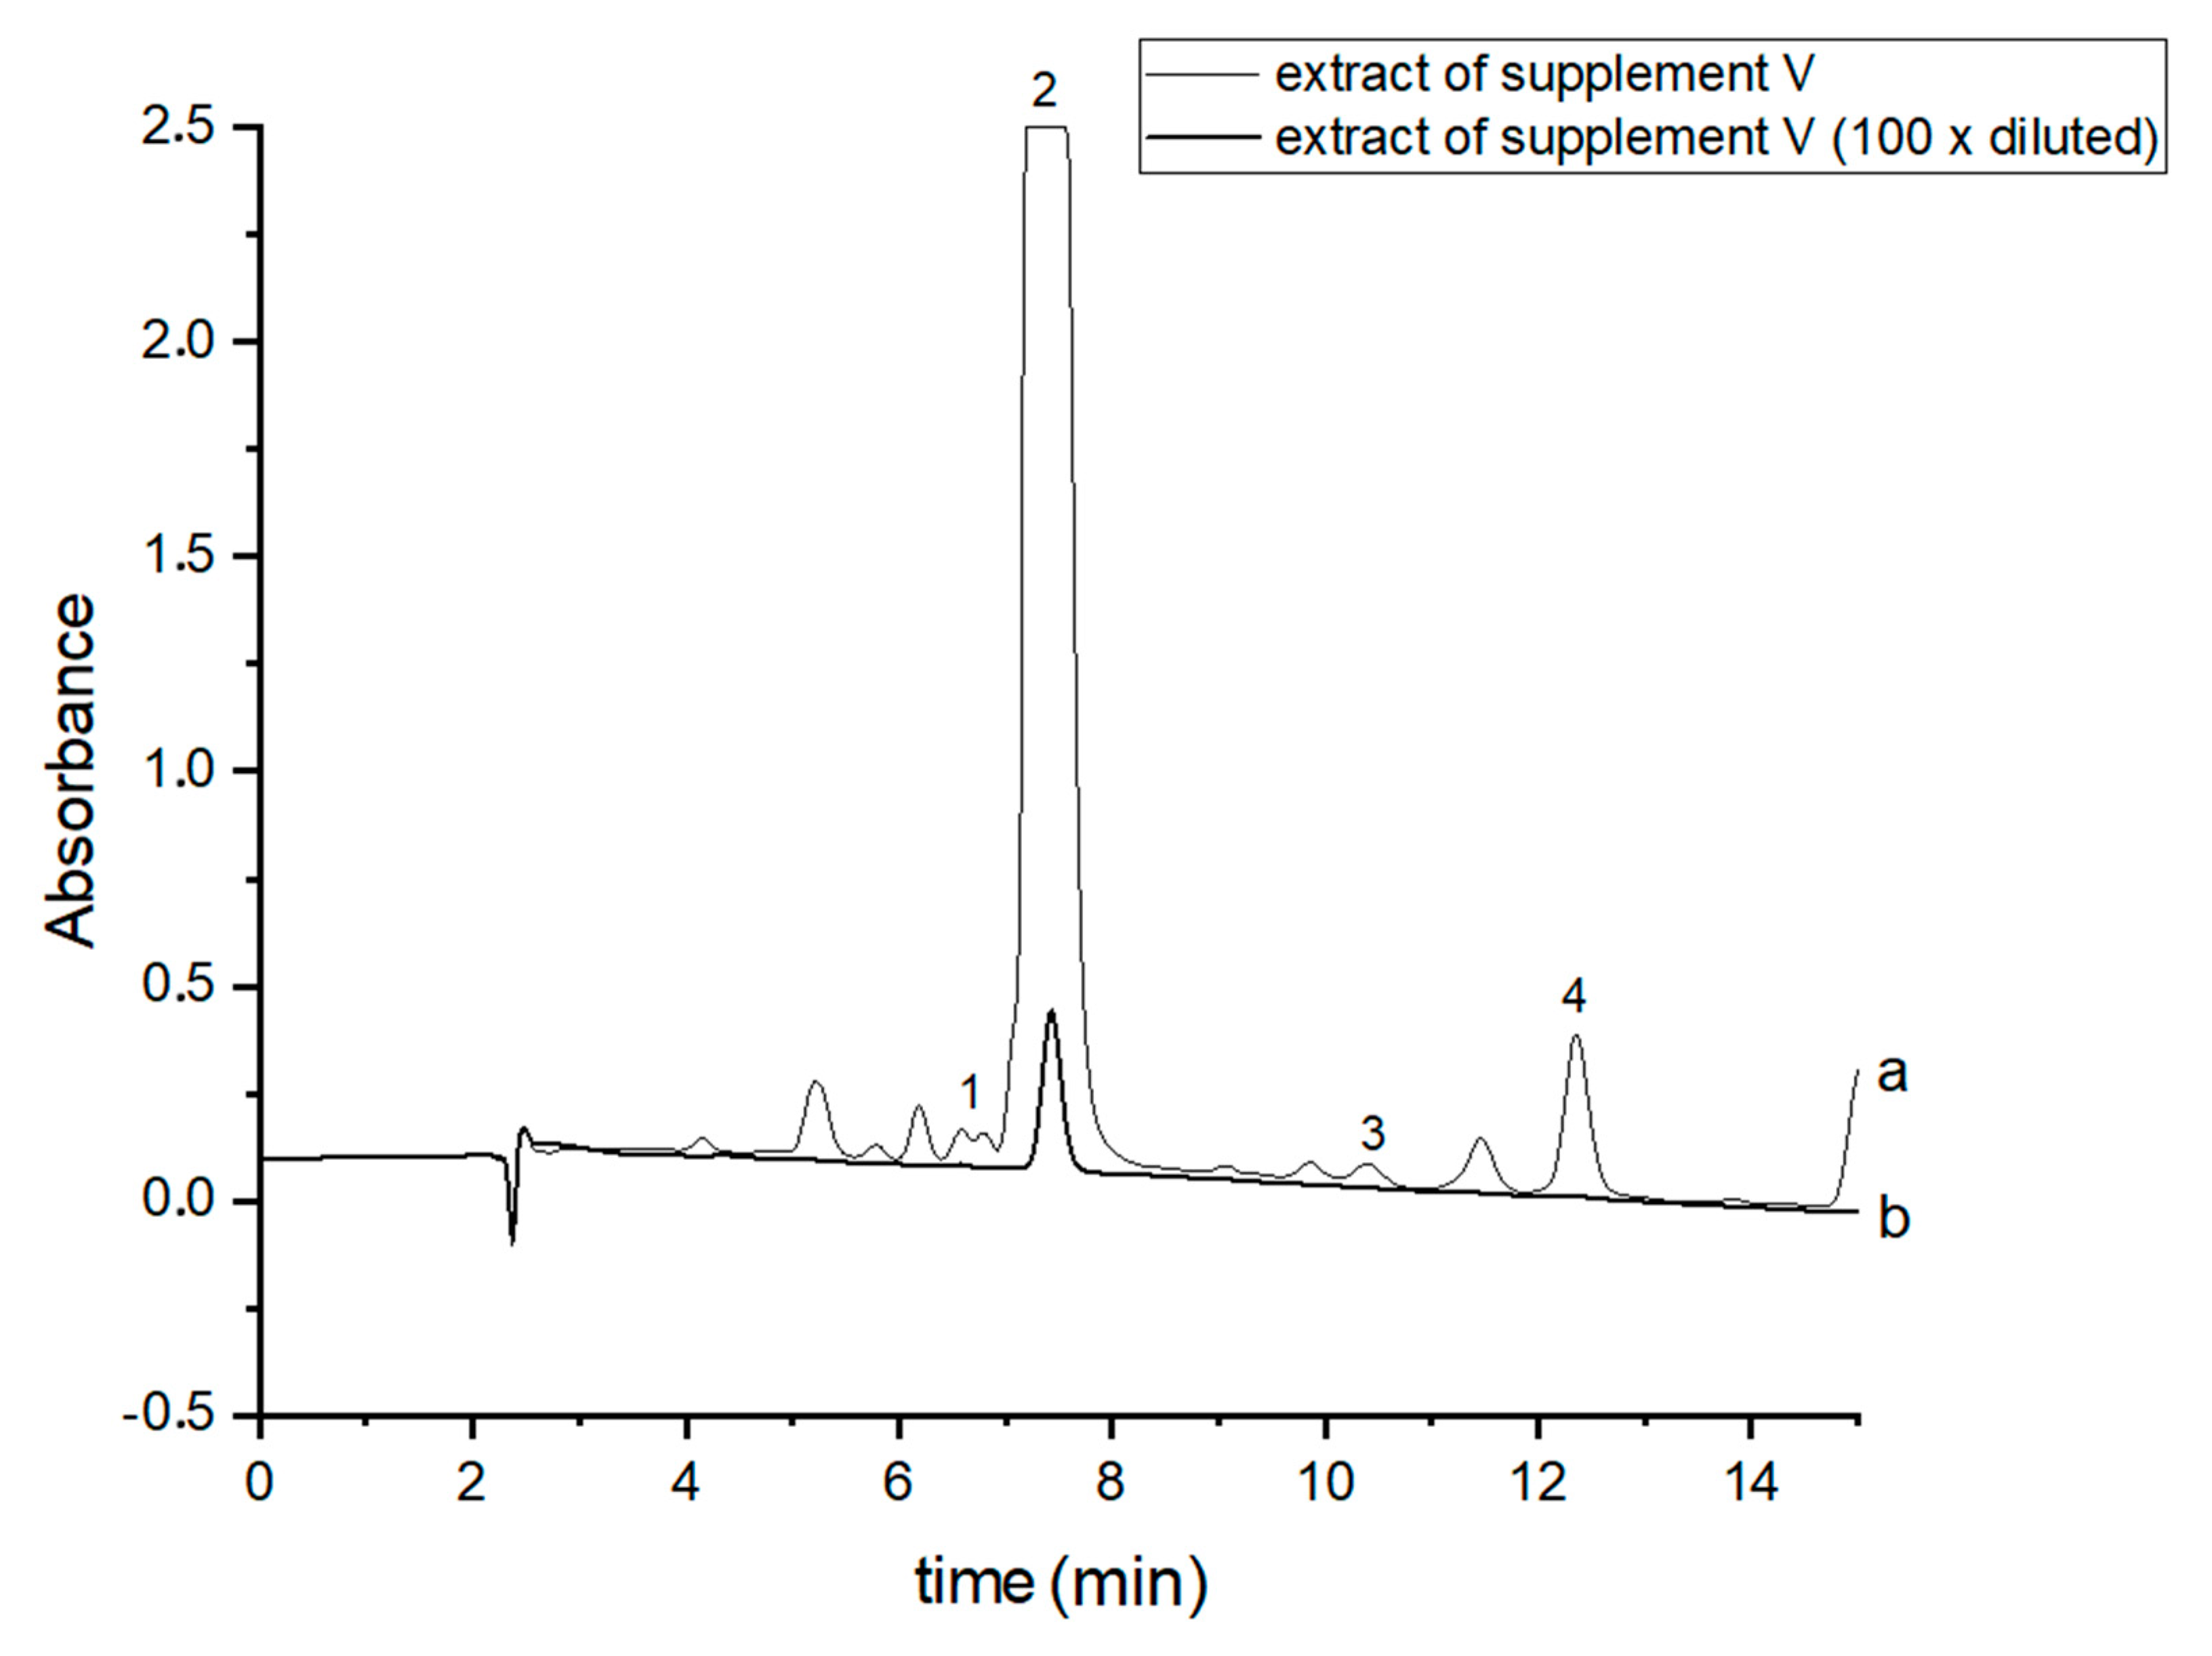
Figure 3.
Chromatograms of the analyzed oil supplement V- (a) original extract and (b) 100 times diluted extract. The compounds were detected at λ = 220 nm. 1—CBDA, 2—CBD, 3—CBN and 4—Δ9-THC.
4. Conclusions
The RP-HPLC-DAD method for the determination of four cannabinoids of therapeutic importance, present in oil matrix, was developed and validated. Main validation parameters of the method were estimated, which indicate that it is appropriate for analysis of these cannabinoids in hemp oil supplements. To our knowledge, it was the first time that an oil sample was prepared for cannabinoids determination using a small amount (0.5 mL) of acetonitrile as the extraction solvent combined with a freezing of fat phase at a low temperature (−41 °C).
The extraction method is green, simple, relatively quick and requires only basic laboratory equipment.
The reliability of the proposed method was confirmed by analysis of seven hemp oil supplements originated from different manufacturers. In several cases, the obtained results are quite different from those declared by producers. Thus, the general conclusion is that in order for the use of hemp supplements to be safe and beneficial for consumers, it is justified to develop appropriate methods and then use them for the determination of cannabinoids in such materials.
The presented method may be potentially useful for monitoring of qualitative and quantitative cannabinoid composition in commercially available hemp oil supplements in the context of the legal requirements for hemp products.
Author Contributions
K.M. and W.P. conceived and designed the experiments; A.C. and K.S. performed the experiments and analyzed the data; K.M. wrote the paper. All authors have read and agreed to the published version of the manuscript.
Funding
This research received no external funding.
Institutional Review Board Statement
Not applicable.
Informed Consent Statement
Not applicable.
Conflicts of Interest
The authors declare no conflict of interest.
References
- Canadian Food Inspection Agency (Canada.ca). The Biology of Cannabis sativa L. (Cannabis, hemp, marijuana). Available online: https://inspection.canada.ca/plant-varieties (accessed on 4 November 2021).
- Hodgson, E. Chapter Fourteen—Toxins and Venoms. Prog. Mol. Biol. Transl. Sci. 2012, 112, 373–415. [Google Scholar]
- Protti, M.; Brighenti, V.; Battaglia, M.R.; Anceschi, L.; Pellati, F.; Mercolini, L. Cannabinoids from Cannabis sativa L.: A New Tool Based on HPLC-DAD-MS/MS for a rational use in medicinal chemistry. ACS Med. Chem. Lett. 2019, 10, 539–544. [Google Scholar] [CrossRef] [PubMed]
- Anderson, L.L.; Low, I.K.; Banister, S.D.; McGregor, I.S.; Arnold, J.C. Pharmacokinetics of phytocannabinoid acids and anticonvulsante of cannabidiolic acid in a mouse model of Dravet Syndrome. J. Nat. Prod. 2019, 82, 3047–3055. [Google Scholar] [CrossRef] [Green Version]
- SwissADME. Available online: http://www.swissadme.ch/index.php (accessed on 4 November 2021).
- United Nations Office on Drugs and Crime. Recommended Methods for the Identification and Analysis of Cannabis and Cannabis Products, Vienna, New York. 2013. Available online: https://www.un-ilibrary.org/content/books/9789210555890 (accessed on 11 October 2021).
- Battista, N.; Di Tommaso, M.; Bari, M.; Maccarone, M. The endocannabinoid system: An overview. Front. Behav. Neurosci. 2012, 6, 9. [Google Scholar] [CrossRef] [PubMed] [Green Version]
- Ehrenkranz, J.; Levine, M.A. Bones and Joints: The effects of cannabinoids on the skeleton. J. Clin. Endocrinol. Metab. 2019, 104, 4683–4694. [Google Scholar] [CrossRef] [PubMed]
- Borowska, M.; Czarnywojtek, A.; Sawicka-Gutaj, N.; Woliński, K.; Płazińska, M.T.; Mikołajczak, P.; Ruchała, M. The effects of cannabinoids on the endocrine system. Endokrynol. Pol. 2018, 69, 705–719. [Google Scholar] [CrossRef] [Green Version]
- Van de Donk, T.; Niesters, M.; Kowal, M.A.; Olofsen, E.; Dahan, A.; Van Velzen, M. An experimental randomized study on the analgesic effects of pharmaceutical-grade cannabis in chronic pain patients with fibromyalgia. Pain 2019, 160, 860–869. [Google Scholar] [CrossRef]
- Ulugöl, A. The Endocannabinoid system as a potential therapeutic target for pain modulation. Balkan Med. J. 2014, 31, 115–120. [Google Scholar] [CrossRef]
- Takeda, S.; Okajima, S.; Miyoshi, H.; Yoshida, K.; Okamoto, Y.; Okada, T.; Amamoto, T.; Watanabe, K.; Omiecinski, C.J.; Aramaki, H. Cannabidiolic acid, a major cannabinoid in fiber-type cannabis, is an inhibitor of MDA-MB-231 breast cancer cell migration. Toxicol. Lett. 2012, 214, 314–319. [Google Scholar] [CrossRef] [Green Version]
- Alexander, A.; Smith, P.F.; Rosengren, R.J. Cannabinoids in the treatment of cancer. Cancer Lett. 2009, 285, 6–12. [Google Scholar] [CrossRef]
- Bolognini, D.; Rock, E.M.; Cluny, N.L.; Cascio, M.G.; Limebeer, C.L.; Duncan, M.; Stott, C.G.; Javid, F.A.; Parker, L.A.; Pertwee, R.G. Cannabidiolic acid prevents vomiting in Suncus murinus and nausea-induced behaviour in rats by enhancing 5-HT1A receptor activation. Br. J. Pharmacol. 2013, 168, 1456–1470. [Google Scholar] [CrossRef] [Green Version]
- Grant, I.; Cahn, B.R. Cannabis and endocannabinoid modulators: Therapeutic promises and challenges. Clin. Neurosci. Res. 2005, 5, 185–199. [Google Scholar] [CrossRef] [Green Version]
- Cairns, E.A.; Baldridge, W.H.; Kelly, M.E. The Endocannabinoid system as a therapeutic target in glaucoma. Neural Plast. 2016, 2016. [Google Scholar] [CrossRef] [PubMed] [Green Version]
- Holgado, M.A.; Martín-Banderas, L.; Álvarez-Fuentes, J.; Fernández-Arévalo, M. Neuroprotective effect of cannabinoids nanoplatforms in neurodegenerative diseases. J. Drug Deliv. Sci. Technol. 2017, 42, 84–93. [Google Scholar] [CrossRef]
- Maurya, N.; Kumur Velmurugan, B. Therapeutic applications of cannabinoids. Chem. Biol. Inter. 2018, 293, 77–88. [Google Scholar] [CrossRef] [PubMed]
- Millar, S.A.; Stone, N.L.; Yates, A.S.; O’Sullivan, S.E. A systematic review on the pharmacokinetics of cannabidiol in humans. Front. Pharmacol. 2018, 9, 1365. [Google Scholar] [CrossRef]
- McRae, G.; Melanson, J.E. Quantitative determination and validation of 17 cannabinoids in cannabis and hemp using liquid chromatography–tandem mass spectrometry. Anal. Bioanal. Chem. 2020, 412, 7381–7393. [Google Scholar] [CrossRef] [PubMed]
- Lee, J.H.; Min, A.Y.; Han, J.H.; Yang, Y.J.; Kim, H.; Shin, D. Development and validation of LC-MS/MS method with QuEChERS clean-up for detecting cannabinoids in foods and dietary supplements. Food Add. Contamin. Part. A 2020, 37, 1413–1424. [Google Scholar] [CrossRef]
- Cardenia, V.; Toschi, T.G.; Scappini, S.; Rubino, S.C.; Rodriguez-Estrada, M.T. Development and validation of a Fast gas chromatography/mass spectrometry method for the determination of cannabinoids in Cannabis Sativa L. J. Food Drug Anal. 2018, 26, 1283–1292. [Google Scholar] [CrossRef] [PubMed]
- Zekiĉ, J.; Križman, M. Development of Gas-Chromatographic Method for Simultaneous Determination of Cannabinoids and Terpenes in Hemp. Molecules 2020, 25, 5872. [Google Scholar] [CrossRef]
- Ciolino, L.A.; Ranieri, T.L.; Taylor, A.M. Commercial cannabis consumer products part 2: HPLC-DAD quantitative analysis of cannabis cannabinoids. Forensic. Sci. Int. 2018, 289, 438–447. [Google Scholar] [CrossRef]
- Mudge, E.M.; Murch, S.J.; Brown, P.N. Leaner and greener analysis of cannabinoids. Anal. Bioanal. Chem. 2017, 409, 3153–3163. [Google Scholar] [CrossRef] [Green Version]
- Tzimas, P.S.; Petrakis, E.A.; Halabalaki, M.; Skaltsounis, L.A. Effective determination of the principal non-psychoactive cannabinoids in fiber-type Cannabis sativa L. by UPLC-PDA following comprehensive design and optimization of extraction methodology. Anal. Chim. Acta 2021, 1150, 338200. [Google Scholar] [CrossRef]
- Szabady, B.; Hidwégi, E.; Nyiredy, S.Z. Determination of Neutral Cannabinoids in Hemp Samples by Overpressured-Layer Chromatography. Chromatographia 2002, 56, 165–168. [Google Scholar] [CrossRef]
- Barthlott, I.; Scharinger, C.H.; Golombek, P.; Kuballa, T.; Lachenmeier, D.W. A Quantitative 1 H NMR Method for Screening of Cannabinoids in CBD Oils. Toxics 2021, 9, 136. [Google Scholar] [CrossRef] [PubMed]
- Patel, B.; Wene, D.; Fan, Z.T. Qualitative and quantitative measurement of cannabinoids in cannabis using modified HPLC/DAD method. J. Pharmaceut. Biomed. Anal. 2017, 146, 15–23. [Google Scholar] [CrossRef]
- Ilias, Y.; Rudaz, S.; Mathieu, P.; Christen, P.; Veuthe, J.-C. Extraction and analysis of different Cannabis samples by headspace solid-phase microextraction combined with gas chromatography-mass spectrometry. J. Sep. Sci. 2005, 28, 2293–2300. [Google Scholar] [CrossRef] [PubMed]
- Drinić, Z.; Vladić, J.; Koren, A.; Zeremski, T.; Stojanov, N.; Kiprovski, B.; Vidović, S. Microwave-assisted extraction of cannabinoids and antioxidants from Cannabis sativa aerial parts and process modeling. J. Chem. Technol. Biotechnol. 2020, 95, 831–839. [Google Scholar] [CrossRef]
- Elkins, A.C.; Deseo, M.A.; Rochfort, S.; Ezernieks, V.; Spangenberg, G. Development of a validated method for the qualitative and quantitative analysis of cannabinoids in plant biomass and medicinal cannabis resin extracts obtained by super-critical fluid extraction. J. Chromatogr. B Anal. Technol. Biomed. Life Sci. 2019, 1109, 76–83. [Google Scholar] [CrossRef]
- Nemeškalováa, A.; Hájkováa, K.; Mikulůb, L.; Sýkoraa, D.; Kuchařb, M. Combination of UV and MS/MS detection for the LC analysis of cannabidiol-rich products. Talanta 2020, 219, 121250. [Google Scholar] [CrossRef]
- Deville, M.; Dubois, N.; Denooz, R.; Charlier, C. Validation of an UHPLC/DAD method for the determination of cannabinoids in seized materials: Analysis of 213 samples sold in Belgian CBD shops. Forensic. Sci. Int. 2020, 310, 110234. [Google Scholar] [CrossRef] [PubMed]
- Pellegrini, M.; Marchei, E.; Pacifici, R.; Pichin, S. A rapid and simple procedure for the determination of cannabinoids in hemp food products by gas chromatography-mass spectrometry. J. Pharm. Biomed. Anal. 2005, 36, 939–946. [Google Scholar] [CrossRef]
- Citti, C.; Pacchetti, B.; Vandelli, M.A.; Forni, F.; Cannazza, G. Analysis of cannabinoids in commercial hemp seed oil and decarboxylation kinetics studies of cannabidiolic acid (CBDA). J. Pharm. Biomed. Anal. 2018, 149, 532–540. [Google Scholar] [CrossRef] [PubMed]
- Madej, K.; Kózka, G.; Winiarski, M.; Piekoszewski, W. A simple, fast, and green oil sample preparation method for determination of cannabidioloic acid and cannabidiol by HPLC-DAD. Separations 2020, 7, 60. [Google Scholar] [CrossRef]
- Deidda, R.; Avohou, H.T.; Baronti, R.; Davolio, P.R.; Pasquini, B.; Del Bubba, M.; Hubert, C.; Hubert, P.; Orlandini, S.; Furlanetto, S. Analytical quality by design: Development and control strategy for a LC method to evaluate the cannabinoids content in cannabis olive oil extracts. J. Pharm. Biomed. Anal. 2019, 166, 326–335. [Google Scholar] [CrossRef]
Publisher’s Note: MDPI stays neutral with regard to jurisdictional claims in published maps and institutional affiliations. |
© 2021 by the authors. Licensee MDPI, Basel, Switzerland. This article is an open access article distributed under the terms and conditions of the Creative Commons Attribution (CC BY) license (https://creativecommons.org/licenses/by/4.0/).