Article

Alternative Method for HDL and Exosome Isolation with Small Serum Volumes and Their Characterizations

by
Rian Ka Praja
1,2,
Wisitsak Phoksawat
3,4,
Patcharaporn Tippayawat
2,5,
Amonrat Jumnainsong
2,6 and
Chanvit Leelayuwat
2,6,*
1
Biomedical Sciences Program, Graduate School, Khon Kaen University, Khon Kaen 40002, Thailand
2
The Centre for Research and Development of Medical Diagnostic Laboratories (CMDL), Faculty of Associated Medical Sciences, Khon Kaen University, Khon Kaen 40002, Thailand
3
Department of Microbiology, Faculty of Medicine and Graduate School, Khon Kaen University, Khon Kaen 40002, Thailand
4
Research and Diagnostic Center for Emerging Infectious Diseases (RCEID), Khon Kaen University, Khon Kaen 40002, Thailand
5
Department of Clinical Microbiology, Faculty of Associated Medical Sciences, Khon Kaen University, Khon Kaen 40002, Thailand
6
Department of Clinical Immunology and Transfusion Sciences, Faculty of Associated Medical Sciences, Khon Kaen University, Khon Kaen 40002, Thailand
*
Author to whom correspondence should be addressed.
Separations 2021, 8(11), 204; https://doi.org/10.3390/separations8110204
Submission received: 16 September 2021 / Revised: 20 October 2021 / Accepted: 29 October 2021 / Published: 3 November 2021
(This article belongs to the Special Issue Fractionation and Sample Preparation Techniques Used in Bioanalyses)

Abstract

:
High-density lipoprotein (HDL) and exosomes are promising sources of biomarkers. However, the limited sample volume and access to the ultracentrifuge equipment are still an issue during HDL and exosome isolation. This study aimed to isolate HDL and exosomes using an ultracentrifugation-free method with various small serum volumes. HDL was isolated from 200 µL (HDL200) and 500 µL (HDL500) of sera. Three different volumes: 50 µL (Exo50), 100 µL (Exo100), and 250 µL (Exo250) were used for exosome isolation. HDL and exosomes were isolated using commercial kits with the modified method and characterized by multiple approaches. The HDL levels of HDL200 and HDL500 were not significantly different (p > 0.05), with percent recoveries of >90%. HDL200 and HDL500 had the same protein pattern with a biochemical similarity of 99.60 ± 0.10%. The particle sizes of Exo50, Exo100, and Exo250 were in the expected range. All isolated exosomes exhibited a similar protein pattern with a biochemical similarity of >99%. In conclusion, two different serum volumes (200 and 500 µL) and three different serum volumes (50, 100, and 250 µL) can be employed for HDL and exosome isolation, respectively. The possibility of HDL and exosome isolation with small volumes will accelerate biomarker discoveries with various molecular diagnostic approaches.

Graphical Abstract

1. Introduction

The essential key player of the molecular diagnosis of diseases is mainly supported by a variety of biomarkers [1]. Body fluids are still a significant primary source of biomarkers for noninvasive clinical diagnostic needs [2,3]. Body fluid-derived soluble biomarkers possess much information, as they provide significant evidence related to the health status [4]. Therefore, the exploration of body fluids, especially serum, for molecular research and diagnostics is getting rising attention. Additionally, the success of laboratory diagnoses require a correct source, good quality, and enough volume of the specimen.
High-density lipoprotein (HDL) particles are complex molecules that transport not only lipids but also other components (proteins, hormones, and vitamins, as well as microRNAs (miRNAs)) to target tissues and cells [5]. The use of proteomic studies on HDL particles has identified 85 proteins associated with lipid metabolism and transport, hemostasis, immune response, metal binding, and vitamin transport [6]. HDL have been determined to carry several miRNAs, such as miR-223, miR-126, and miR-92a [7]. MicroRNA-223 plays a crucial role in controlling multiple genes related to lipoprotein and cholesterol metabolism [8]. Vickers et al. (2011) discovered that the HDL miRNA profile of healthy people was significantly different from that of people with familial hypercholesterolemia [9]. Wagner et al. (2013) also observed that the absolute copy numbers of miR-30c, miR-92a, and miR-146 in HDL isolated from patients with acute coronary syndrome were significantly different from those in healthy people [7]. Therefore, changes in HDL components are clearly related to the health status.
Exosomes are nano-sized spherical extracellular vesicles (EVs) with a lipid bilayer membrane released after the fusion of multivesicular bodies (MVBs) with the plasma membrane [10]. Exosomes are generated by several cell types and present in a variety of biofluids [11], urine [12,13], saliva [14,15], cerebrospinal fluid [16], human semen [17], breast milk [18], and synovial fluid [19]. Exosomes contain a significant amount of proteomic content, as well as lipids and a genetic cargo [10,20]. Nowadays, there is an increasing interest in using exosomes in clinical research and settings as a biomarker source of diseases, since exosomes work as reporters of biochemical changes that occur in many diseases, such as cancer [21], neurological [22], or immunological conditions [23]. Due to biosignatures linked to the pathogenesis of diseases, exosomes have been gaining much attention as a potential biomarker source for molecular diagnoses.
A plethora of the above-explained evidence has shown that HDL and exosomes can be used as biomarker sources. Nowadays, the most widely used method for HDL and exosome isolation is the ultracentrifugation method [24,25,26,27,28]. This approach has several drawbacks, including a long duration of the procedure, being labor-intensive, and high equipment costs that limit its application in research and clinical needs [24,27,29,30]. In addition, several publications showed that the isolation of HDL and exosomes requires a large sample volume [24,31,32]. Thus, the limited sample amount and access to the ultracentrifuge device sometimes become major problems for the research and clinical needs. In this study, therefore, we demonstrated an ultracentrifugation-free method to isolate the HDL and exosome from serum samples with a variety of small volumes, as well as their characterizations.

2. Materials and Methods

2.1. Materials

The HDL purification kit (cat no. STA, 607) was from Cell Biolabs, Inc., San Diego, CA, USA. The ExoQuick™ Exosome Precipitation Solution (cat no. EXOQ5A-1) was from System Biosciences, Palo Alto, CA, USA. The Pierce™ BCA protein assay kit (cat no. 23225) was purchased from Thermo Scientific, Waltham, MA, USA. The primary antibodies, human ApoA-1 antibody (cat no. MAB 36641-SP) and human TSG101 antibody (cat no. orb337267), were supplied by R&D System, Inc., Minneapolis, MN, USA and Biorbyt, Cambridge, Cambridgeshire, UK, respectively. The secondary antibody, rabbit IgG horseradish peroxidase (HRP)-conjugated antibody (cat no. HAF008), was obtained from R&D System, Inc., Minneapolis, MN, USA. The chromatein pre-stained protein ladder (cat no. PR0602) and whole blue range pre-stained protein ladder (cat no. PR0623) were purchased from Vivantis Technologies, Shah Alam, Selangor Darul Ehsan, Malaysia. The enhanced luminol-based chemiluminescent (ECL) Western blotting reagent (cat no. RPN2232) was a product from GE Healthcare, Chalfont St Giles, Buckinghamshire, UK. The other chemicals and reagents with high purity and quality were purchased from commercial suppliers.

2.2. Samples

Leftover serum samples were used in this study. Serum samples were obtained from the AMS Excellence Laboratory, Faculty of Associated Medical Sciences (AMS), Khon Kaen University (KKU). All serum samples were aliquoted and kept at −80 °C until use. This study was approved by the Ethics Committee of Khon Kaen University (HE 631335).

2.3. HDL Isolation

A HDL purification kit (Cell Biolabs, Inc., San Diego, CA, USA, cat no. STA, 607) was used for HDL isolation with a modified method. In this study, HDL was isolated from two different serum volumes: 200 µL (HDL200) and 500 µL (HDL500). Briefly, to 200 and 500 µL of the serum on ice, 1 and 2.5 µL of dextran solution and 10 and 25 µL of precipitation solution A were added, respectively, and then incubated 5 min on ice. The samples were centrifuged at 6000× g for 10 min at 4 °C, and the supernatant was transferred to a new tube. Twelve and thirty microliters of dextran solution and 30 and 75 µL of precipitation solution A were added to HDL200 and HDL500, respectively, and incubated for 2 h at room temperature. Then, the samples were centrifuged 18,000× g for 30 min at 4 °C. The supernatant was discarded, and a pellet of HDL200 and HDL500 was resuspended in 100 and 250 µL of HDL resuspension buffer, respectively, and mixed thoroughly by pipetting up and down, then centrifuged at 6000× g for 10 min at 4 °C. The supernatant was discarded and the collected pellet of HDL200 and HDL500 was resuspended in 120 and 300 µL of 1× HDL wash solution and shaken for 30 min at 4 °C followed by centrifugation at 6000× g for 10 min at 4 °C. The supernatant was transferred to a new sterile tube. Eighteen and forty-five microliters of dextran removal solution were added to HDL200 and HDL500 and mixed thoroughly by pipetting up and down, then incubated for 1 h at 4 °C. Then, the samples were centrifuged again at 6000× g for 10 min at 4 °C. Finally, the supernatant (containing purified HDL) was transferred to a new tube. The HDL levels in the serum samples and isolated HDLs were measured by a Beckman Coulter DxC 800 Chemistry Analyzer (Beckman Coulter, Brea, CA, USA).

2.4. Exosome Isolation

The exosomes were isolated from different serum volumes—namely, 50 µL (Exo50), 100 µL (Exo100), and 250 µL (Exo250)—by using the ExoQuick™ Exosome Precipitation Solution (System Biosciences, Palo Alto, CA, USA, cat no. EXOQ5A-1) by following the kit instructions, with some modifications. Briefly, the samples were centrifuged at 3000× g for 15 min to remove the cells and cell debris. Then, the supernatant was transferred to a sterile tube, and 12.6, 25.2, and 63 µL of ExoQuick™ Exosome Precipitation Solution were added to 50, 100, and 250 µL of a serum sample, respectively, and mixed well by inverting or flicking the tube and refrigerated for 30 min. The mixture of ExoQuick™ and serum was centrifuged at 1500× g for 30 min. After centrifugation, the supernatant was aspirated, and residual ExoQuick™ solution was centrifuged at 1500× g for 5 min and aspirated. The exosome pellet was resuspended in sterile 1× phosphate-buffered saline (PBS). The protein concentration of each sample was then measured by the Pierce™ BCA Protein Assay Kit (Thermo Scientific, Waltham, MA, USA, cat no. 23225).

2.5. Sodium Dodecyl Sulphate-Polyacrylamide Gel Electrophoresis (SDS-PAGE) and Western Blot

SDS-PAGE was used to obtain protein profile patterns of the HDL and exosomes. Briefly, 3 µg and 30 µg of HDL and exosome protein, respectively, were used for SDS-PAGE. The samples were mixed with 2× loading buffer containing dithiothreitol (DTT) and heated at 99 °C for 5 min. SDS-PAGE was done with 12.5% gel, and electrophoresis was run at 150 volts for 2 h. Then, gel staining was performed using 0.25% Coomassie blue G250 staining.
The presence of exosome and HDL biomarkers was tested by the Western blot technique. Apolipoprotein A1 (ApoA-1) and tumor susceptibility 101 protein (TSG101) were selected as the HDL and exosome biomarkers, respectively. Briefly, protein extraction was prepared by adding an equal amount of sample and radioimmunoprecipitation assay (RIPA) buffer. Small amounts (0.3 µg and 30 µg) of HDL and exosome protein were loaded, respectively. A loading buffer with DTT was added and heated at 99 °C for 5 min, then separated in 12.5% SDS-PAGE and transferred to a polyvinylidene fluoride (PVDF) membrane. The membranes were blocked using 5% skim milk in 1× tris-buffered saline with 0.5% tween 20 (TBS-T) at room temperature for 1 h. The primary antibodies, human ApoA-1 antibody (1:5000) (R&D System, Inc., Minneapolis, MN, USA, cat no. MAB 36641-SP) and human TSG101 antibody (1:1500) (Biorbyt, Cambridge, Cambridgeshire, UK, cat no. orb337267), were added and incubated at 4 °C overnight. Then, the membranes were washed three times using 1× TBS-T. The secondary antibody, rabbit IgG horseradish peroxidase (HRP)-conjugated antibody (1:1000) (R&D System, Inc., Minneapolis, MN, USA, cat no. HAF008), was added and incubated at room temperature for 1 h, then washed three times with 1× TBS-T. The protein band was detected using the enhanced luminol-based chemiluminescent (ECL) Western blotting reagent (GE Healthcare, UK, Chalfont St Giles, Buckinghamshire, cat no. RPN2232).

2.6. Exosome Size Analysis

A particle size analysis of the exosomes was done with the dynamic light scattering (DLS) technique. Briefly, the exosome samples were diluted at 1:2000 in 1× PBS, then vortexed for 1 min. The particle sizes were analyzed with Malvern Zetasizer Nano S90 (Malvern Panalytical Ltd., Malvern, Worcestershire, UK).

2.7. FTIR Spectral Acquisition

Deionized (DI) water, followed by methanol, was used to clean the attenuated total reflectance (ATR) crystal. Measurement of the background was done by scanning the diamond ATR surface. Samples of 3 µL in volume were deposited on the ATR surface and dried by a hair drier at room temperature. The FTIR spectra of the samples were recorded in the range of 4000–650 cm−1, with 64 scans and a spectral resolution of 4 cm−1, using Agilent 4500 FTIR spectroscopy (Agilent Technologies, Santa Clara, CA, USA).

2.8. Principal Component Analysis (PCA)

To observe the clustering data among the isolated HDLs and exosomes, a principal component analysis (PCA) was employed. A full spectral range (4000–650 cm−1) consisting of a lipid, protein, carbohydrate, and nucleic acid region was selected. The spectral data were analyzed by using The Unscrambler software version 10.4 (Camo Software, Oslo, Norway). The second derivative spectra of the HDL and exosomes were generated using the Savitsky Golay algorithm with 9 smoothing points and 3 polynomial orders, followed by the single normal variance (SNV) transformation to normalize the spectra. Then, a PCA was performed on the normalized FTIR spectra using a whole region (4000–650 cm−1). Score plots were used to visualize any clustering of data.

2.9. Quick Compare Analysis

A Quick Compare analysis was done to calculate the percentage of similarity of the biochemical contents. Raw spectra in the range 4000–650 cm−1 of isolated HDL and exosomes were used and analyzed with OPUS 8.2.8 software (Bruker, Billerica, MA, USA). For this analysis, the threshold of similarity was set to 95%. Samples with similarities of more than 95% were considered to have similar biochemical contents.

2.10. Statistical Analysis

All data collected in this study were tested for normal distribution by the Shapiro–Wilk test. All data obtained from HDL and exosome isolation were normally distributed. Thus, an independent sample t-test was used for the HDL data, and a one-way ANOVA with Tukey’s test was used for the exosome data. p-values < 0.05 were considered statistically significant. The data were represented by the mean ± standard error of the mean (SEM).

3. Results

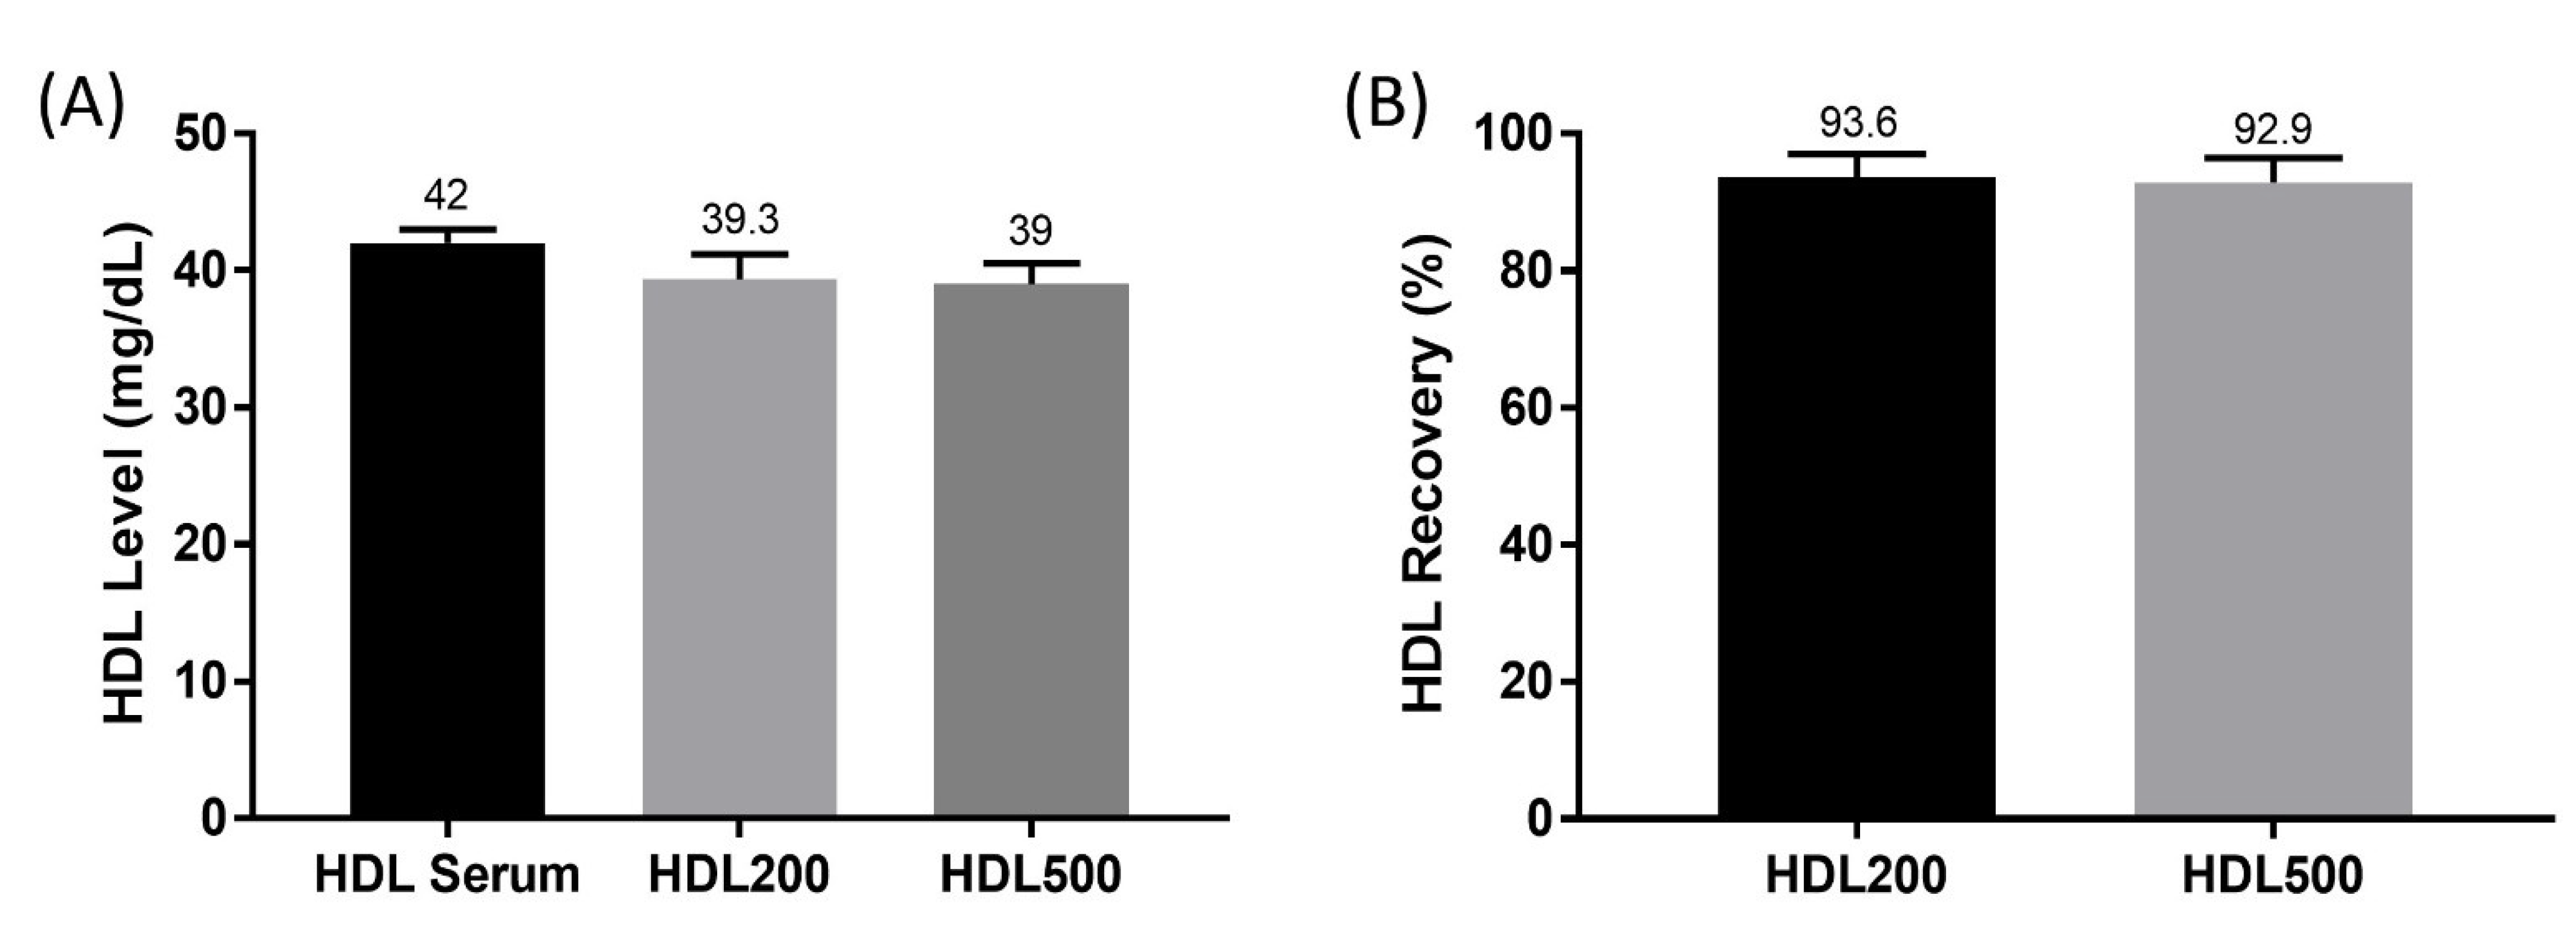
3.1. HDL Level and Percent Recovery

In this experiment, we demonstrated HDL isolation with small sample volumes. HDL was isolated from different volumes of serum samples (200 and 500 µL) using a HDL isolation kit (Cell Biolabs, Inc., San Diego, CA, USA). The HDL levels of serum samples, HDL200, and HDL500 were 42 ± 1.00, 39.3 ± 1.86, and 39 ± 1.53 mg/dL, respectively (Figure 1A). There were no statistically significant differences in the HDL levels between the HDLs isolated from 200 and 500 µL. Furthermore, the percent recovery of the isolated HDL200 and HDL500 was also calculated (Figure 1B). Interestingly, the percent recovery calculation showed that 93.6% and 92.9% of HDL were isolated from 200 and 500 µL of serum, and the statistical analysis revealed no significant difference of the percent recovery between HDL200 and HDL500 (p > 0.05).

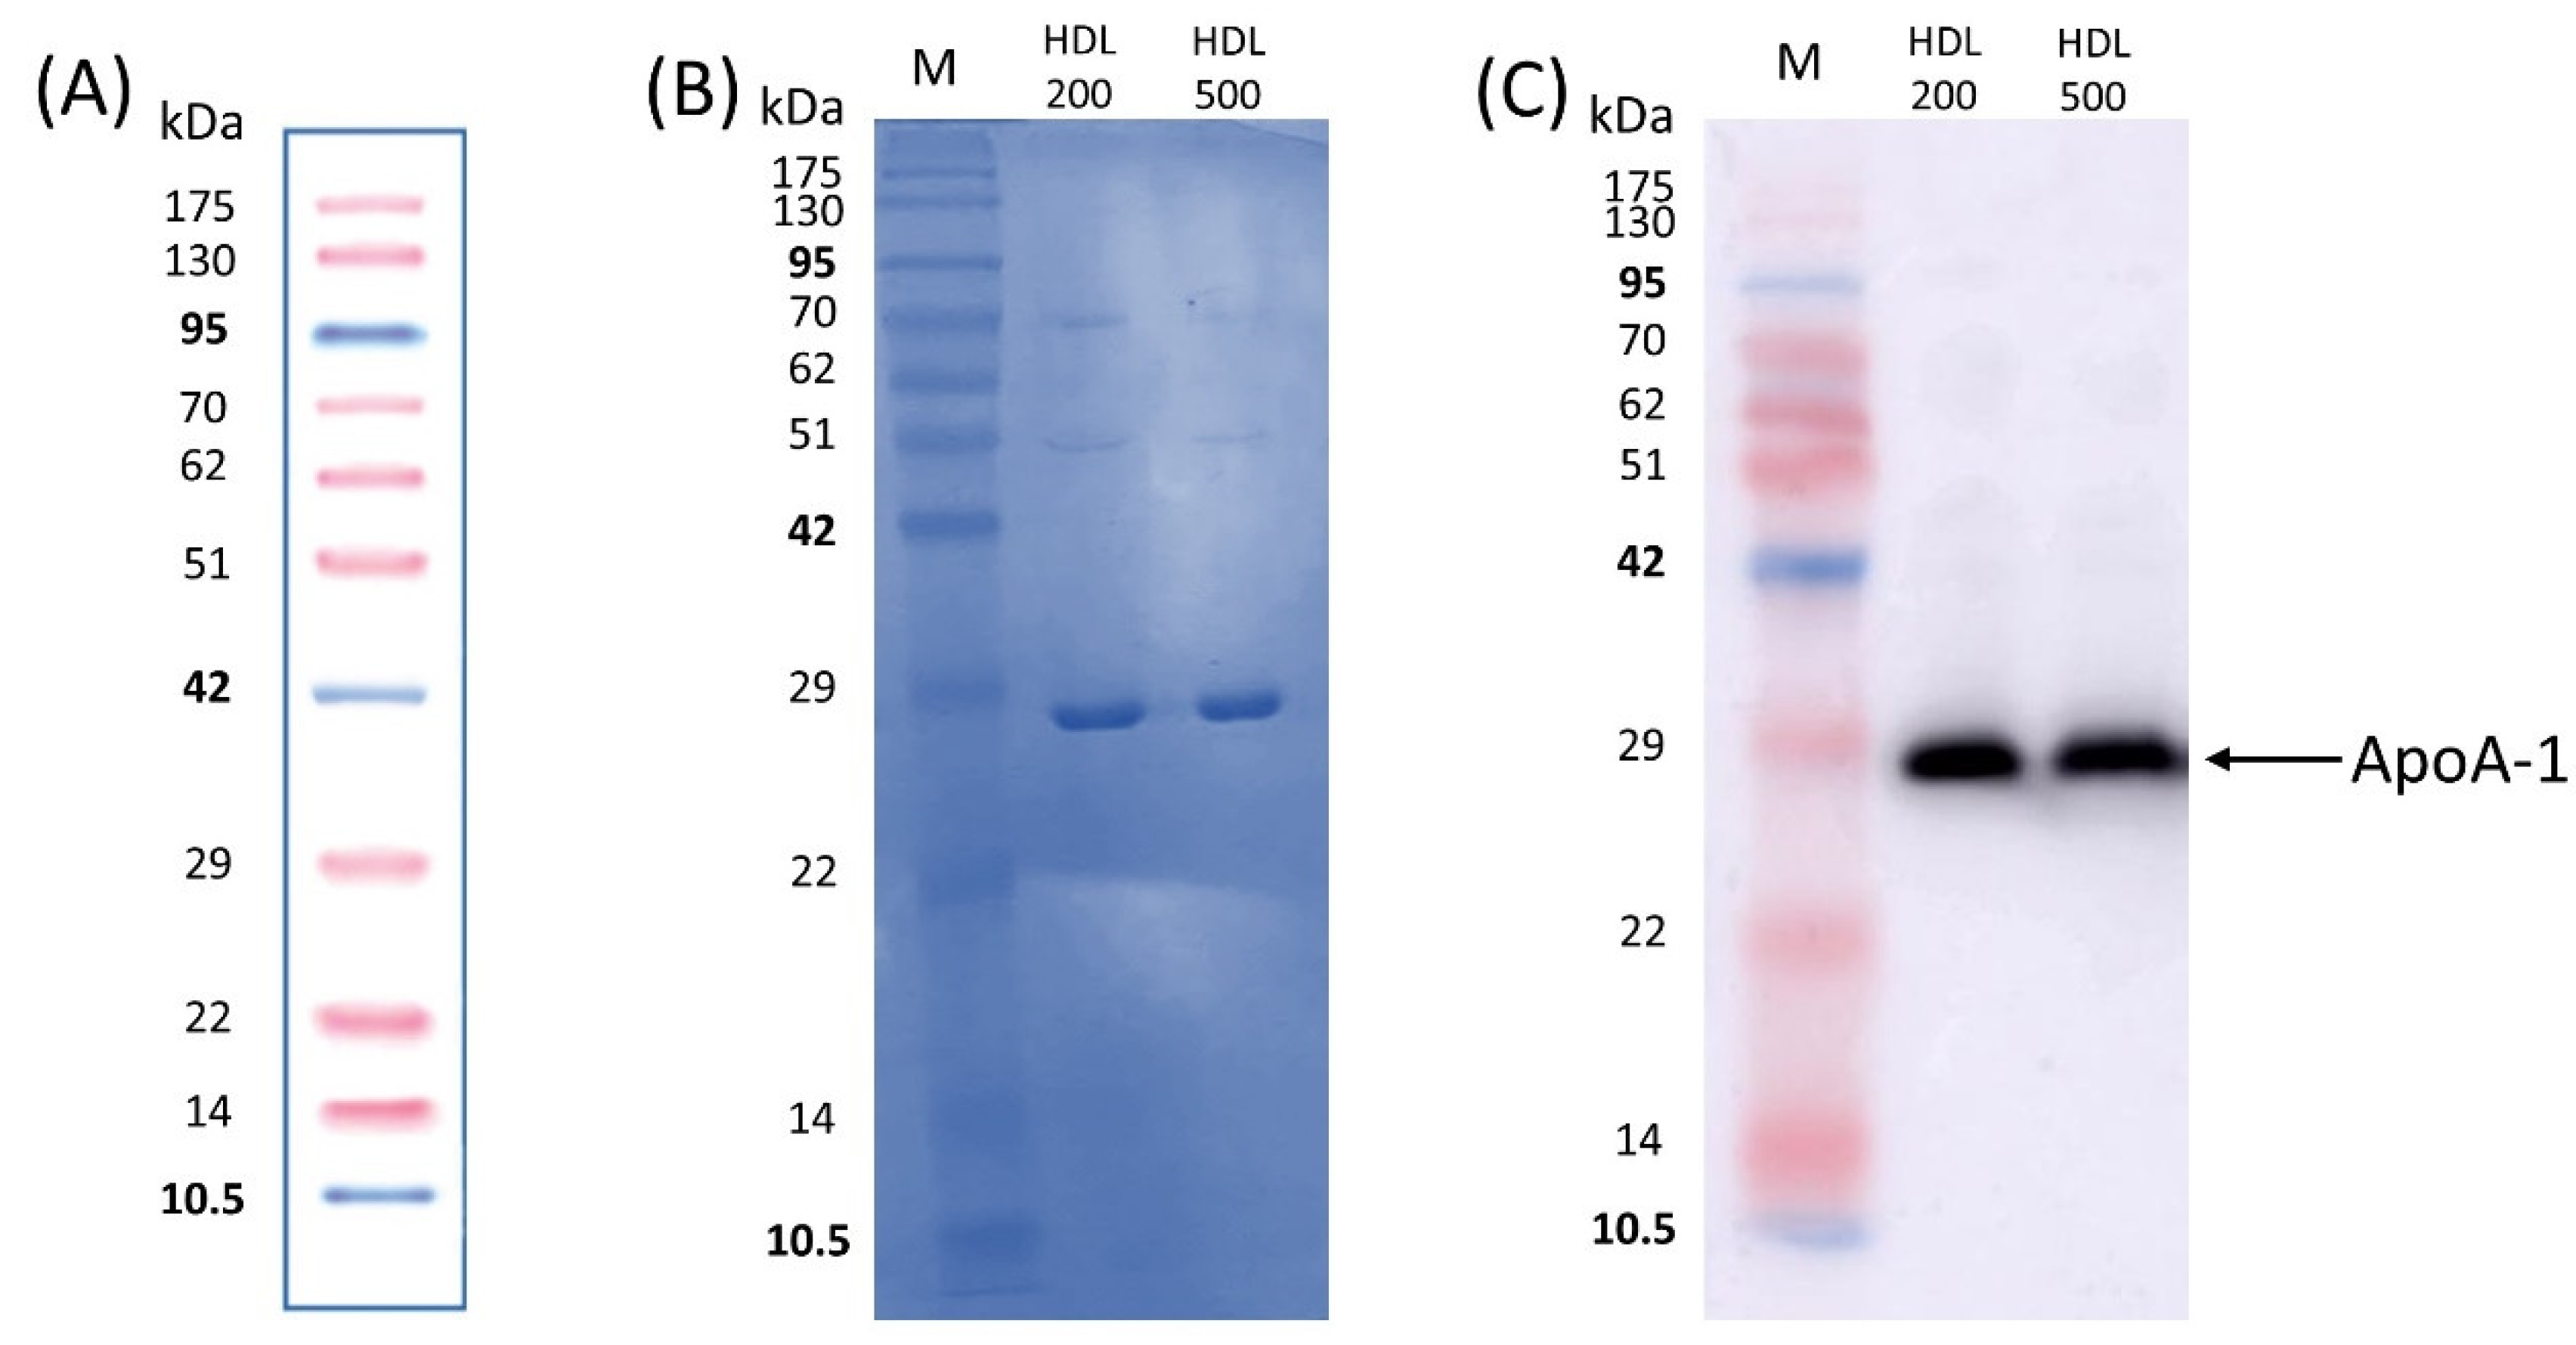
3.2. Protein Study of Isolated HDL

Before the Western blot analysis, SDS-PAGE was done using 3 µg of samples loaded to the gel. This technique was performed to analyze the protein separation pattern between HDL200 and HDL500. The gel was stained using 0.25% Coomassie blue G250. The molecular weight marker used had a range from 10.5 to 175 kDa (Figure 2A). SDS-PAGE showed that HDL200 and HDL500 had the same protein pattern. There were three bands identified by the SDS-PAGE results (approximately at 29, 51, and 70 kDa) (Figure 2B). Furthermore, to ensure the success of HDL isolation, ApoA-1 was selected as the HDL biomarker and detected using Western blotting. For the Western blot analysis, 0.3 µg of each HDL protein was used and loaded. The PVDF membrane was incubated with ApoA-1 antibody, followed by the secondary rabbit anti-human IgG-HRP antibody. The specific band for ApoA-1 was approximately at 25–30 kDa. In this study, a single band was found in HDL200 and HDL500. The band position of ApoA-1 was about 29 kDa (Figure 2C).

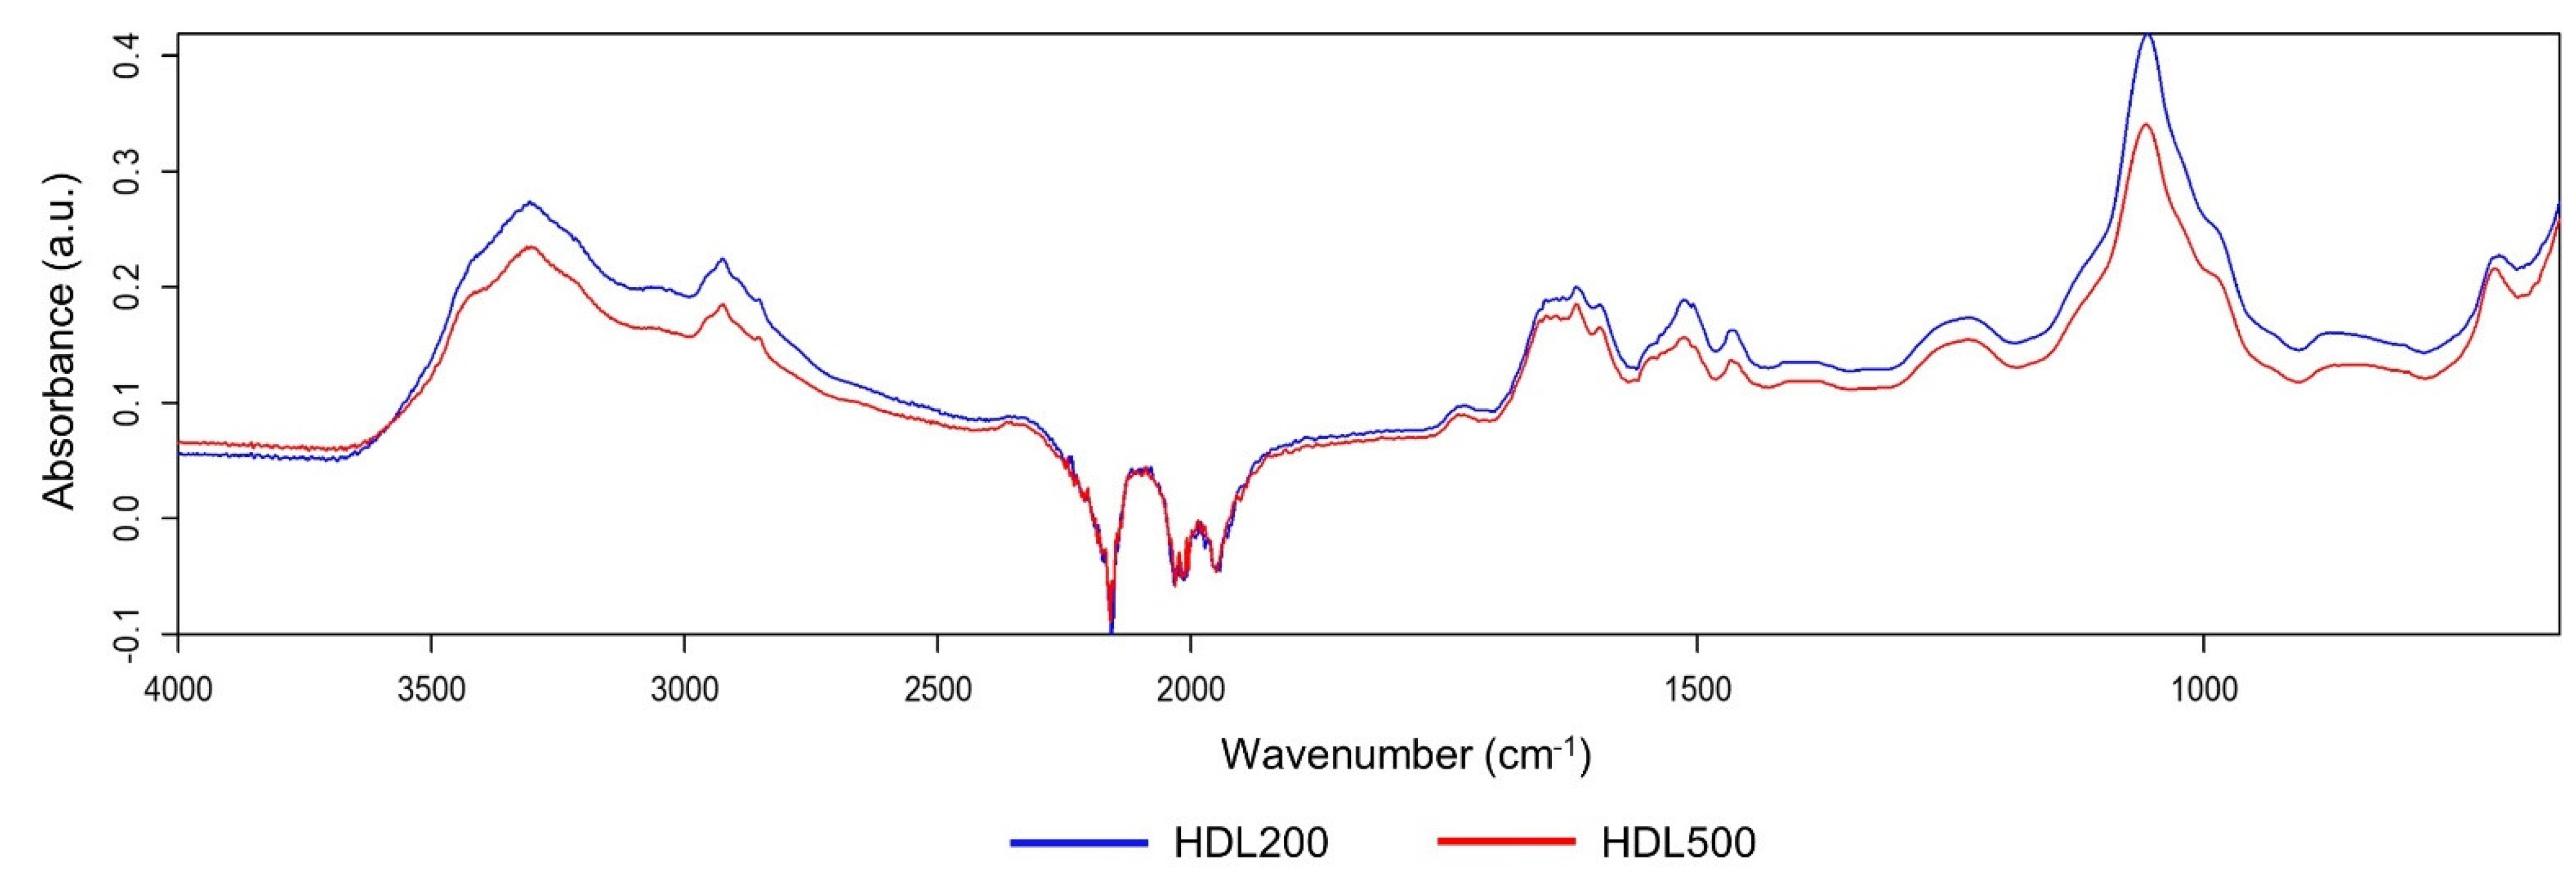
3.3. HDL Similarity Study by Principal Component Analysis (PCA) and Quick Compare Analysis

A principal component analysis (PCA) was conducted in the whole wavenumber (4000–650 cm−1) of the FTIR spectra to confirm the similarity of the HDLs isolated from different volumes. The results of the PCA generated three clusters from three different serum samples, and each cluster consisted of HDL200 and HDL500. Furthermore, HDL200 and HDL500 that were isolated from the same source of serum were clustered in the same cluster. HDL200 and HDL500 isolated from serum sample 1 were clustered between PC-1-positive and PC-2-negative, while the HDLs from serum sample 2 were between PC-1-positive and PC-2-positive. The cluster of serum sample 3 was separated from the clusters of samples 1 and 2, along with PC-1 (Figure 3). This result demonstrated that HDL200 and HDL500 isolated from the same sample source were very similar, because they were clustered based on the sample source.
A FTIR Quick Compare analysis was done with OPUS 8.2.28 software to analyze the similarity of the biochemical components between HDL200 and HDL500. The similarity threshold was set at 95%. In this study, the biochemical similarity between HDL200 and HDL500 was 99.60 ± 0.10%. According to the FTIR Quick Compare analysis, it indicated that the biomolecular components between HDL200 and HDL500 were not different, as they had a similarity of more than 95% (Figure 4).

3.4. Exosome Size Analysis and Protein Concentration

For exosome isolation, three different volumes of serum samples (50, 100, and 250 µL) were used. The exosomes were isolated using ExoQuick™ (System Biosciences, Palo Alto, CA, USA). To ensure that we isolated specific particles with the expected size, a nanoparticle size analysis was done using Malvern Zetasizer Nano S90 (Malvern, Worcestershire, UK). All isolated exosomes from different volumes of samples showed the expected size (Figure 5A). The modes of the particle sizes of Exo50, Exo100, and Exo250 were 160.57 ± 14.65, 148.13 ± 17.58, and 152.33 ± 11.21 nm, respectively. Furthermore, the statistical analysis, one-way ANOVA, revealed no significant differences among the different exosomes isolated with various volumes (Figure 5B). After isolating the exosome, the protein concentration of each different condition was measured using the bicinchoninic acid (BCA) assay (Figure 5C). All isolated exosomes had a mean protein concentration about 10 µg/µL. In addition, the statistical analysis indicated that there were no significant differences in protein concentrations from the exosomes isolated with different serum volumes (p > 0.05).

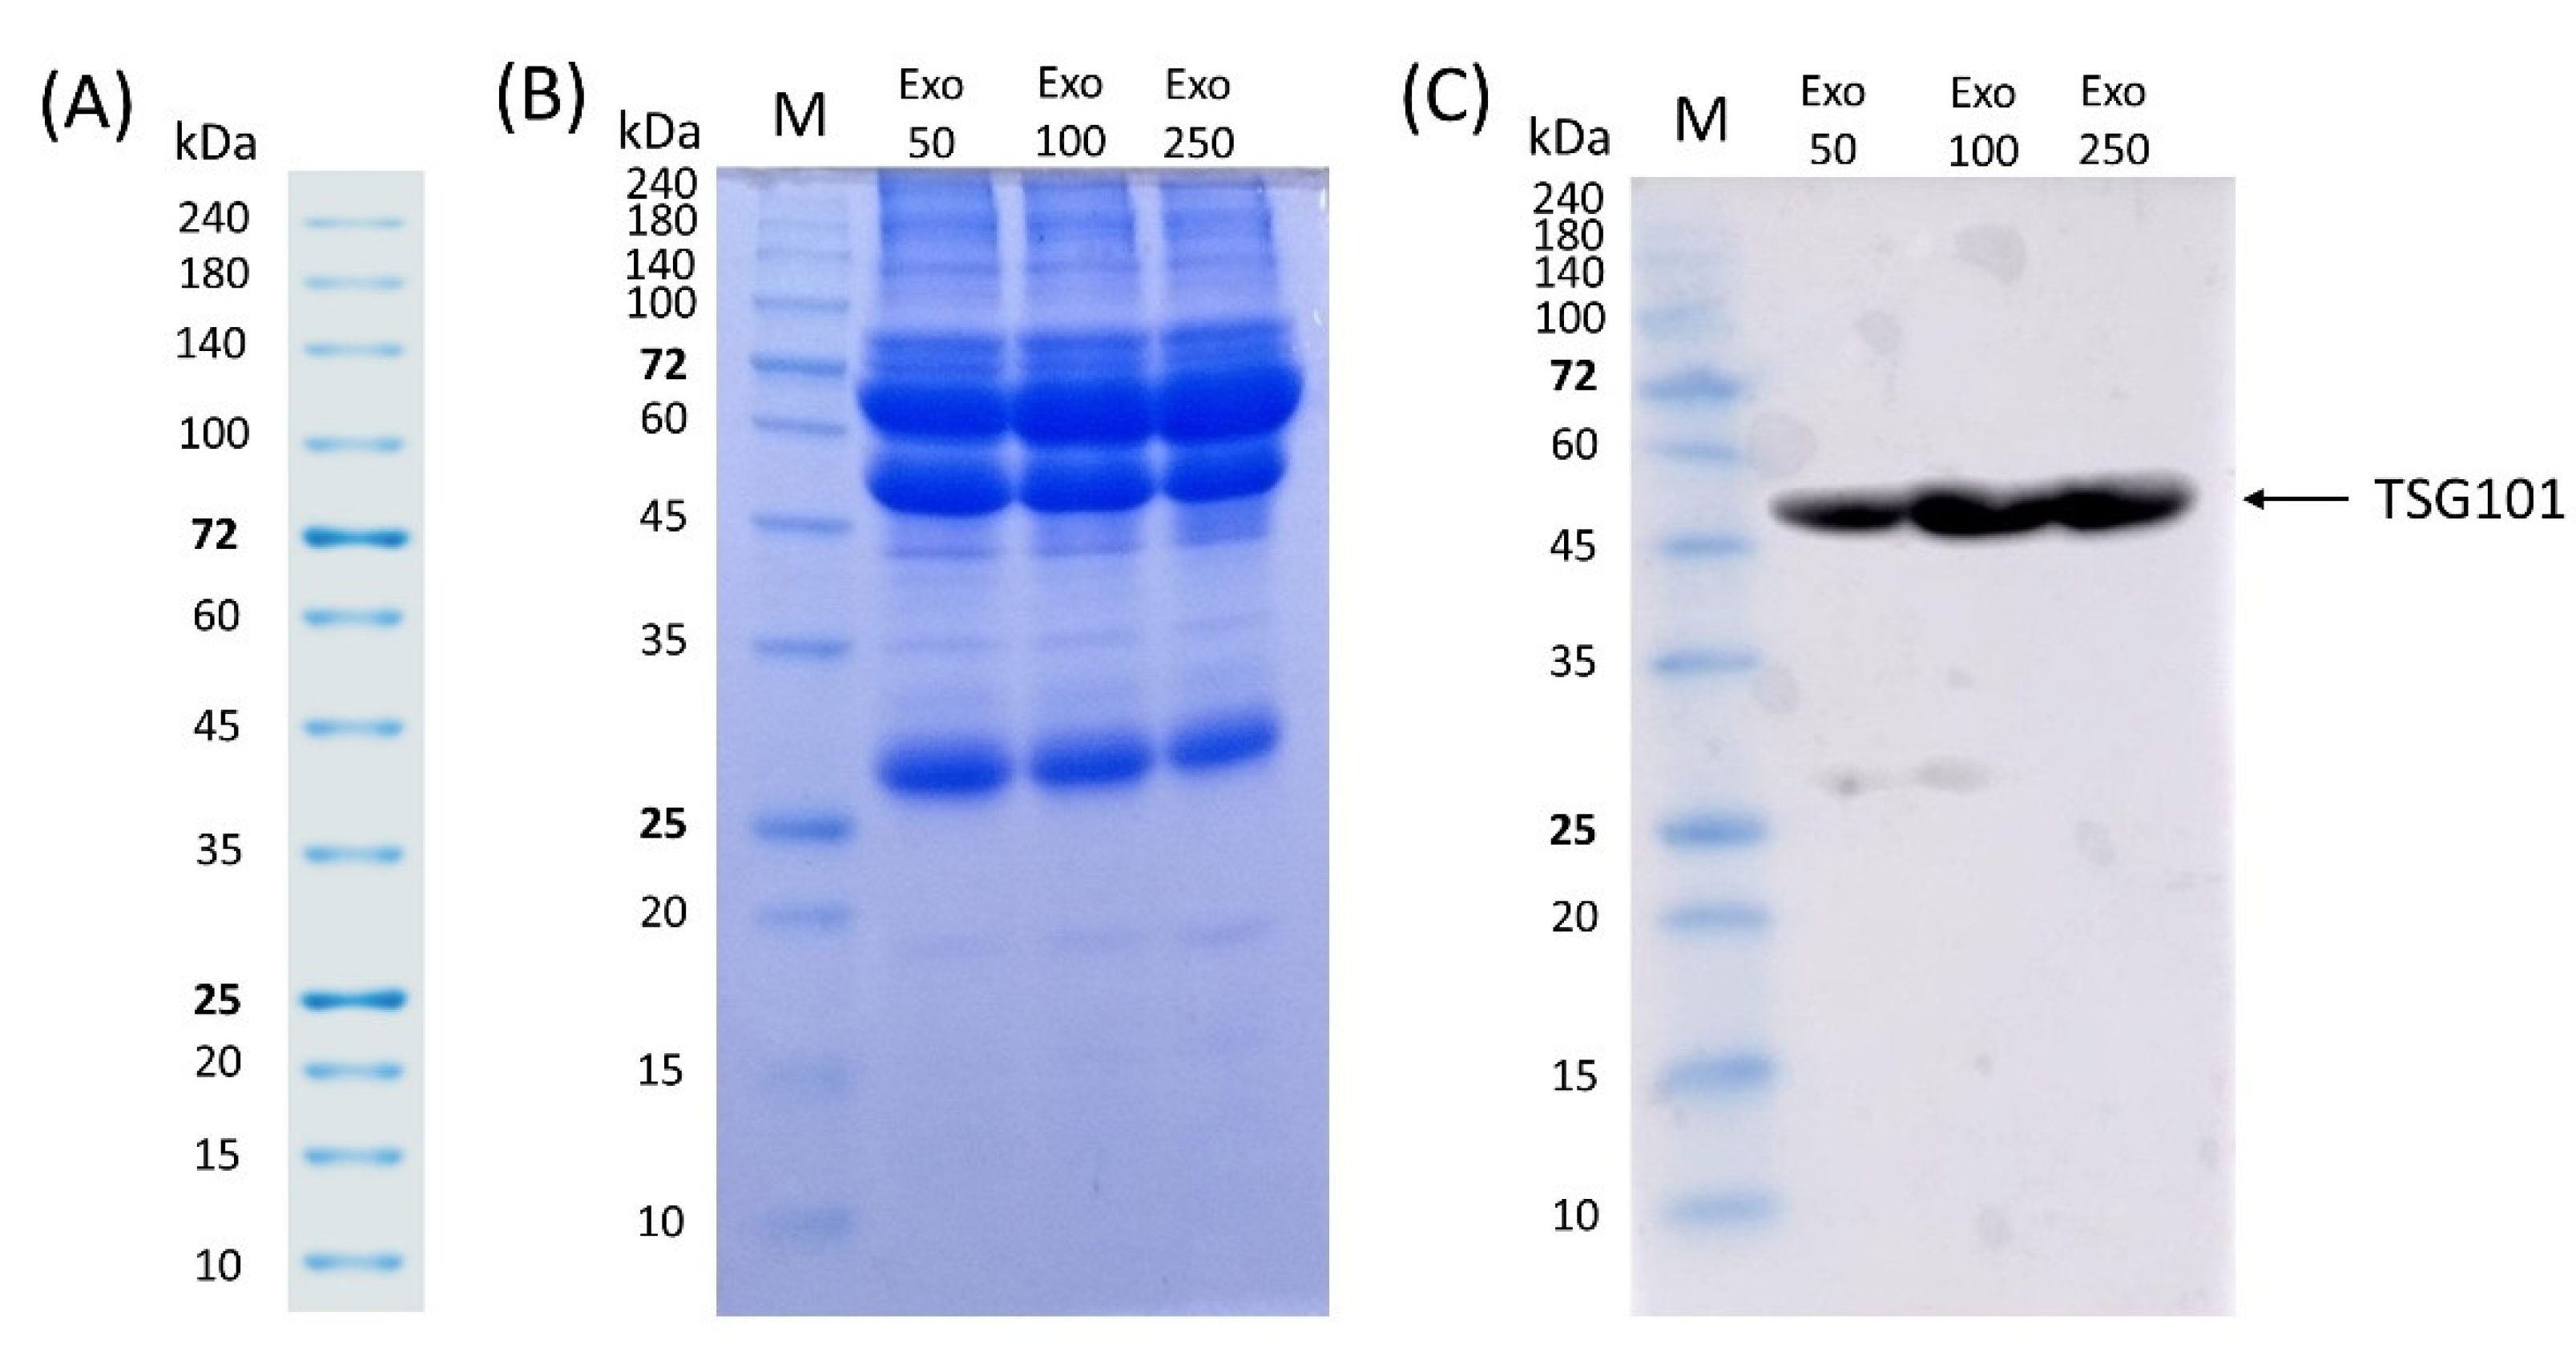
3.5. SDS-PAGE and Western Blot of Exosomes

To ensure the success of exosome isolation, TSG101 was used as an exosome biomarker and detected using Western blotting. Before the Western blot analysis, SDS-PAGE was done using 30 µg of samples loaded onto the gel. This technique was used to analyze the protein patterns among exosomes isolated from 50, 100, and 250 µL. The gel was then stained using Coomassie blue G250. The protein ladder employed ranged from 10 to 240 kDa (Figure 6A). Exo50, Exo100, and Exo250 had the same protein separation pattern (Figure 6B). Furthermore, according to the Western blot results, all the isolated exosomes were identified as expressing TSG101 (at about 48.9 kDa) (Figure 6C).

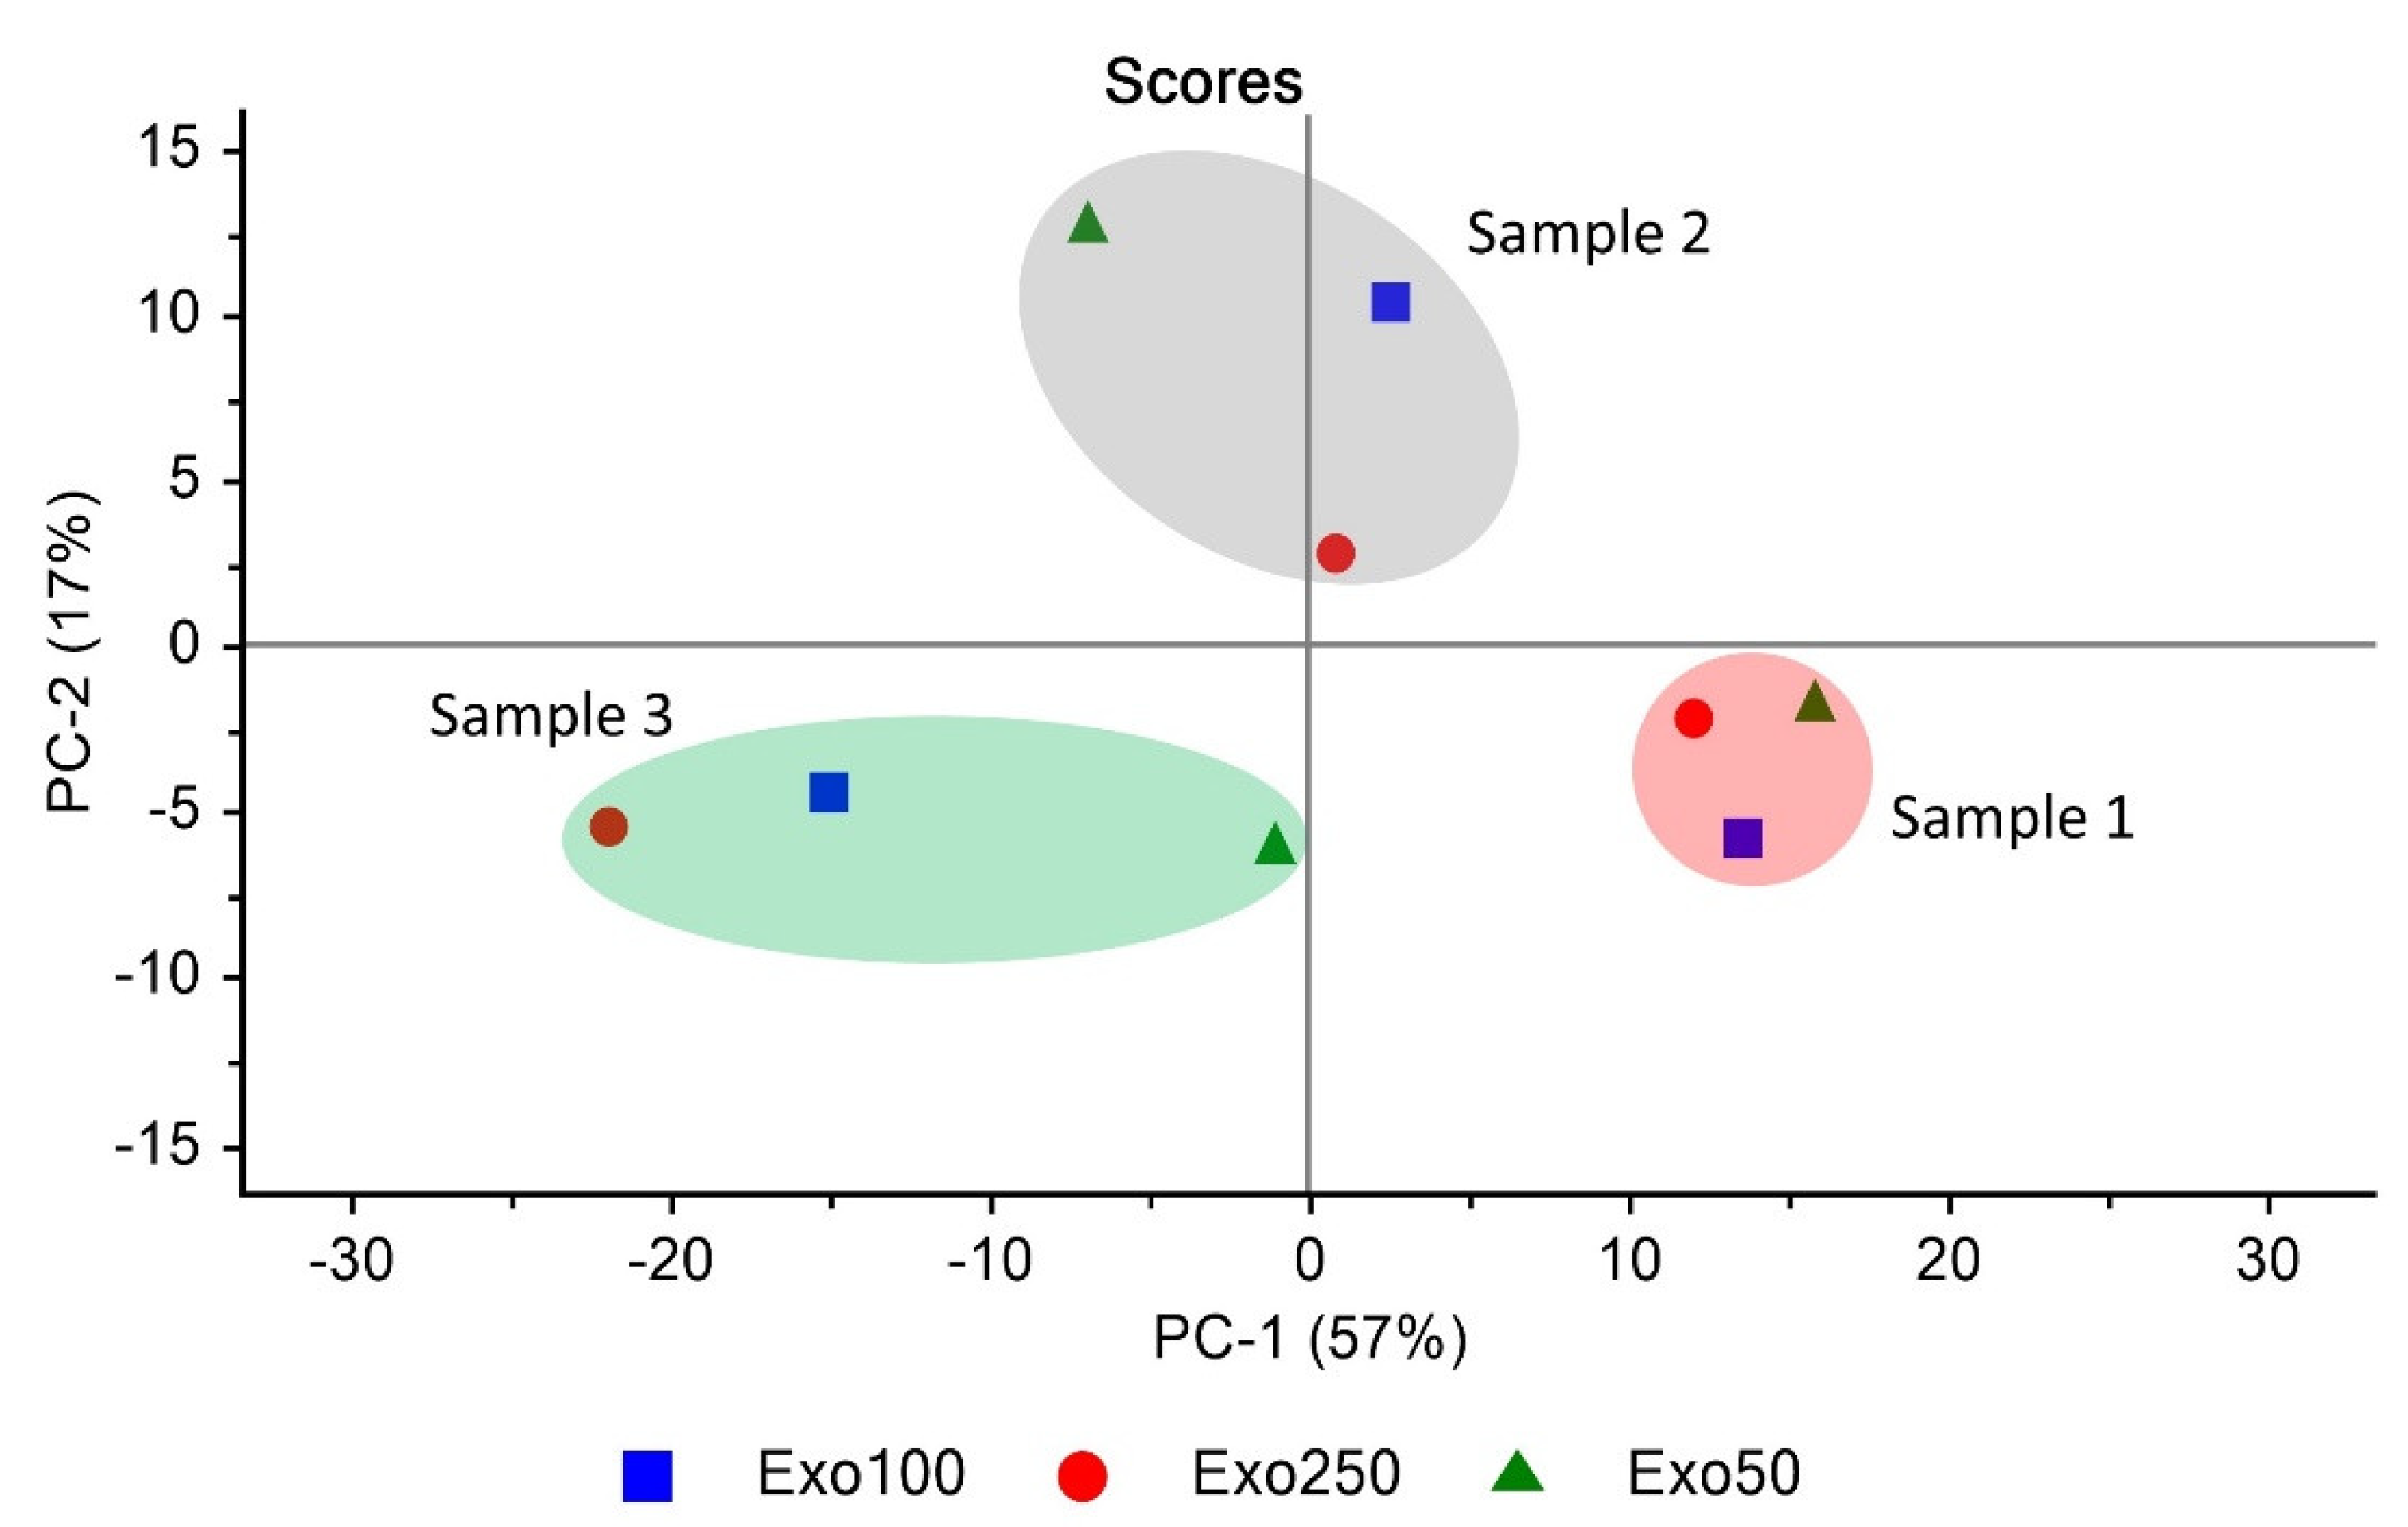
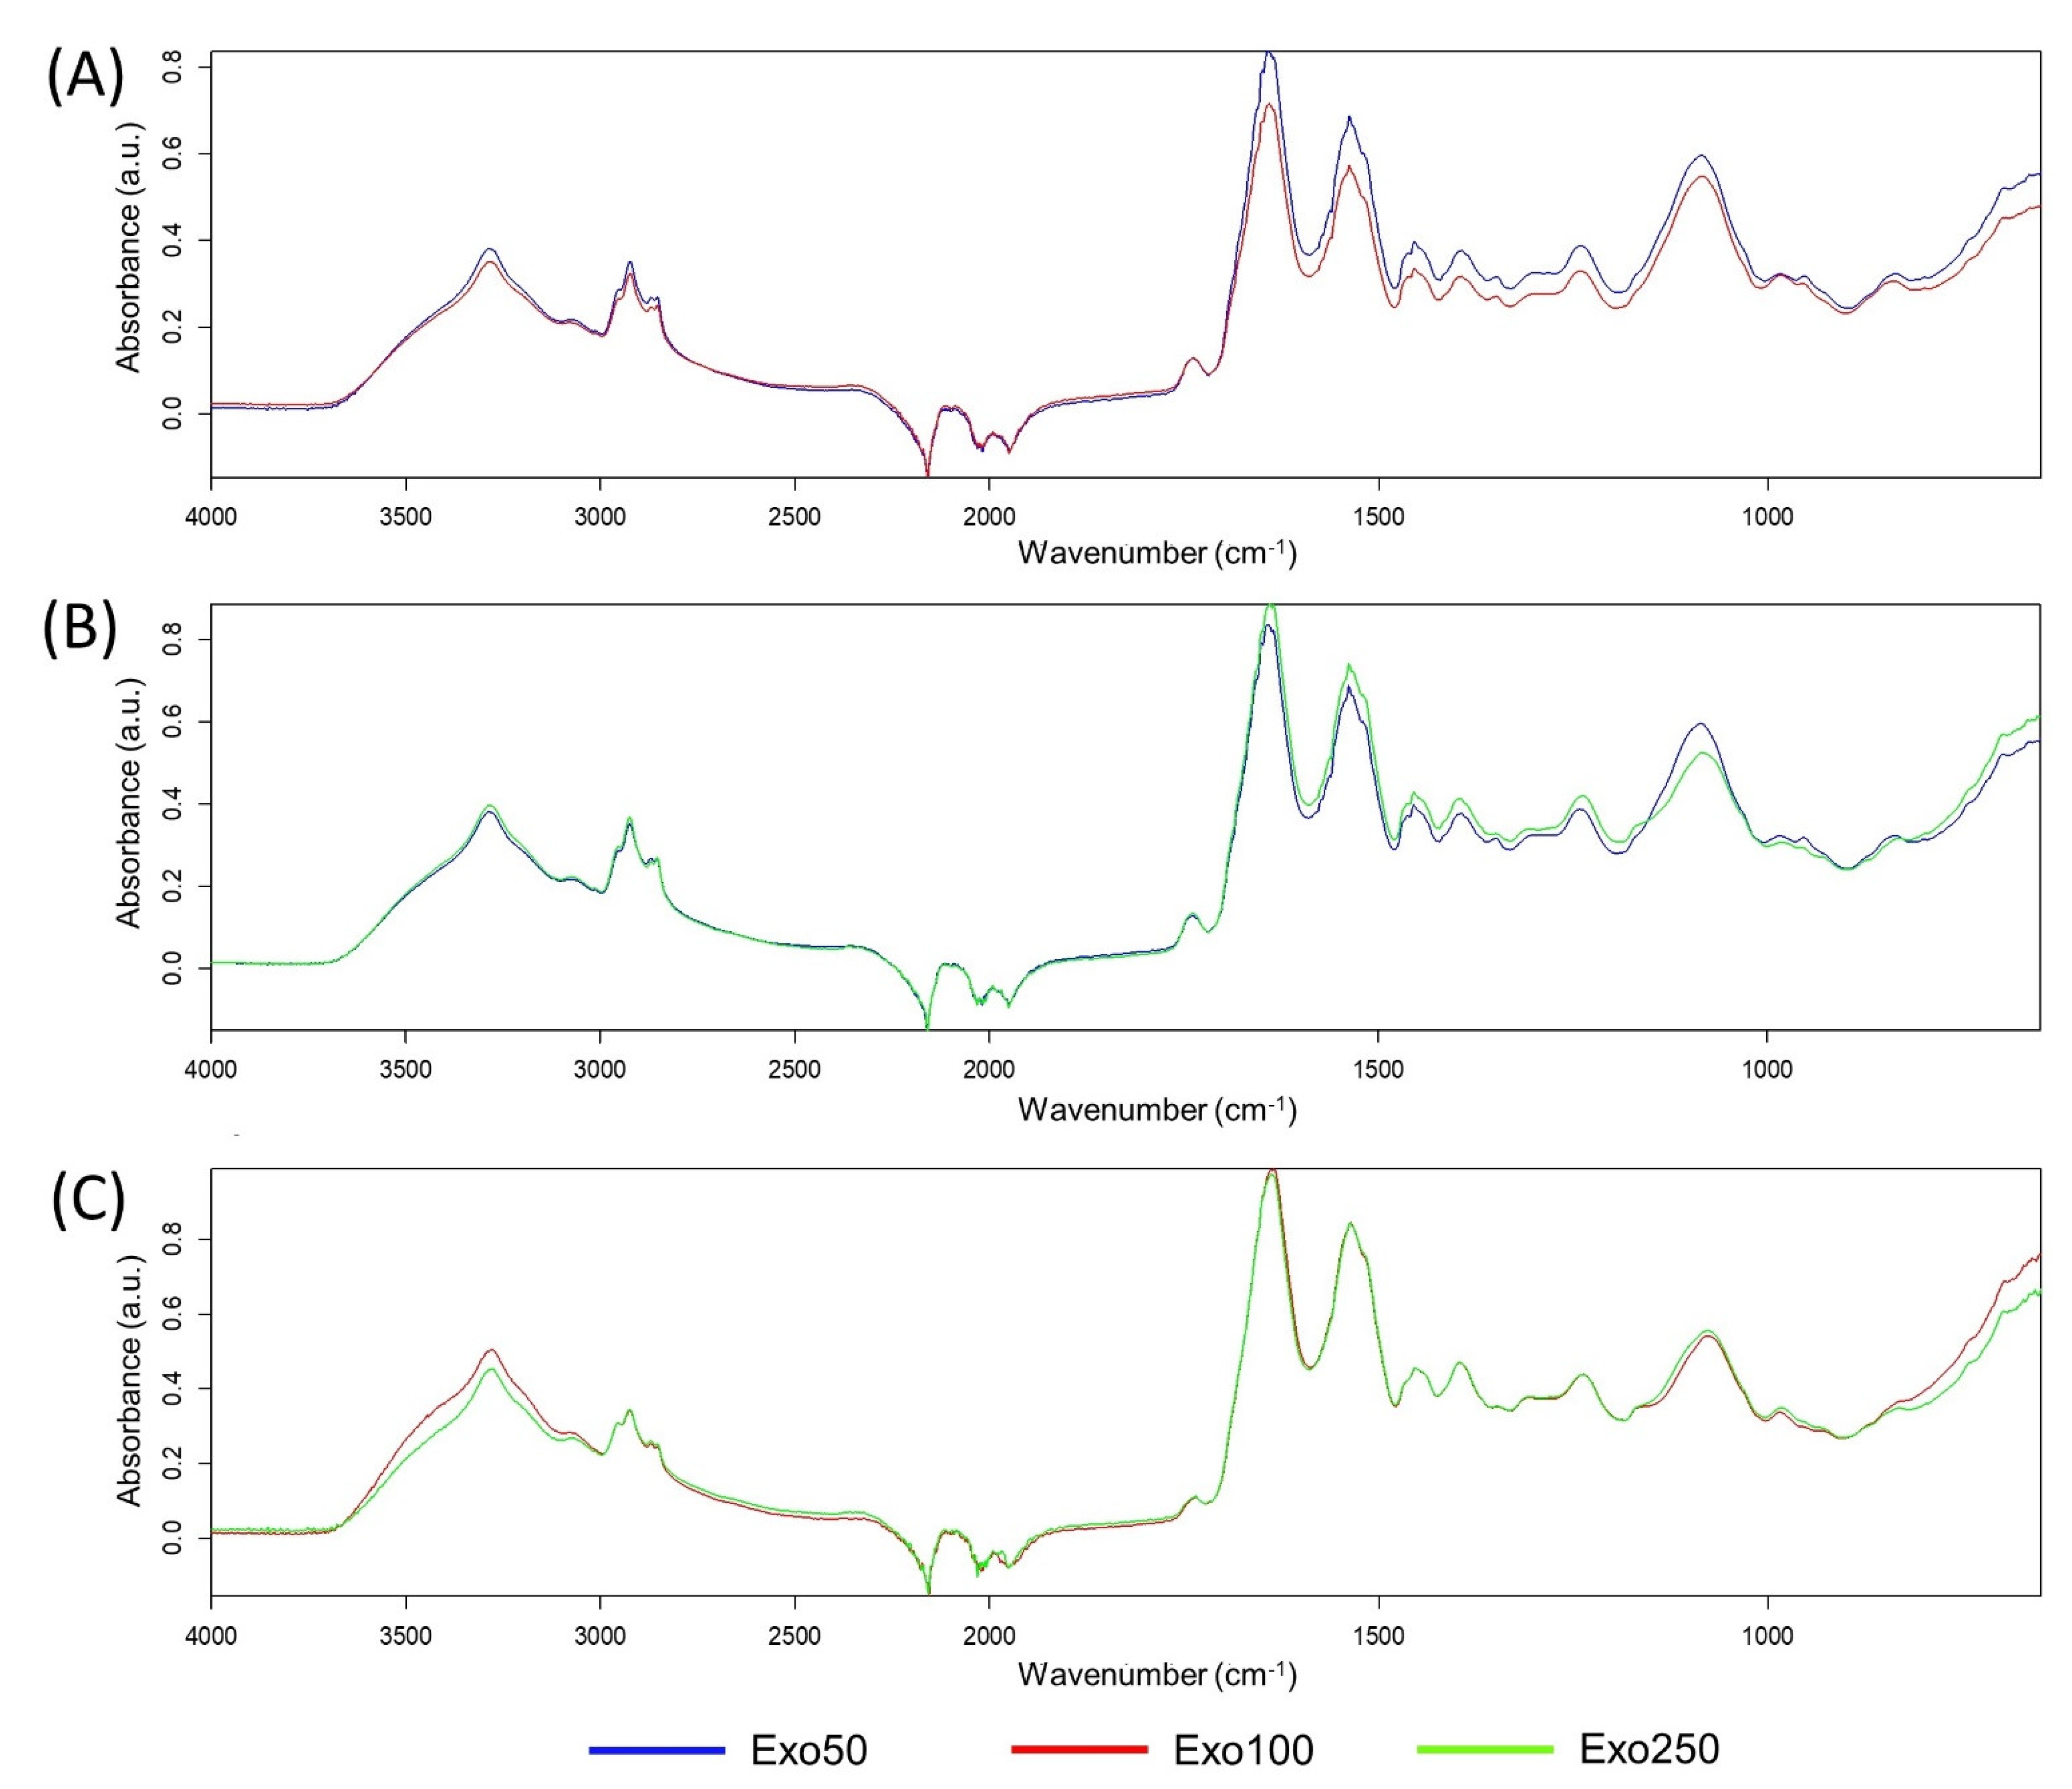
3.6. Exosome Similarity Based on PCA and Quick Compare Analysis

A principal component analysis was employed to identify any data clustering from the spectra of the exosomes isolated from different volumes of the sera. Three clusters were identified by the PCA. Each cluster consisted of Exo50, Exo100, and Exo 250 that came from the same sample source. Clusters of samples 1, 2, and 3 were separated in the different PCs. A cluster of sample 1 was between PC-1-positive and PC-2-negative. A cluster of sample 2 was separated from cluster samples 1 and 3, along with PC-2. A cluster of sample 3 was the opposite of the cluster of sample 1 and was between PC-1-negative and PC-2-negative (Figure 7).
In this part, we conducted a FTIR Quick Compare analysis among the isolated exosomes to analyze the similarities of their biomolecules. Raw spectra were compared using the Quick Compare feature of OPUS 8.2.28 software, and the similarity threshold was set at 95%. The results revealed that the similarities among the isolated exosome samples were more than 95% of the threshold (Figure 8 and Table 1).
Based on the FTIR Quick Compare results, interestingly, all the samples compared had more than a 95% similarity. The results suggested that Exo50, Exo100, and Exo250 were identical in terms of their biochemical components, although they were isolated from different serum volumes.

4. Discussion

The interest in using HDL and exosomes for biomarker exploration is continuously increasing, as they serve important biological information linked to the health status. Several methods have been established to isolate HDL and exosomes [24,31]. However, the availability of a large amount of sample volume and access to ultracentrifugation is a major shortcoming in the clinical research and setting. To overcome this issue, we, therefore, demonstrated a possible alternative procedure eliminating the use of ultracentrifugation with small serum volumes to obtain HDL and exosomes.
For HDL isolation, we compared HDL isolation from 200 and 500 µL of serum using an HDL purification kit (Cell Biolabs, Inc., San Diego, CA, USA). The principle of the HDL purification kit is mainly based on the presence of dextran sulfate that selectively precipitates HDL. By employing this commercial kit, a series of precipitation and low-speed centrifugation procedures were used to purify the HDL particles [33]. Using a chemistry autoanalyzer, we confirmed that HDL was successfully isolated from 200 and 500 µL of serum with the HDL levels of 39.3 and 39 mg/dL, respectively. Interestingly, the percent recovery calculation exhibited that 93.6 and 92.9% of HDL could be obtained from 200- and 500-µL serum samples. These results showed the relatively high efficiency of the HDL isolation process. A previous study that worked on HDL isolation from human sera by using a selected affinity immunosorption approach also obtained high recovery. The study successfully isolated particles containing more than 90% of ApoA-1. However, small-volume variations during the HDL isolation process were not explored in their experiments [34]. According to SDS-PAGE followed by Coomassie blue G250 staining, we found three bands, including 29, 51, and 70 kDa, approximately. The use of Western blotting with a specific antibody verified that ApoA-1, a specific biomarker of HDL [35], was identified in both HDL200 and HDL500. In addition, at about 51 and 70 kDa, the proteins may be linked to other proteins, as HDL has been identified to associate with 85 proteins based on a proteomic study [6]. In our study, SDS-PAGE exhibited that ApoA-1 was the major protein, since ApoA-1 is approximately 70% of the HDL protein size [5].
According to score plots of the principal component analysis (PCA), HDL200 and HDL500 from the same sample source were grouped into the same cluster. It showed that the biochemical components of HDL200 and HDL500 that came from the same serum had similar biochemical components in the spectral range of 4000–650 cm−1. However, a PCA could not answer the percentage of similarity between HDL200 and HDL500. Thus, we employed another approach, a Quick Compare analysis, to identify the percentage of similarity. Furthermore, to the best of our knowledge, this is the first study employing FTIR spectra with PCA and Quick Compare analyses to test the similarity of biochemical components between HDLs isolated from different volumes. FTIR spectra in the wavenumber of 4000–650 cm−1 allowed us to study the lipids, proteins, and carbohydrates, as well as nucleic acid [36]. Thus, when we used this approach, we compared many biochemical components. As expected, according to Quick Compare, both isolated HDL200 and HDL500 were identical (99.60 ± 0.10%). The Quick Compare method works by calculating the correlation coefficient of full-range FTIR spectra based on the peak intensity and position [37]. This approach convinced us that HDL isolated from 200 and 500 µL would provide us HDL with the same biocomponents inside.
Here, we compared three different serum volumes (50, 100, and 250 µL) to isolate exosomes. The dynamic light scattering (DLS) technique permitted obtaining the sizes of the isolated exosomes. Prior to the sample analysis, phosphate-buffered saline (PBS) was run as a negative control to make sure that we had no peak of the particle sizes and to make sure that the commercial PBS used was free from any particle contamination. Our study exhibited that the modes of the particle sizes of Exo50, Exo100, and Exo250 were 160.57 ± 14.65, 148.13 ± 17.58, and 152.33 ± 11.21 nm, and the statistical analysis showed no significant differences among Exo50, Exo100, and Exo250. All isolated exosomes were within the expected diameter size range (30–200 nm) [21]. A study conducted by Martins et al. (2018) similarly showed the same size range as our study. They reported that exosomes isolated using ExoQuick from 250 µL of serum, plasma, and cerebrospinal fluid had the modes of particle sizes of 159.3 ± 20.7, 140.0 ± 28.6, and 142.6 ± 32.1 nm, respectively [38]. Unfortunately, in the previous study, sample volumes lower than 250 µL were not explored.
As expected, Exo50, Exo100, and Exo250 had the same protein pattern, although they were isolated from different serum volumes. Many protein bands from the exosomes were identified using SDS-PAGE. Our findings were in accordance with several previous studies showing many exosome-carried proteins. A proteomics study on epithelial ovarian cancer uncovered 294 proteins that existed in all the exosome samples [39]. In addition, using the proteomics approach in metastatic gastric cancer patients, 443 exosomal proteins were successfully identified [40]. Those studies clearly explained why exosomes had many protein bands. Furthermore, a Western blot assay using TSG101 antibody confirmed that Exo50, Exo100, and Exo250 expressed the exosome biomarker [41].
Exo50, Exo100, and Exo250 isolated from the same serum sample were in the same cluster based on the PCA results. We then continued our analysis by using a Quick Compare analysis to calculate the percentage of similarity. According to this analysis, as expected, Exo50, Exo100, and Exo250 were identical, as their biochemical component similarity was >99%. Previous studies have tried exosome isolation from various types of biological samples and carried out multiple tests for their characterizations, but none used the FTIR approach coupled with a PCA or Quick Compare analysis for the exosome characterization steps [38,42,43]. Thus, this is the first report involving FTIR spectra followed by PCA and Quick Compare to test the similarities among isolated exosomes. Previously, Quick Compare was used in the study of polymer identity verification [37] and has not been generally applied for biological samples.
In this study, the isolation of the HDL and exosomes was carried out using the HDL purification kit (Cell Biolabs, USA, cat no. STA, 607) and ExoQuick™ Exosome Precipitation Solution (System Biosciences, USA, cat no. EXOQ5A-1). These two commercial kits are commonly used to isolate these two targets. The selected HDL purification kit has been used by several researchers, and they have successfully used it for HDL isolation. However, all of them followed the manufacturer’s instructions without doing any modifications to reduce the sample volume and kit used [44,45,46]. According to the manual of the HDL isolation kit, 10 mL of serum or plasma is needed for HDL isolation [33], and sometimes, it is difficult to obtain a specimen with the aforementioned volume. Regarding exosome isolation, several studies using ExoQuick have succeeded in isolating exosomes from 250 µL of serum or plasma by following the kit manufacturer’s protocols without exploring the possibility of using smaller sample volumes [38,47,48]. In this study, the potential of the HDL isolation kit and ExoQuick to isolate these two important targets with small serum volumes was explored. By using a small sample volume, the volume of the chemical or reagent used was smaller. Thus, the advantages of our alternative methods are (1) the elimination of an ultracentrifugation need during the isolation process, (2) the possible use of as small as 50 µL and 200 µL for the exosome and HDL isolation, and (3) saving the commercial kits used, leading to cost efficiency in the research and clinical settings. In addition to conventional characterizations, in this study, we used ATR-FTIR spectroscopy combined with PCA and Quick Compare analyses to ensure that the HDL and exosomes isolated from different volumes had similar biocomponents. Moreover, this characterization approach could also be used to monitor the biological components of other isolated biological fractions using various separation methods.

5. Conclusions

In conclusion, our study demonstrated that small sample volumes of serum can be used to isolate HDL and exosomes. Specifically, it is possible to use 200 and 500 µL of serum in order to isolate HDL and 50, 100, and 250 µL of serum in order to isolate exosomes. The use of small volumes will assist the advancement of HDL and exosome-based biomarker discoveries in a variety of downstream molecular approaches.

Author Contributions

Conceptualization, R.K.P. and C.L.; formal analysis, R.K.P.; funding acquisition, C.L.; investigation, R.K.P.; methodology, R.K.P.; project administration, C.L.; resources, A.J. and C.L.; supervision, W.P., P.T., A.J. and C.L.; validation, W.P., P.T., A.J. and C.L.; writing—original draft, R.K.P.; and writing—review and editing, W.P., P.T., A.J. and C.L. All authors have read and agreed to the published version of the manuscript.

Funding

This study was funded by the Royal Golden Jubilee Ph.D. (RGJ-Ph.D.) ASEAN Program (Contract No. PHD/0238/2560, Code 5.L.KK/60/A.1.O.AS to R.K.P. and C.L.) and the Centre for Research and Development of Medical Diagnostic Laboratory (CMDL), Faculty of Associated Medical Sciences, Khon Kaen University, Thailand. W.P. held a scholarship under the Post-doctoral Program from the Research Affairs and Graduate School, Khon Kaen University (code 58336).

Institutional Review Board Statement

This study was conducted according to the guidelines of the Declaration of Helsinki and approved by the Ethics Committee of Khon Kaen University (protocol code HE 631335, 16 June 2020).

Informed Consent Statement

Patient consent was waived due to leftover specimens collected from routine investigation.

Data Availability Statement

Not applicable.

Acknowledgments

The authors would like to thank the AMS Excellence Laboratory, Faculty of Associated Medical Sciences, Khon Kaen University, Thailand for providing the serum samples in this study. We also thank to Trirat Nitrosetein for technical assistance in spectrum collection and Reny Rosalina for assistance in illustrating the graphical abstract.

Conflicts of Interest

The authors declare no conflict of interest.

References

  1. Liu, X.; Liu, X.; Wu, Y.; Wu, Q.; Wang, Q.; Yang, Z.; Li, L. MicroRNAs in biofluids are novel tools for bladder cancer screening. Oncotarget 2017, 8, 32370–32379. [Google Scholar] [CrossRef] [Green Version]
  2. Yang, M.; Xu, D.; Liu, Y.; Guo, X.; Li, W.; Guo, C.; Zhang, H.; Gao, Y.; Mao, Y.; Zhao, J. Combined serum biomarkers in non-invasive diagnosis of non-alcoholic steatohepatitis. PLoS ONE 2015, 10, e0131664. [Google Scholar] [CrossRef] [Green Version]
  3. Jimenez-Luna, C.; Torres, C.; Ortiz, R.; Dieguez, C.; Martinez-Galan, J.; Melguizo, C.; Prados, J.C.; Caba, O. Proteomic biomarkers in body fluids associated with pancreatic cancer. Oncotarget 2018, 9, 16573–16587. [Google Scholar] [CrossRef]
  4. Xiao, Y.; Li, Y.; Yuan, Y.; Liu, B.; Pan, S.; Liu, Q.; Qi, X.; Zhou, H.; Dong, W.; Jia, L. The potential of exosomes derived from colorectal cancer as a biomarker. Clin. Chim. Acta 2019, 490, 186–193. [Google Scholar] [CrossRef] [PubMed]
  5. Ben-Aicha, S.; Badimon, L.; Vilahur, G. Advances in HDL: Much more than lipid transporters. Int. J. Mol. Sci. 2020, 21, 732. [Google Scholar] [CrossRef] [PubMed] [Green Version]
  6. Shah, A.S.; Tan, L.; Long, J.L.; Davidson, W.S. Proteomic diversity of high density lipoproteins: Our emerging understanding of its importance in lipid transport and beyond. J. Lipid Res. 2013, 54, 2575–2585. [Google Scholar] [CrossRef] [PubMed] [Green Version]
  7. Wagner, J.; Riwanto, M.; Besler, C.; Knau, A.; Fichtlscherer, S.; Röxe, T.; Zeiher, A.M.; Landmesser, U.; Dimmeler, S. Characterization of levels and cellular transfer of circulating lipoprotein-bound microRNAs. Arterioscler. Thromb. Vasc. Biol. 2013, 33, 1392–1400. [Google Scholar] [CrossRef] [Green Version]
  8. Vickers, K.C.; Landstreet, S.R.; Levin, M.G.; Shoucri, B.M.; Toth, C.L.; Taylor, R.C.; Palmisano, B.T.; Tabet, F.; Cui, H.L.; Rye, K.A.; et al. MicroRNA-223 coordinates cholesterol homeostasis. Proc. Natl. Acad. Sci. USA 2014, 111, 14518–14523. [Google Scholar] [CrossRef] [Green Version]
  9. Vickers, K.C.; Palmisano, B.T.; Shoucri, B.M.; Shamburek, R.D.; Remaley, A.T. MicroRNAs are transported in plasma and delivered to recipient cells by high-density lipoproteins. Nat. Cell Biol. 2011, 13, 423–433. [Google Scholar] [CrossRef] [Green Version]
  10. Hessvik, N.P.; Llorente, A. Current knowledge on exosome biogenesis and release. Cell. Mol. Life Sci. 2018, 75, 193–208. [Google Scholar] [CrossRef] [Green Version]
  11. Hunter, M.P.; Ismail, N.; Zhang, X.; Aguda, B.D.; Lee, E.J.; Yu, L.; Xiao, T.; Schafer, J.; Lee, M.-L.T.; Schmittgen, T.D.; et al. Detection of microRNA expression in human peripheral blood microvesicles. PLoS ONE 2008, 3, e3694. [Google Scholar] [CrossRef] [Green Version]
  12. Gheinani, A.H.; Vögeli, M.; Baumgartner, U.; Vassella, E.; Draeger, A.; Burkhard, F.C.; Monastyrskaya, K. Improved isolation strategies to increase the yield and purity of human urinary exosomes for biomarker discovery. Sci. Rep. 2018, 8, 3945. [Google Scholar] [CrossRef]
  13. Barros, E.R.; Carvajal, C.A. Urinary exosomes and their cargo: Potential biomarkers for mineralocorticoid arterial hypertension? Front. Endocrinol. 2017, 8, 230. [Google Scholar] [CrossRef] [PubMed] [Green Version]
  14. Han, Y.; Jia, L.; Zheng, Y.; Li, W. Salivary exosomes: Emerging roles in systemic disease. Int. J. Biol. Sci. 2018, 14, 633–643. [Google Scholar] [CrossRef]
  15. Zlotogorski-Hurvitz, A.; Dayan, D.; Chaushu, G.; Korvala, J.; Salo, T.; Sormunen, R.; Vered, M. Human saliva-derived exosomes: Comparing methods of isolation. J. Histochem. Cytochem. 2015, 63, 181–189. [Google Scholar] [CrossRef] [Green Version]
  16. Spaull, R.; McPherson, B.; Gialeli, A.; Clayton, A.; Uney, J.; Heep, A.; Cordero-Llana, Ó. Exosomes populate the cerebrospinal fluid of preterm infants with post-haemorrhagic hydrocephalus. Int. J. Dev. Neurosci. 2019, 73, 59–65. [Google Scholar] [CrossRef]
  17. Poliakov, A.; Spilman, M.; Dokland, T.; Amling, C.L.; Mobley, J.A. Structural heterogeneity and protein composition of exosome-like vesicles (prostasomes) in human semen. Prostate 2009, 69, 159–167. [Google Scholar] [CrossRef]
  18. Mirza, A.H.; Kaur, S.; Nielsen, L.B.; Størling, J.; Yarani, R.; Roursgaard, M.; Mathiesen, E.R.; Damm, P.; Svare, J.; Mortensen, H.B.; et al. Breast milk-derived extracellular vesicles enriched in exosomes from mothers with type 1 diabetes contain aberrant levels of MicroRNAs. Front. Immunol. 2019, 10, 2543. [Google Scholar] [CrossRef]
  19. Skriner, K.; Adolph, K.; Jungblut, P.R.; Burmester, G.R. Association of citrullinated proteins with synovial exosomes. Arthritis Rheum. 2006, 54, 3809–3814. [Google Scholar] [CrossRef] [PubMed]
  20. Colombo, M.; Raposo, G.; Théry, C. Biogenesis, secretion, and intercellular interactions of exosomes and other extracellular vesicles. Annu. Rev. Cell Dev. Biol. 2014, 30, 255–289. [Google Scholar] [CrossRef] [PubMed]
  21. Xiao, Y.; Zhong, J.; Zhong, B.; Huang, J.; Jiang, L.; Jiang, Y.; Yuan, J.; Sun, J.; Dai, L.; Yang, C.; et al. Exosomes as potential sources of biomarkers in colorectal cancer. Cancer Lett. 2020, 476, 13–22. [Google Scholar] [CrossRef] [PubMed]
  22. Hornung, S.; Dutta, S.; Bitan, G. CNS-derived blood exosomes as a promising source of biomarkers: Opportunities and challenges. Front. Mol. Neurosci. 2020, 13, 38. [Google Scholar] [CrossRef] [Green Version]
  23. Lugini, L.; Cecchetti, S.; Huber, V.; Luciani, F.; Macchia, G.; Spadaro, F.; Paris, L.; Abalsamo, L.; Colone, M.; Molinari, A.; et al. Immune surveillance properties of human nk cell-derived exosomes. J. Immunol. 2012, 189, 2833–2842. [Google Scholar] [CrossRef] [PubMed] [Green Version]
  24. Michell, D.L.; Allen, R.M.; Landstreet, S.R.; Zhao, S.; Toth, C.L.; Sheng, Q.; Vickers, K.C. Isolation of high-density lipoproteins for non-coding small RNA quantification. J. Vis. Exp. 2016, 117, e54488. [Google Scholar] [CrossRef] [Green Version]
  25. Henderson, C.M.; Vaisar, T.; Hoofnagle, A.N. Isolating and quantifying plasma HDL proteins by sequential density gradient ultracentrifugation and targeted proteomics. Methods Mol. Biol. Clifton NJ 2016, 1410, 105–120. [Google Scholar]
  26. Gardiner, C.; Vizio, D.D.; Sahoo, S.; Théry, C.; Witwer, K.W.; Wauben, M.; Hill, A.F. Techniques used for the isolation and characterization of extracellular vesicles: Results of a worldwide survey. J. Extracell. Vesicles 2016, 5, 32945. [Google Scholar] [CrossRef] [PubMed]
  27. Ludwig, N.; Whiteside, T.L.; Reichert, T.E. Challenges in exosome isolation and analysis in health and disease. Int. J. Mol. Sci. 2019, 20, 4684. [Google Scholar] [CrossRef] [Green Version]
  28. Ayala-Mar, S.; Donoso-Quezada, J.; Gallo-Villanueva, R.C.; Perez-Gonzalez, V.H.; González-Valdez, J. Recent advances and challenges in the recovery and purification of cellular exosomes. Electrophoresis 2019, 40, 3036–3049. [Google Scholar] [CrossRef]
  29. Konoshenko, M.Y.; Lekchnov, E.A.; Vlassov, A.V.; Laktionov, P.P. Isolation of extracellular vesicles: General methodologies and latest trends. BioMed Res. Int. 2018, 2018, 8545347. [Google Scholar] [CrossRef]
  30. Kurian, T.K.; Banik, S.; Gopal, D.; Chakrabarti, S.; Mazumder, N. Elucidating methods for isolation and quantification of exosomes: A review. Mol. Biotechnol. 2021, 63, 249–266. [Google Scholar] [CrossRef]
  31. Baranyai, T.; Herczeg, K.; Onódi, Z.; Voszka, I.; Módos, K.; Marton, N.; Nagy, G.; Mäger, I.; Wood, M.J.; El Andaloussi, S.; et al. Isolation of exosomes from blood plasma: Qualitative and quantitative comparison of ultracentrifugation and size exclusion chromatography methods. PLoS ONE 2015, 10, e0145686. [Google Scholar] [CrossRef] [Green Version]
  32. Cumba Garcia, L.M.; Peterson, T.E.; Cepeda, M.A.; Johnson, A.J.; Parney, I.F. Isolation and analysis of plasma-derived exosomes in patients with glioma. Front. Oncol. 2019, 9, 651. [Google Scholar] [CrossRef] [Green Version]
  33. HDL Purification Kit. Available online: https://www.cellbiolabs.com/hdl-purification-kit (accessed on 10 October 2021).
  34. McVicar, J.P.; Kunitake, S.T.; Hamilton, R.L.; Kane, J.P. Characteristics of human lipoproteins isolated by selected-affinity immunosorption of apolipoprotein A-I. Proc. Natl. Acad. Sci. USA 1984, 81, 1356–1360. [Google Scholar] [CrossRef] [Green Version]
  35. Oberbach, A.; Adams, V.; Schlichting, N.; Heinrich, M.; Kullnick, Y.; Lehmann, S.; Lehmann, S.; Feder, S.; Correia, J.C.; Mohr, F.W.; et al. Proteome profiles of HDL particles of patients with chronic heart failure are associated with immune response and also include bacteria proteins. Clin. Chim. Acta 2016, 453, 114–122. [Google Scholar] [CrossRef]
  36. Baker, M.J.; Trevisan, J.; Bassan, P.; Bhargava, R.; Butler, H.J.; Dorling, K.M.; Fielden, P.R.; Fogarty, S.W.; Fullwood, N.J.; Heys, K.A.; et al. Using fourier transform IR spectroscopy to analyze biological materials. Nat. Protoc. 2014, 9, 1771–1791. [Google Scholar] [CrossRef] [Green Version]
  37. Bell, J.; Nel, P.; Stuart, B. Non-invasive identification of polymers in cultural heritage collections: Evaluation, optimisation and application of portable FTIR (ATR and external reflectance) spectroscopy to three-dimensional polymer-based objects. Herit. Sci. 2019, 7, 95. [Google Scholar] [CrossRef]
  38. Martins, T.S.; Catita, J.; Rosa, I.M.; Da Cruz e Silva, O.A.B.; Henriques, A.G. Exosome isolation from distinct biofluids using precipitation and column-based approaches. PLoS ONE 2018, 13, e0198820. [Google Scholar] [CrossRef] [PubMed] [Green Version]
  39. Zhang, W.; Ou, X.; Wu, X. Proteomics profiling of plasma exosomes in epithelial ovarian cancer: A potential role in the coagulation cascade, diagnosis and prognosis. Int. J. Oncol. 2019, 54, 1719–1733. [Google Scholar] [CrossRef] [Green Version]
  40. Ding, X.-Q.; Wang, Z.-Y.; Xia, D.; Wang, R.-X.; Pan, X.-R.; Tong, J.-H. Proteomic profiling of serum exosomes from patients with metastatic gastric cancer. Front. Oncol. 2020, 10, 1113. [Google Scholar] [CrossRef]
  41. Gao, F.; Jiao, F.; Xia, C.; Zhao, Y.; Ying, W.; Xie, Y.; Guan, X.; Tao, M.; Zhang, Y.; Qin, W.; et al. A novel strategy for facile serum exosome isolation based on specific interactions between phospholipid bilayers and TiO2. Chem. Sci. 2019, 10, 1579–1588. [Google Scholar] [CrossRef] [PubMed] [Green Version]
  42. Helwa, I.; Cai, J.; Drewry, M.D.; Zimmerman, A.; Dinkins, M.B.; Khaled, M.L.; Seremwe, M.; Dismuke, W.M.; Bieberich, E.; Stamer, W.D.; et al. A comparative study of serum exosome isolation using differential ultracentrifugation and three commercial reagents. PLoS ONE 2017, 12, e0170628. [Google Scholar] [CrossRef] [PubMed]
  43. Wu, M.; Ouyang, Y.; Wang, Z.; Zhang, R.; Huang, P.-H.; Chen, C.; Li, H.; Li, P.; Quinn, D.; Dao, M.; et al. Isolation of exosomes from whole blood by integrating acoustics and microfluidics. Proc. Natl. Acad. Sci. USA 2017, 114, 10584–10589. [Google Scholar] [CrossRef] [Green Version]
  44. Holzer, M.; Kern, S.; Birner-Grünberger, R.; Curcic, S.; Heinemann, A.; Marsche, G. Refined purification strategy for reliable proteomic profiling of HDL2/3: Impact on proteomic complexity. Sci. Rep. 2016, 6, 38533. [Google Scholar] [CrossRef]
  45. Gilad, D.; Atiya, S.; Mozes-Autmazgin, Z.; Ben-Shushan, R.S.; Ben-David, R.; Amram, E.; Tamir, S.; Chuyun, D.; Szuchman-Sapir, A. Paraoxonase 1 in endothelial cells impairs vasodilation induced by arachidonic acid lactone metabolite. Biochim. Biophys. Acta Mol. Cell Biol. Lipids 2019, 1864, 386–393. [Google Scholar] [CrossRef] [PubMed]
  46. Aggarwal, G.; May-Zhang, L.S.; Yermalitsky, V.; Dikalov, S.; Voynov, M.A.; Amarnath, V.; Kon, V.; Linton, M.F.; Vickers, K.C.; Davies, S.S. Myeloperoxidase-induced modification of HDL by isolevuglandins inhibits paraoxonase-1 activity. J. Biol. Chem. 2021, 297, 101019. [Google Scholar] [CrossRef]
  47. Tang, Y.-T.; Huang, Y.-Y.; Zheng, L.; Qin, S.-H.; Xu, X.-P.; An, T.-X.; Xu, Y.; Wu, Y.-S.; Hu, X.-M.; Ping, B.-H.; et al. Comparison of isolation methods of exosomes and exosomal RNA from cell culture medium and serum. Int. J. Mol. Med. 2017, 40, 834–844. [Google Scholar] [CrossRef] [Green Version]
  48. Serrano-Pertierra, E.; Oliveira-Rodríguez, M.; Rivas, M.; Oliva, P.; Villafani, J.; Navarro, A.; Blanco-López, M.C.; Cernuda-Morollón, E. Characterization of plasma-derived extracellular vesicles isolated by different methods: A comparison study. Bioengineering 2019, 6, 8. [Google Scholar] [CrossRef] [PubMed] [Green Version]
Figure 1. HDL isolation results. HDL was isolated using an HDL purification kit (Cell Biolabs) and measured by a chemistry autoanalyzer. Data of the HDL level (A) and the percent recovery (B) are the means of three independent experimental replicates (±SEM). An independent t-test revealed no significant difference between HDL200 and HDL500 in terms of the HDL level and percent recovery (p > 0.05).
Separations 08 00204 g001
Figure 2. SDS-PAGE and Western blotting of HDLs isolated from different sample volumes. A protein ladder reference (Vivantis Technologies, Shah Alam, Selangor Darul Ehsan, Malaysia, cat no. PR0602) had 3 reference bands (10.5, 42, and 95 kDa) coupled with a blue dye for easy identification (A). Based on Coomassie blue G250 staining of SDS-PAGE, major bands were identified approximately at 29, 51, and 70 kDa in both HDL200 and HDL500 (B). A single band was identified at about 29 kDa corresponding to ApoA-1 (C). M = Marker of protein molecular weight.
Separations 08 00204 g002
Figure 3. PCA of the HDLs isolated from different volumes of sera. PCA score plots were generated using the 4000–650 cm−1 region. There are three clusters of serum samples, and each cluster consists of spectra from HDL200 (blue) and HDL500 (red).
Separations 08 00204 g003
Figure 4. Representative results of the Quick Compare analysis of HDL200 (blue line) and HDL500 (red line). HDL raw spectra in the range of 4000–650 cm−1 were used for analysis by OPUS 8.2.28 software. HDL200 and HDL500 had similar spectral patterns, with 99.60 ± 0.10% similarity.
Separations 08 00204 g004
Figure 5. Exosome characterizations. Size distribution of Exo50, 100, and 250 based on a nanoparticle size analysis (A). Exosomes isolated from 50, 100, and 250 were shown in different colors. The blue line, green line, and red line are for Exo50, Exo100, and Exo250, respectively. The comparison of the exosome sizes (B). All isolated exosomes showed sizes in the range of the exosome sizes. Protein concentration of the isolated exosomes (C). Data are the mean of three independent experimental replicates (±SEM). One-way ANOVA revealed no significant differences among the isolated exosomes in terms of the particle size and protein concentration (p > 0.05).
Separations 08 00204 g005
Figure 6. The protein pattern and biomarker of the exosomes isolated from different sample volumes. A protein ladder reference (Vivantis Technologies, Shah Alam, Selangor Darul Ehsan, Malaysia, cat no. PR0623) had 2 reference bands (25 and 72 kDa) coupled with blue chromophore for easy identification (A). SDS-PAGE stained with Coomassie blue G250 showed multiple bands with the same patterns (B). The Western blot results showed a single band of TSG101 at about 48.9 kDa exhibiting the exosome biomarker (C). Thirty micrograms of protein were loaded for both SDS-PAGE and the Western blot. All experiments above were run with a reducing agent. M = Marker of protein molecular weight.
Separations 08 00204 g006
Figure 7. PCA of the exosome spectra. PCA score plots were generated using the 4000–650 cm−1 region. There are three clusters of data, and each cluster consists of spectra from Exo50 (green), Exo100 (blue), and Exo250 (red).
Separations 08 00204 g007
Figure 8. FTIR Quick Compare results using a whole range of FTIR spectra from 4000 to 650 cm−1. Comparison of Exo50 (blue line) vs. Exo100 (red line) (A). Comparison of Exo50 (blue line) vs. Exo250 (green line) (B). Comparison of Exo100 (red line) vs. Exo250 (green line) (C). Raw spectra in the range of 4000–650 cm−1 were used for the Quick Compare analysis.
Separations 08 00204 g008
Table 1. Summary of the FTIR Quick Compare analysis of the exosomes.
Sample% Similarity
Exo50 vs. Exo10099.57 ± 0.15%
Exo50 vs. Exo25099.27 ± 0.18%
Exo100 vs. Exo25099.43 ± 0.32%
Data of similarity are triplicates of experiments. Data are shown as the mean with the SEM.
Publisher’s Note: MDPI stays neutral with regard to jurisdictional claims in published maps and institutional affiliations.

