Abstract
A comprehensive utilization of rebaudioside A (RA), stevioside (ST), and rebaudioside C (RC) from natural stevia resources was proposed. The influence of the solvent, solvent concentration, solid-liquid ratio, temperature, and time on the purity and recovery were investigated with response surface methodology. A 99% purity and 81% recovery of the RA were achieved by one crystallization of crude stevia under optimized conditions. Around a 95% purity and 80% recovery of the ST were easily achieved by the recrystallization of less value of mother liquor sugar (MLS) with a certain concentration of isopropyl alcohol–methanol aqueous solution. During the crystallization of the ST, the enriched RC in the liquid phase was more than three times higher than that in the crude stevia, which can provide cheaper RC raw material for the subsequent preparation of very expensive and high-purity RC.
1. Introduction
Stevia sugar is a natural sweetener extracted from the natural plant stevia. Its sweetness is 200–300 times that of sucrose, and the calories are only 1/300 the calories of sucrose [1]. Since stevia is low in calories and is not absorbed in the body, it is widely used in the diet of people with obesity, high blood pressure, and diabetes. Stevia also have been widely applied in beverages, food, medicine, the daily chemical industry, and more. Therefore, stevia sugar is considered as the third generation of sugar source in the world due to its low calories, high sweetness, and safety [2], and it has attracted extensive attention in recent years.
The main components of stevia are rebaudioside A (RA), stevioside (ST), and rebaudioside C (RC). Their contents in natural stevia account for more than 90% [3]. Among them, RA has the highest sweetness and the best sweet quality [4]. ST has an anti-tuberculosis effect [5]. RC can be used as a sweetness enhancer [6] and has health functions, such as lowering blood pressure, lowering blood lipids, anti-allergy effects, and preventing cardiovascular disease [7,8].
The separation methods of stevia components, such as HPLC [9], droplet counter current chromatography [10], thin-layer chromatography (TLC) [11], supercritical fluid extraction, and capillary electrophoresis [12], have been reported, but the separation and purification of the components is very difficult because of the very similar molecular structure and polarity of these glycosides. Although most of the methods above are sensitive and rapid in operation, they are difficult for industrial application because of their high cost.
At present, the most common industrial method for separating RA from stevia sugar mixtures is crystallization [13]. Crystallization separation is mainly based on the solubility difference of each substance in a solvent [14]. A high purity RA product can be obtained after crystallization separation based on the solubility difference of RA and stevioside in different solvents; Ma Q [15] is mainly used as an ethanol-based mixed solution to recrystallize stevia for RA. After two crystallizations, a 95% purity of RA was obtained with 80% of product recovery.
Up to now, there are a few reports on the separation of ST from stevia. Chromatography could be used for the separation, but it requires a large amount of organic solvent and has a very high cost [16,17]. The separation of RC from stevia is much more difficult and is basically realized by HPLC or simulated moving beds [18]. In addition, the content of RC in stevia is very low, accounting for only 0.2% in the stevia plant [19]. Therefore, RC enrichment from stevia is necessary for preparing a high purity RC.
In view of the comprehensive utilization of natural stevia resources, industrial application, and low-cost solvent requirement, the authors performed a series of experiments for optimizing the recrystallization of stevia. It was hoped that pure RA could be obtained by using only one crystallization process and that the RA purity would be comparable to or higher than that of the similar method reported in the literature [20,21]. In addition, a high purity of ST could be achieved by the recrystallization from the mother liquor sugar (MLS) after the crystallization of RA once. The RC could be greatly enriched based on RC’s precipitated property in the recrystallization of RA and ST. It could provide a promising method for the comprehensive utilization of RA, ST, and RC from natural stevia resources.
2. Materials and Methods
2.1. Materials
Stevia crude sugar was provided by Xiaoye Herbal Bio-Technology Co., Ltd. (Chengdu, China); RA, ST, and RC standard (≥98% by HPLC) were purchased from Shanghai Yuanye Bio-Technology Co., Ltd. (Shanghai, China). Acetonitrile (chromatographic grade) was purchased from Chron Chemicals (Chengdu, China). Methanol, ethanol, Isopropyl alcohol of analytical grade were purchased from Kelon Chemical Co., Ltd. (Chengdu, China). Ultrapure water was laboratory-made with the machine (UPH-I-10T) from Sichuan ULUPURE Ultrapure Technology Co., Ltd. (Chengdu, China).
2.2. Analysis of RA, ST, and RC
RA, ST, and RC were analyzed with HPLC. The quantitative analysis was performed on a high-performance liquid chromatographic system equipped with an LC-20AT pump, an SPD-M20A photodiode array detector, and a Class-VP workstation (Shimadzu, Kyoto, Japan). The analytical column was a Welch C18 (250 × 4.6 mm, 5 μm); mobile phase conditions: vacetonitrile/vphosphoric acid buffer solution = 32/68 (acetonitrile phosphate buffer); the flow rate of mobile phase: 1 mL/min; the detection wavelength: 210 nm; column temperature: 40 °C; the injection volume: 20 μL.
2.3. Preparing Standard Curves of RA, ST, and RC
A standard solution of RA: 0.0224 g of RA standard was accurately weighed and dissolved into 25 mL of acetonitrile phosphate buffer at 25 °C. Then, 8.00 mL, 5.00 mL, 4.00 mL, 2.50 mL, and 1.25 mL of the RA standard solutions were precisely taken and diluted to 10.00 mL. ST or RC standard solution was prepared according to the standard aqueous solution of RA. Finally, relation of concentration and peak area were measured by HPLC for different concentrations of the standard solutions and correlated to its standard curve.
2.4. Purity Determination of Various Components
Purity determination of components in solid: 0.1 g of solid sample was accurately weighed with 0.001 g accuracy and dissolved with acetonitrile phosphate buffer into 100 mL volumetric flask for sampling solution. A 20 μL of the solution was sampled for HPLC analysis and obtained its concentration or purity combined with its standard curve.
Purity determination of components in liquid: 0.1 mL of liquid sample was accurately weighed with 0.02 mL accuracy and dissolved with acetonitrile phosphate buffer into 50 or 25 mL volumetric flask for sampling solution. The HPLC analysis and concentration or purity was the same to that of the solid sample.
Recovery of one component was calculated as follows:
η = m1/m0
In the formula, m1 represents to the mass of certain component in solid obtained after crystallization and m0 represents to the mass of certain component in solid before crystallization, respectively.
2.5. Optimization of Crystallization for RA
Based on preliminary tests, main effect factors to crystallization for RA were recognized, including the crystallization solvents (methanol, ethanol, isopropyl alcohol), the solvent concentration (88~98% in v/v% of methanol aq.), the solid-liquid ratio (2 g/mL~10 g/mL), the crystallization temperature (15 °C~35 °C), and the crystallization time (4 h~24 h). A single factor analysis was performed before optimization with response surface methodology (RSM, Design Expert 8.0 edition) [22]. All experiments were investigated in triplicate, and error bars were obtained by mean value and standard deviations.
The crystallization experiment procedure for RA was as follows: 2 g crude stevia was added into some concentration of single or mixed solvent in a certain ratio of solid to liquid and stirred at room temperature for 15 min. Then, the mixture was stood still for some time at a certain temperature. After filtered and dried, RA product was obtained and sampled for HPLC analysis. It was mother liquor sugar (MLS) after it was evaporated and dried to solid from the first crystallization.
2.6. Optimization of Crystallization for ST
Based on preliminary tests, some main factors to pure ST included the crystallization solvents (methanol, ethanol, isopropyl alcohol), the volume ratio of mixed solvents (other alcohol to methanol: 10~50%), the crystallization temperature (15 °C~35 °C), and the crystallization time (4 h~24 h). A single factor analysis and multiple factor analysis with RSM were proceed successively, similar to the RA crystallization.
The crystallization experiment procedure for ST was as follows: 1 g MLS was added into some concentration of single or mixed solvent in a solid-liquid ratio (g/mL) = 1 g/6 mL and stirred at room temperature for 15 min. Then, the mixture was stood still for some time at a certain temperature. After filtered and dried, ST product was obtained and sampled for HPLC analysis.
3. Results and Discussion
3.1. HPLC Standard Curve and Component Content in Crude Stevia
The standard curve equation of a single component of stevia could be obtained by using the HPLC external standard method, as shown in Table 1. The x and y were the concentration of the corresponding stevia monomer (mg/mL) and the peak area, respectively. It could be satisfactory for the quantitative analysis of stevia. The standard curves were given in Figure 1.

Table 1.
Retention time and standard curve equations of three components.
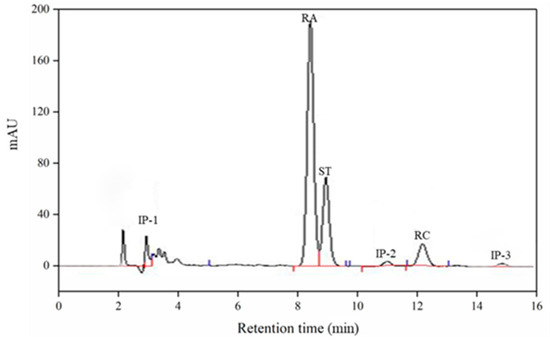
Figure 1.
HPLC chromatogram of crude stevia at 210 nm wavelengths.
Based on the standard curves, the content of RA, ST, and RC were calculated as 62.20%, 18.00%, and 7.50% to the total mass of stevia crude sugar extracted from the stevia plant. The rest was considered as impurities (IP). The HPLC chromatogram of the crude stevia is shown in Figure 1.
3.2. The RA Crystallization from Crude Stevia
The crystallization solvent, solvent concentration, solid-liquid ratio, temperature, and time were investigated for the purity and recovery of the RA. The properties of a solvent have a great effect on the crystallization, and three alcohols (methanol, ethanol, and isopropyl) were usually used as the main crystallization solvents [13,21]. Different solvents were investigated, as shown in Table 2. The typical results of the alcohols are shown in Figure 2. The isopropyl led to the lowest purity, but high purity and recovery were obtained in methanol and ethanol. The crystallization process took 24 h in the ethanol solvent; thus, only 16 h were spent in methanol. Further, methanol was feasible as a crystallization solvent [13,20,21,23]. Therefore, the methanol aqueous solution was selected as the crystallization solvent in this research.
Table 2.
Investigation of different solvents in one crystallization.
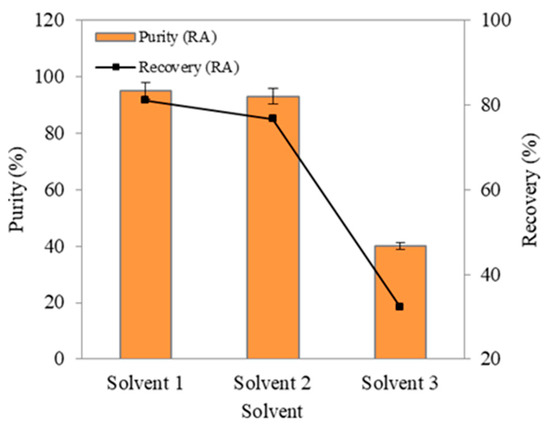
Figure 2.
Solvent effect on purity and recovery of RA.
The effect of the methanol concentration, solid-liquid ratio, temperature, and time were investigated, and their results are shown in Figure 3. As the methanol concentration increased, the RA recovery increased, while the purity dropped gradually (Figure 3a).
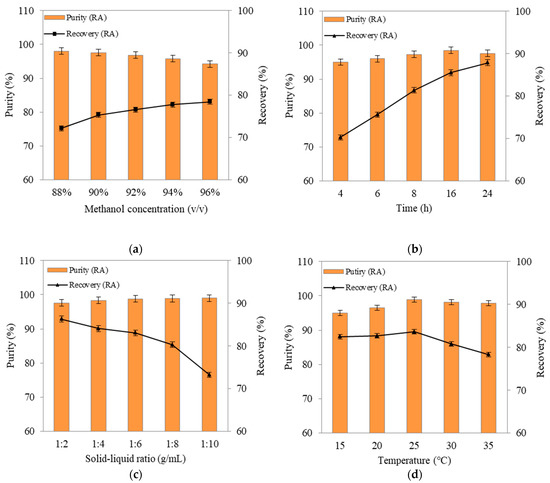
Figure 3.
Effect of (a) MeOH concentration (16 h, 1:4 of the solid-liquid ratio, and 25 °C), (b) recrystallization time (90% of methanol concentration, 1:4 of the solid-liquid ratio, and 25 °C), (c) solid-liquid ratio (90% of methanol concentration, 16 h, and 25 °C), and (d) temperature (90% of methanol concentration, 16 h, and 1:4 of the solid-liquid ratio) on purity and recovery of RA.
The RA purity did not change much after 16 h and tended to decrease slightly with the increase of time (Figure 3b). The purity and recovery rate of the RA gradually increased before 16 h. After that, the purity decreased somewhat and the recovery rate increased because a small amount of impurities would precipitate as time went on, leading to the decrease of purity.
The solid-liquid ratio had great influence on the recovery and less on the purity (Figure 3c). The crystalline solution was relatively viscous, and the crystal particles contained certain impurities, which led to the low purity of the RA in a low ratio of solid to liquid. The RA purity gradually increased until the solid-liquid ratio was 1:6. After that, the RA purity almost remained unchanged. However, the RA recovery always decreased with the increase in the solid-liquid ratio, which was attributed to that the increase in the solvent content could lead to the increase in the RA solubility.
The purity and yield of the RA gradually increased until the temperature was 25 °C (Figure 3d). The purity and yield of the RA began to decrease at higher than 25 °C. It may be possible that the RA solubility increased fast, so more RA dissolved into the solution at a higher temperature.
The purity and recovery were influenced by multiple factors, and the results were very different. Therefore, a comprehensive investigation with the response surface methodology proceeded (more details can be seen in the supporting material Figures S1 and S2 and Tables S1–S3) and the conditions for the RA crystallization were obtained as follows: 90% of methanol concentration, 1:6 of the solid-liquid ratio, 16 h of crystallization time, and 25 °C. For the RA solid, 99% purity and 80.7% recovery were achieved under the above conditions, as shown in Figure 4. The obtained RA was dried in a drying oven at 100 °C for 24 h, and its methanol residue was measured to be 6 ppm, less than the allowable amount of methanol in food additives. The RA, ST, and RC in the mother liquor after the crystallization were 26.50%, 52.30%, and 17.30%, respectively, and the rest was considered as impurities (IP), as shown in Figure 5. It was noticed that the concentrations of the ST and RC were, respectively, 1.9 times and 2.3 times higher than those of the crude stevia, which could be a benefit to preparing a high purity of ST and to enriching RC from the mother liquor.
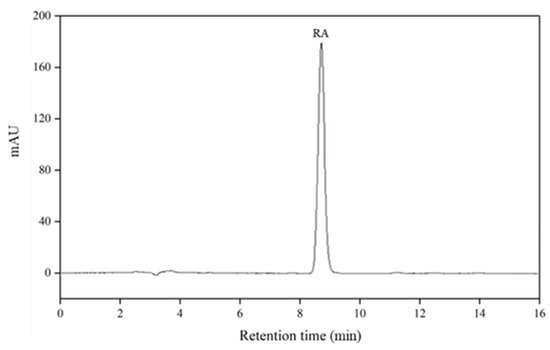
Figure 4.
HPLC chromatogram of the solid phase after first crystallization at 210 nm wavelengths.
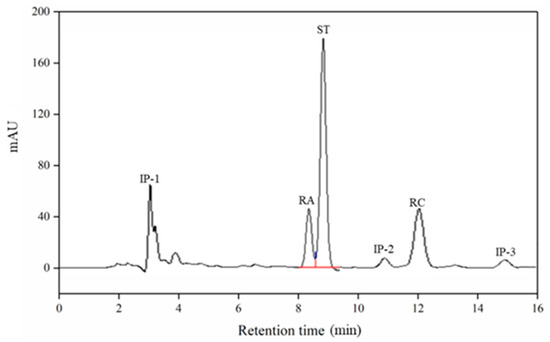
Figure 5.
HPLC chromatogram of the liquid phase after first crystallization at 210 nm wavelengths.
3.3. The ST Crystallization and RC Enrichment from MLS
The solubility behaviors of the RA, ST, and RC were similar to that of the first crystallization in a single solvent (methanol, ethanol, and isopropyl alcohol) or isopropyl alcohol/ethanol solution. Different solvents were investigated, as shown in Table 3. However, the original dissolution balance of various components in methanol aqueous solution was broken after adding a certain amount of isopropyl alcohol, as shown in Figure 6a. In the isopropyl alcohol/methanol solution, the ST solubility decreased more obviously and the ST precipitated faster than the RA. So, the purity of the ST in the solid phase was higher than that of RA, which can be seen in the HPLC chromatogram of the solid phase after the second crystallization shown in Figure 2.
Table 3.
Investigation of different solvents in second crystallization.
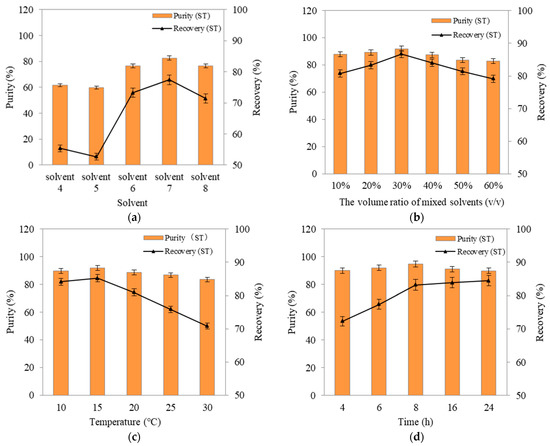
Figure 6.
Effect of (a) solvent composition (1:6 of the solid-liquid ratio, 16 h, and 25 °C), (b) volume ratio of mixed solvents (1:6 of the solid-liquid ratio, 16 h, and 25 °C), (c) recrystallization time (1:6 of the solid-liquid ratio, the volume ratio of mixed solvent (solvent 3/solvent 1 = 30%), and 25 °C), and (d) temperature (1:6 of the solid-liquid ratio, the volume ratio of mixed solvent (solvent 3/solvent 1 = 30%), and 16 h on purity and recovery of ST from MLS.
The purity and recovery of the ST gradually increased as the volume ratio of solvent 3 to solvent 1 increased until 30% (Figure 6b). Then, the purity and recovery of the ST decreased when the volume ratio exceeded 30%.
The variation of the crystallization time had an apparent influence on the recovery in 8 h and less effect on the purity (Figure 6c). The temperature variation showed great influence on the purity and recovery of the ST, as shown in Figure 6d, which was quite different from the first crystallization for the RA. The purity and yield of the ST increased as the temperature increased until 15 °C, but then decreased at higher than 15 °C. It could indicate that the increase of temperature is not conducive to the crystallization of the ST in a certain temperature range, which was quite different from in the first crystallization for the RA. The above results could provide useful information for comprehensive investigation with RSM.
3.4. The Analysis of the RSM for Pure ST
On the basis of the previous single factor experiment, the concentration of crystallization solvent, temperature, and time were selected to design the test scheme. The crystallization conditions were optimized by the response surface methodology to obtain the best conditions for the high purity and higher recovery of the ST from MSL. The influence of the interaction among the three selected factors on the experimental results was also explored.
The results of the variance analysis and credibility analysis of this regression model were shown in Table 4 and Table 5, respectively. Among them, the F value and P value were used to judge the significance of the model and various variables to the response results. According to Fischer’s theory, when the p value is < 0.05, it is significant in statistical analysis, and, when the p value is < 0.01, it is highly significant in statistical analysis. In this study, the quadratic regression model was highly significant (F = 46.75, p < 0.0001), and the loss of fit term was not significant (F = 0.54, p = 0.6778), indicating that the model was significant and no lack of fit existed.
Table 4.
Test design table and test results of response surface method.
Table 5.
Variance analysis of response surface test results.
The software was used to analyze the RSM experiment results in Table 2, and the quadratic regression model between the purity and the three selected factors could be obtained as follows:
where S, A, B, C, and D represented the ST purity, crystallization temperature, crystallization time, and volume ratio of isopropyl alcohol/methanol, respectively.
S = 92.88 − 1.02A − 1.26B − 0.013C + 0.00AB − 0.15AC + 0.025BC + 0.097A2 + 0.27B2 − 0.83C2
The fitting equations of the process were analyzed with the experimental results, and the fitting equations at all the levels were listed in Table 6. According to the data analysis in Table 6, the experiment conforms to the quadratic equation model, and the analysis of variance was shown in Table 5.
Table 6.
Calculation of fitted equations.
According to the RSM results, the optimal crystallization conditions predicted by the model were: crystallization temperature 15 °C, crystallization time 8 h, the volume ratio of mixed solvent (solvent 3/solvent 1 = 30%). Three experimental verifications were carried out based on the conditions of number 9, 11, and 14 in Table 2. A result of 95% purity and 83.6% recovery for the ST was achieved based on the optimized condition, which is shown in Figure 7 and under condition number 9 in Table 4.
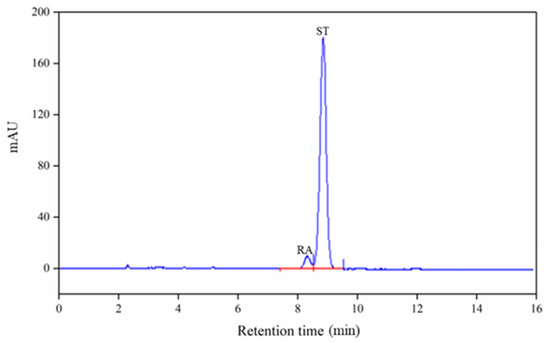
Figure 7.
HPLC chromatogram of the solid phase after second crystallization at 210 nm wavelengths.
It can be seen from Figure 1 and Figure 8 that there is almost no RC precipitation through this method. According to the standard curve analysis, a 25.4% concentration in the liquid phase and near 100% total recovery after the second crystallization were achieved. That means that the RC was successfully enriched by more than three times compared with the crude stevia in Figure 1. Cheaper RC raw material could be provided for the subsequent preparation of very expensive and high-purity RC with this method.
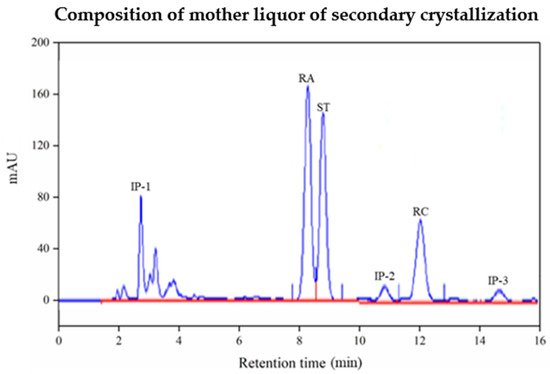
Figure 8.
HPLC chromatogram of the liquid phase after second crystallization at 210 nm wavelengths.
4. Conclusions
A high purity and high recovery of RA can be achieved by the crystallization of crude stevia once with an optimized methanol aqueous solution and other conditions. The solubility behavior of the RA and ST in the methanol aqueous solution could be greatly affected by adding a certain amount of isopropyl alcohol. The high purity and recovery of the ST could be easily achieved by the recrystallization of less value of MLS with a certain concentration of isopropyl alcohol–methanol aqueous solution. The RC does not precipitate nearly in the methanol aqueous solution or the isopropyl alcohol–methanol aqueous solution, so it could be efficiently enriched in the liquid phase after the recovery of the ST. All the solvents can be easily recovered and reused. It could provide an alternative method for the comprehensive utilization of natural stevia resources with the advantages of low-cost solvent and promising industrial application.
Supplementary Materials
The following are available online at https://www.mdpi.com/article/10.3390/separations8110200/s1, Figure S1: (a) Standard curves of RA (b) Standard curves of ST (c) Standard curves of RC title, Table S1: Test design table and test results of response surface method, Table S2: Variance analysis of response surface test results, Table S3: Calculation of fitted equations, Figure S2: HPLC chromatogram of the solid phase after second crystallization at 210 nm.
Author Contributions
Conceptualization, H.S., Y.L., L.P., Z.Y. and S.Y.; Formal analysis, Z.Y.; Supervision, S.Y.; Writing–original draft, Y.L.; Writing—review & editing, H.S. and Y.L. All authors have read and agreed to the published version of the manuscript.
Funding
This work was financially supported by the National Natural Science Foundation of China (Grant Number 81673316).
Institutional Review Board Statement
The study did not require ethical approval.
Informed Consent Statement
The study did not require ethical approval.
Data Availability Statement
All data is contained within the article.
Conflicts of Interest
The authors declare that they have no known competing financial interests or personal relationships that could have appeared to influence the work reported in this paper.
References
- Hanson, J.R.; Oliveira, B.H. Stevioside and Related Sweet Diterpenoid Glycosides. Nat. Prod. Rep. 1993, 10, 301–309. [Google Scholar] [CrossRef]
- Chen, X.; Chen, J.H. Existing Problems of Stevia Industry in China and Their Comprehensive Treatment. J. Manag. Cadre Inst. Minist. Agric. 2014, 3, 14–20. [Google Scholar]
- Geuns, J.M.C. Molecules of Interest Stevioside. Phytochemistry 2003, 64, 913–921. [Google Scholar] [CrossRef]
- Upreti, M.; Smit, J.P.; Hagen, E.J. Single Crystal Growth and Structure Determination of the Natural "High Potency" Sweetener Rebaudioside A. Cryst. Growth Des. 2012, 12, 990–993. [Google Scholar] [CrossRef]
- Kataev, V.E.; Strobykina, I.Y.; Andreeva, O.V. Synthesis and Antituberculosis Activity of Derivatives of Stevia Rebaudiana, Glycoside Steviolbioside and Diterpenoid Isosteviol Containing Hydrazone, Hydrazide, and Pyridinoyl Moieties. Russ. J. Bioorganic Chem. 2011, 37, 483. [Google Scholar] [CrossRef]
- Dewis, M.L.; Kraut, K.J.; Merritt, D.; Salemme, R.F. Methods for Using Rebaudioside C as a Flavor Enhancer. China National Invention Patent CN104144605A, 3 September 2013. [Google Scholar]
- Gregersen, S.; Jeppesen, P.B.; Holst, J.J. Antihyperglycemic Effects of Stevioside in Type 2 Diabetic Subjects. Metabolism 2004, 53, 73–76. [Google Scholar] [CrossRef] [PubMed]
- Chan, P.; Tomlinson, B.; Chen, Y.J. A Double Blind Placebo-Controlled Study of the Effectiveness and Tolerability of Oral Stevioside in Human Hypertension. Br. J. Clin. Pharmacol. 2000, 50, 215–220. [Google Scholar] [CrossRef] [PubMed] [Green Version]
- Jaroslav, P.; Barbora, H.; Tuulia, H. Characterisation of Stevia Rebaudiana by Comprehensive Two-Dimensional Liquid Chromatography Time-of-Flight Mass Spectrometry. J. Chromatogr. A 2007, 1150, 85–92. [Google Scholar]
- Mauri, P.; Catalano, G.; Gardana, C. Analysis of Stevia Glycosides by Capillary Electrophoresis. Electrophoresis 1996, 17, 367–371. [Google Scholar] [CrossRef]
- Jaitak, V.; Gupta, A.P.; Kaul, V.K. Validated High-Performance Thin-Layer Chromatography Method for Steviol Glycosides in Stevia Rebaudiana. J. Pharm. Biomed. Anal. 2008, 47, 790–794. [Google Scholar] [CrossRef] [PubMed]
- Antonio, S.D.; Cleuza, C.S.; Cecilia, E.M. Sweet Diterpenic Glycosides Balance of a New Cultivar of STEVIA REBAudiana (Bert.) Bertoni: Isolation and Quantitative Distribution by Chromatographic, Spectroscopic, and Electrophoretic Methods. Process. Biochem. 2005, 40, 3587–3594. [Google Scholar]
- Zhang, Y.X.; Hu, W.M. Separation of A3 Glycoside from Stevia. Chin. Food Addit. 1998, 49, 256–258. [Google Scholar]
- Li, W.; Yu, Y.Q.; Guo, S.N. A method for Purification of Methyl O-Sulfonamide Benzoate. Chem. Eng. Manag. 2019, 524, 203. [Google Scholar] [CrossRef]
- M, Q.; Xu, X.D.; Lu, W.T.; Chen, Y. The Invention Relates to A Method for Extracting High Purity Reb-a From Stevia at Room Temperature. China National Invention Patent CN102485736A, 6 June 2012. [Google Scholar]
- Zhang, Y.; Chen, T.H.; Shi, Z.Q. Study on the Separation and Purification of Rebaudioside A by Recrystallization. Ion Exch. Adsorpt. 1998, 14, 515–520. [Google Scholar]
- Zhang, Y.; Wang, Y.H.; Shen, J.Z. A Method for Refining Stevia Glycoside St by Industrial High Performance Liquid Chromatography. China National Invention Patent CN103788149A, 14 May 2014. [Google Scholar]
- Yu, Z.B.; Zhou, J.H. The Invention Relates to a Process for Separating Stevioside from Stevia Leaves. China National Invention Patent CN104876982A, 2 September 2015. [Google Scholar]
- Wang, D.J. Then the Mechanism of the Sweetness, Sweetness and Aftertaste of Stevia Glycosides was Discussed. Food Ind. Technol. 2010, 1, 417–420. [Google Scholar]
- Shen, J.; Fan, G.; Yang, J. Crystallization Process of High Purity Rebaudioside A. Light Ind. Mach. 2015, 33, 1–5. [Google Scholar]
- Li, P.; Yang, R.J.; Hua, X. Study on the Process of Recrystallization Separation of Stevia. Food Mach. 2010, 26, 160–163. [Google Scholar]
- Mansur, A.R.; Song, N.E.; Jang, H.W. Optimizing the Ultrasound-Assisted Deep Eutectic Solvent Extraction of Flavonoids in Common Buckwheat Sprouts. Food Chem. 2019, 293, 438–445. [Google Scholar] [CrossRef]
- Hahn, J.J.; Evans, J.C.; Myerson, A.S. Method of Producing Purified Rebaudioside A Compositions Using Solvent/Antisolvent Crystallization. United States Patent US8937168B2, 20 January 2015. [Google Scholar]
Publisher’s Note: MDPI stays neutral with regard to jurisdictional claims in published maps and institutional affiliations. |
© 2021 by the authors. Licensee MDPI, Basel, Switzerland. This article is an open access article distributed under the terms and conditions of the Creative Commons Attribution (CC BY) license (https://creativecommons.org/licenses/by/4.0/).