Abstract
The identification of microscale oil structures formed from deposited oil droplets on the filter front face of a coalescence filter medium is essential to understand the initial state of the coalescence filtration process. Using µ-CT imaging and a deep learning tool for segmentation, this work presents a novel approach to visualize and identify deposited oil structures as oil droplets on fibers or oil sails between adjacent fibers of different sizes, shapes and orientations. Furthermore, the local and global porosity, saturation and fiber ratios of different fiber material of the oleophilic filter medium was compared and evaluated. Especially the local and global porosity of the filter material showed great accordance. Local and global saturation as well as the fiber ratios on local and global scale had noticeable differences which can mainly be attributed to the small field of view of the µ-CT scan (350 µm on 250 µm) or the minimal resolution of approximately 1 µm. Finally, fiber diameters of the investigated filter material were analyzed, showing a good agreement with the manufacturer’s specifications. The analytical approach to visualize and analyze the deposited oil structures was the main emphasis of this work.
1. Introduction
Submicron airborne oil droplets, so-called oil-mists, often occur in industrial applications as an undesired by-product, e.g., in cutting operations, crankcase ventilation or compressed gas cleaning [1]. Because these oil mists pose a risk to the environment and human health they need to be removed [2]. Fibrous filters consisting of several layers of porous, nonwoven micro glass fiber media (in some cases with added synthetic fibers) are typically used to separate these droplets from the gas stream. The mechanisms of droplet deposition and liquid transport in the filter on the meso scale and the evolution of the pressure drop have been investigated in several publications in the past and are well described by the “Jump and Channel Model” by Kampa et al. [3]. This model allows, for example, the quantitative prediction of the pressure drop for multi-layer systems based on experimental data for individual layers. A key finding here is that filter medium is saturated in such a way that the necessary pressure drop for oil transport is built up to a level, where the resulting oil transport rate equals the loading rate of the filter. In accordance with this model, arriving airborne oil droplets deposit on the first fiber layers of the filter medium and start to coalesce to form bigger droplets on the fibers. At a sufficiently high oil load the droplets can collapse on the fibers to form larger structures, such as oil sails between adjacent fibers and subsequently start to form channel-like structures in the medium. These channels are completely saturated regions, in which the oil is transported to the filter back face, where the oil finally drains. When the arriving oil mass equals the mass of the draining liquid a quasi-steady state is reached. Depending on the wettability of the filter material, the formation of a thin oil film at the filter front face (non-wettable) or the filter back face (wettable) is observed [3,4,5].
It is well known that deposited oil on a fiber changes the effective shape of the collector and thus has an influence on the single fiber collection efficiency [6]. The deposition of liquid droplets on single fibers is well understood [7,8]. Mullins et al. [9,10] observed two different droplet shapes mainly dependent on the wettability of the fibers: the formation of barrel shaped droplets on wettable fibers [10] and the formation of clamshell droplets on non-wettable fibers [9]. Kampa et al. [3] confirmed these findings with SEM images of solidified droplets on wettable and non-wettable fibers on the filter interfaces by “freezing” a surrogate liquid (NOA 61, Norland Products Inc., Cranbury, NJ, USA), with comparable fluid properties and atomized droplet spectrum to that of a compressor oil, via rapid polymerization by a UV light source. Figure 1 shows solidified droplets on a wettable filter medium loaded 8 h with the atomized monomer NOA 61 at a typically application-orientated filtration velocity of 25 cm s in an experimental procedure comparable to that of Kampa et al. [3]. As expected most of the droplets on the fibers have the shape of barrels surrounding the fibers, but also the occurrence of some clamshell droplets can be observed. In addition, frozen liquid sails between adjacent fibers or at fiber intersections are visible in the background.
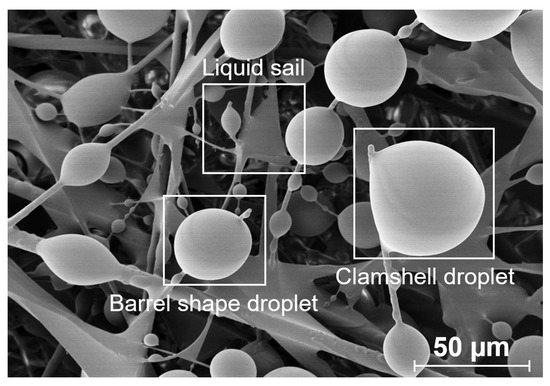
Figure 1.
SEM image of solidified droplets on a wettable micro glass fiber medium (thickness 0.46 mm, porosity 0.95) to illustrate different deposited liquid structures occurring during the filtration of liquid droplets. Front view of the medium showing mainly barrel shape droplets, some clamshell droplets and in the background liquid sails between adjacent fibers. The filter medium was loaded for 8 h with atomized surrogate liquid (NOA 61) at a filtration velocity of 25 cm s and polymerized by a UV light source (procedure according to the experiments of Kampa et al. [3]).
However, no investigations have assessed the impact of deposited microscale oil structures on the filtration efficiency during mist filtration and more specifically their impact during the initial state of the filtration process in a porous filter medium. This includes the investigation of the shape, size and orientation of these coalesced, larger droplets and the formation of bigger oil structures, such as oil sails between adjacent fibers and the occurrence of these structures depending on the global oil saturation of the filters. Additionally, the information on where those oil structures on the upstream side of the filter media occur, is of particular relevance to understand how and where the oil channel formation takes place. Visualizing deposited oil structures on the filter front face at different oil saturation levels and wettablilities will help in future to close this gap in knowledge.
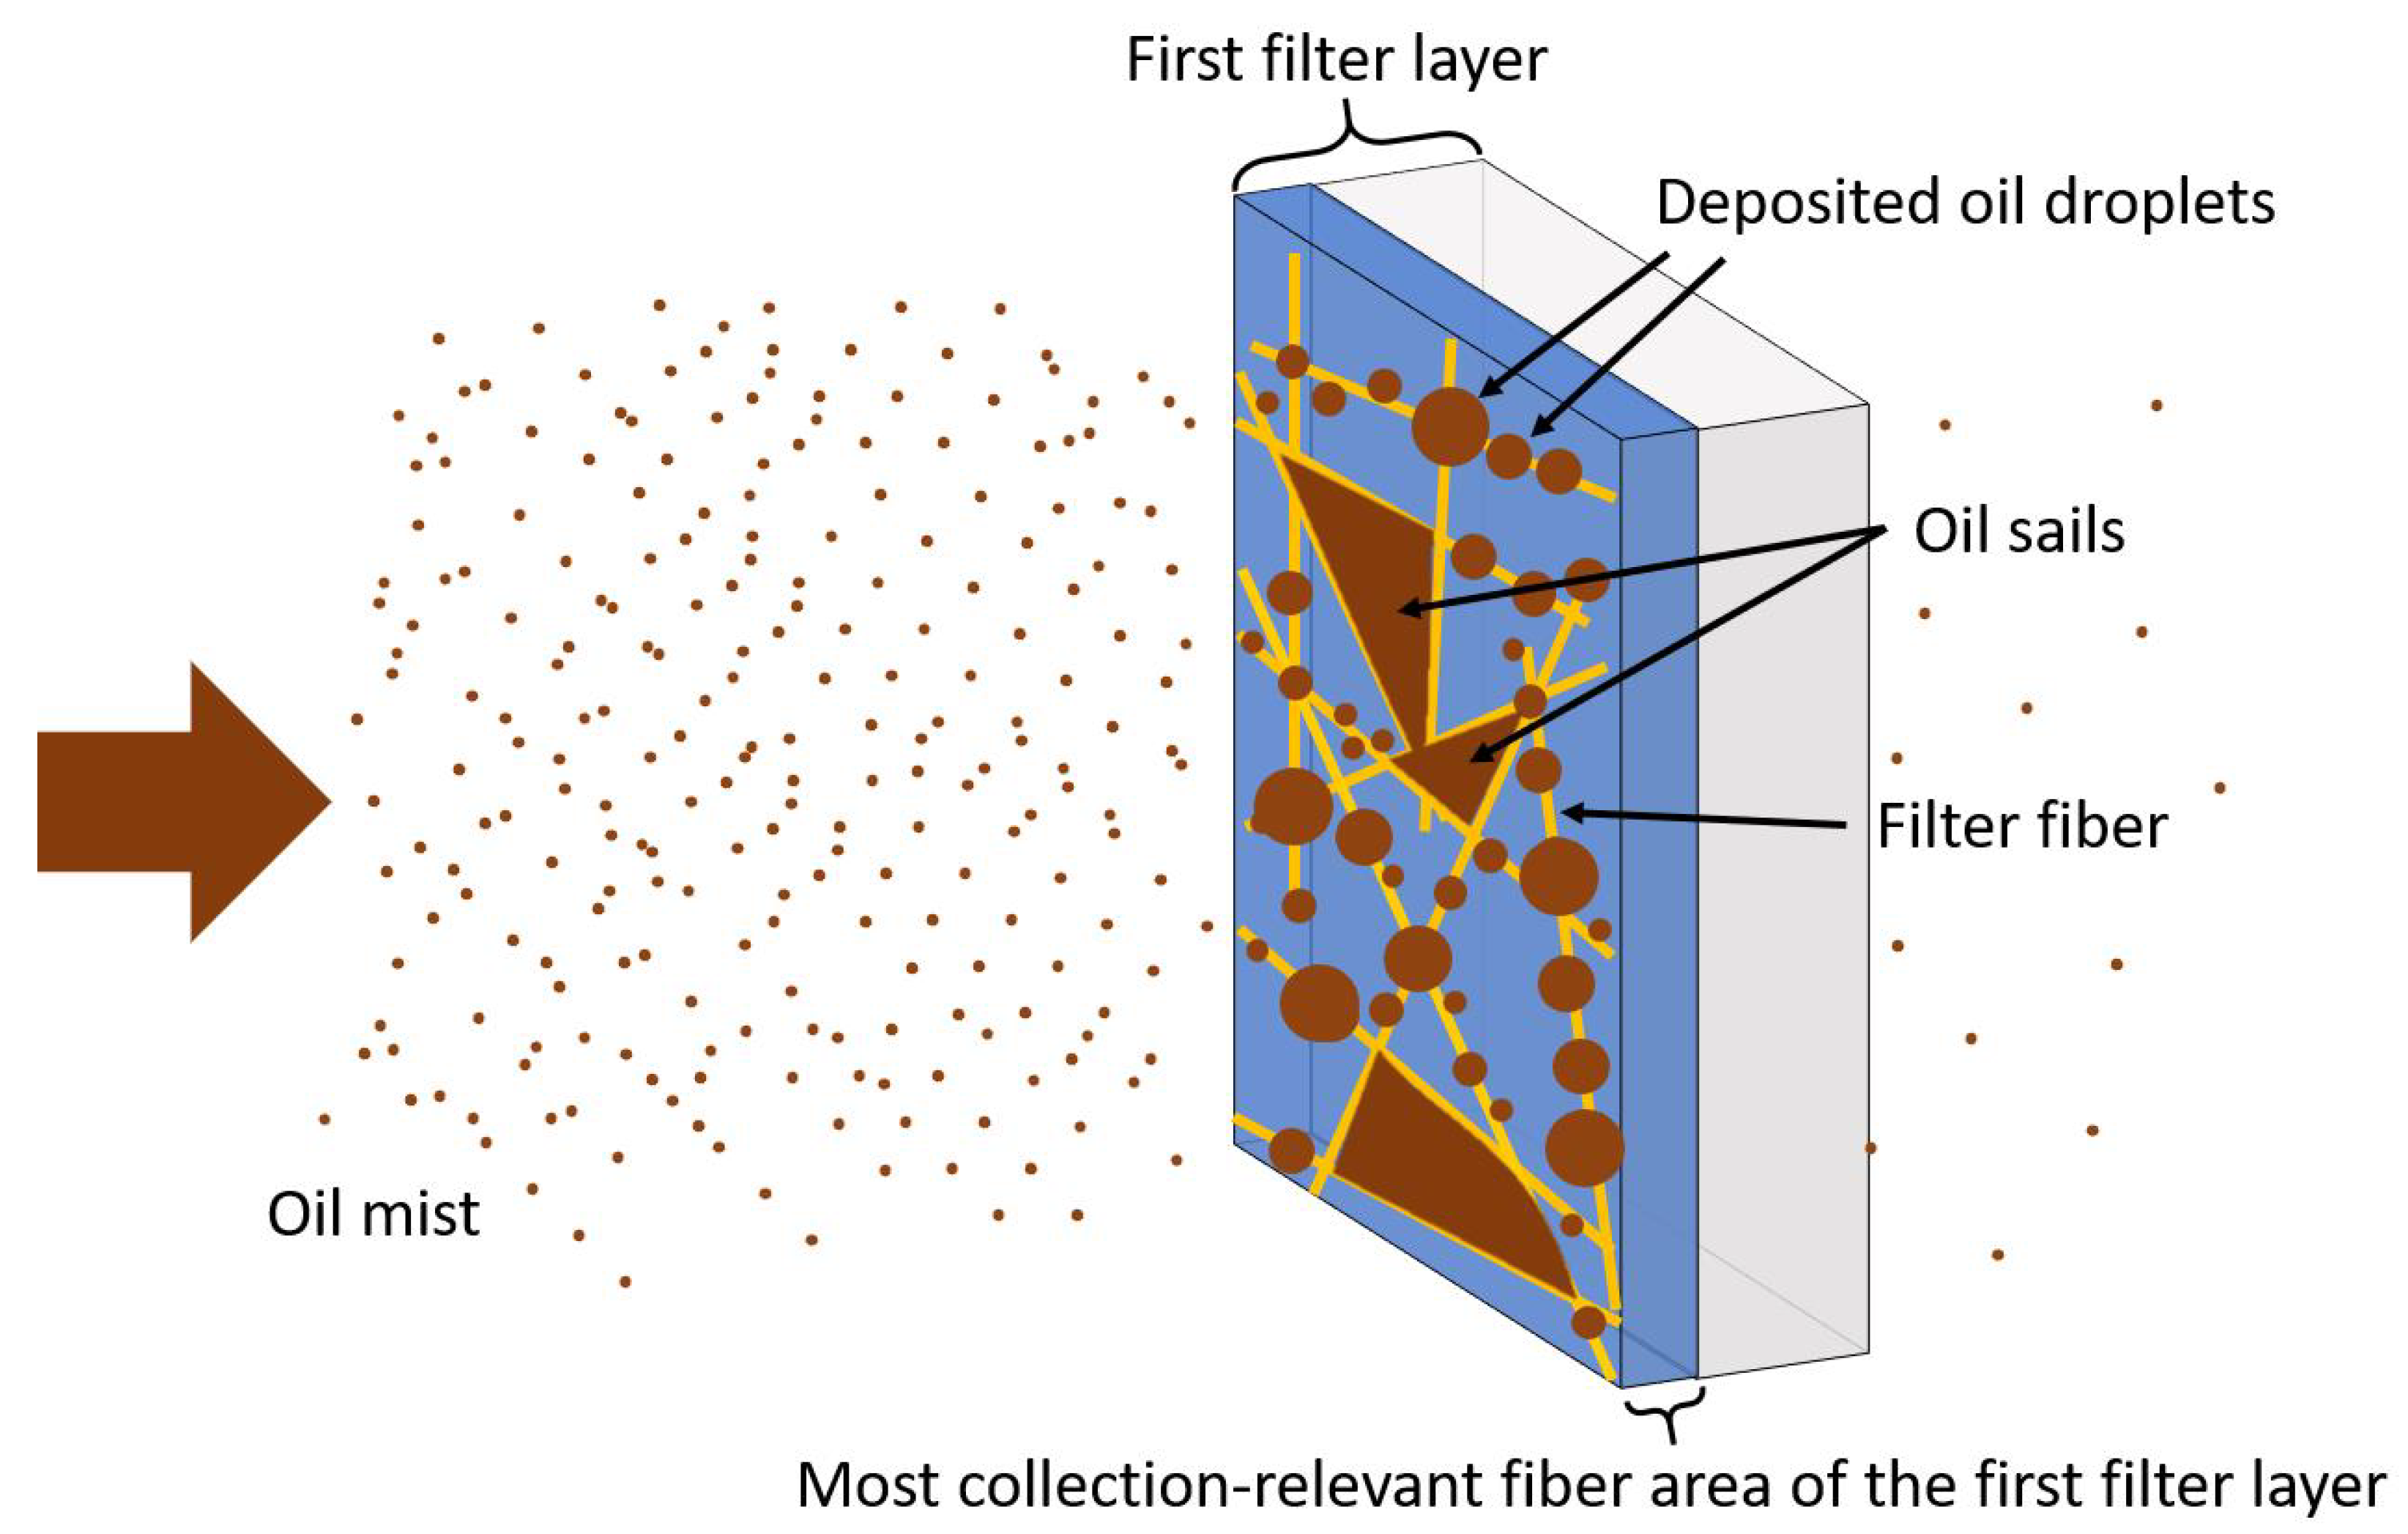
Because the major part of the arriving oil droplets is deposited at the very front face of the filter media [3,11], the oil structures at the upstream face of the filter are of particular relevance. To investigate the exact shape of the deposited oil structures on the filter front face, the additional formation of an oil film as well as the formation of channels inside the medium is undesired. Therefore, thin porous filter media, much thinner than commercially available filter layers, are necessary. The thickness of the filter material must be sufficient for the deposition of oil and the formation of microscale oil structures but shouldn’t be too thick, to avoid the formation of a nearly closed oil film or oil channels for low oil loading rates. Figure 2 schematically shows the formation of microscale oil structures on the very first fiber layers, which are most relevant for collection at the filter front face.
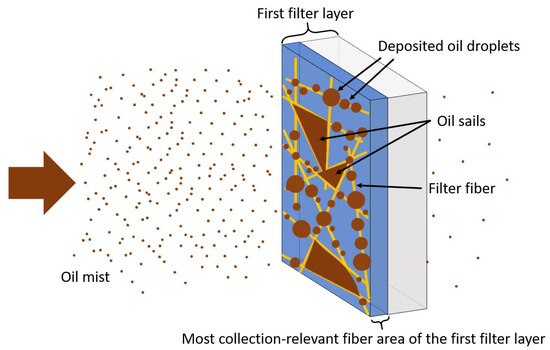
Figure 2.
Schematic illustration highlighting the very first fiber layers, which are most collection-relevant (blue area) on the front face of the first filter layer (blue and grey area) of a multi-layer filter medium. Deposited oil droplets on fibers and oil sails between adjacent fibers are marked. Direction of air flow is indicated by the arrow.
Kolb et al. [12] observed a different shift of the most penetrating particle size (MPPS) for wettable and non-wettable filter media when the quasi-steady state is reached compared to the dry state. The authors assumed, that the different shapes of deposited droplets for wettable (barrel shape droplets) and non-wettable filter material (clamshell droplets) were the reason for this difference. It is known, that on non-wettable fibers the deposited clamshell droplets can rearrange during the filtration process (e.g., due to increasing flow velocity in the filter) and migrate to the downstream side of the fiber to be positioned in the slipstream of the collector [9]. Thereby, the droplets on the slipstream side of the fibers are expected to have less of an impact on the collection area or the free flow area in contrast to the barrel shaped droplets surrounding fibers, which occur mainly on wettable fibers. To investigate the influence of the deposited oil structures on the filtration efficiency, the shape, size, arrangement and relative frequency of the deposited oil droplets and sails have to be examined.
Via two-dimensional measurement techniques e.g., light microscopy, oil structures on filter fibers are hardly or not at all visible because of the high transmission of glass and synthetic (e.g., polyethylene terephthalate (PET)) fibers and deposited oil structures, respectively. SEM imaging techniques are also not practicable, due to evaporation problems of oil during the measurement or the sputtering process. In addition, oil structures inside the filter medium cannot be assessed with 2D measurement techniques.
Due to its ability to provide qualitative and quantitative information on the 3D morphology of a sample, X-ray microtomography (µ-CT) offers an excellent opportunity to investigate microscale structures of various materials [13]. Additional great advantages of the µ-CT technique are the accessibility of high-resolution data (up to 1 µm with modern µ-CT’s) and scanning 3D structures without damaging the specimen [14]. With a high-performance workstation and a corresponding software using artificial intelligence (AI) segmentation tools, even materials with similar densities or atomic numbers can be easily distinguished by this technique. In the past, glass fibers in glass/epoxy laminate [15], synthetic fibers in concrete [16] or porous PPS (polyphenylene sulfide) filters for the filtration of oil/water emulsions [17,18] have already been investigated using a (µ-)CT but there is still no research done for porous filter material consisting of micro glass fibers and/or PET fibers with diameters down to approximately 1 µm loaded with oil mist.
In this work, we present a novel strategy to visualize, analyze and quantify different deposited oil structures at the filter front face with a focus on the analytic process. Therefore, a very thin filter medium (thickness 160 µm) consisting of micro glass and PET fiber were produced by a sheet former and loaded with oil mist. Using µ-CT imaging and an AI deep learning tool for segmentation, we show first results of this technique to investigate local fiber information and deposited oil structures.
2. Material and Methods
2.1. Thin Porous Filter Media
As already mentioned in Section 1, the very first fiber layers of the first filter layer are particularly collection relevant, where the major part of arriving airborne oil droplets deposit. These droplets then start to accumulate, form bigger droplets and oil sails. For this purpose a thin, porous filter material is required, where the formation of channel structures or closed oil films on the filter front or back face can be avoided. Since a material that meets these requirements is not easily commercially available, a thin porous filter medium sheet was explicitly produced for this work with a sheet former. The main applications of sheet formers are found in the quality assurance laboratories of the paper industry, but also in quality control of micro glass fiber and filter media manufacturers and it allows the production of nonwoven fibrous filter media in reproducible quality in lab scale. For the production of thin, porous filter media, based on industrial used material, we chose a mixture of micro glass fibers with diameters of 1.48 µm and 5.00 µm each 20 wt.%, 2.44 µm with 40 wt.% and 20 wt.% of PET fibers with a diameter of 13.6 µm. Note, that the fibers are Gaussian distributed. For the micro glass fibers no detailed information of the manufacturer is given about the fiber distribution (roughly ± 200% of the nominal fiber diameter). For the PET fibers a quality range of ± 0.6 µm in fiber diameter was given by the manufacturer. Figure 3 shows a SEM image of the produced filter material with a basis weight of 7.5 g m, a thickness of approximately 80–100 µm and thus a porosity of about 0.96.
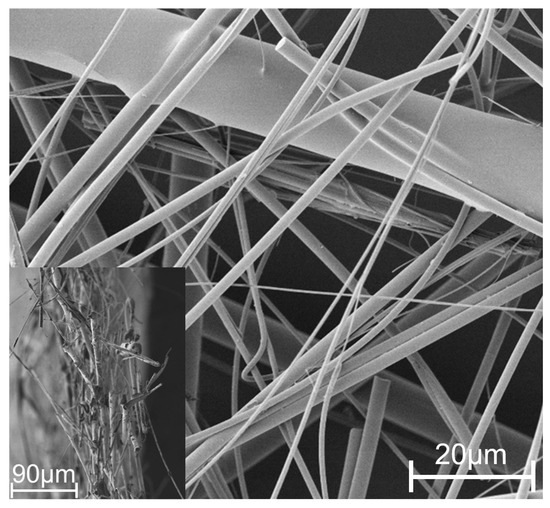
Figure 3.
SEM image of a filter material (upstream view) consisting of 80 wt.% micro glass fiber and 20 wt.% PET fiber with a surface weight of 7.5 g m. Inset: SEM image of the cross-section view of the same filter material.
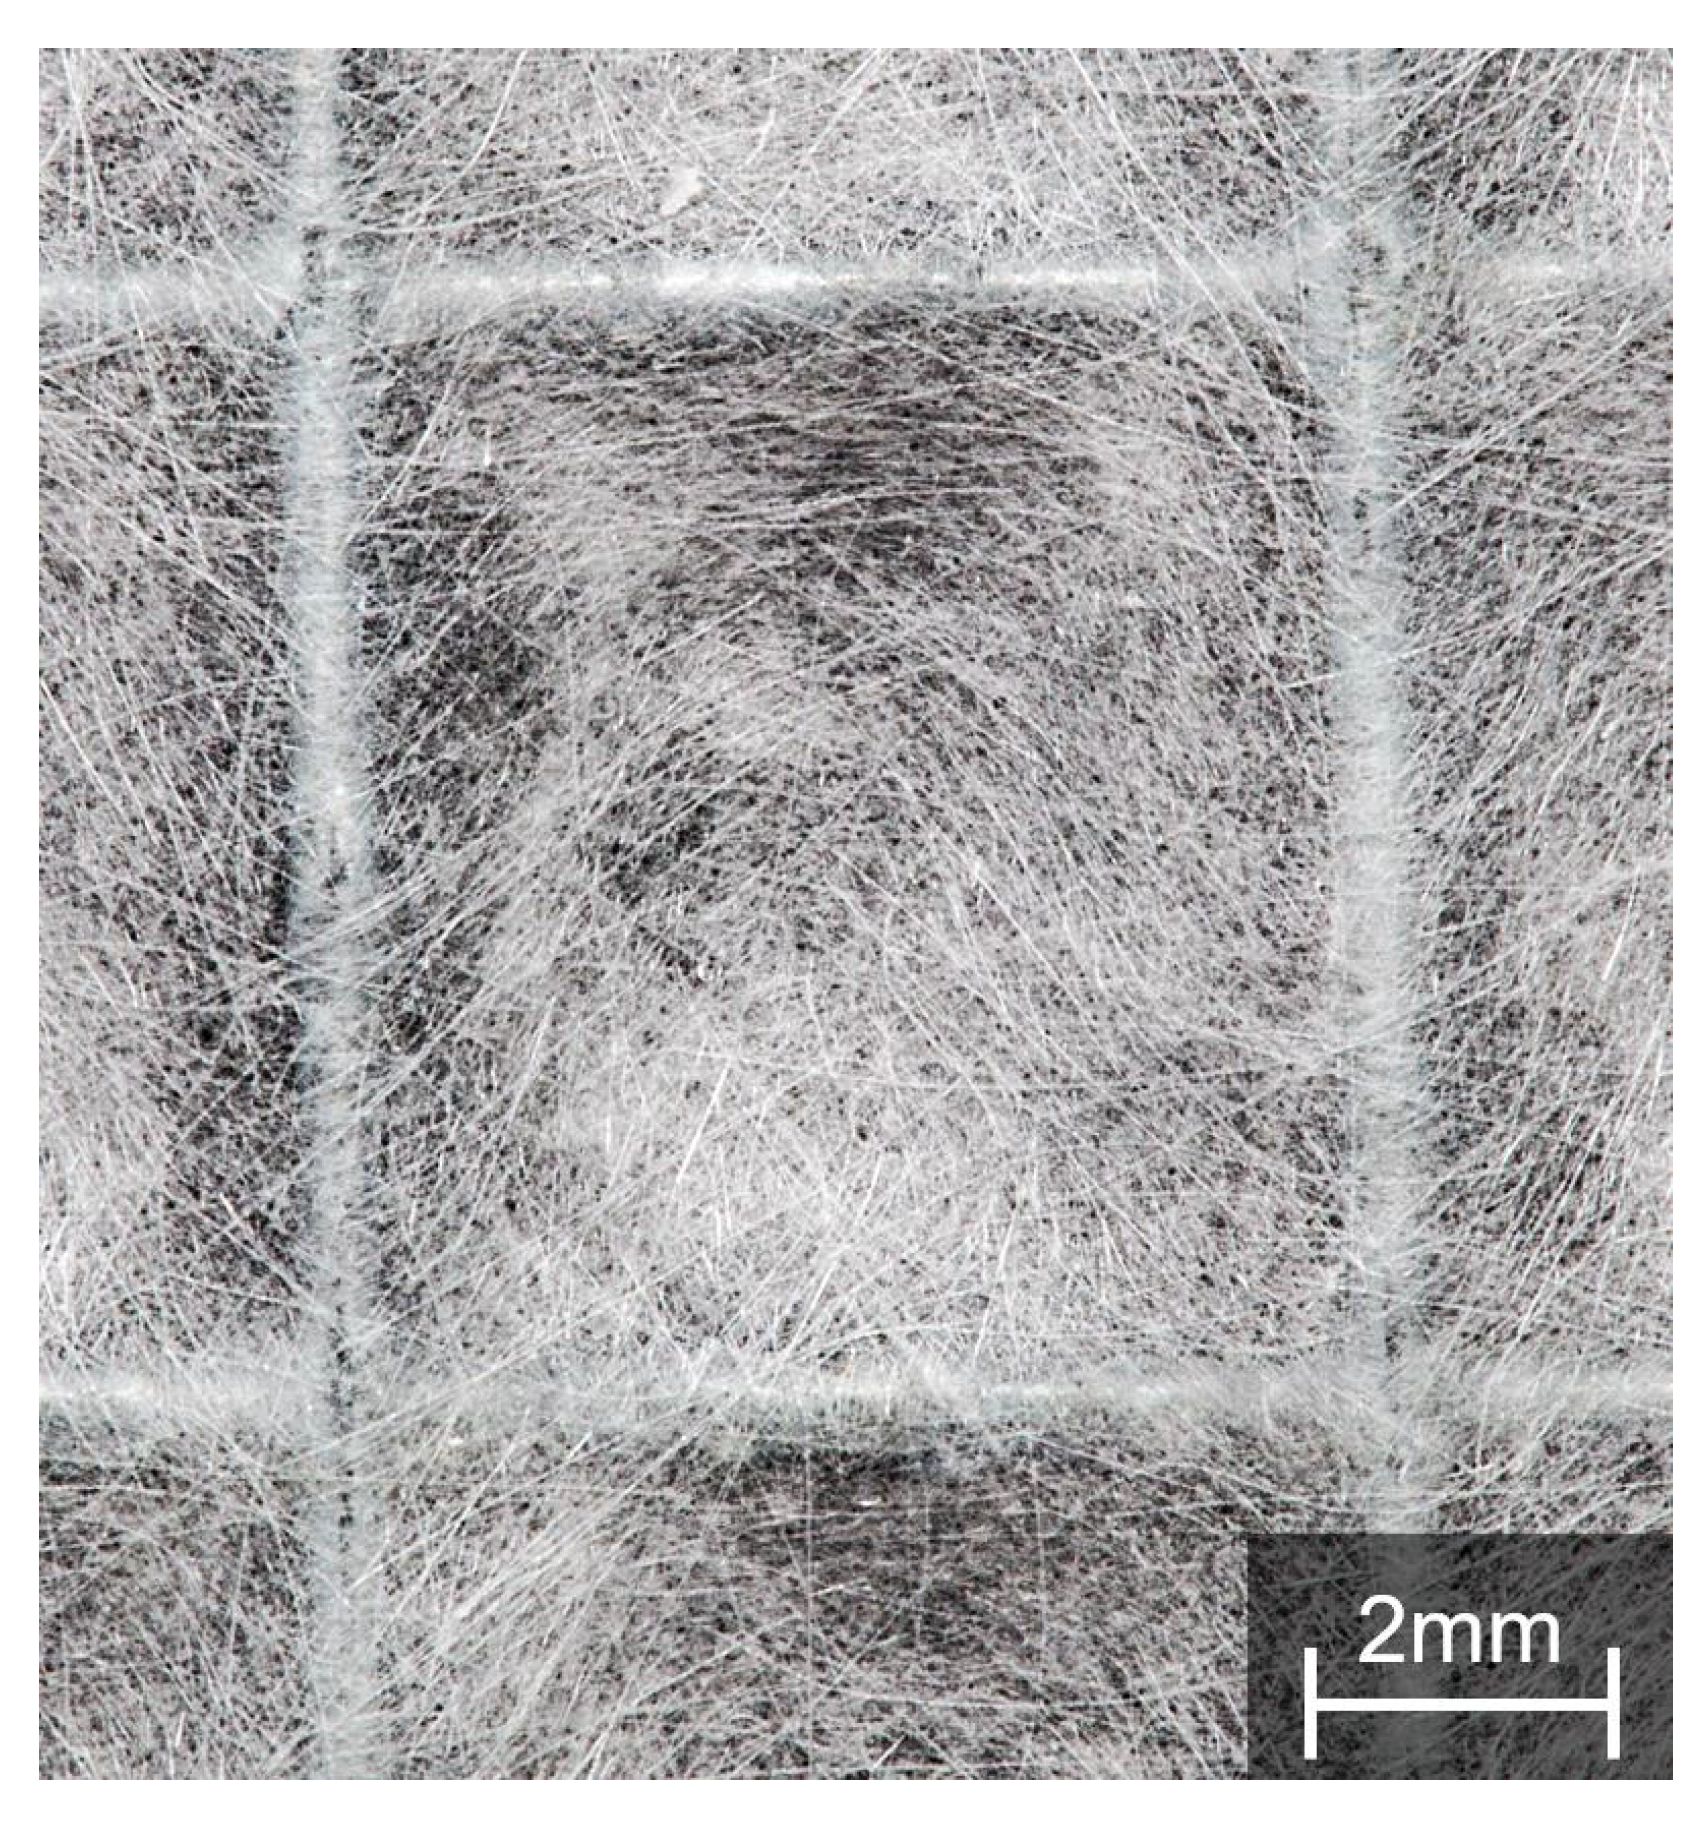
The generated oleophilic (wettable) filter medium has enough collector surface area to examine deposited oil structures linked to structures occurring at the front face of the first layer in industrial used multi-layer filter media, but is thin enough to avoid the formation of a nearly closed oil film or oil channels. However, the basis weight of the medium used in this work was doubled because the mechanical stability of the 7.5 g m medium was not sufficient for oil loading experiments with flow velocities of about 25 cm s. With a weight per unit area of 15 g m and a wide meshed metal support grid with a mesh size of 6.3 × 6.3 mm and a web width of 0.55 mm the medium was appropriate for the experiments presented in this work. Figure 4 shows the upstream side of the produced filter material on the metal mesh supporting grid. In addition, slightly inhomogeneities of the filter material are visible.
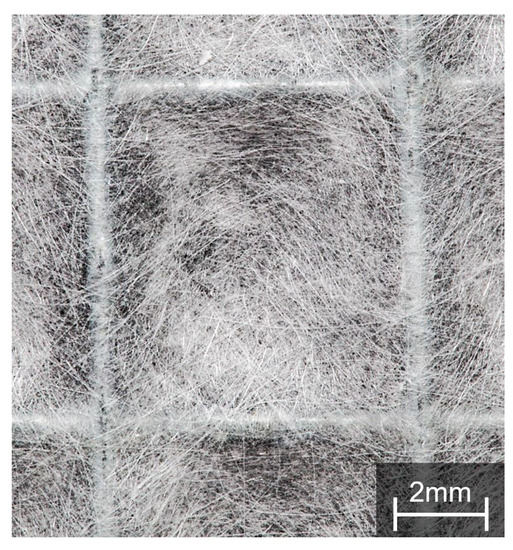
Figure 4.
Image of the produced filter material on a wide meshed metal support grid.
2.2. Oil Deposition on the Thin Porous Filter Medium
A thin porous filter medium with the same fiber mixture as described in Section 2.1 and a basis weight of 15 g m, a thickness of approximately 160 µm, a surface area of 31.36 cm² and porosity of 0.96 was used for the experiments described in this work. The experimental set-up is shown schematically in Figure 5 and the experiments were carried out at ambient temperature (18–22 °C) and pressure (approximately 1013 hPa).

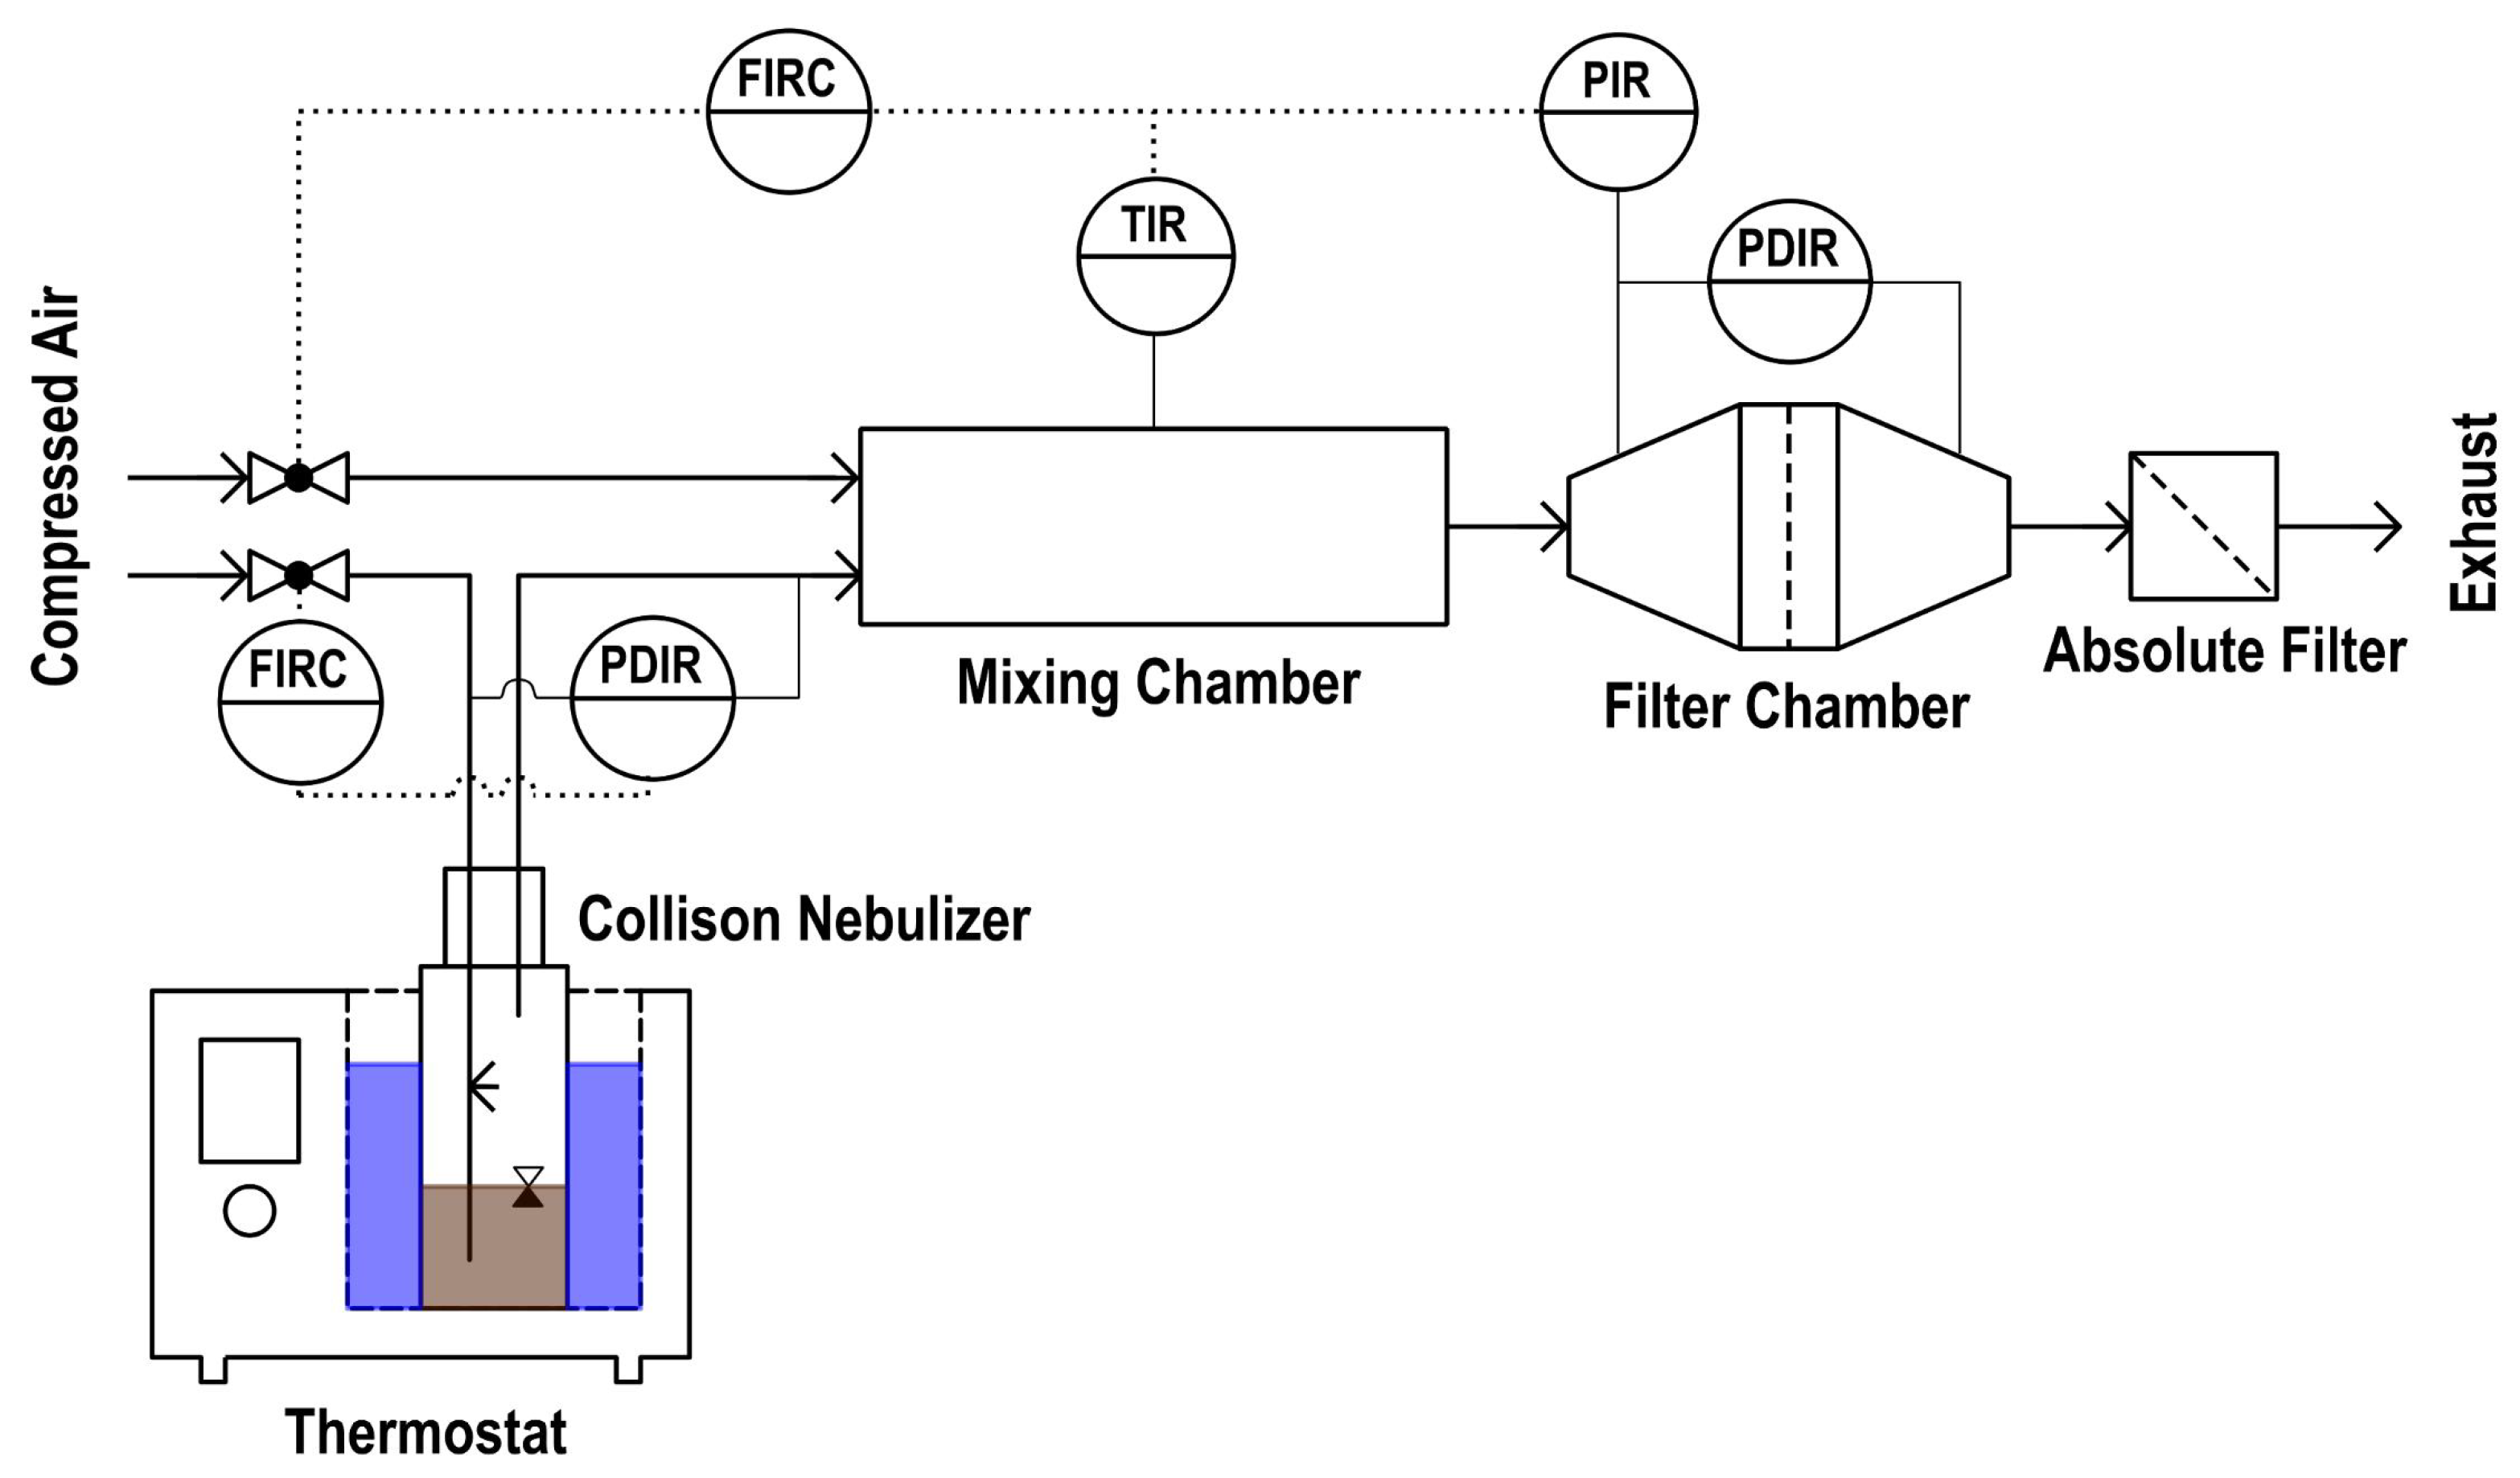
Figure 5.
Experimental set-up for the loading of thin, porous coalescence media with oil mist. Oil mist is generated in a Collision nebulizer at a constant oil temperature (thermostat), mixed with dry compressed air and led into the filtration chamber.
Oil mist was generated by a Collison nebulizer. The oil was a standard compressor oil with a density of 0.87 g cm, a surface tension of 0.03 N m and a dynamic viscosity of 0.13 Pa s at standard conditions. The nebulizer was placed in a thermostat at 22 °C to keep the oil temperature constant. For a constant oil concentration (72 mg m) and droplet size distribution (approximately log-normal distributed with a number-based mean around 0.3 µm and a geometric standard deviation of 1.84), both at the filter chamber, the differential pressure across the nebulizer was held constant at 0.5 bar. In order to keep the filtration velocity constant at 25 cm s the aerosol was mixed in a chamber with dry compressed air. Subsequently, the aerosol was directed to the filter chamber. Because of the very high porosity of the filter medium, the low thickness and a short loading time of only three minutes, no correction of mass transfer (feed rate) due to increase of pressure drop was necessary. Before and after the experiment, the filter material was weighed to calculate the global saturation. The raw gas droplet distribution was measured in a pretest using a Scanning Mobility Particle Sizer (Kr neutralizer, Differential Mobility Analyzer (DMA) model Hauke Vienna Long and Condensation Particle Counter (CPC) model TSI 3775) without any filter material in the filter chamber. During the oil loading process of the thin porous filter media with a duration of three minutes, no remarkable increase of the pressure drop was observed (±0.2 mbar). Even the pressure drop of the dry filter media was at the lower measurement limit of the differential pressure sensor. After the oil loading the filter medium was prepared and processed to the µ-CT as described in Section 2.3.
2.3. -CT Scanning
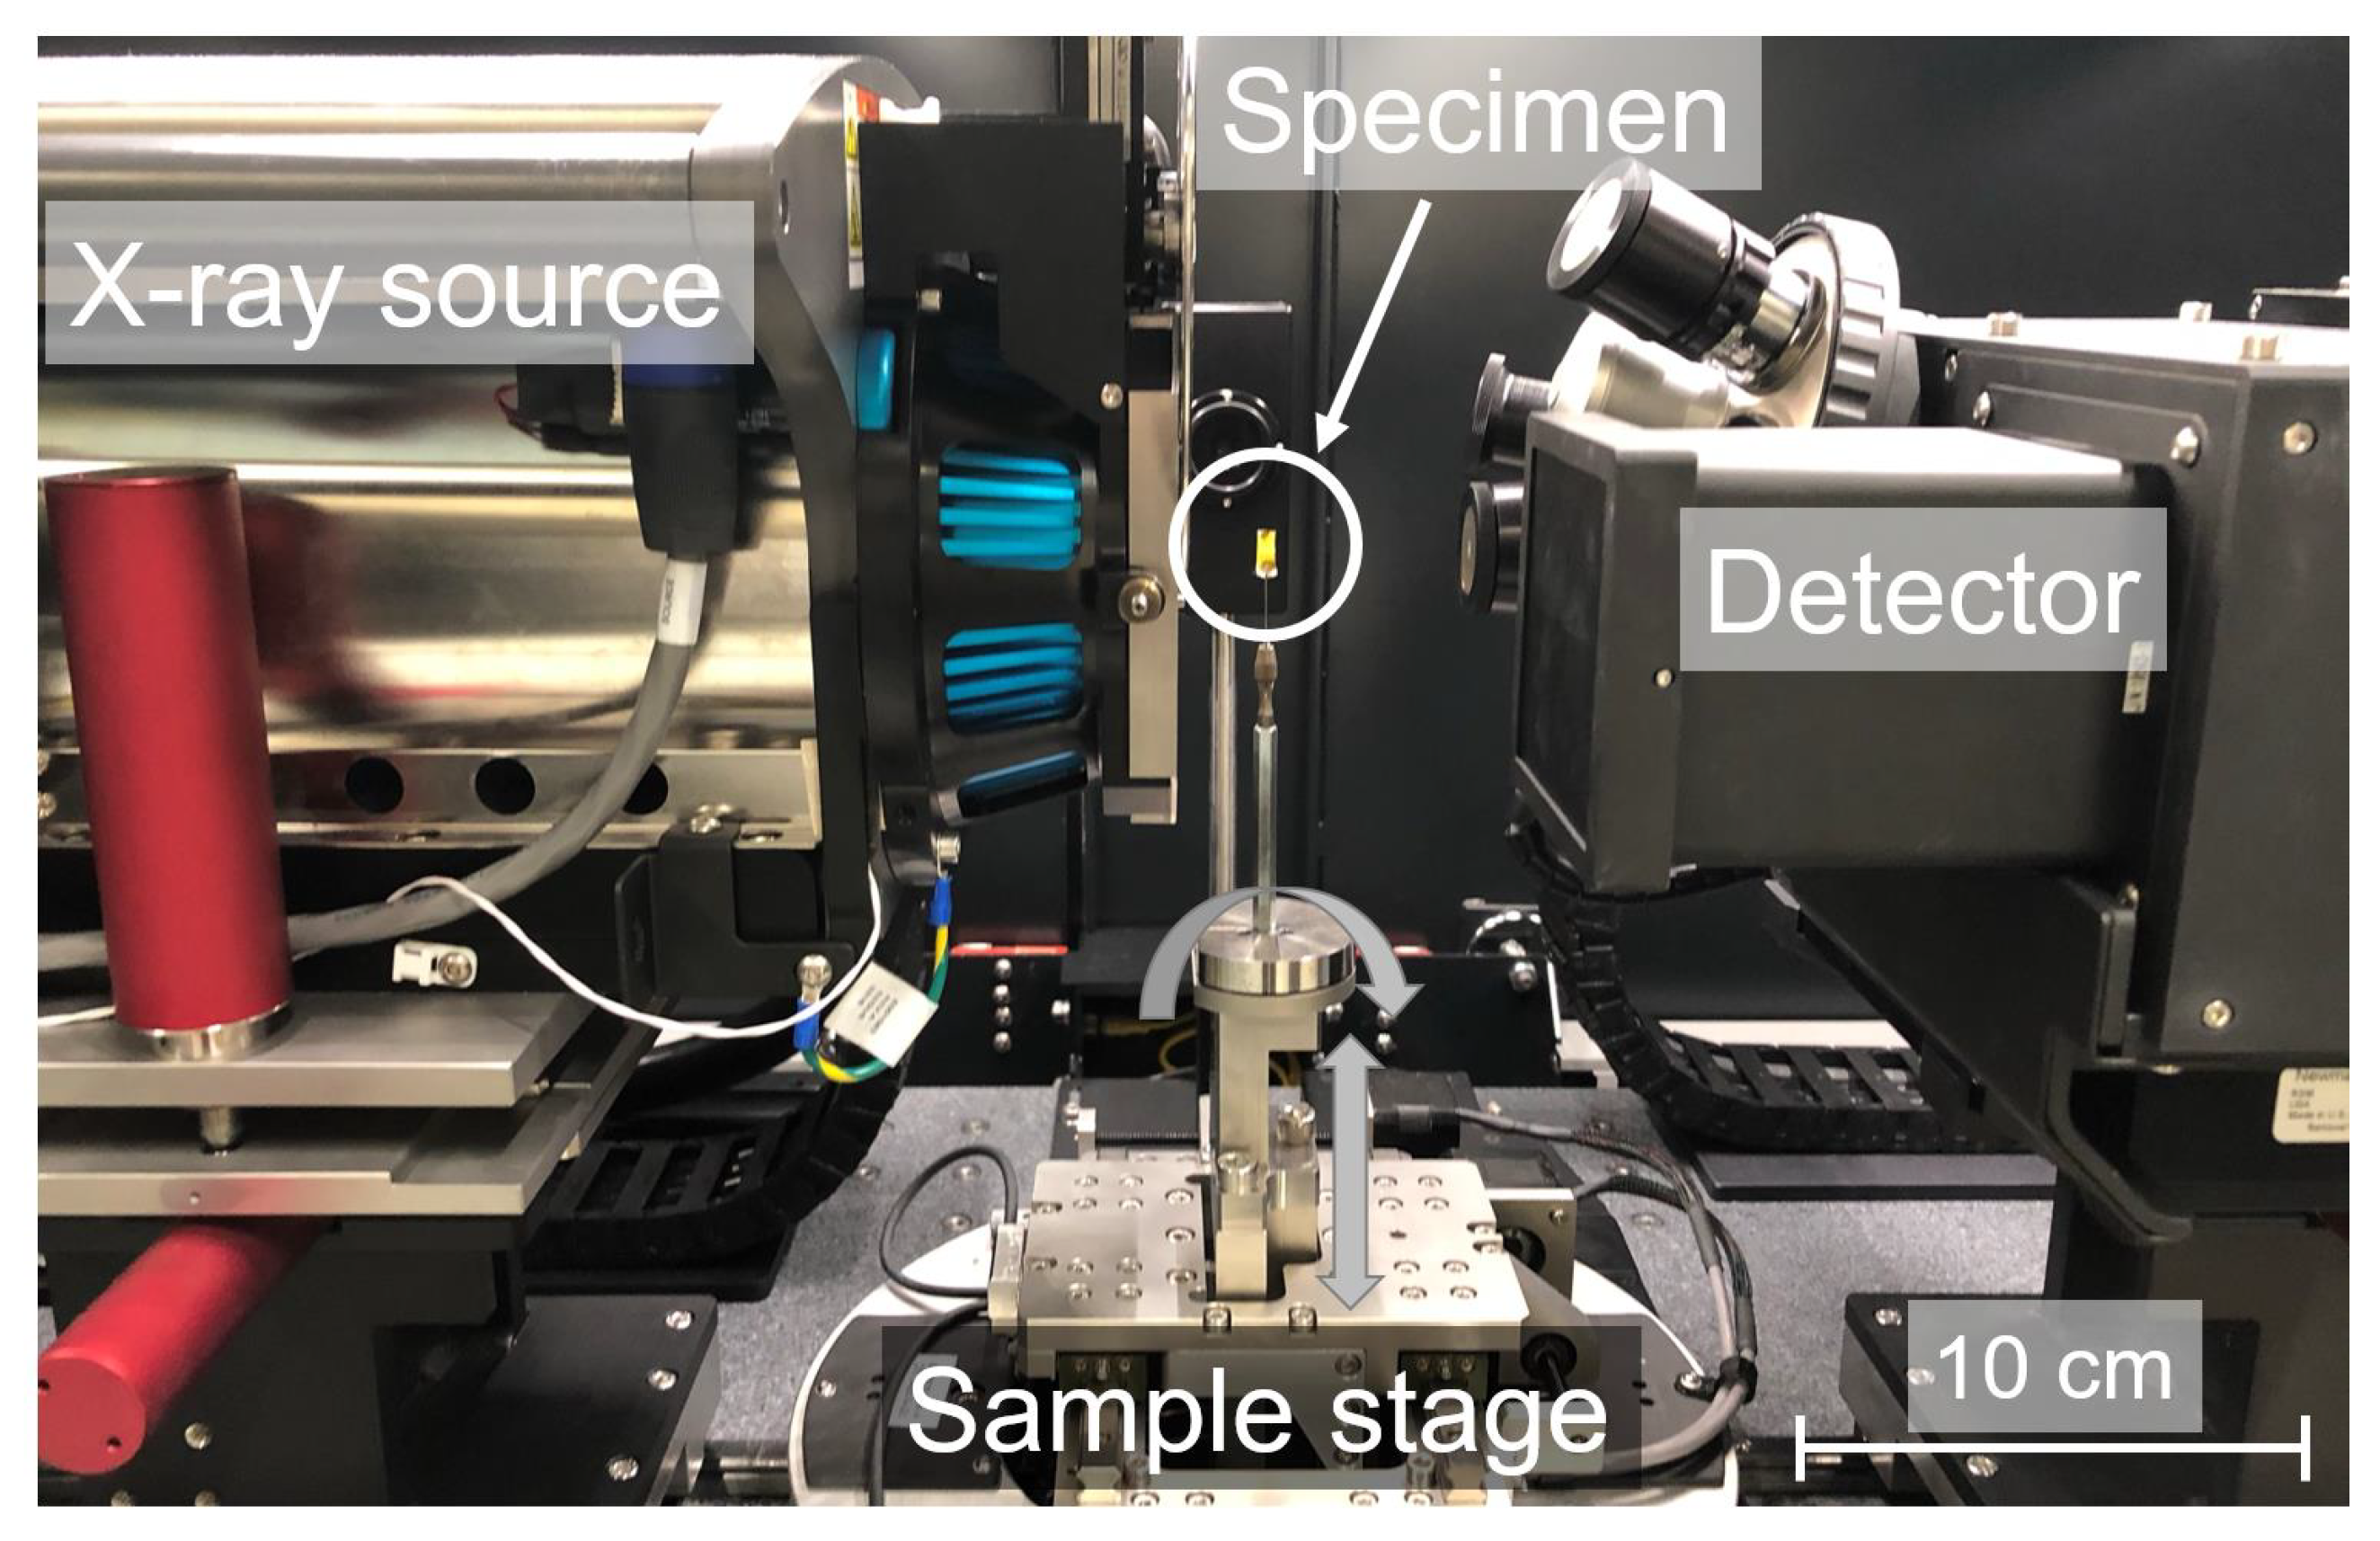
All µ-CT scans described in this work were carried out with a ZEISS Xradia 520 Versa. Using a two-stage magnification technique, the Xradia Versa architecture provides submicron resolution at large working distances and a large range of sample sizes. The main parts of a µ-CT system are the X-ray source, the digital detector and the sample stage, as illustrated in Figure 6.
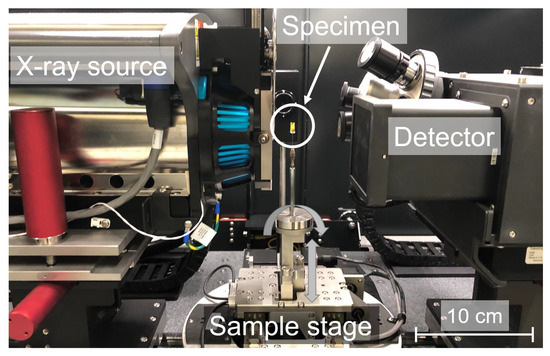
Figure 6.
Picture of the Zeiss Versa 520 µ-CT. On the left side the X-ray source is located, on the right side the digital detector and in the center the sample holder which can be rotated both in height and axially. The specimen (oil loaded filter material) is attached on top of the sample holder.
While X-ray source and detector are stationary, the specimen, which is attached to a sample holder placed on a sample stage, is rotated both in height and axially, while X-ray measurements are being taken. The X-rays are attenuated as they pass through the material depending on its physical properties and captured by the detector array. The obtained data are then reconstructed into a series of 2D slices. Dependent on the material density and atomic number a threshold value for each pixel is selected and the resulting 2D maps reveal the material phases of the sample [14]. Subsequently the 2D stacks are segmented and analyzed with an appropriate software to quantify the different phases of the specimen or to select regions of interest (ROI’s) e.g., voxel counts of different phases, diameters, surface areas, volume/surface ratios and other information concerning shape, size or position of objects.
To obtain the highest possible resolution (up to 1 µm), the analyzed specimen has to be small, as the distance between source and detector can thus be reduced. However, this comes at the cost of a lower field of view.
The oil loaded filter material was carefully cut with scissors to a size of 11 × 6 mm. Cutting the oil loaded filter material can potentially damage the fibers on the sample edges and thus, possibly damage the liquid structures on the fibers. Therefore, the sample was deliberately much larger than the area analyzed by the µ-CT (roughly 0.4 × 0.4 mm). Since the µ-CT analysis takes place at the center of the sample it can be ensured that there is no possible deterioration of the medium structure. After the cutting process the specimen is glued to the top and bottom on a 25 µm thin Kapton (polyimide) support material. Kapton is frequently used as support material for µ-CT measurements because of its excellent transmittance (nearly invisible) for X-rays. In a second step, the specimen was attached to the sample holder on the sample stage and subsequently placed between the X-ray source and the detector, before the acquisition process by the source and detector was started. For the highest resolution and absorption contrast details respectively, the 40× objective of the detector turret was chosen. To reduce the exposure time, the X-ray source as well as the detector were placed as close together as possible. To heat the specimen, a warm-up scan of approximately 2.5 h (binning 2, exposure time 6 s, tube voltage 50 kV, source power 4 W) before the main scan with a duration of roughly 13 h (binning 1, exposure time 25 s, tube voltage 50 kV, source power 4 W) was performed, to avoid thermal expansion during the main scan. In doubling the binning, the voxel size is doubled as well, whereas the scanning time is quartered, what is typically done for warm-up scans. With these settings, a voxel size of 378.1 nm (1001 pictures taken, dimension 912 × 977 × 954 voxels) for the warm-up scan and 193.5 nm (1671 pictures taken, dimension 1832 × 1958 × 1911 voxels) for the main scan was reached. In general, objects in the size of approximately ten times the voxel size can be segmented appropriate. Thus, the minimal resolution of the main scan is roughly 2 µm. Objects showing high contrasts compared to the other phases in the scan can even be segmented with less voxel counts in diameter (e.g. micro glass fibers as it can be seen in Section 3.1 and Section 3.5). The parameters of warm-up and main scan are listened in Table 1.

Table 1.
Parameters of the µ-CT scan.
3. Results and Discussion
3.1. Segmentation Using a Deep Learning Tool
In this work, a thin sheet of porous filter material (free surface area = 31.36 cm², thickness = 160 µm and global porosity = 0.9588) consisting of PET fibers and micro glass fibers of different diameters, was loaded with oil mist for three minutes at an oil concentration of 72 mg m and a flow velocity of 25 cm s. For more detailed information about the used filter material and the experimental procedure see Section 2.1 and Section 2.2.
Because the oil structures and fibers of the oil loaded filter material are in the size range of only a few micrometers and thus, near at the resolution limit, the specimen for the µ-CT scan should be as small as possible to obtain a high resolution, as mentioned in Section 2.3. Therefore, a rectangular piece of 11 mm by 6 mm was cut from the loaded filter sheet at an arbitrarily selected position approximately in the middle of the sheet. This implies that in this case the filter material cannot be used a second time. Subsequently, the specimen was placed carefully on the sample holder between X-ray source and detector.
According to the literature, no rearrangement of deposited oil structures during the preparation and scanning process is expected [19]. This assumption is justified, since even with the most pessimistic estimation of large deposited oil droplets in the size of 100 µm on the smallest fiber in the filter material (1.48 µm), very high flow velocities (>65 m s) would be required to move these droplets [19]. In addition, the specimen was prepared and handled with utmost care (ideally no contact of the filter front or back face with any surfaces) and µ-CT measurements were taken shortly after loading the samples with oil (less than one hour).
To avoid thermal expansion of the sample during measurement, a warm-up scan of approximately 2.5 h before the main scan with a duration of roughly 13 h was done. Because of the high quality (less background noise) and resolution of the main scan, the warm-up scan will not be considered in the following investigations. The acquired data from the µ-CT scans were reconstructed by the software ZEISS XMReconstructor to a stack of 2D slices. For the main scan, a stack of 1911 2D slices was generated. To analyze the different material phases, air, micro glass fiber, PET fiber and oil, the 2D slices must be segmented. Segmentation of the reconstructed images from the µ-CT is the most important step for further processing and analysis. If the data cannot be segmented reasonably (e.g., similar density or atomic number), there is no possibility to differentiate individual material phases by simple threshold (see Figure 7).
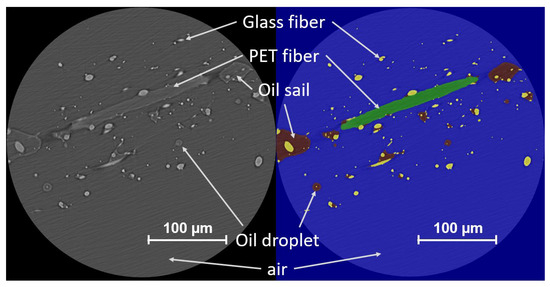
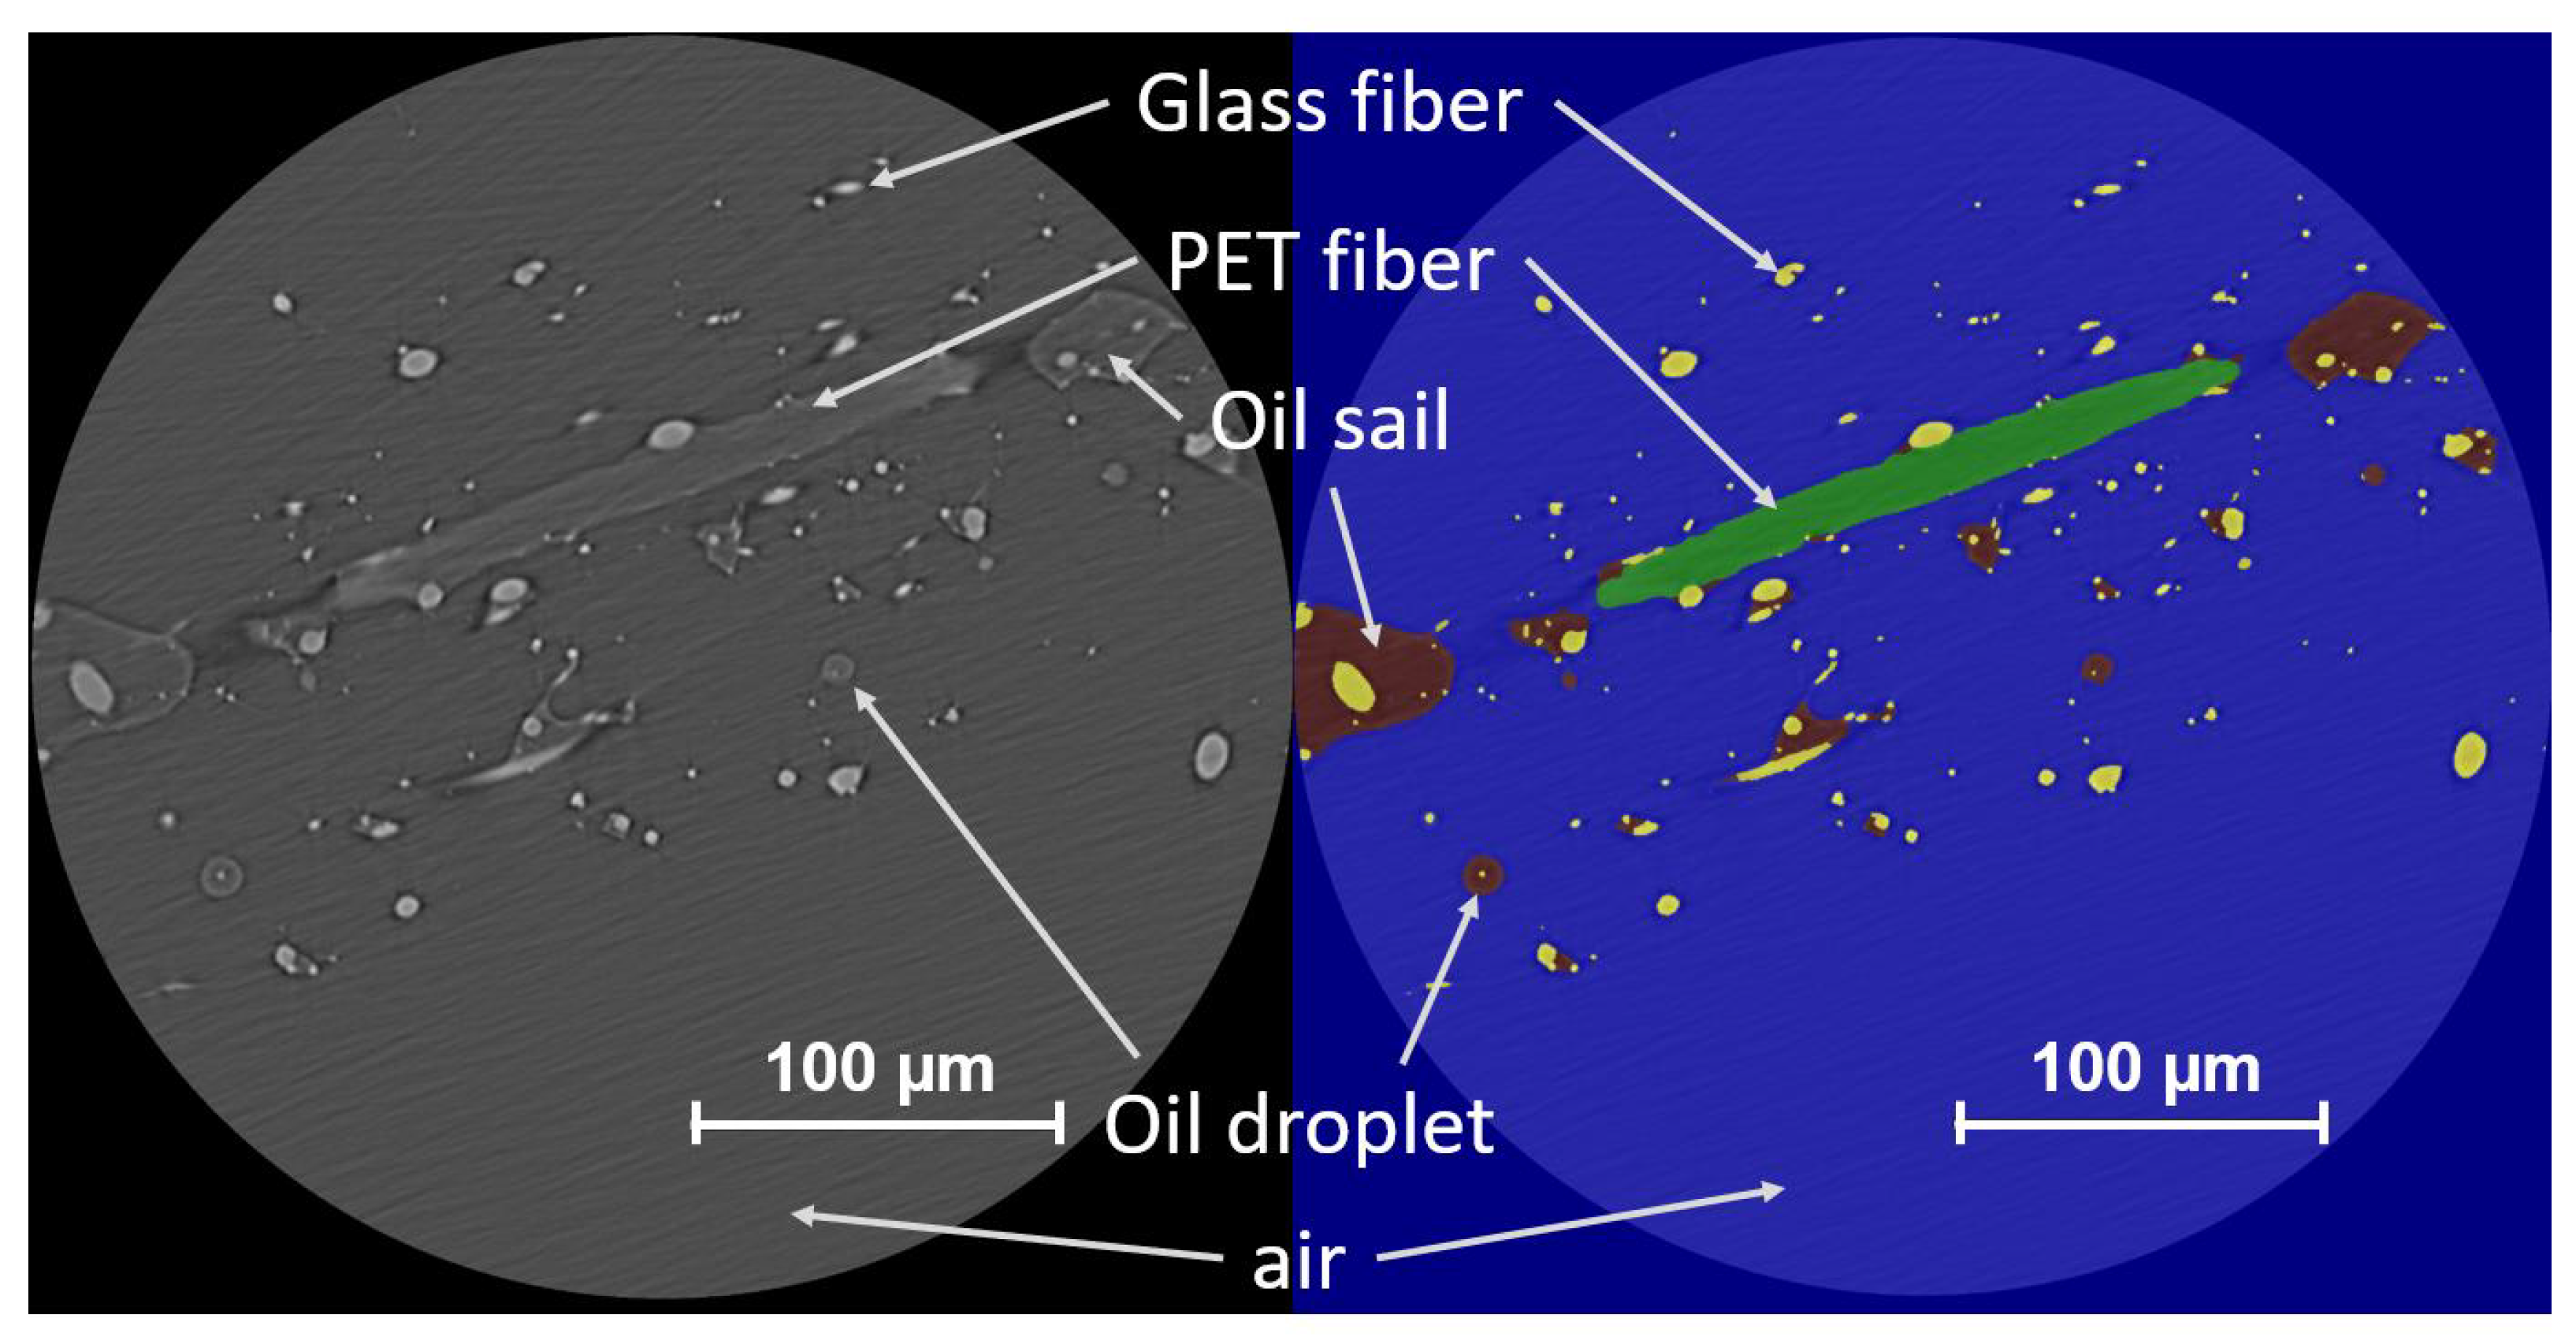
Figure 7.
Left: 2D grey scale map of slice 1021/1911. Right: Segmented slice 1021 using the deep learning tool of Dragonfly (Object Research Systems (ORS) Inc., Montreal, Canada). Micro glass fibers are marked in yellow, PET fibers in green, oil structures as oil sails or droplets in brown and air in blue color.
Therefore, the software Dragonfly, Version 2021.2 for Windows (Object Research Systems (ORS) Inc., Montreal, Canada) was used. For a perfectly sharp contrast around the phases, a sufficient difference (roughly around two to three orders of magnitude) in density between the materials is needed. As especially the densities of PET fibers ( = 1.38 g cm) and oil ( = 0.87 g cm) are within a relatively narrow range of one another, the two phases show similar grey values in the obtained images, seen in Figure 7 on the left side. Furthermore, the identification of oil sails also causes difficulties. The outlines of these oil sails are clearly visible and easy to detect for the human eye on the left picture in Figure 7. But within the outlines, oil has similar grey values compared to air because of a similar transmission of the X-rays, which is a challenge in the segmentation of the phases and cannot be done with a simple threshold. Thus, we chose an AI tool, the Deep Learning Tool integrated in the Dragonfly software, to segment the phases of the oil loaded filter. To train the network, training data must be generated by manually labeling different phases pixel-by-pixel in defined ROI’s. More detailed segmentation is obtained for an increasing set of training data. During training, training data is split into small two-dimensional data patches with customized input pixel size (here 193.5 nm). These patches are randomly processed in so called batches. The size of the batches determines the number of patches in a batch which are passed through the network. For more information on network architecture and deep model types we refer to Ronneberger et al. [20] or Long et al. [21], among others. Best results were obtained with a semantic segmentation for four classes (air, oil, micro glass fiber and PET fiber) and using the U-Net architecture provided by the software. Input parameters are summarized in Table 2.
Table 2.
Input parameters for the Deep Learning Tool of the software Dragonfly.
After the training of the model, the entire stack of the 2D maps can be segmented and analyzed. The result of the segmentation of one exemplary 2D slice (N° 1021 of 1911) seen in Figure 7 on the left, is shown on the right side of the same figure. It can be seen that the segmentation for the slice was satisfactory and the network is able to distinguish between the different phases, including the oil sails which were difficult to segment and needed more training data. After applying the trained network on all 1911 slices, a 3D picture of the specimen was generated. The software is able to show and hide different phases e.g., air, so oil structures on fibers can be seen. Figure 8A illustrates a 3D image of the segmentation with the deep learning tool of Dragonfly.

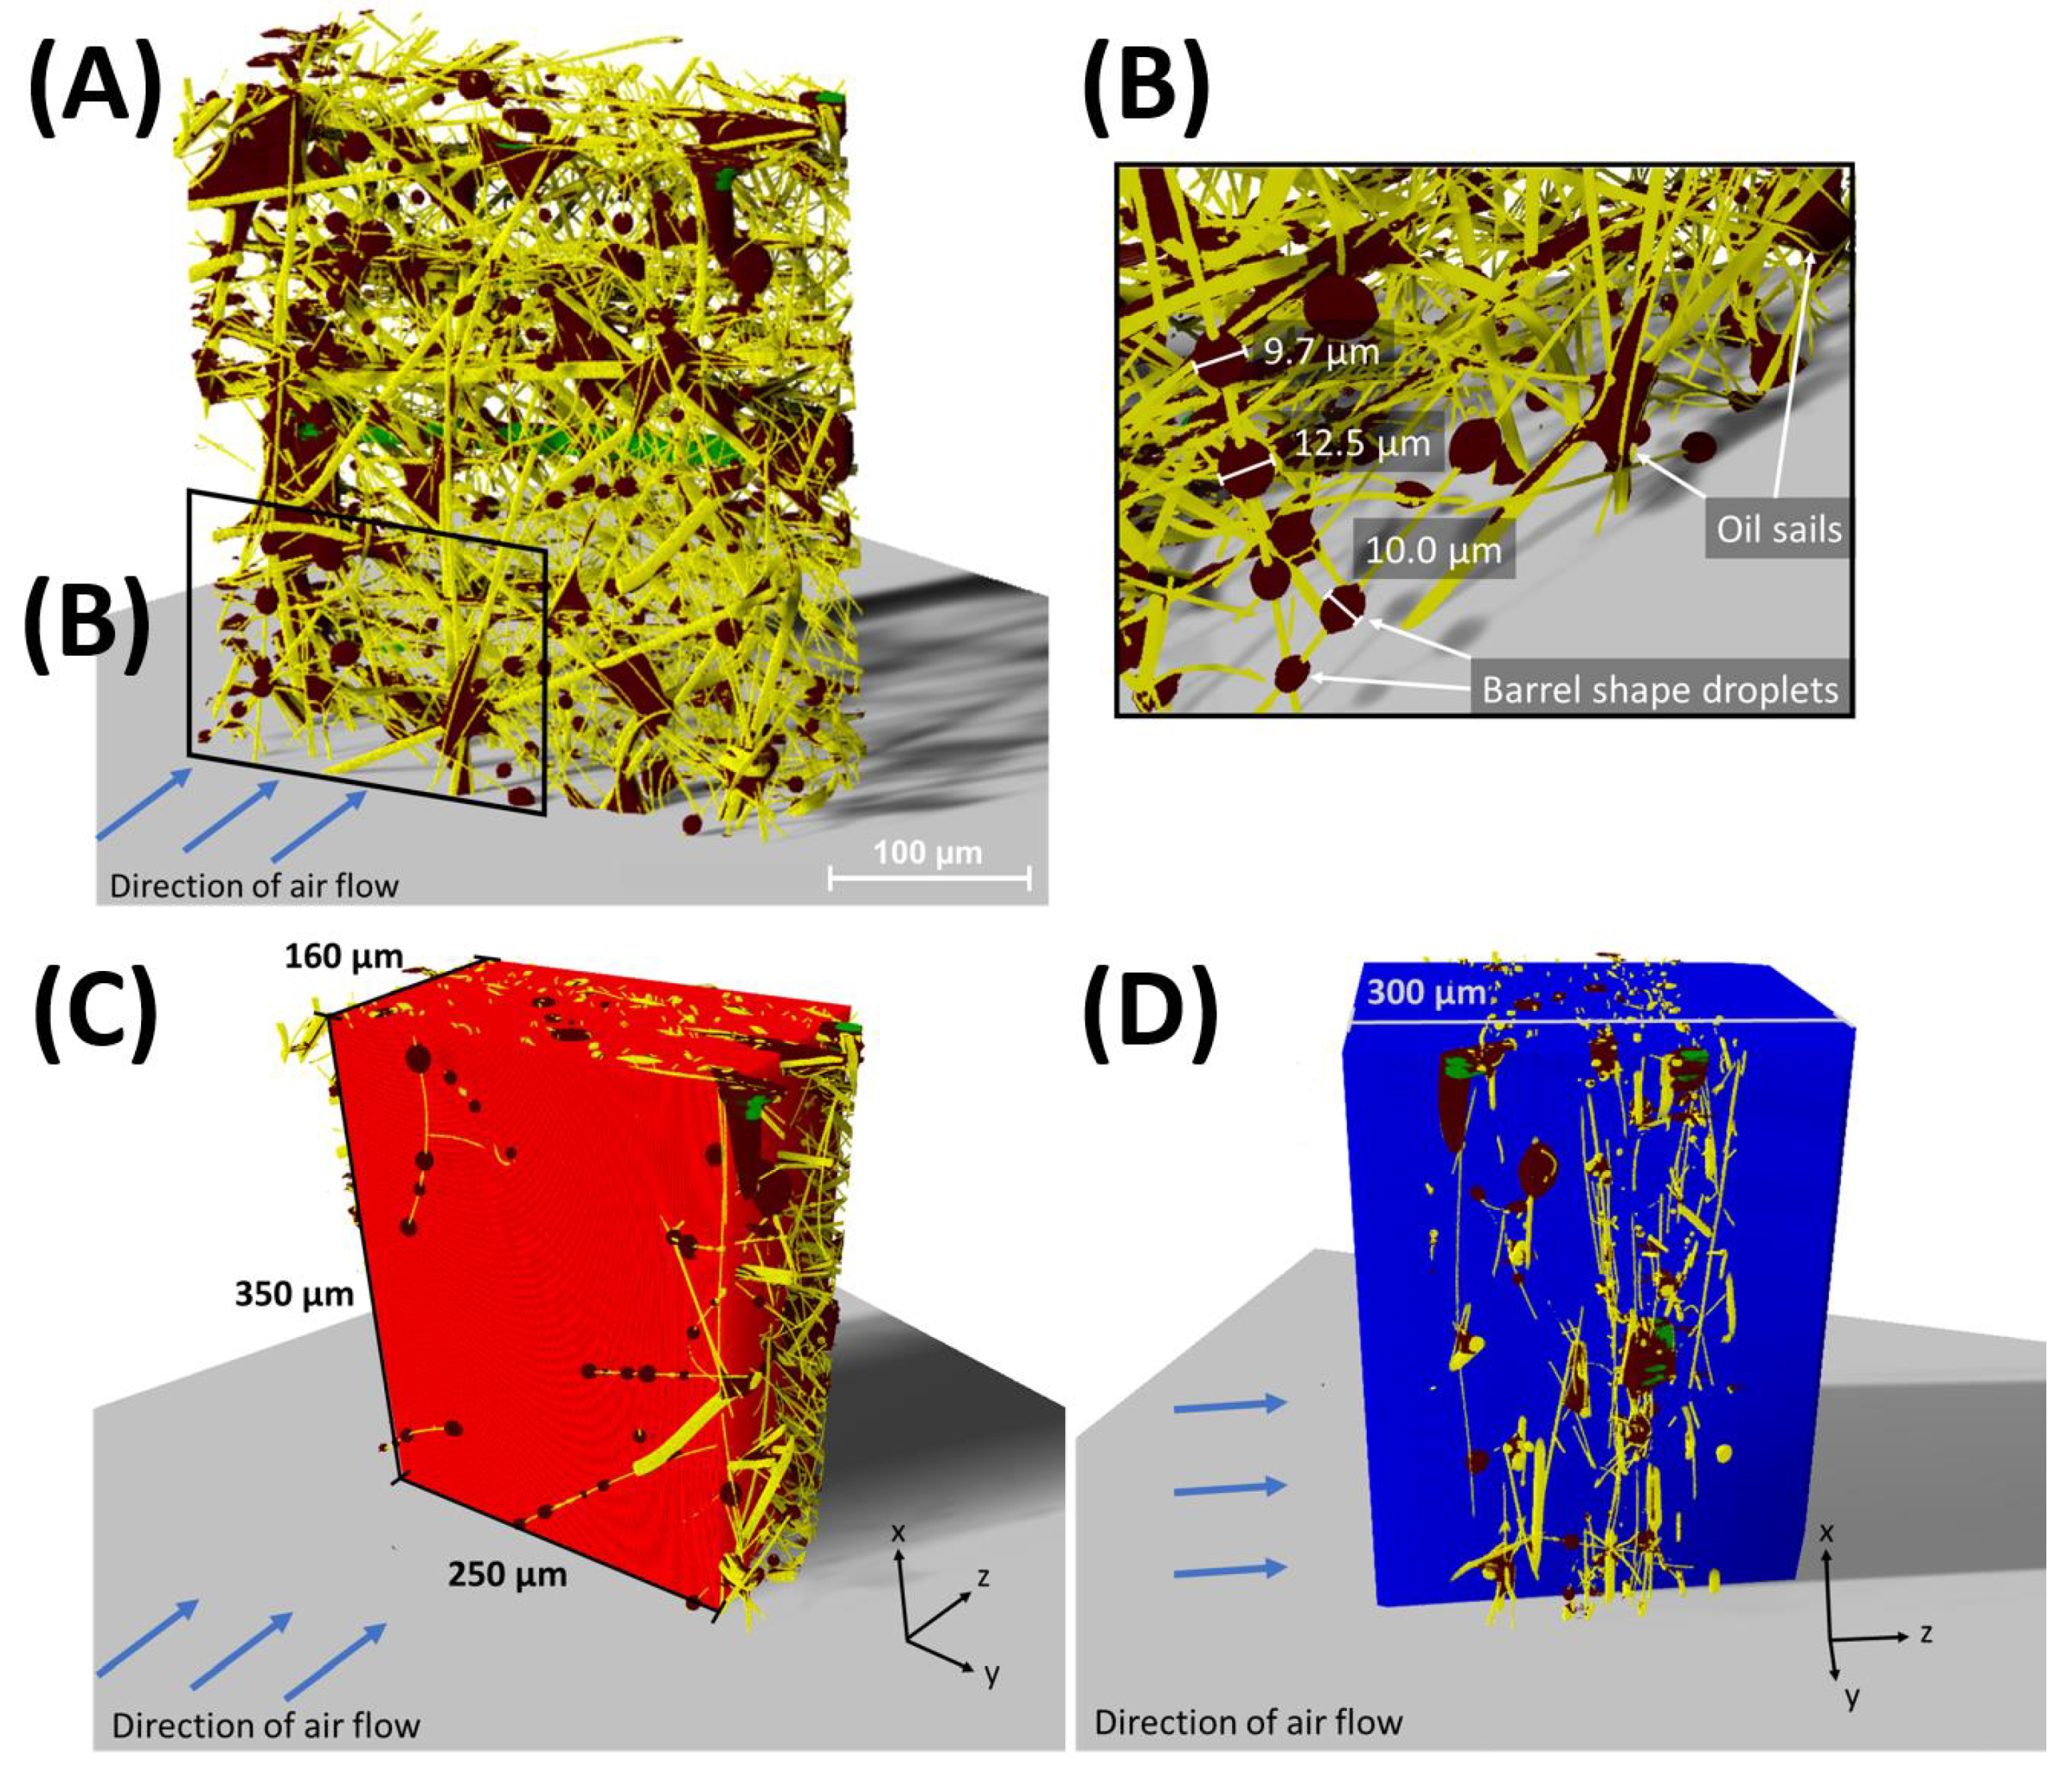
Figure 8.
(A) 3D front view (direction of air flow is indicated by the arrows) of the segmented specimen. Micro glass fibers are shown in yellow, PET fibers in green and oil in brown. (B) Zoom in (A). Barrel shaped oil droplets on micro glass fibers with different diameters between 9.7 µm and 12.5 µm are marked. (C) Virtual cuboid to determine the local porosity of the filter medium. (D) Modified cuboid extended in the direction of filter thickness to determine the local saturation of the oil loaded filter specimen.
Every voxel of the scan has been labeled with one of the four classes and the voxel counts can be read out. With this approach, it is now possible to visualize and analyze different oil structures (brown) on thin, porous filter media. Oil droplets on filter fibers (micro glass fiber: yellow, and PET fiber: green) as well as oil sails between adjacent fibers can be seen. Furthermore, the horizontally orientated PET fiber in Figure 8A, obtaining approximately identical grey values compared to oil on the 2D grey scale map, is segmented satisfactorily. In Figure 8B, oil droplets with diameters of 9.7 µm, 10.0 µm and 12.5 µm and oil sails are exemplarily marked. It can be seen that the oil droplets occur in the expected shape of barrels due to the oleophilic fibers. In general, droplets in the shape of clamshells (see Figure 1) were only observed on the PET fiber with a diameter of 13.6 µm and oil sails are mostly oriented perpendicular to the air flow direction between adjacent fibers. Note, that the deposited oil droplets are clearly smaller than 100 µm, supporting the assumption that there is no rearrangement of deposited oil structures during the preparation and scanning process.
3.2. Porosity of the Filter Medium
With the obtained information about voxel counts of air, PET and micro glass fibers and oil from the segmentation in Section 3.1, the porosity of the filter medium can be compared with the filter porosity determined through the basis weight ( in mass per surface area), density of the micro glass and PET fiber mixture and thickness of the medium (, determined through the µ-CT scan) according to Equation (1). For the calculation via the voxel counts, a ROI is generated to form a virtual cuboid (350 µm × 250 µm × 160 µm) enclosing the filter medium (see Figure 8C ). Using the same thickness of 160 µm for both methods avoids uncertainties in defining the filter surface plane on the upstream and downstream side in the µ-CT scan.
Subsequently, the porosity is easily determined using the total number of voxels identified as micro glass fiber () and PET fiber () divided by the sum of all voxels (, , and ) in the cuboid (see Equation (2)). The result of the calculation is the local porosity of the unloaded filter media specimen ( = 0.9663) which is in good accordance with the global porosity = 0.9588 determined by Equation (1).
Considering the fact, that only a very small volume of the filter material was examined, the accordance of the local and global porosity of the filter material is absolutely satisfactory.
3.3. Saturation of the Filter Media
In a next step, the global saturation by weighing and the local saturation , determined from the voxel fractions of the µ-CT scan, were compared. Global saturation of the filter sheet was calculated according to Equation (3) by weighing the filter sheet after the oil loading process (oil concentration 72 mg m, filtration velocity 25 cm s and oil loading time of three minutes).
For estimating the local saturation of the filter medium, the cuboid from Section 3.2 is extended in the direction of the filter thickness (± z-direction) from 160 µm to 300 µm to ensure all oil in the z-direction can be included in the calculation of the local saturation. Thus, oil structures on single fibers sticking out of the red cuboid in Figure 8C, can be included in the oil voxels determined in Section 3.2 to ( equals plus all oil voxels in the extended cuboid) and divided by the number of voxels identified as air in the 160 µm cuboid from Section 3.2. The extended cuboid including all oil voxels in the z-direction is shown in Figure 8D. Adding up the oil structures outside of the red cuboid to determine the local saturation is permissible and necessary, as the weighing also includes oil structures that are located on protruding fibers.
As indicated in Equation (4), the local saturation = 0.0216 is roughly 60% less than the global saturation = 0.0536. The main reasons for the lower local saturation are the small examined area in the µ-CT scan (roughly 0.003% of the total loaded filter material), the limited resolution of the scan (oil structures < 1 µm on fibers are not possible to identify) and segmentation errors like misdetection of oil structures as fibers or air.
Based on the literature, small droplets in the energetically preferred shape of clamshells should appear on fibers, when the droplet volume is low and the contact angle between droplet and fiber is high [22,23,24]. Because the clamshell droplets on wettable fibers are just stable for droplet diameters smaller than the fiber diameter and high contact angles, these structures are just very rarely observed in this work due to the minimum resolution of the µ-CT, and those that were detected were found mostly on the PET fibers with the biggest diameter of 13.6 µm. It is also possible that small oil fragments remain on filter fibers when larger droplets collapse and coalesce on the fibers or oil sails form between adjacent fibers, supporting the hypothesis of a lower observed local saturation.
Because of the long scan duration only one position of the specimen was evaluated in this work. For reliable information about the local saturation a thorough investigation at different positions of the oil loaded filter medium must be done. In addition, a variation of the global saturation, meaning the consideration of different oil loading states, is planned for future works by the authors.
3.4. PET and Micro Glass Fiber Ratio
The thin porous filter medium used in this work consisted nominally of 80 wt.% micro glass and 20 wt.% PET fibers. In Figure 8A it can be seen, that the fiber content of micro glass is apparently higher than PET (only one PET fiber in the center of the scan). By comparing the number of voxels identified as micro glass fibers and PET fibers, a PET fiber content of only 5.5 wt.% was determined. A possible reason for the small amount of PET fiber is most likely the very small examined filter area. Due to the lab scale production process (see Section 2.1), a non-ideal dispersion of the different fibers could be a reason for an inhomogeneously distributed fiber content in the filter material. Figure 4 supporting the hypothesis of a rather spatially inhomogeneous distribution of the different fibers. Due to the significantly higher diameter of the PET fibers compared to micro glass fibers and the clear difference in transmission, confusion between PET and glass fiber can be ruled out.
3.5. Comparing Fiber Diameters of the -CT Scan with the Manufacturer’s Specifications
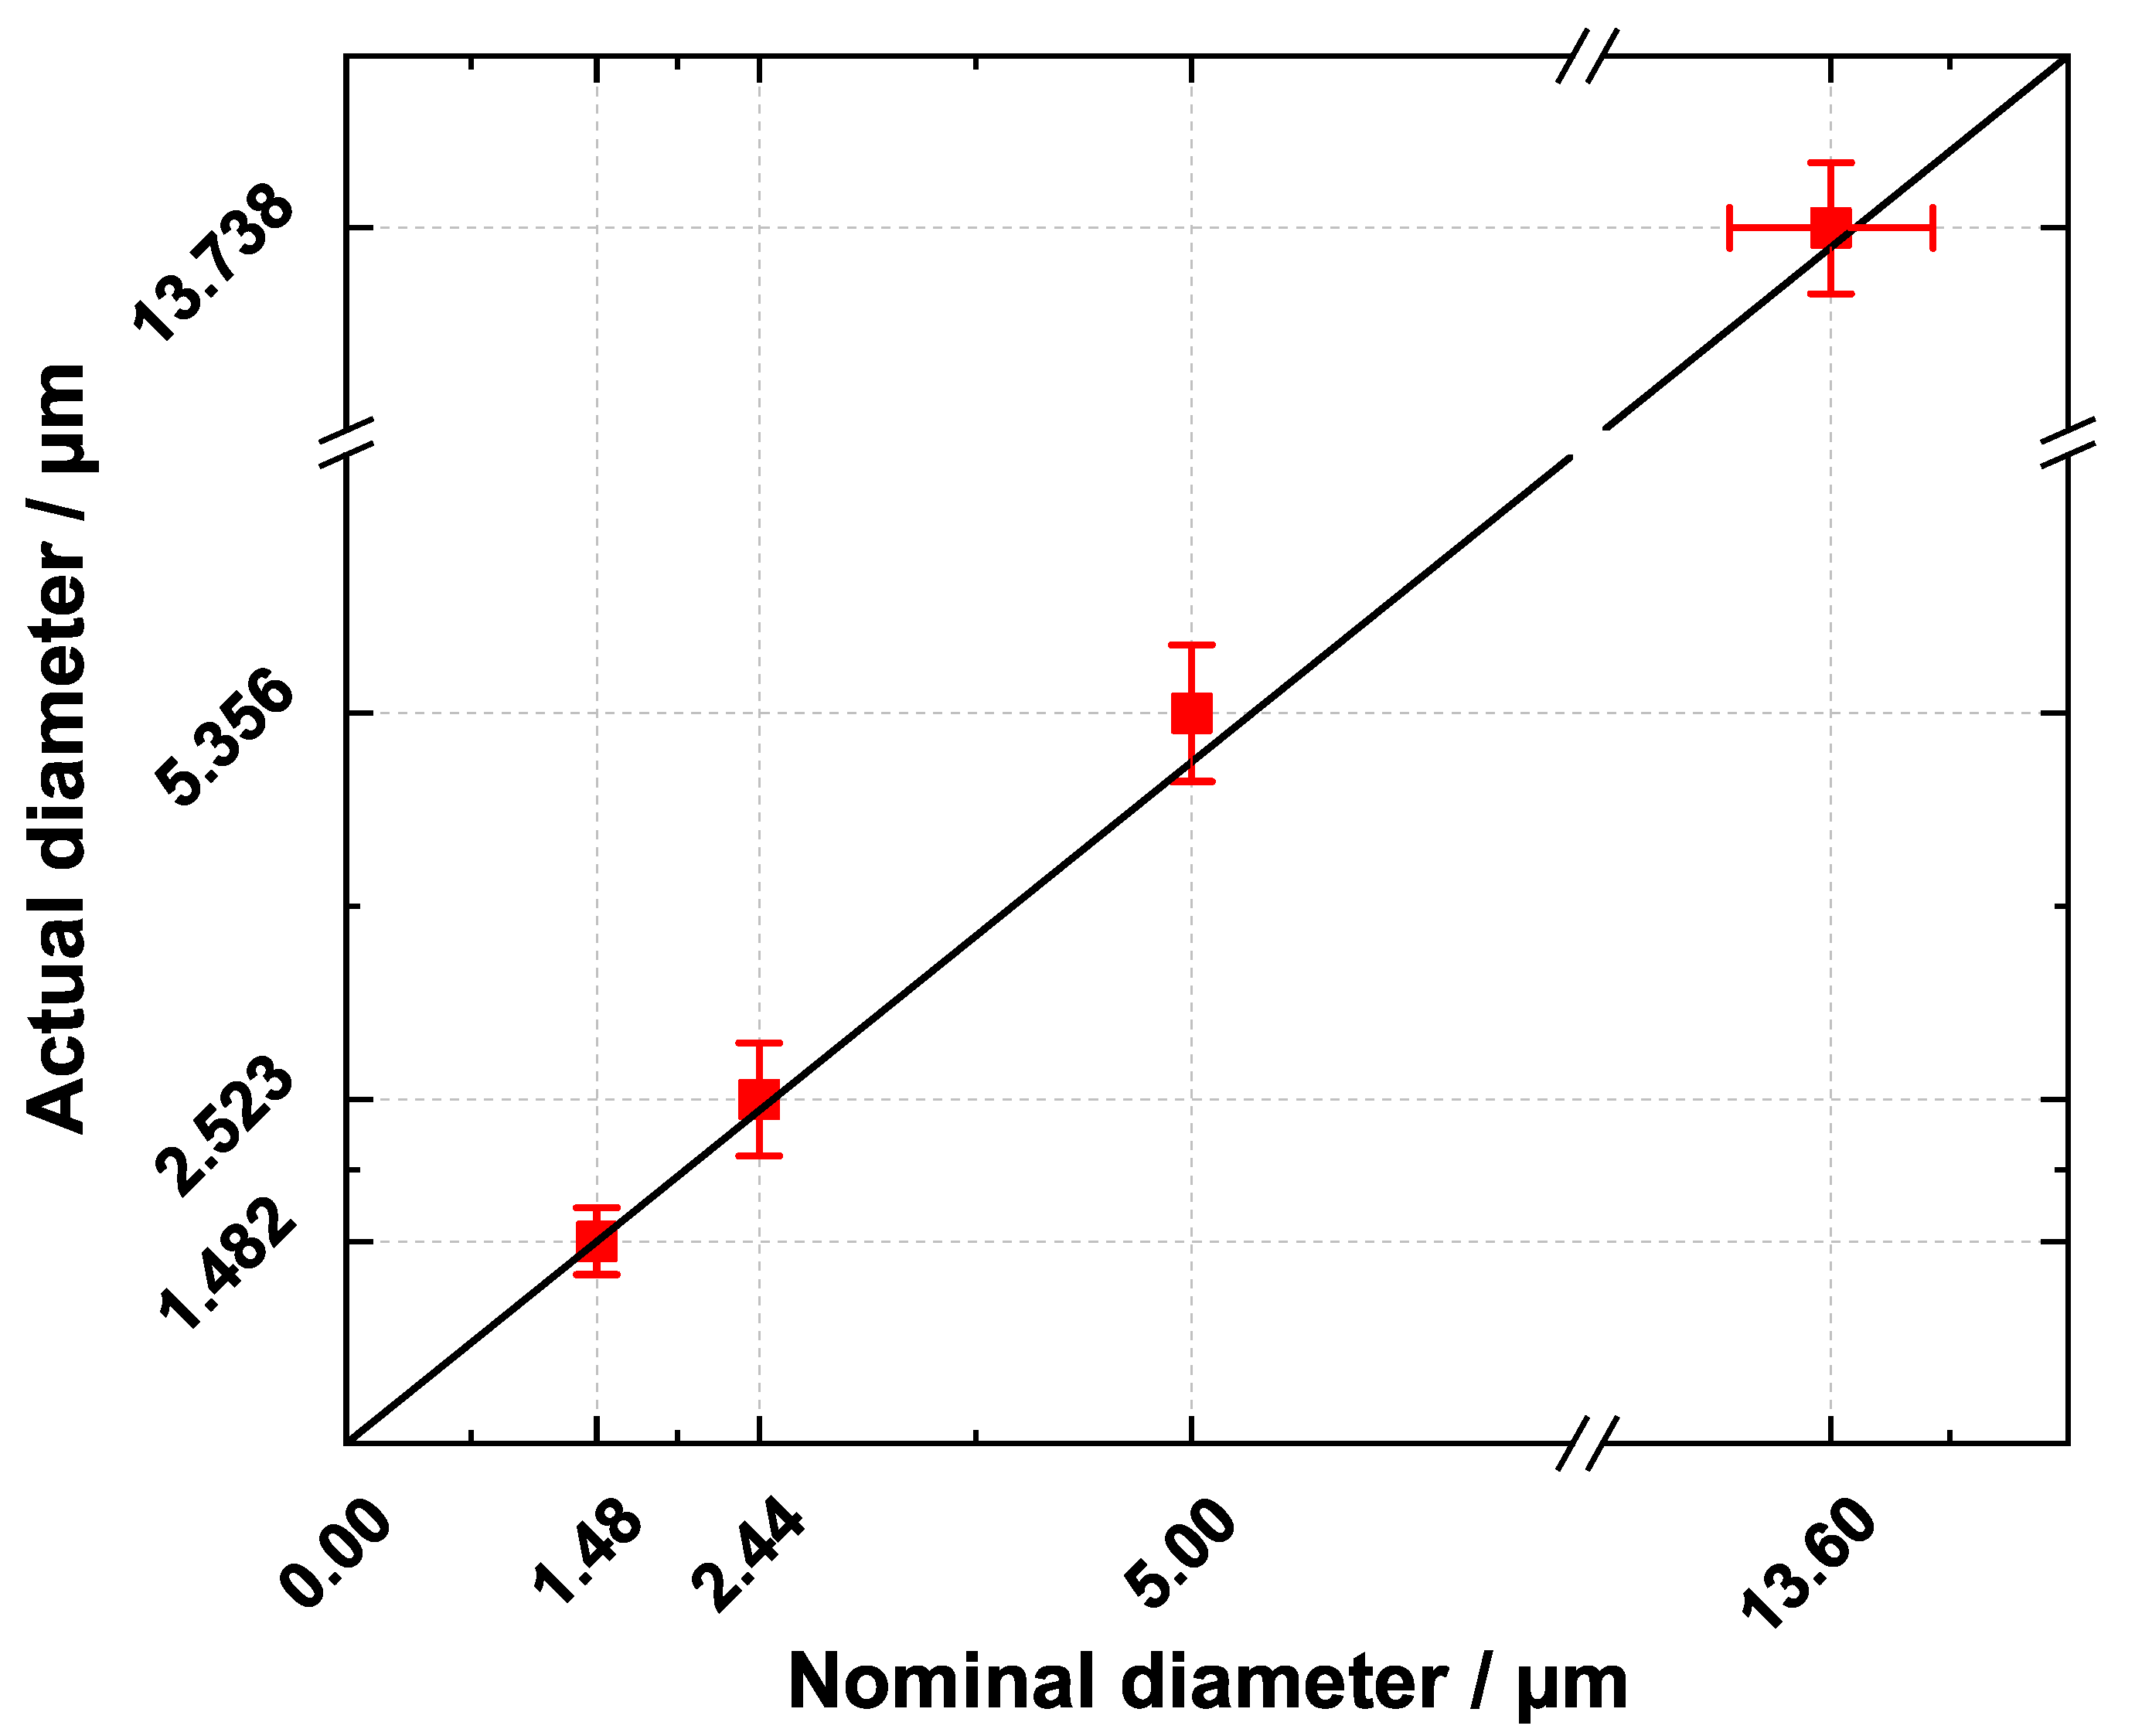
For composite materials several works have examined fiber orientation and/or length using a µ-CT [15,16], however in the case of nonwoven coalescence filter media, such work is still lacking. In this section we present a comparison of the conformity of the diameters of micro glass and PET fibers with the manufacturer’s specifications of the fiber material. Therefore, at least ten diameters of different, randomly orientated fibers were measured using a ruler tool of the software Dragonfly. Figure 9 shows the measured fiber diameters plotted against the nominal diameter of the individual components of the fiber mix.

Figure 9.
Comparison of nominal (manufacturer’s specifications) and actual fiber diameter (using the Dragonfly software) of the µ-CT scan. For each class more than 10 measurements have been done.
It can be seen that the measured fiber diameters are in good accordance with the manufacturer’s specifications. For micro glass fibers with a nominal diameter of 1.48 µm a mean diameter of 1.482 µm (standard deviation 0.25 µm), for 2.44 µm a mean diameter of 2.523 µm (standard deviation 0.42 µm), for 5.00 µm a mean diameter of 5.356 µm (standard deviation 0.5 µm) and for the PET fiber with a nominal diameter of 13.6 µm a mean diameter of 13.738 µm (standard deviation 0.48 µm) was found. Note, that the glass fiber diameters are normal (Gaussian) distributed and no detailed information about the fiber distribution is given by the manufacturer (occasionally deviations of ±200% in the nominal fiber diameter can easily occur). Thus, the differentiation between fibers with a nominal diameter of 1.48 µm and 2.44 µm is difficult and we assumed that measured fibers bigger than 1.9 µm belong to the nominal fiber diameter of 2.44 µm. For the PET fiber distribution a quality range of ±0.6 µm in fiber diameter is given by the manufacturer, so error bars in x-direction can be set in Figure 9. Because only one PET fiber in the scan was found, the fiber diameter was measured at different positions of this fiber. For the diameter measurements of the micro glass fibers, different fibers were taken. With increasing nominal fiber diameter, a shift of the mean diameter, derived from the µ-CT, to slightly bigger diameters can be seen. The most plausible explanation for this observation is the Gaussian distribution of the used fibers. Another possible reason for this shift could be the presence of small oil structures e.g., flat clamshell droplets or oil fragments on fibers which cannot be clearly quantified due to the limited resolution of the µ-CT scan and are classified as fiber material.
4. Conclusions
In this study, deposited oil structures on the scale of only a few micrometers on a thin porous filter material were imaged for the first time using X-ray micro tomography. The deposited oil was identified using a state of the art µ-CT and a corresponding segmentation software including a deep learning tool. As the filter material is oleophilic, the droplets occurred mostly in the expected barrel shape. The formation of bigger oil sails mainly orientated perpendicular to the flow direction between adjacent fibers was also observed. The local (determined through the µ-CT scan) and global filter porosity (determined by the area density and thickness of the media) was in good accordance. The saturation as well as the micro glass and PET fiber ratio at local and global level showed differences, mainly due to the very small examined area of the oil loaded filter material. With the information obtained from this work, the oil droplet distribution and the spatial position and orientation of oil sails in coalescence filters can be determined. The presented analytical approach in the identification of deposited oil structures on coalescence filters can be extended in the future in terms of process engineering by different parameter variations (saturation, flow velocity, wettability and thickness of the filter medium) and thus serve the fundamental understanding of mist filtration processes. For future research, especially the influence of these deposited oil structures on the filtration behavior of porous filter media is of particular relevance and is currently under investigation by the authors and will be presented in further publications.
Author Contributions
C.S.: Conceptualization, Data curation, Formal analysis, Investigation, Methodology, Resources, Validation, Visualization, Writing—original draft, Writing—review & editing. J.M.: Conceptualization, Formal analysis, Methodology, Project administration, Resources, Supervision, Writing—review & editing. A.D.: Conceptualization, Funding acquisition, Project administration, Resources, Supervision, Writing—review & editing. All authors have read and agreed to the published version of the manuscript.
Funding
This research received no external funding.
Acknowledgments
We acknowledge support by the KIT-Publication Fund of the Karlsruhe Institute of Technology.
Conflicts of Interest
The authors declare no conflict of interest.
Abbreviations
The following abbreviations are used in this manuscript:
| µ-CT | X-ray microtomography |
| AI | Artificial intelligence |
| MPPS | Most penetrating particle size |
| PET | Polyethylene terephthalate |
| PPS | Polyphenylene sulfide |
| ROI | Region of interest |
| SEM | Scanning electron microscope |
| UV | Ultraviolet |
References
- Mead-Hunter, R.; King, A.J.; Mullins, B.J. Aerosol-mist coalescing filters—A review. Sep. Purif. Technol. 2014, 133, 484–506. [Google Scholar] [CrossRef]
- Kazerouni, N.; Thomas, T.L.; Petralia, S.A.; Hayes, R.B. Mortality among workers exposed to cutting oil mist: Update of previous reports. Am. J. Ind. Med. 2000, 38, 410–416. [Google Scholar] [CrossRef]
- Kampa, D.; Wurster, S.; Buzengeiger, J.; Meyer, J.; Kasper, G. Pressure drop and liquid transport through coalescence filter media used for oil mist filtration. Int. J. Multiph. Flow 2014, 58, 313–324. [Google Scholar] [CrossRef]
- Kampa, D.; Wurster, S.; Meyer, J.; Kasper, G. Validation of a new phenomenological “jump-and-channel” model for the wet pressure drop of oil mist filters. Chem. Eng. Sci. 2015, 122, 150–160. [Google Scholar] [CrossRef]
- Penner, T.; Heikamp, W.; Meyer, J.; Dittler, A. Einfluss ausgewählter Medienstrukturparameter auf das Betriebsverhalten von Ölnebelfiltern. Chem. Ing. Tech. 2019, 91, 1615–1622. [Google Scholar] [CrossRef] [Green Version]
- Contal, P.; Simao, J.; Thomas, D.; Frising, T.; Callé, S.; Appert-Collin, J.; Bémer, D. Clogging of fibre filters by submicron droplets. Phenomena and influence of operating conditions. J. Aerosol Sci. 2004, 35, 263–278. [Google Scholar] [CrossRef]
- Mullins, B.J.; Agranovski, I.E.; Braddock, R.D.; Ho, C.M. Effect of fiber orientation on fiber wetting processes. J. Colloid Interface Sci. 2004, 269, 449–458. [Google Scholar] [CrossRef]
- Ojaghlou, N.; Tafreshi, H.V.; Bratko, D.; Luzar, A. Dynamical insights into the mechanism of a droplet detachment from a fiber. Soft Matter 2018, 14, 8924–8934. [Google Scholar] [CrossRef]
- Mullins, B.J.; Braddock, R.D.; Agranovski, I.E.; Cropp, R.A.; O’Leary, R.A. Observation and modelling of clamshell droplets on vertical fibres subjected to gravitational and drag forces. J. Colloid Interface Sci. 2005, 284, 245–254. [Google Scholar] [CrossRef] [PubMed]
- Mullins, B.J.; Braddock, R.D.; Agranovski, I.E.; Cropp, R.A. Observation and modelling of barrel droplets on vertical fibres subjected to gravitational and drag forces. J. Colloid Interface Sci. 2006, 300, 704–712. [Google Scholar] [CrossRef] [PubMed] [Green Version]
- Raynor, P.C.; Leith, D. The influence of accumulated liquid On fibrous filter performance. J. Aerosol Sci. 2000, 31, 19–34. [Google Scholar] [CrossRef]
- Kolb, H.E.; Watzek, A.K.; Zaghini Francesconi, V.; Meyer, J.; Dittler, A.; Kasper, G. A mesoscale model for the relationship between efficiency and internal liquid distribution of droplet mist filters. J. Aerosol Sci. 2018, 123, 219–230. [Google Scholar] [CrossRef]
- Feldkamp, L.A.; Goldstein, S.A.; Parfitt, A.M.; Jesion, G.; Kleerekoper, M. The direct examination of three-dimensional bone architecture in vitro by computed tomography. J. Bone Miner. Res. Off. J. Am. Soc. Bone Miner. Res. 1989, 4, 3–11. [Google Scholar] [CrossRef] [PubMed]
- Ho, S.T.; Hutmacher, D.W. A comparison of micro CT with other techniques used in the characterization of scaffolds. Biomaterials 2006, 27, 1362–1376. [Google Scholar] [CrossRef]
- Mehdikhani, M.; Breite, C.; Swolfs, Y.; Wevers, M.; Lomov, S.V.; Gorbatikh, L. Combining digital image correlation with X-ray computed tomography for characterization of fiber orientation in unidirectional composites. Compos. Part A Appl. Sci. Manuf. 2021, 142, 106234. [Google Scholar] [CrossRef]
- Bordelon, A.C.; Roesler, J.R. Spatial distribution of synthetic fibers in concrete with X-ray computed tomography. Cem. Concr. Compos. 2014, 53, 35–43. [Google Scholar] [CrossRef]
- Ueda, M.; Rozy, M.I.F.; Fukasawa, T.; Ishigami, T.; Fukui, K. Phase-Field Simulation of the Coalescence of Droplets Permeating through a Fibrous Filter Obtained from X-ray Computed Tomography Images: Effect of the Filter Microstructure. Langmuir ACS J. Surf. Colloids 2020, 36, 4711–4720. [Google Scholar] [CrossRef] [PubMed]
- Ueda, M.; Fukasawa, T.; Ishigami, T.; Fukui, K. Effect of Surface Wettability on Droplet Coalescence and Pressure Drop in a Fibrous Filter: Direct Numerical Simulation Coordinated with X-ray Computed Tomography Images. Ind. Eng. Chem. Res. 2021, 60, 4168–4179. [Google Scholar] [CrossRef]
- Fang, J.; Davoudi, M.; Chase, G.G. Drop movement along a fiber axis due to pressure driven air flow in a thin slit. Sep. Purif. Technol. 2015, 140, 77–83. [Google Scholar] [CrossRef]
- Ronneberger, O.; Fischer, P.; Brox, T. U-Net: Convolutional Networks for Biomedical Image Segmentation. In Medical Image Computing and Computer-Assisted Intervention – MICCAI 2015; Navab, N., Hornegger, J., Wells, W.M., Frangi, A.F., Eds.; Lecture Notes in Computer Science; Springer International Publishing: Cham, Switzerland, 2015; Volume 9351, pp. 234–241. [Google Scholar] [CrossRef] [Green Version]
- Long, J.; Shelhamer, E.; Darrell, T. Fully Convolutional Networks for Semantic Segmentation. Available online: http://openaccess.thecvf.com/content_cvpr_2015/html/Long_Fully_Convolutional_Networks_2015_CVPR_paper.html (accessed on 18 October 2021).
- McHale, G.; Newton, M.I.; Carroll, B.J. The Shape and Stability of Small Liquid Drops on Fibers. Oil Gas Sci. Technol. 2001, 56, 47–54. [Google Scholar] [CrossRef] [Green Version]
- McHale, G.; Newton, M. Global geometry and the equilibrium shapes of liquid drops on fibers. Colloids Surf. A Physicochem. Eng. Asp. 2002, 206, 79–86. [Google Scholar] [CrossRef]
- Chou, T.H.; Hong, S.J.; Liang, Y.E.; Tsao, H.K.; Sheng, Y.J. Equilibrium phase diagram of drop-on-fiber: Coexistent states and gravity effect. Langmuir ACS J. Surfaces Colloids 2011, 27, 3685–3692. [Google Scholar] [CrossRef] [PubMed]


Publisher’s Note: MDPI stays neutral with regard to jurisdictional claims in published maps and institutional affiliations. |
© 2021 by the authors. Licensee MDPI, Basel, Switzerland. This article is an open access article distributed under the terms and conditions of the Creative Commons Attribution (CC BY) license (https://creativecommons.org/licenses/by/4.0/).