Article

Plasma Short-Chain Fatty Acids and Their Derivatives in Women with Gestational Diabetes Mellitus

by
Eliška Ivanovová
1,
Barbora Piskláková
1,
Jaroslava Friedecká
1,
Ondřej Krystyník
2,
David Friedecký
1,* and
David Karásek
2,*
1
Laboratory for Inherited Metabolic Disorders, Department of Clinical Biochemistry, University Hospital Olomouc and Faculty of Medicine and Dentistry, Palacký University Olomouc, I. P. Pavlova 6, 779 00 Olomouc, Czech Republic
2
3rd Department of Internal Medicine—Nephrology, Rheumatology and Endocrinology, University Hospital Olomouc and Faculty of Medicine and Dentistry, Palacký University Olomouc, I. P. Pavlova 6, 779 00 Olomouc, Czech Republic
*
Authors to whom correspondence should be addressed.
Separations 2021, 8(10), 188; https://doi.org/10.3390/separations8100188
Submission received: 23 September 2021 / Revised: 5 October 2021 / Accepted: 8 October 2021 / Published: 14 October 2021

Abstract

:
Gestational diabetes mellitus (GDM) represents a heterogeneous group of hyperglycemic metabolic disorders that are associated with health outcomes for mothers and offspring. Currently, diagnosis of GDM is based on repetitive measurement of increased fasting plasma glucose (FPG) or upon results showing increased postprandial plasma glucose (PPG). Recently, it was discovered that the changes in the gut microbiome during pregnancy are associated with insulin resistance and obesity. Therefore, in this study, relevant products of gut bacteria, short-chain fatty acids (SCFA) and their derivatives were evaluated together with baseline body composition characteristics and common biochemical parameters in women with three different phenotypes of GDM, healthy pregnant and nonpregnant women. Plasma SCFA and their derivatives were derivatized, separated on reversed-phase liquid chromatography and detected by a triple-quadrupole mass spectrometer. 3-hydroxybutyrate (3-OH-BA), 4-methylvalerate (4-MVA) and isovalerate (IVA), together with selected parameters associated with baseline body composition characteristics and biochemistry, were evaluated as statistically significant. 3-OH-BA, which was increased in all three groups of women with different phenotypes of GDM, reflects a ketogenic state of GDM. In all groups of pregnant women, elevated/suppressed concentrations of 4-MVA/IVA were found. These findings show the importance of monitoring SCFA and other parameters besides glucose in women with GDM.

1. Introduction

Worldwide, gestational diabetes mellitus (GDM) affects 2–38% of pregnant women [1]. It is associated with significant short- and long-term adverse health outcomes for mothers and children. GDM probably represents a heterogeneous group of hyperglycemic metabolic disorders. Due to two-step GDM screening, the diagnosis is either based upon repetitive measurement of increased fasting plasma glucose (FPG ≥ 5.1 mmol/L) during the first trimester, or upon the results of an oral glucose tolerance test (OGTT) in the second trimester [2]. According to the International Association of the Diabetes and Pregnancy Study Groups (IADPSG) criteria, pregnant women with repeatedly higher fasting plasma glucose (FPG ≥ 5.1 mmol/L) and those only with increased postprandial plasma glucose (PPG ≥ 10.0 mmol/L at 1 h and/or ≥8.5 mmol/L at 2 h during OGTT) in the second trimester are also diagnosed as women with GDM. Therefore, we can find different phenotypes of GDM based on these diagnostic criteria. GDM diagnosed due to higher FPG (especially in early pregnancy) seems to put women into a higher risk of metabolic and gestational complications. Those women are usually older, with familial and/or personal history of GDM, more often suffer from obesity, exhibit decreased insulin sensitivity in addition to β-cell dysfunction, and have increased risk of developing diabetes mellitus type 2 in later life [3]. They are also at greater risk of having large-for-gestational-age babies and their delivery more often ends with a caesarean section [4].
In recent years, it has been shown the composition and diversity of the gut microbiome change during pregnancy, which may also be associated with insulin resistance and obesity, and thus negatively affect the health of the mother and her offspring [5,6]. However, the cause of reduced insulin sensitivity during pregnancy is still not fully understood; recent studies have shown that glucose homeostasis [7,8], lipid metabolism [9] and the development of other diseases such as obesity, diabetes mellitus or inflammatory bowel disease (IBD) [10] are related to the activity of gut microbes. The importance of the gut microbiome for the health of the human population has been widely discussed, precisely due to the microbiome’s metabolic function that contributes to the maintenance of healthy human physiology [11]. The bacterial population, inhabiting the lumen of the human gut, is involved in the fermentation of unabsorbed fiber [12].
Among the prominent end products of anaerobic bacterial metabolism are short-chain fatty acids (SCFA), derived from carbohydrate fermentation, and branched short-chain SCFA (BSCFA), derived from protein and amino acid fermentation [13]. Since fatty acids (FA) are products of catalytic reactions, their formation is dependent on the availability of the reaction substrate, and therefore, it is possible to influence their amount by diet. Basic SCFA include acetic acid (AA, C2:0), propionic acid (PA, C3:0), butyric acid (BA, C4:0), valeric acid (VA, C5:0) and hexanoic acid (HA, C6:0), while the group of BSCFA consists of isobutyric acid (IBA), 2-methylbutyric acid (2-MBA), isovaleric acid (IVA), 3-methylvaleric acid (3-MVA) and 4-methylvaleric acid (4-MVA) [14,15,16]. These microbial products are highly present in human feces, but are also present in lower concentrations in portal, hepatic and peripheral blood, into which they are transported through intestinal epithelium [14,17,18].
Based on many studies regarding SCFA in biological materials, their physiological amount was estimated, but it cannot be forgotten that this quantity is influenced by the composition of the bacterial population, the amount of substrate (diet), the permeability of the intestinal membrane, psychological states or epigenetics, and even analytical methodology [15,19]. However, it is not only in pregnancy that SCFA are responsible for the overall body homeostasis and the metabolism of carbohydrates and lipids [13]. SCFA as signaling molecules involved in G-protein-coupled receptor activation and histone deacetylase inhibition also play a role in immune responses in T-cell and intestinal macrophage production [10,20,21,22]. The metabolic changes associated with a woman’s pregnancy can cause intestinal dysbiosis, and thus, the development of GDM [13].
In addition to microbial SCFA, 3-hydroxybutyrate (3-OH-BA) was found to be important in the context of diabetes mellitus [23]. Diabetes with insulin absence or deficiency and with elevated levels of counterregulatory hormones results in a high blood glucose concentration with a simultaneous deficit in the cells. Cells must obtain energy from another source, which may be the breakdown of fatty acids with the simultaneous formation of ketone bodies as by-products. In diabetics, 3-OH-BA, the main representative of ketone bodies, can therefore be used as an alternative energy source for organs such as the heart, partially replacing glucose [24]. Ketogenic intervention decreases blood glucose levels and improves insulin secretion and the lipid profile of diabetic patients [25]. However, when the β-oxidation of fatty acids starts intensively (e.g., in patients with poorly controlled diabetes mellitus), ketones accumulate in the body, which can lead to dangerous diabetic ketoacidosis (DKA). The high concentration of ketone bodies, due to their acidic pH, affects the electrolyte balance and disturbs life processes, causing damage and dehydration of cells, as the organism strives to eliminate their excess in the urine [26]. In contrast, it was found that mild ketoacidosis may have beneficial effects for the organism, e.g., in the defense against insulin-induced hypoglycemia [27]. Overall, 3-OH-BA is an important biomarker to diagnose and monitor diabetic ketoacidosis [28]. A recent study reported that 2-hydroxybutyrate (2-OH-BA), a derivative of 2-ketobutyrate, can also very likely be considered as a prognostic biomarker along with 3-OH-BA in diabetic complications [29].
Determination of SCFA in biological materials allows a better understanding of their role, including outside of diabetes mellitus. Multiple analytical approaches for the detection of SCFA have been developed covering advanced chromatographic, mass spectrometric, electromigration and spectroscopic methods [16,30,31,32,33,34,35,36,37,38,39]. The most common methods combine gas chromatography (GC), or liquid chromatography (LC) coupled with mass spectrometry (MS), most often with a derivatization step, which is time consuming but provides better chromatographic behavior. In particular, GC–MS offers high sensitivity [31,32,33]. In recent years, LC–MS approaches that allow fast and efficient sample preparation and analysis were introduced [16,30,34]. Despite developments in SCFA analysis, the methods remain laborious and, therefore, SCFA determination is still not utilized in routine clinical practice.
The primary objective of this study is to distinguish the differences in plasma profiles of SCFA and their derivatives of nonpregnant, pregnant and women with different phenotypes of GDM. In comparison with other studies, a different method of classification of GDM phenotypes was applied. As part of this research, correlations between SCFA (and their derivatives) and women’s body composition characteristics, and biochemical parameters such as lipid markers, CPI (C-peptide index), FGF-19 (fibroblast growth factor-19), etc., were performed.

2. Materials and Methods

2.1. Chemicals and Reagents

Propionic acid (PA, C3), butyric acid (BA, C4), isobutyric acid (IBA, C4), 2-hydroxybutyrate (2-OH-BA, C4), 3-hydroxybutyrate (3-OH-BA, C4), 3-hydroxyisobutyrate (3-OH-IBA, C4), valeric acid (VA, C5), isovaleric acid (IVA, C5), 3-methylvaleric acid (3-MVA, C6), 4-methylvaleric acid (4-MVA, C6), hexanoic acid (HA, C6), hexanoic acid-6,6,6-d3 (HA-d3, C6), N-(3-dimethylaminopropyl)-N′-ethylcarbodiimide hydrochloride (EDC), O-benzylhydroxylamine hydrochloride (O-BHA), methyl tert-butyl ether (MTBE) and formic acid (FA) were supplied by Sigma-Aldrich (St. Louis, MO, USA). All of these chemicals and reagents were LC–MS grade. Acetic acid (AA, C2) and hydrochloric acid (HCl) were obtained from Mikrochem (Pezinok, Slovakia) and pyridine was purchased from Penta Chemicals (Prague, Czech Republic). LC–MS grade solvents such as methanol (MeOH), isopropanol (IPA) and water were obtained from Honeywell Riedel-de-Haën (Seelze, Germany).

2.2. Stock and Standard Solution Preparation

Primary stock solutions of SCFA standards (C2–C6), their derivatives and internal standard (IS) of HA-d3 were prepared via dissolution in water to a final concentration of 10 mmol/L and 20 µmol/L, and were stored at −20 °C.
Calibration mixtures CAL1 contained AA, PA, BA, VA, HA and 3-OH-BA and CAL2 contained isoforms IBA, IVA, 3-MVA, 4-MVA and 2-OH-BA. Primary stock solutions of these SCFA standards were diluted to the final concentration 250 µmol/L of AA, 25 µmol/L for PA, BA, VA and HA and 500 µmol/L for 3-OH-BA. Isoforms were diluted to a final concentration of 10 µmol/L IBA, IVA, 3-MVA and 4-MVA and 100 µmol/L for 2-OH-BA. Ten-point calibration curves of these mixtures were then made by double diluting.
However, as a consequence of the co-elution of 3-OH-BA with 3-OH-IBA, only one of them, specifically 3-OH-BA, was added to the CAL1 mixture since the physiological concentrations of 3-OH-IBA are negligible in plasma relative to 3-OH-BA. Due to the absence of a standard 2-MBA, its quantification was ensured by reference to IVA.
Pyridine HCl buffer, necessary for the preparation of derivatization reagents, was prepared by mixing 12.1 M HCl (0.54 mL) with pyridine (0.86 mL) and water (8.6 mL) according to the protocol of Jaochico et al. [16]. The derivatization reagents, EDC and O-BHA, were both prepared at a concentration of 0.25 mol/L in the pyridine HCl buffer.

2.3. Biological Samples

Plasma samples from patients with GDM (n = 84), non-pregnant healthy women (nonP, n = 20) and pregnant healthy women without GDM (P-nonGDM, n = 20) were collected with their consent at the University Hospital Olomouc. The control group of women P-nonGDM was in the second trimester at the point of collection of samples. All collected plasma samples were stored at −20 °C until the LC–MS analysis.
The first group of women with GDM, P-GDM-1T (n = 31), included pregnant women in the first trimester who were diagnosed with GDM based on repetitive measurement of increased FPG (≥5.1 mmol/L). Pregnant women who were diagnosed with GDM in the late 2nd and early 3rd trimesters on the basis of increased OGTT formed the P-GDM-2/3T group (n = 31), and the third group, P-GDM-2/3T-ppg (n = 22), comprised pregnant women in the late second and early third trimesters who were diagnosed with GDM on the basis of increased PPG (≥10.0 mmol/L at 1 h and/or ≥8.5 mmol/L at 2 h during OGTT).
Baseline body composition characteristics of women and their biochemical parameters were collected at 30–36 weeks of pregnancy.

2.4. Sample Preparation

Many sample preparation procedures have been developed for SCFA analysis, which differ in the use of derivatization reagent, concentration of reagents, extraction time or extraction temperature [12,16,30,34,40]. These approaches were used to optimize the sample preparation for the best efficiency. The final derivatization and the extraction were performed according to the validated protocol of Jaochico et al. and Shafaei et al. [16,30] with slight modifications. Plasma sample or calibration mixture (20 µL), in a plastic tube, was mixed with 20 µM IS (10 µL). The following derivatization step consisted of adding 0.25 M EDC (10 µL) and 0.25 M O-BHA (10 µL) to the sample. After mixing, the sample was incubated on a shaker at 500 rpm for 1 h. Subsequently, liquid–liquid extraction of the present SCFA and IS was performed by adding water (50 µL) and MTBE (400 µL) to the mixture. After mixing, the sample was centrifuged at 10,000 rpm for 10 min and eluate (200 µL) was taken into a glass vial and dried by nitrogen flow (37 °C, 15 min). After this process, the sample was dissolved in 100 µL of 50% MeOH and properly mixed. For LC–MS/MS analysis, only 0.5 µL of the sample was injected.

2.5. LC-MS/MS Conditions

Separations were performed on an Exion LC system (Sciex, Framingham, MA, USA) in combination with a QTRAP 6500 mass spectrometer (Sciex, Framingham, MA, USA). A Luna Omega Polar C18 column (1.6 µm, 100 × 2.1 mm, Phenomenex, Torrance, CA, USA) was used for the LC separation, which was performed while using mobile phase A containing 0.5% FA in water and mobile phase B including MeOH with IPA at a 9:1 ratio. A gradient elution was set as follows, with a flow rate of 300 µL/min and a column temperature of 45 °C (Figure S1): 0–5 min—40%→70% B; 5–5.5 min—70%→95% B; 5.5–6.5 min—95% B; 6.5–6.6 min—95%→40% B; 6.6–8.5 min—40% B. The autosampler was maintained at 5 °C during the analyses. The sample injection rate was 0.5 µL. The LC–MS/MS chromatogram of SCFA, their derivatives and IS in the highest level of CAL1 and CAL2 mixtures is shown in Figure S2 and the plasma profile of SCFA and others is shown in Figure S3.
The detection of SCFA and their derivatives was achieved in the positive MRM mode using electrospray ionisation. The optimized ion source parameters were set as follows: ion source gas 1 and 2 50 arb, curtain gas 45 arb, ion-spray voltage 5.5 kV and temperature 450 °C. MS/MS conditions from the protocols by Zeng and Cao [12] and Jaochico et al. [16] were optimized and final MS/MS parameters are shown in Table S1.

2.6. Data Treatment and Statistical Analysis

Data from analysis of women’s plasma were processed by Sciex OS (Sciex, version 1.6.1, Framingham, MA, USA). The obtained concentrations after logarithmic transformation, and other parameters such as the baseline body composition characteristics and biochemical parameters, were submitted to the Shapiro–Wilk test. All measurement parameters passed the normality test. To determine the differences between all groups, a parametric ANOVA test was performed. Post hoc multiple comparisons were performed according to the Holm–Sidak test (α = 0.05). An adjusted p-value of <0.05 or lower was considered statistically significant.
To define the correlation between SCFA and their derivatives with selected routine biomarkers and body composition characteristics, a parametric Pearson correlation test was performed. The critical value of the Pearson correlation coefficient was based on the number of samples in each group with statistical significance α = 0.05 [41]. The fold change value, expressed as the median ratio of the given parameters, was visualized by heatmap. All tests and graphical outputs were performed using GraphPad (version 9.0, San Diego, CA, USA).

3. Results

3.1. Analytical Characteristics of the LC-MS/MS Method

The LC–MS/MS method, including sample preparation and analysis conditions, was applied according to the validated protocols of Jaochico et al. and Shafaei et al. [16,30]. The upper limit of quantification (ULOQ), linearity, LOD (S/N > 3) and LOQ (S/N > 10) for each analyte were determined, as shown in Table S2. The range of calibration curves was set to cover both the physiological and pathological values of the analytes. Linearity, achieved by linear regression analysis using a 1/x weighting factor, is expressed by the coefficient of determination (R2 > 0.97). The quantitation of 2-MBA was ensured by relating it to IVA.

3.2. General Characteristics of the Participants

The total number of participants was 124; these were divided into three groups of patients according to the phenotype of GDM (P–GDM–1T, P–GDM–2/3T or P–GDM–2/3T–ppg) and two control groups (nonP or P–nonGDM).
Women with indicated GDM (P–GDM–1T, P–GDM–2/3T or P–GDM–2/3T–ppg), representing 67.74% of the total number of participants, were older (median: 31, 32, 33 y) than women in both control groups (P–nonGDM and nonP) (median: 30, 28 years) constituting 32.26% of the study population. The baseline body composition characteristics are summarized in Table S3, the biochemical parameters in Table S4 and the concentrations of SCFA and their derivatives in Table S5. The distribution of SCFA and their derivatives for all studied groups is shown by box plots in Figure 1 and Figure S4 and the distribution of baseline body composition characteristics and biochemical parameters is collected in Figure 2 and Figure S5.

3.3. Differences in the Plasma SCFA and Their Derivatives

The SCFA derivatives 3-OH-BA, IVA and 4-MVA showed statistically important differences between the studied groups (Figure 1). According to Figure 1 and Table S6, it is obvious that statistical significance was achieved for 3-OH-BA by comparing the P–GDM–2/3T–ppg group with the nonP group (p = 0.0025), the P–nonGDM group (p = 0.0001) and the P–GDM–1T group (p = 0.0402). In contrast, for IVA, statistical significance was obtained between the nonP and P–nonGDM groups (p = 0.0386) and between the nonP and P–GDM–2/3T groups (p = 0.0005). Statistically significant differences were also found in elevated concentrations of 4-MVA across all groups of pregnant women, especially the nonP group (p = < 0.0001). Although AA, PA, BA, VA and HA did not achieve statistically important differences across all measured groups, systematic trends can be observed, particularly in decreased concentrations of AA and increased concentrations of 2-MBA in all pregnant groups. Similarly to 3-OH-BA, 2-OH-BA shows an increasing trend within the pregnant groups. The results are shown in Figure S4 and Table S6.

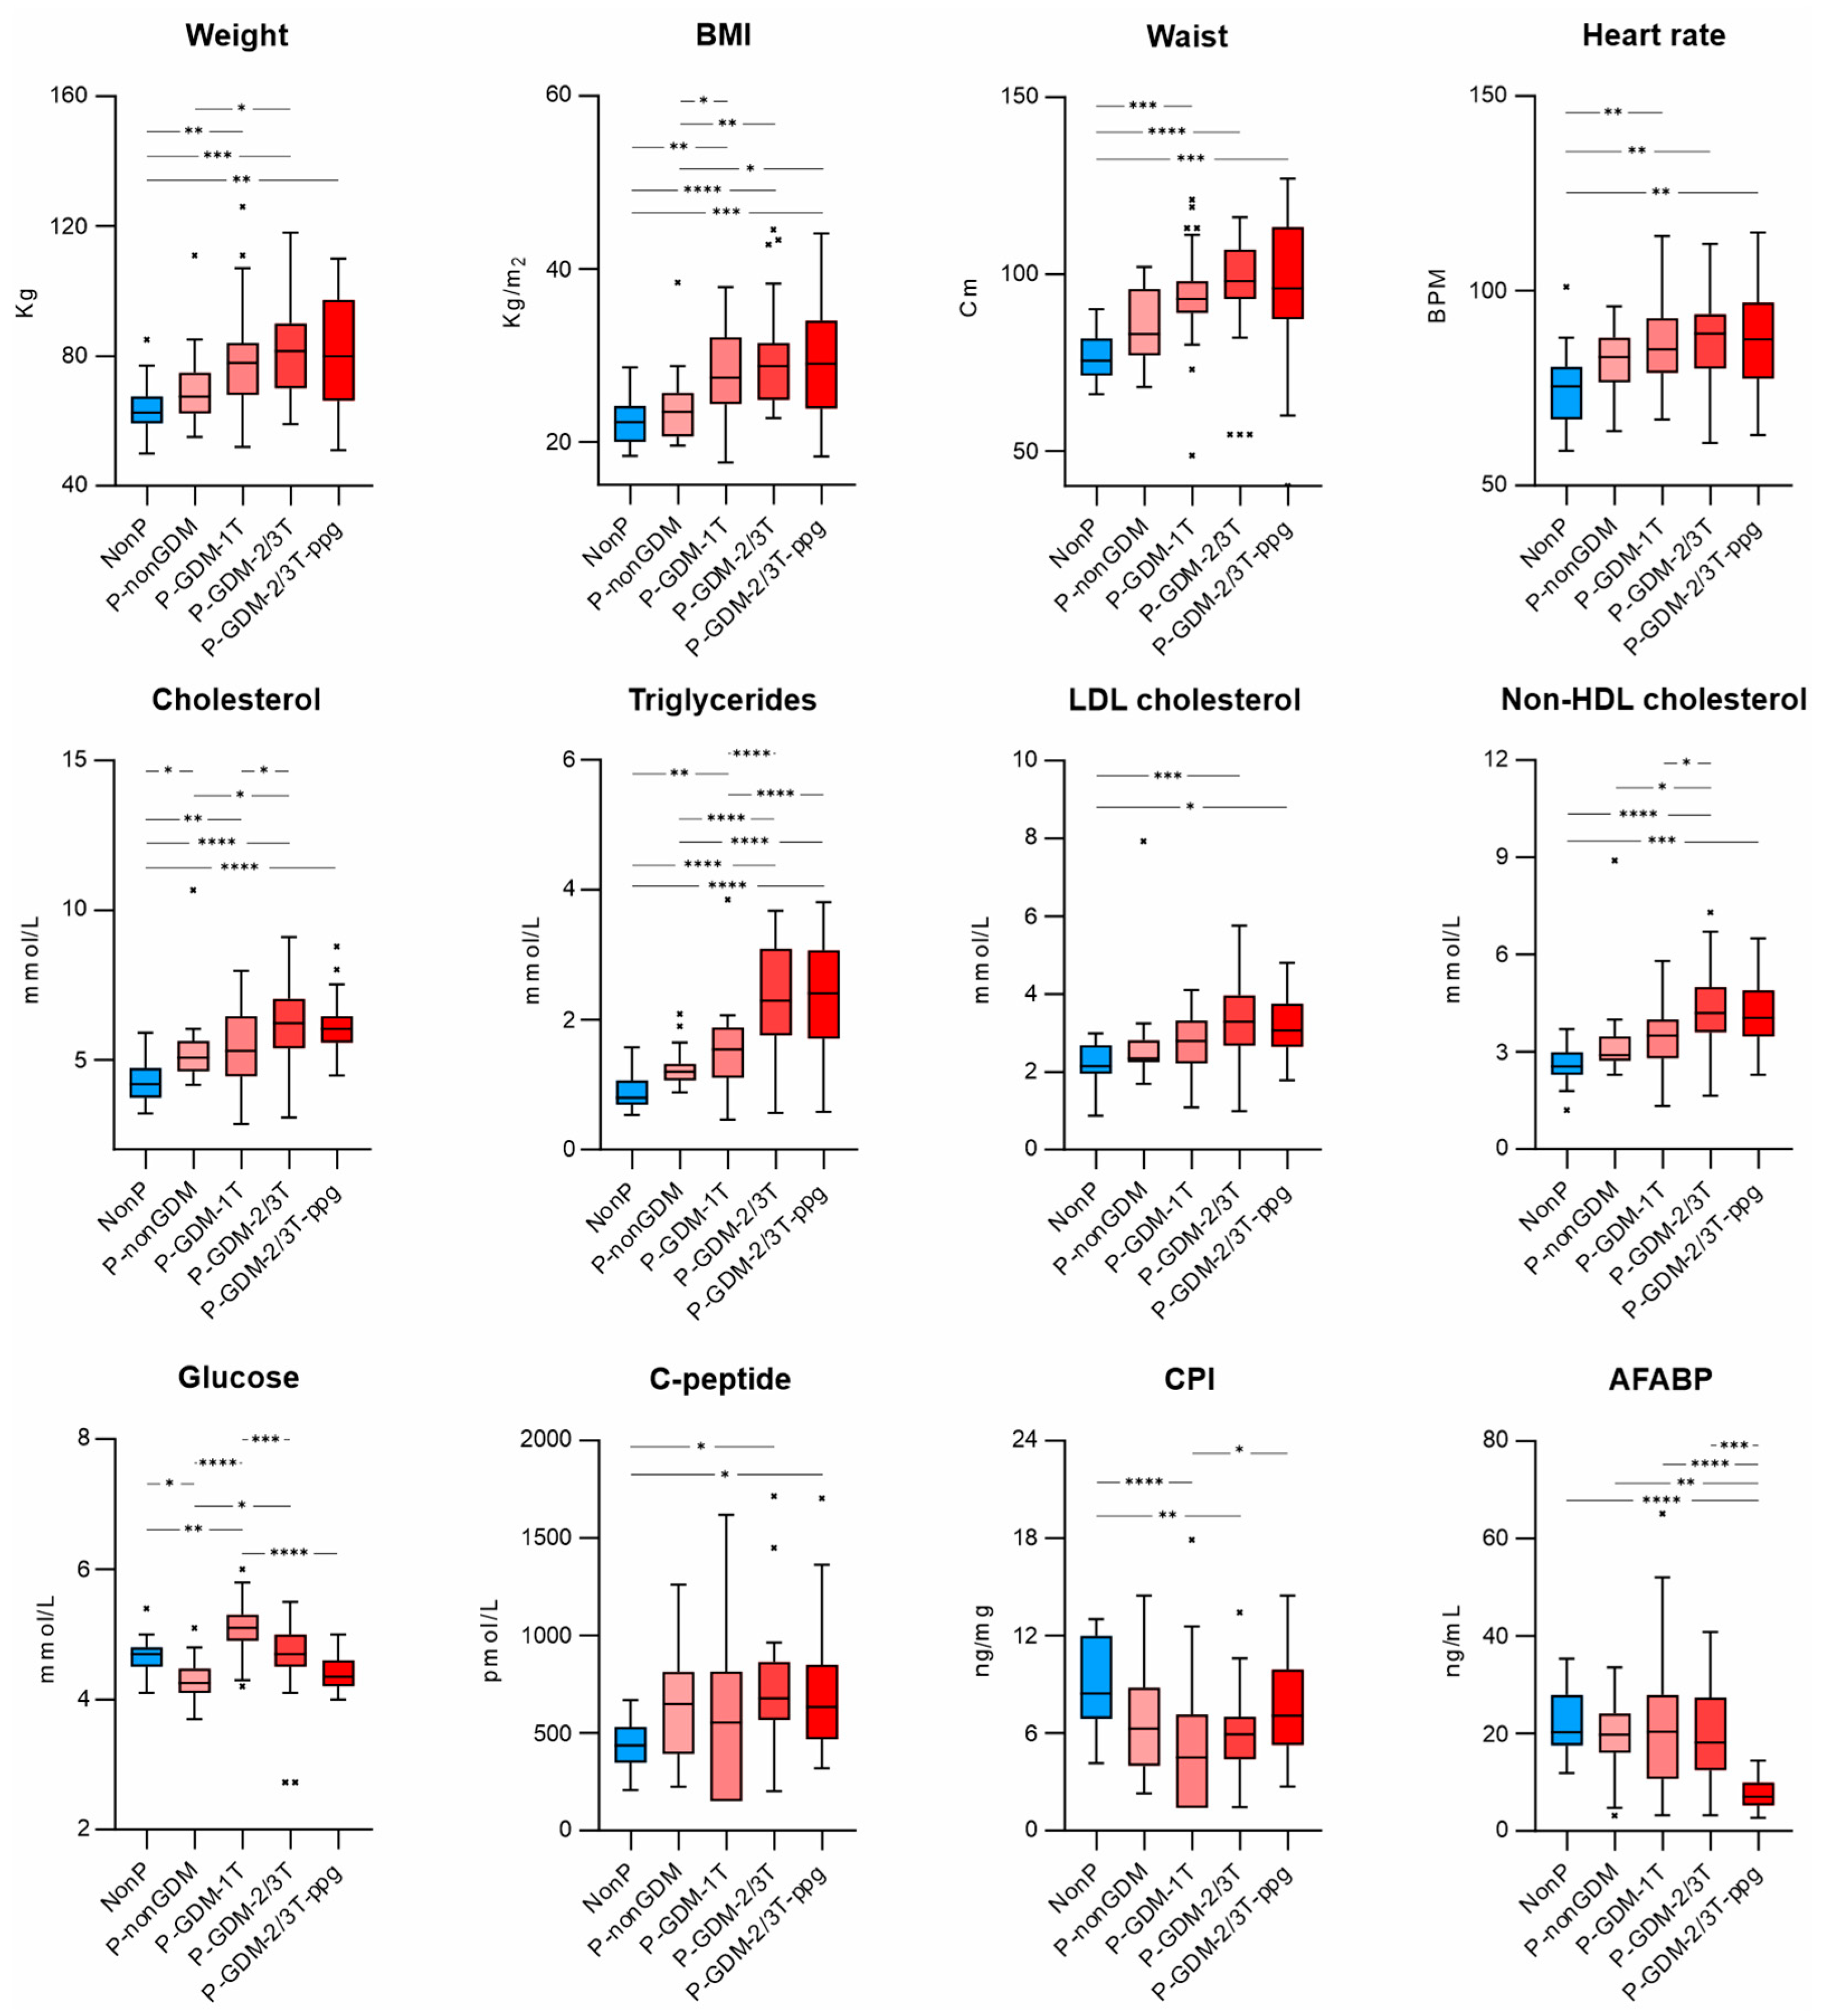
3.4. Differences in the Baseline Body Composition Characteristics and Biochemical Parameters in All Measurement Groups

Statistically significant differences were found for 12 parameters, as shown in Figure 2 and Table S7. Other parameters without statistical significance are depicted in Figure S5. For the majority of parameters, increasing trends can be seen.

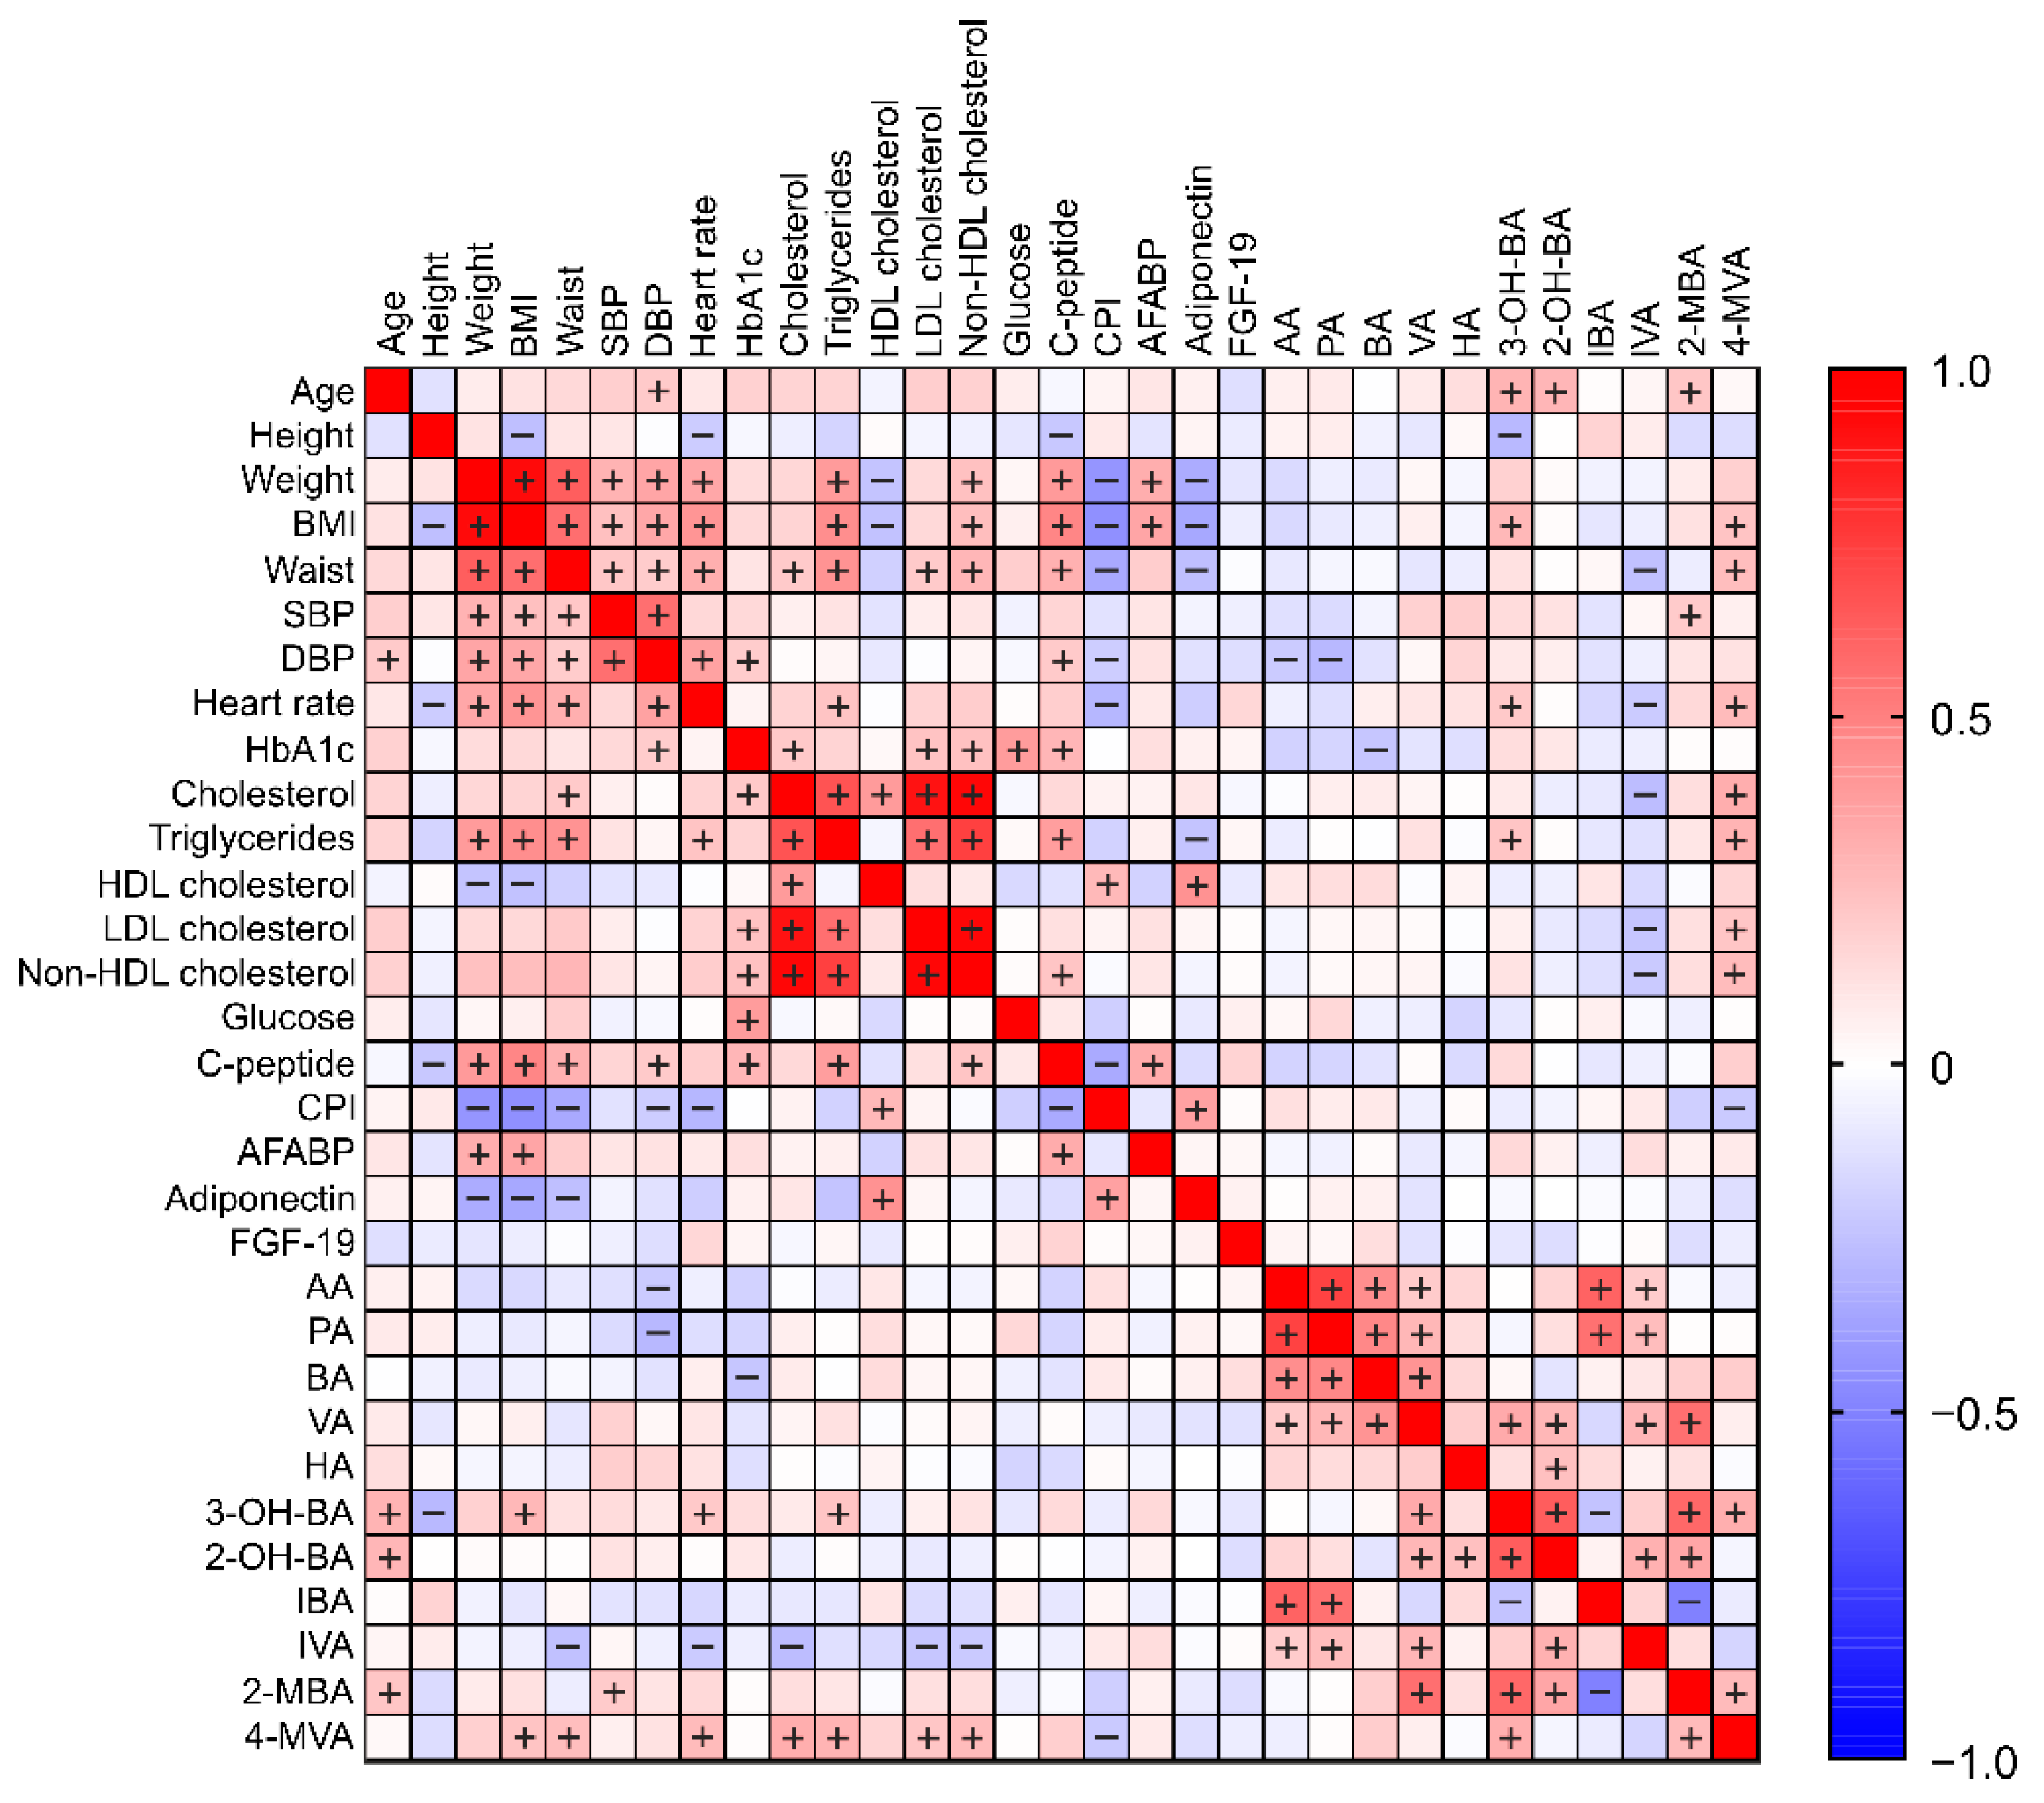
3.5. Pearson Correlations between All Measurement Parameters

The correlations between all measurement parameters across all groups are depicted in the Pearson correlation heat map in Figure 3. The values of these correlation coefficients are shown in Figure S6. The correlations for each group are shown separately in Figures S7–S11.

3.5.1. Correlations between SCFA (and Their Derivatives) and Parameters of Baseline Body Composition Characteristics and Biochemical Markers

Across all measurement groups (Figure 3 and Figure S6), there were weak positive and negative correlations that were found to be statistically significant (r > 0.196). In particular, 4-MVA exhibited weak positive correlations with BMI, waist, heart rate, cholesterol, triglycerides, LDL cholesterol and non-HDL cholesterol (r = 0.22–0.32). Similarly, 3-OH-BA also showed weak correlations with age, BMI, heart rate and triglycerides (r = 0.21–0.30), and 2-OH-BA and 2-MBA with age (r = 0.29 and 0.22). 2-MBA was weakly positively correlated with SBP (r = 0.20).
Contrary to this, IVA showed weak negative correlations with waist, heart rate, cholesterol, LDL cholesterol and non-HDL cholesterol (r = −0.21–−0.26). 3-OH-BA was negatively correlated with height (r = −0.28), AA and PA with DBP (r = −0.21 and −0.29), BA with HbA1c (r = −0.23) and 4-MVA with CPI (r = −0.21).

3.5.2. Correlations between SCFA and Their Derivatives

Between SCFA themselves, there were found a few strong, moderate and weak correlations with statistical significance. Strong positive correlations were observed between AA and PA (r = 0.73), 3-OH-BA and 2-OH-BA (r = 0.63) and AA and IBA (r = 0.61), while moderate positive correlations were found between BA and AA, PA and VA (r = 0.42–0.47) and between 3-OH-BA and 2-MBA (r = 0.59) and PA and IBA (r = 0.56). In addition, many other weak positive correlations were observed. On the contrary, moderate and weak negative correlations were obtained between 3-OH-BA and 2-MBA with IBA (r = −0.24 and −0.50).

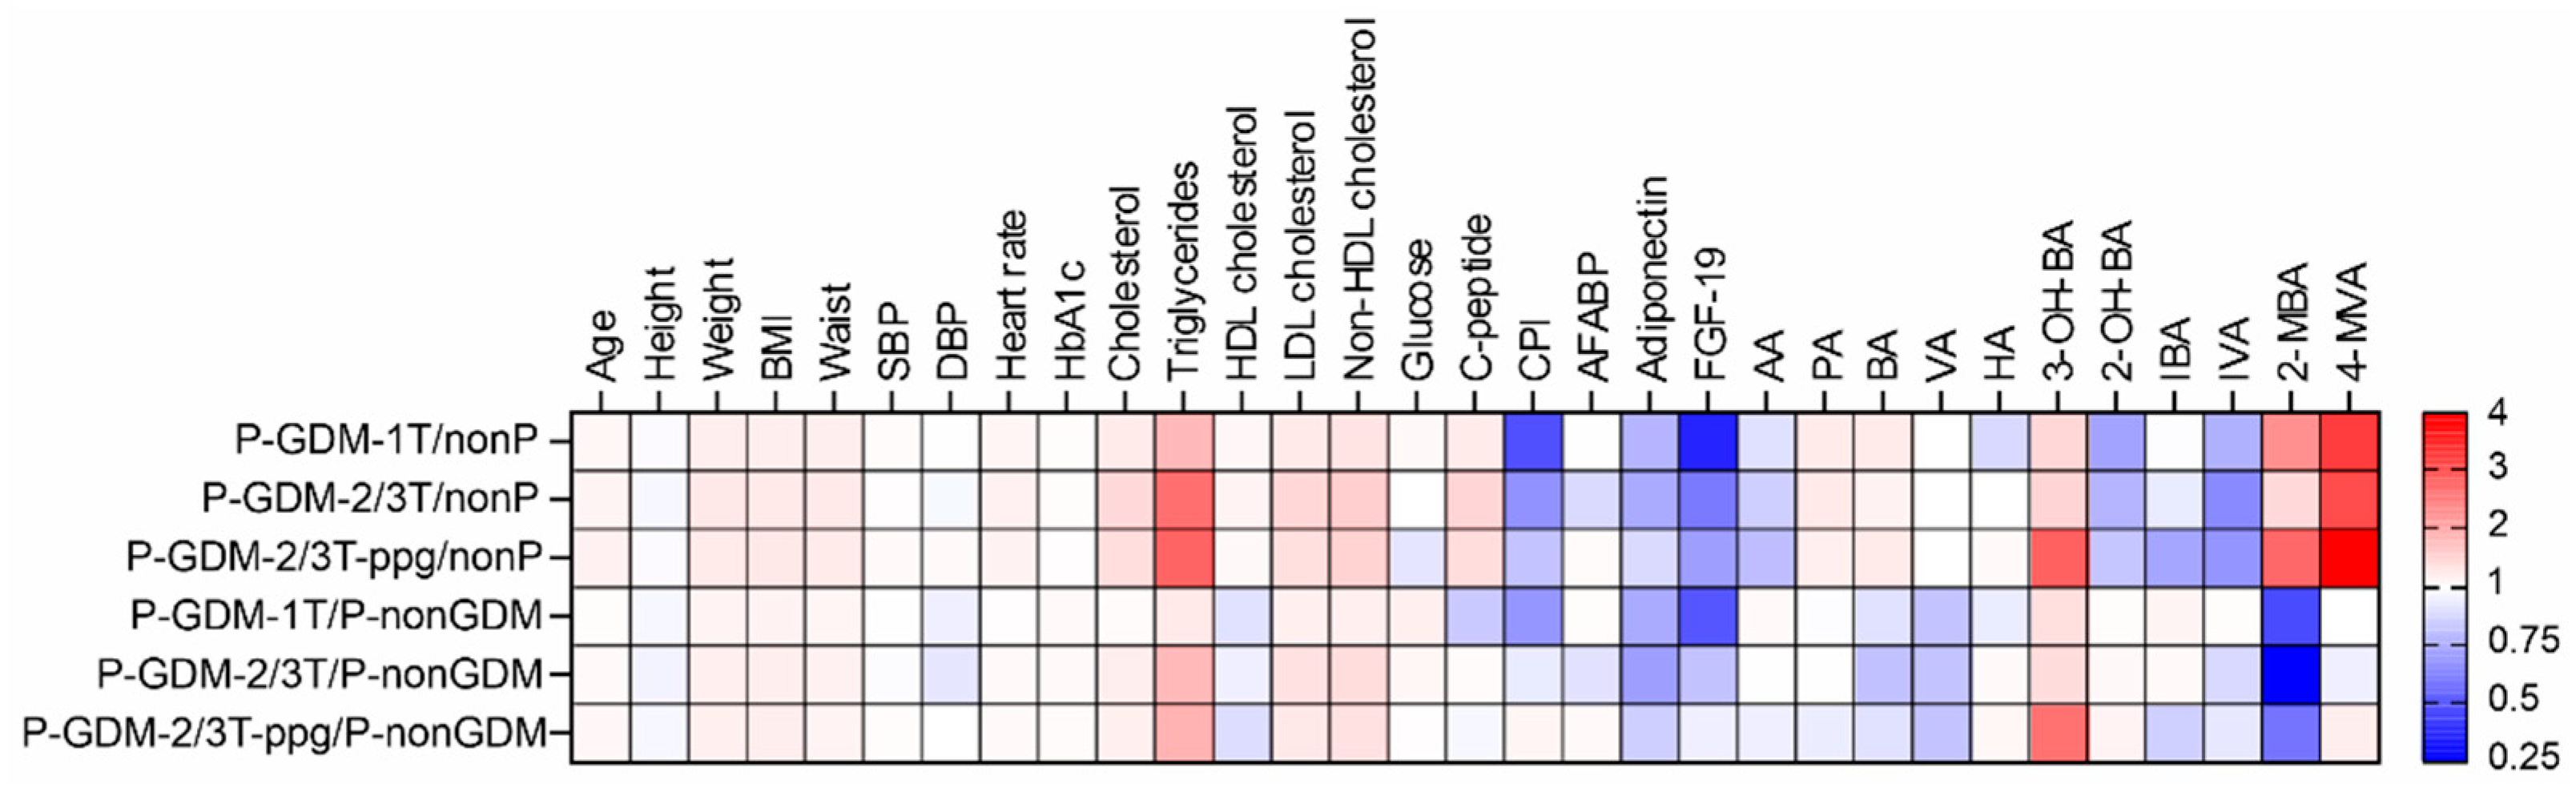
3.6. Biomarkers Associated with the Development of GDM

To calculate the relative changes associated with the development of GDM, the fold change values, compared to both control groups, are depicted by heatmap in Figure 4. Across all three groups of women with GDM, there was a gradual increase in blood triglycerides and 3-OH-BA concentrations relative to both control groups. However, the opposite tendency can be observed for CPI and FGF-19, whose reduced concentration in the blood of women with GDM increased with each trimester in relation to controls, whether in the nonP and P–nonGDM group. However, compared to the control groups, the values of these biomarkers were still reduced.
The reduced plasma concentration of 2-OH-BA of women with GDM relative to the nonP group gradually increased with each trimester, whereas the reduced concentration of IBA and IVA relative to the nonP group decreased even more with trimester. 2-MBA was decreased in women with GDM relative to the P–nonGDM group and elevated relative to the nonP group. It was the most reduced in the P–GDM–2/3T group of all three groups of GDM patients, whereas it was the most elevated in the P–GDM–2/3T–ppg group. It is likely that the most prognostic marker of GDM would be 4-MVA, whose blood level was increased up to 4.33-fold for a group of P–GDM–2/3T–ppg when compared to the nonP group (Table S8).

4. Discussion

In this study, the association of selected SCFA and their derivatives with GDM of different phenotypes was investigated. There are many risk factors for the development of GDM, with advanced maternal age being one of them [1]. In our cohort, women with GDM were older than both groups of controls (Table S3).
Statistically significant differences in the markers of women’s body composition such as weight, BMI, waist and heart rate were found, as well as differences in the biochemical parameters, which included cholesterol, triglycerides, LDL cholesterol, non-HDL cholesterol, glucose, C-peptide, CPI and AFABP (Figure 2). These clinical parameters can be predictive markers for GDM, but they may not be sufficient.
Currently, in the diagnosis of GDM, treatment strategies to prevent the occurrence of the disease are being introduced. It has been found that, when medical therapy for achieving good glycemic control is initiated, blood glucose is reduced, but not other parameters such as the already known key parameters of GDM, lipids, cholesterol or amino acids [1,42]. In our study, glucose showed a gradual downward trend in three groups of women with GDM; on the contrary, cholesterol, triglycerides, LDL cholesterol and non-HDL cholesterol were increased across groups of women with GDM (Figure 2). Triglycerides, which contribute to total blood cholesterol, were elevated 3.03-fold in the P-GDM-2/3T-ppg group compared to the nonP group (Table S8). The dysfunctional fat metabolism is responsible for changes in triglyceride levels [43]. It turns out that, in addition to glucose, lipid levels should also be monitored [44].
In clinical practice, the most common markers of insulin resistance are HOMA and QUICKI, which are based on insulin levels [45]. However, the insulin therapy that some women with GDM in our study underwent may modify insulin levels, and thus, render these markers inaccurate. Therefore, CPI, a marker that also monitors insulin resistance, but relates to C-peptide, was chosen for our study. Indeed, CPI is independent of exogenous insulin administration [46,47].
An equally interesting marker is FGF-19, which is a protein associated with carbohydrate and lipid metabolism as it stimulates glucose uptake in fat cells [48,49,50]. In 2013, Wang and his colleagues [50] found that FGF-19 levels are reduced in patients with GDM and that FGF-19 is closely related to insulin resistance. In our study, both of these markers, CPI and FGF-19, were most reduced in the P–GDM–1T group (Table S8). This may be related to the fact this group of women with the most expressed insulin resistance was diagnosed only in the first trimester. These markers reflect an abnormal metabolic state.
GDM was shown to be related to changes in the microflora of the female gut, which causes subsequent qualitative and quantitative alterations in the SCFA profile of women [13]. Regarding significant differences in plasma levels of SCFA and their derivatives, it is worth mentioning 3-OH-BA, which was significantly increased in the P–GDM–2/3T–ppg group, i.e., in women at the turn of the second and third trimester (Figure 1). 3-OH-BA was the most increased in the P–GDM–2/3T–ppg group among all three GDM groups, with a 2.86-fold increase relative to the P–nonGDM group (Table S8). This confirms that 3-OH-BA is a diagnostically important marker of ketone bodies; for example, it functions as a prognostic biomarker for predicting the onset of glycaemic alterations, which is used to monitor DKA. A slight increase in ketone bodies does not necessarily indicate the worst outcome; on the contrary, a high increase in ketone bodies can lead to life-threatening DKA. Therefore, monitoring ketone bodies during pregnancy is essential for the health of both the foetus and the woman [28,29].
In addition to 3-OH-BA, our results showed a statistically significant difference in terms of decreased concentrations of IVA for the P–GDM–2/3T group compared to the nonP group (Figure 1). The impact of IVA on the host metabolism is still not fully studied and understood [51], but its association with the fermentation of branched amino acids was described [13]. Elevated IVA, IBA and 4-MVA could indicate increased proteolytic fermentation, which is also related to increases in metabolites that are harmful to the body, such as ammonia, phenols or hydrogen sulfide. These are clinically associated with intestinal disorders and cancer. Therefore, it is beneficial to have a diet that is rich in carbohydrates, as saccharolytic fermentation is responsible for the production of AA, PA and BA, whose anti-obesogenic, antioxidant and anticancer benefits are important for health [52]. Farup and Valeur [52] noted that in morbidly obese people, the concentration of IVA, and also of IBA and 4-MVA, increased after weight reduction surgery. This implies that the individual profiles of SCFA derivatives, depending on the weight and our results, show that women’s plasma IVA levels decrease with pregnancy (Figure 4), which could be related to weight gain.
However, this was not the case for the 4-MVA level, which increased with pregnancy up to 4.33-fold in the P–GDM–2/3T–ppg group compared to the nonP group (Table S8). Not much is known about 4-MVA, but it was reported that it may have its origin in the leucine biosynthesis pathway [53,54]. Given that the increase in concentrations of 4-MVA was not observed relative to the P–nonGDM group, it can be said that GDM is not closely related to increased 4-MVA formation, but with pregnancy itself, via the disruption of microbial flora [55,56].
Microbial alterations in the gut microbiome may be related to the development of inflammation in the intestine, which is characteristic of IBDs [57]. During the development of their method, Jaochico et al. [16] found that plasma concentrations of 2-MBA increased in patients with IBD, and since there are no studies that address plasma 2-MBA levels in GDM patients, we included it in our study. The SCFA profile of the GDM patients in our study showed the changes described above; therefore, one would expect that the change would also perhaps be reflected in the 2-MBA levels. Figure 4 shows that the 2-MBA concentrations in GDM patients increased up to 2.96-fold (Table S8) compared to the nonP group. In contrast, 2-MBA levels were reduced in GDM patients relative to the P–nonGDM group (Figure 4). This suggests that 2-MBA is not associated with GDM but with pregnancy itself, during which changes in the woman’s gut microbiome are likely to occur.
A study by Jaworska et al. [58] showed that the amount of SCFA in plasma is due not only to how much the bacteria produce, but also to intestinal permeability. Its increase can be a symptom of intestinal malfunction, which is characteristic not only of diabetes mellitus, obesity and hypertension, but also of IBD. Thus, we can assume that women with GDM may have varying intestinal permeability depending on the type of diabetes mellitus.

5. Conclusions

Our results showed different plasma levels of 3-OH-BA, 4-MVA and IVA in women with GDM, healthy pregnant women and non-pregnant women. 3-OH-BA reflected the ketogenic state of GDM, where a gradual increase in its concentration was observed within the different phenotypes of GDM. Levels of 4-MVA were elevated in all pregnant women, while IVA levels were decreased. Differences were also observed in baseline body composition characteristics and biochemical parameters. CPI and FGF-19 were most reduced in the P–GDM–1T group, probably because women have the most developed insulin resistance. Elevated concentrations of triacylglycerides and cholesterols in all three groups of women, with different phenotypes of GDM, were observed. These findings suggest the importance of monitoring not only glucose, but also SCFA, baseline body composition characteristics and biochemistry parameters. To further understand the changes in women with GDM, analysis of the stool microbiome and its correlation with plasma SCFA levels is planned.

Supplementary Materials

The following are available online at https://www.mdpi.com/article/10.3390/separations8100188/s1, Figure S1. Profile of gradient elution of the LC–MS/MS method with mobile phase A nad B (0.5% FA in water and MeOH:IPA at a 9:1 ratio). Figure S2. LC–MS/MS chromatogram of SCFA, their derivatives and IS in the highest level of CAL1 and CAL2 mixtures. Figure S3. LC–MS/MS chromatogram of SCFA, their derivatives and IS in plasma sample of a patient with GDM. Figure S4. Distribution of SCFA and their derivatives without statistical significance for all groups of non-pregnant (blue) and pregnant (red) women. Asterisks represent the outliers. Figure S5. Distribution of baseline body composition characteristics and biochemical parameters without statistical significance for all groups of non-pregnant (blue) and pregnant (red) women. Asterisks represent the outliers. Figure S6. The values of Pearson’s correlation coefficients between all measurement parameters across all groups. Critical value of significance is r > 0.196. The color of cells corresponds to the values of Pearson’s correlation coefficients. Red/blue color means positive/negative correlation and color saturation represents the degree of correlation. Figure S7. Pearson’s correlation (n = 31) of SCFA and their derivatives with baseline body composition characteristics and biochemical biomarkers for P-GDM-1T group. Critical value of significance is r = 0.3494. Red/blue color corresponds to positive/negative correlation and color saturation represents the degree of correlation. Figure S8. Pearson’s correlation (n = 31) of SCFA and their derivatives with baseline body composition characteristics and biochemical biomarkers for P-GDM-2/3T group. Critical value of significance is r = 0.3494. Red/blue color corresponds to positive/negative correlation and color saturation represents the degree of correlation. Figure S9. Pearson’s correlation (n = 22) of SCFA and their derivatives with baseline body composition characteristics and biochemical biomarkers for P-GDM-2/3T-ppg group. Critical value of significance is r = 0.4044. Red/blue color corresponds to positive/negative correlation and color saturation represents the degree of correlation. Figure S10. Pearson’s correlation (n = 20) of SCFA and their derivatives with baseline body composition characteristics and biochemical biomarkers for P-nonGDM group. Critical value of significance is r = 0.4227. Red/blue color corresponds to positive/negative correlation and color saturation represents the degree of correlation. Figure S11. Pearson’s correlation (n = 20) of SCFA and their derivatives with baseline body composition characteristics and biochemical biomarkers for nonP group. Critical value of significance is r = 0.4227. Red/blue color corresponds to positive/negative correlation and color saturation represents the degree of correlation. Table S1. MS/MS parameters transitions and analytical parameters for SCFA, their derivatives and IS. Table S2. Linearity, LOD, LOQ and ULOQ of SCFA and their derivatives. Table S3. The baseline body composition characteristics of each group. Table S4. The biochemical parameters of each group. Table S5. The concentrations of SCFA and their derivatives of each group. Table S6. ANOVA test comparing mean values of SCFA and their derivatives. p-value < 0.05 is statistically significant (bold). Table S7. ANOVA test comparing mean values of baseline body composition characteristics and biochemical parameters. p-value < 0.05 is statistically significant (bold). Table S8. Fold-change values between the groups of women with GDM and controls.

Author Contributions

Conceptualization, D.K. and D.F.; methodology, E.I., B.P., J.F., O.K., D.F. and D.K.; validation, E.I., B.P. and J.F.; investigation, D.K. and D.F.; resources, D.K. and D.F.; data curation, E.I., B.P. and J.F.; writing—original draft preparation, E.I., B.P., D.F. and D.K.; writing—review and editing, E.I., B.P., J.F., O.K., D.F. and D.K.; visualization, E.I., B.P. and D.F.; supervision, D.K.; funding acquisition, D.K. All authors have read and agreed to the published version of the manuscript.

Funding

This research was funded by the Ministry of Health of the Czech Republic, NV18–01–00139 and FNOl, 00098892.

Institutional Review Board Statement

The study was conducted according to the guidelines of the Declaration of Helsinki, and approved by the Institutional Ethics Committee of University Hospital Olomouc (approval no. 120/17).

Informed Consent Statement

Informed consent was obtained from all subjects involved in the study.

Conflicts of Interest

The authors declare no conflict of interest.

References

  1. Alesi, S.; Ghelani, D.; Rassie, K.; Mousa, A. Metabolomic Biomarkers in Gestational Diabetes Mellitus: A Review of the Evidence. Int. J. Mol. Sci. 2021, 22, 5512. [Google Scholar] [CrossRef]
  2. Metzger, B.E.; Gabbe, S.G.; Persson, B.; Buchanan, T.A.; Catalano, P.A.; Damm, P.; Dyer, A.R.; de Leiva, A.; Hod, M.; Kitzmiler, J.L.; et al. International Association of Diabetes and Pregnancy Study Groups Recommendations on the Diagnosis and Classification of Hyperglycemia in Pregnancy. Diabetes Care 2010, 33, 676–682. [Google Scholar] [CrossRef] [Green Version]
  3. Cosson, E.; Carbillon, L.; Valensi, P. High Fasting Plasma Glucose during Early Pregnancy: A Review about Early Gestational Diabetes Mellitus. J. Diabetes Res. 2017, 2017, 8921712. [Google Scholar] [CrossRef] [PubMed]
  4. Immanuel, J.; Simmons, D.; Harreiter, J.; Desoye, G.; Corcoy, R.; Adelantado, J.M.; Devlieger, R.; Lapolla, A.; Dalfra, M.G.; Bertolotto, A.; et al. Metabolic Phenotypes of Early Gestational Diabetes Mellitus and Their Association with Adverse Pregnancy Outcomes. Diabet. Med. 2021, 38, e14413. [Google Scholar] [CrossRef] [PubMed]
  5. Koren, O.; Goodrich, J.K.; Cullender, T.C.; Spor, A.; Laitinen, K.; Bäckhed, H.K.; Gonzalez, A.; Werner, J.J.; Angenent, L.T.; Knight, R.; et al. Host Remodeling of the Gut Microbiome and Metabolic Changes during Pregnancy. Cell 2012, 150, 470–480. [Google Scholar] [CrossRef] [PubMed] [Green Version]
  6. Liu, H.; Pan, L.-L.; Lv, S.; Yang, Q.; Zhang, H.; Chen, W.; Lv, Z.; Sun, J. Alterations of Gut Microbiota and Blood Lipidome in Gestational Diabetes Mellitus With Hyperlipidemia. Front. Physiol. 2019, 10, 1015. [Google Scholar] [CrossRef] [PubMed] [Green Version]
  7. Ulven, T. Short-Chain Free Fatty Acid Receptors FFA2/GPR43 and FFA3/GPR41 as New Potential Therapeutic Targets. Front. Endocrinol. 2012, 3, 111. [Google Scholar] [CrossRef] [PubMed] [Green Version]
  8. Den Besten, G.; den Besten, G.; Bleeker, A.; Gerding, A.; van Eunen, K.; Havinga, R.; van Dijk, T.H.; Oosterveer, M.H.; Jonker, J.W.; Groen, A.K.; et al. Short-Chain Fatty Acids Protect Against High-Fat Diet–Induced Obesity via a PPARγ-Dependent Switch From Lipogenesis to Fat Oxidation. Diabetes 2015, 64, 2398–2408. [Google Scholar] [CrossRef] [Green Version]
  9. Nishina, P.M.; Freedland, R.A. Effects of Propionate on Lipid Biosynthesis in Isolated Rat Hepatocytes. J. Nutr. 1990, 120, 668–673. [Google Scholar] [CrossRef] [Green Version]
  10. Tan, J.; McKenzie, C.; Vuillermin, P.J.; Goverse, G.; Vinuesa, C.G.; Mebius, R.E.; Macia, L.; Mackay, C.R. Dietary Fiber and Bacterial SCFA Enhance Oral Tolerance and Protect against Food Allergy through Diverse Cellular Pathways. Cell Rep. 2016, 15, 2809–2824. [Google Scholar] [CrossRef] [Green Version]
  11. Ruan, W.; Engevik, M.A.; Spinler, J.K.; Versalovic, J. Healthy Human Gastrointestinal Microbiome: Composition and Function After a Decade of Exploration. Dig. Dis. Sci. 2020, 65, 695–705. [Google Scholar] [CrossRef] [PubMed] [Green Version]
  12. Zeng, M.; Cao, H. Fast Quantification of Short Chain Fatty Acids and Ketone Bodies by Liquid Chromatography-Tandem Mass Spectrometry after Facile Derivatization Coupled with Liquid-Liquid Extraction. J. Chromatogr. B Analyt. Technol. Biomed. Life Sci. 2018, 1083, 137–145. [Google Scholar] [CrossRef] [PubMed]
  13. Ziętek, M.; Celewicz, Z.; Szczuko, M. Short-Chain Fatty Acids, Maternal Microbiota and Metabolism in Pregnancy. Nutrients 2021, 13, 1244. [Google Scholar] [CrossRef]
  14. Macfarlane, S.; Macfarlane, G.T. Regulation of Short-Chain Fatty Acid Production. Proc. Nutr. Soc. 2003, 62, 67–72. [Google Scholar] [CrossRef]
  15. Wong, J.M.W.; de Souza, R.; Kendall, C.W.C.; Emam, A.; Jenkins, D.J.A. Colonic Health: Fermentation and Short Chain Fatty Acids. J. Clin. Gastroenterol. 2006, 40, 235–243. [Google Scholar] [CrossRef]
  16. Jaochico, A.; Sangaraju, D.; Shahidi-Latham, S.K. A Rapid Derivatization Based LC-MS/MS Method for Quantitation of Short Chain Fatty Acids in Human Plasma and Urine. Bioanalysis 2019, 11, 741–753. [Google Scholar] [CrossRef]
  17. Cummings, J.H.; Pomare, E.W.; Branch, W.J.; Naylor, C.P.; Macfarlane, G.T. Short Chain Fatty Acids in Human Large Intestine, Portal, Hepatic and Venous Blood. Gut 1987, 28, 1221–1227. [Google Scholar] [CrossRef] [PubMed] [Green Version]
  18. Pouteau, E.; Meirim, I.; Métairon, S.; Fay, L.B. Acetate, Propionate and Butyrate in Plasma: Determination of the Concentration and Isotopic Enrichment by Gas Chromatography/mass Spectrometry with Positive Chemical Ionization. J. Mass Spectrom. 2001, 36, 798–805. [Google Scholar] [CrossRef]
  19. Zalar, B.; Haslberger, A.; Peterlin, B. The Role of Microbiota in Depression—A Brief Review. Psychiatr. Danub. 2018, 30, 136–141. [Google Scholar] [CrossRef] [PubMed]
  20. Arpaia, N.; Campbell, C.; Fan, X.; Dikiy, S.; van der Veeken, J.; deRoos, P.; Liu, H.; Cross, J.R.; Pfeffer, K.; Coffer, P.J.; et al. Metabolites Produced by Commensal Bacteria Promote Peripheral Regulatory T-Cell Generation. Nature 2013, 504, 451–455. [Google Scholar] [CrossRef]
  21. Furusawa, Y.; Obata, Y.; Fukuda, S.; Endo, T.A.; Nakato, G.; Takahashi, D.; Nakanishi, Y.; Uetake, C.; Kato, K.; Kato, T.; et al. Commensal Microbe-Derived Butyrate Induces the Differentiation of Colonic Regulatory T Cells. Nature 2013, 504, 446–450. [Google Scholar] [CrossRef] [PubMed]
  22. Chang, P.V.; Hao, L.; Offermanns, S.; Medzhitov, R. The Microbial Metabolite Butyrate Regulates Intestinal Macrophage Function via Histone Deacetylase Inhibition. Proc. Natl. Acad. Sci. USA 2014, 111, 2247–2252. [Google Scholar] [CrossRef] [Green Version]
  23. Newman, J.C.; Verdin, E. Ketone Bodies as Signaling Metabolites. Trends Endocrinol. Metab. 2014, 25, 42–52. [Google Scholar] [CrossRef] [Green Version]
  24. Mizuno, Y.; Harada, E.; Nakagawa, H.; Morikawa, Y.; Shono, M.; Kugimiya, F.; Yoshimura, M.; Yasue, H. The Diabetic Heart Utilizes Ketone Bodies as an Energy Source. Metabolism 2017, 77, 65–72. [Google Scholar] [CrossRef] [Green Version]
  25. Soto-Mota, A.; Norwitz, N.G.; Clarke, K. Why a D-β-Hydroxybutyrate Monoester? Biochem. Soc. Trans. 2020, 48, 51–59. [Google Scholar] [CrossRef] [PubMed] [Green Version]
  26. Mierziak, J.; Burgberger, M.; Wojtasik, W. 3-Hydroxybutyrate as a Metabolite and a Signal Molecule Regulating Processes of Living Organisms. Biomolecules 2021, 11, 402. [Google Scholar] [CrossRef]
  27. Møller, N. Ketone Body, 3-Hydroxybutyrate: Minor Metabolite—Major Medical Manifestations. J. Clin. Endocrinol. Metab. 2020, 105. [Google Scholar] [CrossRef]
  28. Spanou, L.; Dalakleidi, K.; Zarkogianni, K.; Papadimitriou, A.; Nikita, K.; Vasileiou, V.; Alevizaki, M.; Anastasiou, E. Ketonemia and Ketonuria in Gestational Diabetes Mellitus. Hormones 2015, 14, 644–650. [Google Scholar] [CrossRef] [PubMed]
  29. Dudzik, D.; Zorawski, M.; Skotnicki, M.; Zarzycki, W.; García, A.; Angulo, S.; Paz Lorenzo, M.; Barbas, C.; Pilar Ramos, M. GC–MS Based Gestational Diabetes Mellitus Longitudinal Study: Identification of 2-and 3-Hydroxybutyrate as Potential Prognostic Biomarkers. J. Pharm. Biomed. Anal. 2017, 144, 90–98. [Google Scholar] [CrossRef] [Green Version]
  30. Shafaei, A.; Vamathevan, V.; Pandohee, J.; Lawler, N.G.; Broadhurst, D.; Boyce, M.C. Sensitive and Quantitative Determination of Short-Chain Fatty Acids in Human Serum Using Liquid Chromatography Mass Spectrometry. Anal. Bioanal. Chem. 2021. [Google Scholar] [CrossRef]
  31. Gu, H.; Jasbi, P.; Patterson, J.; Jin, Y. Enhanced Detection of Short-Chain Fatty Acids Using Gas Chromatography Mass Spectrometry. Curr. Protoc. 2021, 1, e177. [Google Scholar] [CrossRef]
  32. Douny, C.; Dufourny, S.; Brose, F.; Verachtert, P.; Rondia, P.; Lebrun, S.; Marzorati, M.; Everaert, N.; Delcenserie, V.; Scippo, M.-L. Development of an Analytical Method to Detect Short-Chain Fatty Acids by SPME-GC–MS in Samples Coming from an in Vitro Gastrointestinal Model. J. Chromatogr. B 2019, 1124, 188–196. [Google Scholar] [CrossRef]
  33. Zhang, S.; Wang, H.; Zhu, M.-J. A Sensitive GC/MS Detection Method for Analyzing Microbial Metabolites Short Chain Fatty Acids in Fecal and Serum Samples. Talanta 2019, 196, 249–254. [Google Scholar] [CrossRef] [PubMed]
  34. Song, H.E.; Lee, H.Y.; Kim, S.J.; Back, S.H.; Yoo, H.J. A Facile Profiling Method of Short Chain Fatty Acids Using Liquid Chromatography-Mass Spectrometry. Metabolites 2019, 9, 173. [Google Scholar] [CrossRef] [PubMed] [Green Version]
  35. Monleón, D.; Morales, J.M.; Barrasa, A.; López, J.A.; Vázquez, C.; Celda, B. Metabolite Profiling of Fecal Water Extracts from Human Colorectal Cancer. NMR Biomed. 2009, 22, 342–348. [Google Scholar] [CrossRef]
  36. Ndagijimana, M.; Laghi, L.; Vitali, B.; Placucci, G.; Brigidi, P.; Guerzoni, M.E. Effect of a Synbiotic Food Consumption on Human Gut Metabolic Profiles Evaluated by (1)H Nuclear Magnetic Resonance Spectroscopy. Int. J. Food Microbiol. 2009, 134, 147–153. [Google Scholar] [CrossRef] [PubMed]
  37. Le Gall, G.; Noor, S.O.; Ridgway, K.; Scovell, L.; Jamieson, C.; Johnson, I.T.; Colquhoun, I.J.; Kemsley, E.K.; Narbad, A. Metabolomics of Fecal Extracts Detects Altered Metabolic Activity of Gut Microbiota in Ulcerative Colitis and Irritable Bowel Syndrome. J. Proteome Res. 2011, 10, 4208–4218. [Google Scholar] [CrossRef]
  38. Jacobs, D.M.; Deltimple, N.; van Velzen, E.; van Dorsten, F.A.; Bingham, M.; Vaughan, E.E.; van Duynhoven, J. (1)H NMR Metabolite Profiling of Feces as a Tool to Assess the Impact of Nutrition on the Human Microbiome. NMR Biomed. 2008, 21, 615–626. [Google Scholar] [CrossRef]
  39. Garcia, A.; Olmo, B.; Lopez-Gonzalvez, A.; Cornejo, L.; Rupérez, F.J.; Barbas, C. Capillary Electrophoresis for Short Chain Organic Acids in Faeces Reference Values in a Mediterranean Elderly Population. J. Pharm. Biomed. Anal. 2008, 46, 356–361. [Google Scholar] [CrossRef]
  40. Jiang, R.; Jiao, Y.; Zhang, P.; Liu, Y.; Wang, X.; Huang, Y.; Zhang, Z.; Xu, F. Twin Derivatization Strategy for High-Coverage Quantification of Free Fatty Acids by Liquid Chromatography–Tandem Mass Spectrometry. Anal. Chem. 2017, 89, 12223–12230. [Google Scholar] [CrossRef]
  41. Weathington, B.L.; Cunningham, C.J.L.; Pittenger, D.J. Understanding Business Research: Weathington/Understanding Business Research; John Wiley & Sons: Nashville, TN, USA, 2012; ISBN 9781118134269. [Google Scholar]
  42. Pinto, J.; Almeida, L.M.; Martins, A.S.; Duarte, D.; Barros, A.S.; Galhano, E.; Pita, C.; Almeida, M.D.C.; Carreira, I.M.; Gil, A.M. Prediction of Gestational Diabetes through NMR Metabolomics of Maternal Blood. J. Proteome Res. 2015, 14, 2696–2706. [Google Scholar] [CrossRef] [PubMed]
  43. Andersson-Hall, U.; Gustavsson, C.; Pedersen, A.; Malmodin, D.; Joelsson, L.; Holmäng, A. Higher Concentrations of BCAAs and 3-HIB Are Associated with Insulin Resistance in the Transition from Gestational Diabetes to Type 2 Diabetes. J. Diabetes Res. 2018, 2018, 4207067. [Google Scholar] [CrossRef]
  44. Cibickova, L.; Schovanek, J.; Karasek, D. Changes in Serum Lipid Levels during Pregnancy in Women with Gestational Diabetes. A Narrative Review. Biomed. Pap. Med. Fac. Univ. Palacky Olomouc Czech. Repub. 2021, 165, 8–12. [Google Scholar] [CrossRef]
  45. Antuna-Puente, B.; Faraj, M.; Karelis, A.D.; Garrel, D.; Prud’homme, D.; Rabasa-Lhoret, R.; Bastard, J.-P. HOMA or QUICKI: Is It Useful to Test the Reproducibility of Formulas? Diabetes Metab. 2008, 34, 294–296. [Google Scholar] [CrossRef]
  46. Funakoshi, S.; Fujimoto, S.; Hamasaki, A.; Fujiwara, H.; Fujita, Y.; Ikeda, K.; Takahara, S.; Nagashima, K.; Hosokawa, M.; Seino, Y.; et al. Utility of Indices Using C-Peptide Levels for Indication of Insulin Therapy to Achieve Good Glycemic Control in Japanese Patients with Type 2 Diabetes. J. Diabetes Investig. 2011, 2, 297–303. [Google Scholar] [CrossRef] [PubMed] [Green Version]
  47. Yin, P.; Shao, P.; Liu, H.; Li, W.; Wang, L.; Wang, J.; Zhang, S.; Leng, J.; Li, N.; Tian, H.; et al. C-Peptide Levels and the Risk of Diabetes and Pre-Diabetes among Chinese Women with Gestational Diabetes. J. Diabetes Complicat. 2017, 31, 1658–1662. [Google Scholar] [CrossRef]
  48. Somm, E.; Jornayvaz, F.R. Fibroblast Growth Factor 15/19: From Basic Functions to Therapeutic Perspectives. Endocr. Rev. 2018, 39, 960–989. [Google Scholar] [CrossRef] [Green Version]
  49. Adams, A.C.; Coskun, T.; Rovira, A.R.I.; Schneider, M.A.; Raches, D.W.; Micanovic, R.; Bina, H.A.; Dunbar, J.D.; Kharitonenkov, A. Fundamentals of FGF19 & FGF21 Action in Vitro and in Vivo. PLoS ONE 2012, 7, e38438. [Google Scholar] [CrossRef] [Green Version]
  50. Wang, D.; Zhu, W.; Li, J.; An, C.; Wang, Z. Serum Concentrations of Fibroblast Growth Factors 19 and 21 in Women with Gestational Diabetes Mellitus: Association with Insulin Resistance, Adiponectin, and Polycystic Ovary Syndrome History. PLoS ONE 2013, 8, e81190. [Google Scholar] [CrossRef]
  51. Rios-Covian, D.; González, S.; Nogacka, A.M.; Arboleya, S.; Salazar, N.; Gueimonde, M.; de Los Reyes-Gavilán, C.G. An Overview on Fecal Branched Short-Chain Fatty Acids Along Human Life and as Related With Body Mass Index: Associated Dietary and Anthropometric Factors. Front. Microbiol. 2020, 11, 973. [Google Scholar] [CrossRef] [PubMed]
  52. Farup, P.G.; Valeur, J. Changes in Faecal Short-Chain Fatty Acids after Weight-Loss Interventions in Subjects with Morbid Obesity. Nutrients 2020, 12, 802. [Google Scholar] [CrossRef] [PubMed] [Green Version]
  53. Tanadchangsaeng, N.; Kitagawa, A.; Yamamoto, T.; Abe, H.; Tsuge, T. Identification, Biosynthesis, and Characterization of Polyhydroxyalkanoate Copolymer Consisting of 3-Hydroxybutyrate and 3-Hydroxy-4-Methylvalerate. Biomacromolecules 2009, 10, 2866–2874. [Google Scholar] [CrossRef]
  54. Lau, N.-S.; Chee, J.-Y.; Tsuge, T.; Sudesh, K. Biosynthesis and Mobilization of a Novel Polyhydroxyalkanoate Containing 3-Hydroxy-4-Methylvalerate Monomer Produced by Burkholderia Sp. USM (JCM15050). Bioresour. Technol. 2010, 101, 7916–7923. [Google Scholar] [CrossRef] [PubMed]
  55. Barbut, F.; Mastrantonio, P.; Delmée, M.; Brazier, J.; Kuijper, E.; Poxton, I. European Study Group on Clostridium difficile (ESGCD) Prospective Study of Clostridium Difficile Infections in Europe with Phenotypic and Genotypic Characterisation of the Isolates. Clin. Microbiol. Infect. 2007, 13, 1048–1057. [Google Scholar] [CrossRef] [PubMed] [Green Version]
  56. Cairns, M.D.; Stabler, R.A.; Shetty, N.; Wren, B.W. The Continually Evolving Clostridium Difficile Species. Future Microbiol. 2012, 7, 945–957. [Google Scholar] [CrossRef] [PubMed]
  57. Kotanko, P.; Carter, M.; Levin, N.W. Intestinal Bacterial Microflora—A Potential Source of Chronic Inflammation in Patients with Chronic Kidney Disease. Nephrol. Dial. Transplant. 2006, 21, 2057–2060. [Google Scholar] [CrossRef] [PubMed] [Green Version]
  58. Jaworska, K.; Konop, M.; Bielinska, K.; Hutsch, T.; Dziekiewicz, M.; Banaszkiewicz, A.; Ufnal, M. Inflammatory Bowel Disease Is Associated with Increased Gut-to-Blood Penetration of Short-Chain Fatty Acids: A New, Non-Invasive Marker of a Functional Intestinal Lesion. Exp. Physiol. 2019, 104, 1226–1236. [Google Scholar] [CrossRef]
Figure 1. Distribution of derivatives of SCFA for all groups of non-pregnant (blue) and pregnant (red) women with statistical significance (* p < 0.05, ** p < 0.01, *** p < 0.001, **** p < 0.0001).
Separations 08 00188 g001
Figure 2. Distribution of baseline body composition characteristics and biochemical parameters for all groups of non-pregnant (blue) and pregnant (red) women with statistical significance (* p < 0.05, ** p < 0.01, *** p < 0.001, **** p < 0.0001). Abbreviations: AFABP, adipocyte fatty acid-binding protein.
Separations 08 00188 g002
Figure 3. Pearson correlation (n = 124) of SCFA and their derivatives with baseline body composition characteristics and biochemical biomarkers for all groups. Critical value of significance is r > 0.196. Correlations above the critical value are highlighted with +/− signs. Abbreviations: BMI, body-mass index; SBP, systolic blood pressure; DBP, diastolic blood pressure; HbA1c, glycated hemoglobin.
Separations 08 00188 g003
Figure 4. Heat map of fold-change values between the groups of women with GDM and controls.
Separations 08 00188 g004
Publisher’s Note: MDPI stays neutral with regard to jurisdictional claims in published maps and institutional affiliations.

