Article

Quantitative Explanation of Basic Compound Retention Mechanisms in Reversed-Phase Mode Liquid Chromatography

Health Research Foundation, Research Institute for Production Development 4F, Sakyo-ku, Kyoto 606-0805, Japan
Separations 2020, 7(4), 61; https://doi.org/10.3390/separations7040061
Submission received: 1 September 2020 / Revised: 23 September 2020 / Accepted: 23 September 2020 / Published: 30 October 2020

Abstract

:
The quantitative analysis of the chromatographic behavior of basic compounds measured with pentyl-, hexenyl-, and octyl-bonded silica gels were analyzed in silico employing model phases. The main retention force was the van der Waals (VW) interaction, and the main desorption force was an electrostatic (ES) interaction. The contribution of hydrogen bonding (HB) was weak compared to that for acidic compounds. The quantitative explanation was achieved utilizing the calculated VW, HB, and ES energy values obtained from a molecular mechanics program. The electron localization was observed at the molecular interaction-site calculated MOPAC program. This fundamental approach was like that of explaining chemical reactions. The difference was electron localization in chromatography or electron transfer in a chemical reaction.

1. Introduction

Basic compounds were generally purified and analyzed by ion-exchange (IE) liquid chromatography (LC). The introduction of high-performance (HP) liquid chromatography (HPLC) changed the chromatographic method. Generally, packing materials for IELC are synthesized from organic polymers. Therefore, such packing materials are chemically stable in both strongly acidic and basic eluents. However, newly introduced packing materials for HPLC are generally surface-modified silica gels with limitations in strongly acidic and basic eluents. Specifically, chemically modified silica gels were resisted in up to pH 8.0 eluents. The other limitations of basic compounds are the existence of free silanol on the surface which forms hydrogen bonding (HB) with nitrogen-containing compounds, and trace metals, which form chelates with the analytes. These molecular interactions could cause fronting and tailing peaks that deteriorate the quality control. Furthermore, the peaks do not appear by the adsorption. Therefore, several approaches have been applied; alumina, titania, and zirconia have been utilized instead of silica gels [1]. However, the surface modification is still a challenge, compared to silica gels were utilized. The performance of surface modified-silica gels was evaluated for basic compounds by the modification of the eluent components. The peak symmetry of the basic compounds depended on the manufactured columns [2]. Therefore, amine modifiers were added to the eluents to conceal the active silanol and improve the peak symmetry of basic compounds. To achieve this, a suitable chemical for this purpose is 1,8-diaminooctane. Another approach was the addition of counter ions to form an ion-pair that will block HB of basic compounds [3,4]. Further, N,N-dimethyloctylamine was also a beneficial additive [5]. Other additives were triethylamine [6], perchlorate [7], ammonium hydrogencarbonate [8], butyl-, pentyl-, hexyl-, cyclopentyl-, cycloheptyl-, and N,N-dimethyloctyl-amines, tributylmethylammonium chloride [9], and tetrabutylammonium [10].
Furthermore, chemically modified silica gels are the generally employed as packing materials despite their chemical instabilities. Moreover, the surface modification method is critical for the chromatography of nitrogen-containing (basic) compounds even if the purities of the silica gels are >99.999%. Further development of chemically stable bonded silica gels enable the simple handling of the chromatographic separation of basic compounds in reversed-phase [11,12] and ion-exchange modes [13]. The silica-based sulfonate-modified reversed stationary phase was also developed [14,15]. Propylsulfonic acid modified silica gel with eluent containing ammonium perchlorate was effectively employed for the chromatography of basic compounds [16]. A mixed-mode reversed-phase/weak cation exchange (carboxyl-form ion-exchange) was demonstrated in catecholamines and amphetamine related drugs [17]. Basic and acidic additives were utilized for the enantiomeric separation of some basic chiral drugs in polysaccharide-based chiral columns [18]. Furthermore, polymethylsilsesquioxane microspheres were synthesized for basic compounds as low silanol activity chromatographic stationary phase [19].
Presently, bonded-phase silica gels with active silanol groups are expected to be inactivated, and their peak shapes are expected to be improved for the quantitative analysis. However, the chromatographic behaviors of nitrogen-containing compounds are different from those of acidic compounds. For example, the retention of aniline in reversed-phase mode LC is weak, compared to that of benzoic acid. This is because of the weak hydrophobicity related to their octanol–water partition coefficient (log P). However, the retention is also less than that of chlorobenzene in the bonded-phase exhibiting hydrogen-bond acceptability. The hydrogen-bonding capability of an amino group does not contribute to the molecular interaction, because of the electron delocalization in the molecules. The electrons of chlorobenzene are well localized based on the calculated atomic partial charge (apc), compared to that of aniline. The results are further studied by MOPAC calculations as the substituent effect of electron localization. The electron localization effect on a chemical reaction is known as Hammett’s s constant obtained from thin-layer LC. When electrons are transferred to form a new compound, it is known as a chemical reaction. However, electron localization supports different retentions, that results in chromatographic retention differences. The detail of the retention mechanisms was investigated by a simple model, and by model phases.

2. Experimental

The fundamental experimental processes are as previously described before [20,21,22,23,24,25,26]. The difference is the structures of the model phases. First, polycyclohexane type model phase was constructed to find a possibility to obtain molecular interaction energy values. Then, polycloxane phase was constructed and bonded to alkyl groups. It is tedious approach to construct a homogenated model phase. An alkyl-bonded polysiloxane phase was practically used to analyze retention of phenolic compounds, because one side interaction could relate log k values. However, such flat model did not provide high precision for drug analysis because of the poor surface contact. Therefore, construction of a phase with a pocket where drugs may have maximum contact surface area was constructed. Dimethyl-alkyl mono-chlorosilane-bonded phase was constructed as a model phase. The alkyl groups produced a tightly dense phase. Such a bonded phase was not synthesized by porous silica gels. However, such phases were employed to analyze the indirect interaction between an analyte and a model phase. The model hexyl-, phenylhexyl-, and hexenyl-phases are shown in Figure 1A–C, where aniline contacted with these phases. The bottom silicon trioxide was locked as an image of the silica gel. The bonded groups were allowed to contact with the analyte. An analyte was placed at a certain distance from the end of the bonded group. Thereafter, the pair of compounds were optimized to obtain a complex form, and the value of the molecular interaction (MI) energy were calculated by the following equations. Atomic partial charge (apc) was calculated using molecular orbital package (MOPAC) PM5 program.
These molecular interaction (MI) energy values (kcal mol−1) are the sum of a solute and model phase energy values minus a complex energy value, calculated as per the following Equations (1)–(3) [27]. MIHB, MIES, and MIVW are MI energy of hydrogen bonding (HB), electrostatic (ES), and van der Waals (VW) energy values.
MIHB = HB (molecule A) + HB (molecule B) − HB (molecule A and molecule B complex)
MIES = ES (molecule A) + ES (molecule B) − ES (molecule A and molecule B complex)
MIVW = VW (molecule A) + VW (molecule B) − VW (molecule A and molecule B complex)
The relative MIHB, MIES, and MIVW values indicate the contribution level.

3. Results and Discussion

The simple study was conducted with small analytes and one alkyldimethylsilane-bonded silicon trioxide. The properties of the analytes are summarized in Table 1.
The retention order of these benzene derivatives in the reversed-phase mode LC employing an octadecyl-bonded phase in 50% aqueous ethylalcohol was benzoic acid (log P = 1.79) < phenol (log P = 1.54) < benzene (log P = 2.06) < chlorobenzene (log P = 2.81) < ethylbenzene (log P = 3.12). The different elutions of benzoic acid and phenol may be due to the ionization of benzoic acid in the aqueous eluent; ionization reduces the hydrophobicity, and the retention is weakened in the reversed-phase mode LC employing the alkyl-bonded phases.
The apc of the head of the bonded-phase silica gel was negative except in ionized amino. However, that of the end hydrogen was positive. The calculated apc of the head of substituents is shown in Table 2.
No simple relation existed between the substituent apc of the analyte and those of the model phases. The apc balance indicated that the localization degree of the electron within the analytes contributed to the strength of the molecular interaction between an analyte and a model bonded-phase.
The aniline recognition of this model phase was also studied. The amino or phenyl group of aniline was faced against these model phases within certain distance, and the MI energy values were obtained by optimizing the complex by a molecular mechanics program in Table 3. Apc indicated that the localization of the electron was obtained by the MOPAC PM5 program. The distance between the analyte and the model phase varied according to the strength of MI. The distance indicated the strength of MIs. The reference molecules were benzene, methylbenzene, chlorobenzene, phenol, and benzoic acid. The calculated MI energies were the HB, electrostatic (ES), and van der Waals (VW) energy values. These individual energy values indicated the specificity of the MI mechanisms. The change of apc values indicated the MI center and the strength of electron localization.
All the analytes contacted with the model hexyl phase via the VW force. Chlorobenzene that exhibited strong electron localization, recognized the model hexyl-phase at a longer distance (4 Å) than the others and demonstrated a strong MI by a VW energy value of 2.4 kcal mol−1. There was no specific indication of the retention of aniline based on MIHB and MIES values. The selectivity of the hexyl-phase was unclear except for chlorobenzene. This indicated that the retention in the alkyl-phase was not chemically selective but was based on the hydrophobicity of the analytes.
The phenylhexyl-phase that was expected to be the selective bonded-phase in an aqueous eluent demonstrated HB capability. The hydrogen of phenol hydroxy, benzoic acid carboxy, and aniline directly contacted with the phenyl-ring of the model phenylhexyl phase. The ionized aniline demonstrated slight ES interaction, and the VW interaction force was significant, compared to those of the others. The chloro group of the chlorobenzene, which possessed similar properties like the phenyl-group did not support the strong VW interaction. The behaviors of the phenol and benzoic acid were similar but different from those of aniline. The phenylhexyl-phase could maintain the retention with HB in a non-aqueous and highly concentrated organic modifier eluent. The contribution of the ES interaction was minimal.
The hexenyl-phase was also expected to demonstrate selectivity because of the double bond. The HB contribution was insignificant, as observed in the phenylhexyl-phase, but the contribution of VW force was greater than those of the others. Particularly, the behavior with ionized aniline was specific, compared to others. These results suggested the phase chemical selectivity for aniline.
A further study was conducted employing the chromatographic retention times of basic compounds with a pentyl-, a hexenyl, and an octyl-bonded silica gels. The chromatographic experiments were performed in semi-micro columns packed with 5-mm bonded silica gels. The eluent was a 50 mM sodium phosphate solution containing 50% methanol. The flow rate was 0.2 mL min−1 at 37 °C. Generally, fructose was utilized as the void volume marker [28]. However, some of the basic compounds were eluted before fructose and the solvent peak because of the ion-exclusion effect. Therefore, the shortest elution time of the compound was employed to calculate relative retention time (k). The log k values of the basic compounds, measured employing the pentyl-, hexenyl-, and octyl-bonded silica gels are summarized in Table 4 with their log P and pKa values. These log P and pKa values were obtained from references [13,29,30].
The selectivity of these phases was analyzed employing log k values of the basic compounds that were measured in the same pH 10.00 eluent. These basic compounds were either in their molecular or ionized forms in the pH 10.00 eluent at 37 °C. Their chemical structures in the eluent were determined based on their pKa values.
When the log k values that were measured with the octyl-bonded silica gel were employed as standard values, no chemical selectivity was observed for the log k values measured with the pentyl bonded silica gel. The difference was the retention capacity. The following equation indicates the difference:
log k on pentyl-phase = 0.910 (log k on octyl-phase) − 0.137, r = 0.998, n = 15.
The retention capacity of the pentyl-phase was ~91% of the octyl-phase. The retention capacity of the hexenyl-phase was almost the same (97%) as that of the pentyl-phase, although it demonstrated selectivity.
log k (hexenyl-phase) = 0.974 log k (pentyl-phase) − 0.243, r = 0.991, n = 13
The selectivity of the hexenyl-phase was observed at the log k values measured in the pH 3.00 eluent, although the retention times were very short.
In a pH 3.00 eluent,
log k (hexenyl-phase) = 0.970 log k (octyl-phase) + 0.130, r = 0.854, n = 12
The selectivity for ionized basic compounds was supported by the above results where the ionized aniline selectively interacted, compared to the neutral compounds and benzoic acids. A further study was conducted employing the model pentyl-, octyl-, and hexyl-phases.
In the pH 3.00 eluent, these basic compounds were expected to be in the ionized form, and their retention times were very short. The relation between the log k values of the octyl-phase and pentyl or hexenyl-phases were evaluated
log k (octyl-phase) = 0.987 log k (pentyl-phase) − 0.158, r = 0.991, n = 15
log k (octyl-phase) = 1.047 log k (hexenyl-phase) + 0.012, r = 0.856, n = 12
These slopes indicated that the retention capacities of these bonded-phases were like those of ionized basic compounds. However, the correlation coefficient indicated their selectivity. The hexenyl-phase demonstrated a difference from the alkyl-chain bonded-phases, although the precision was uncertain because of their low log k values.
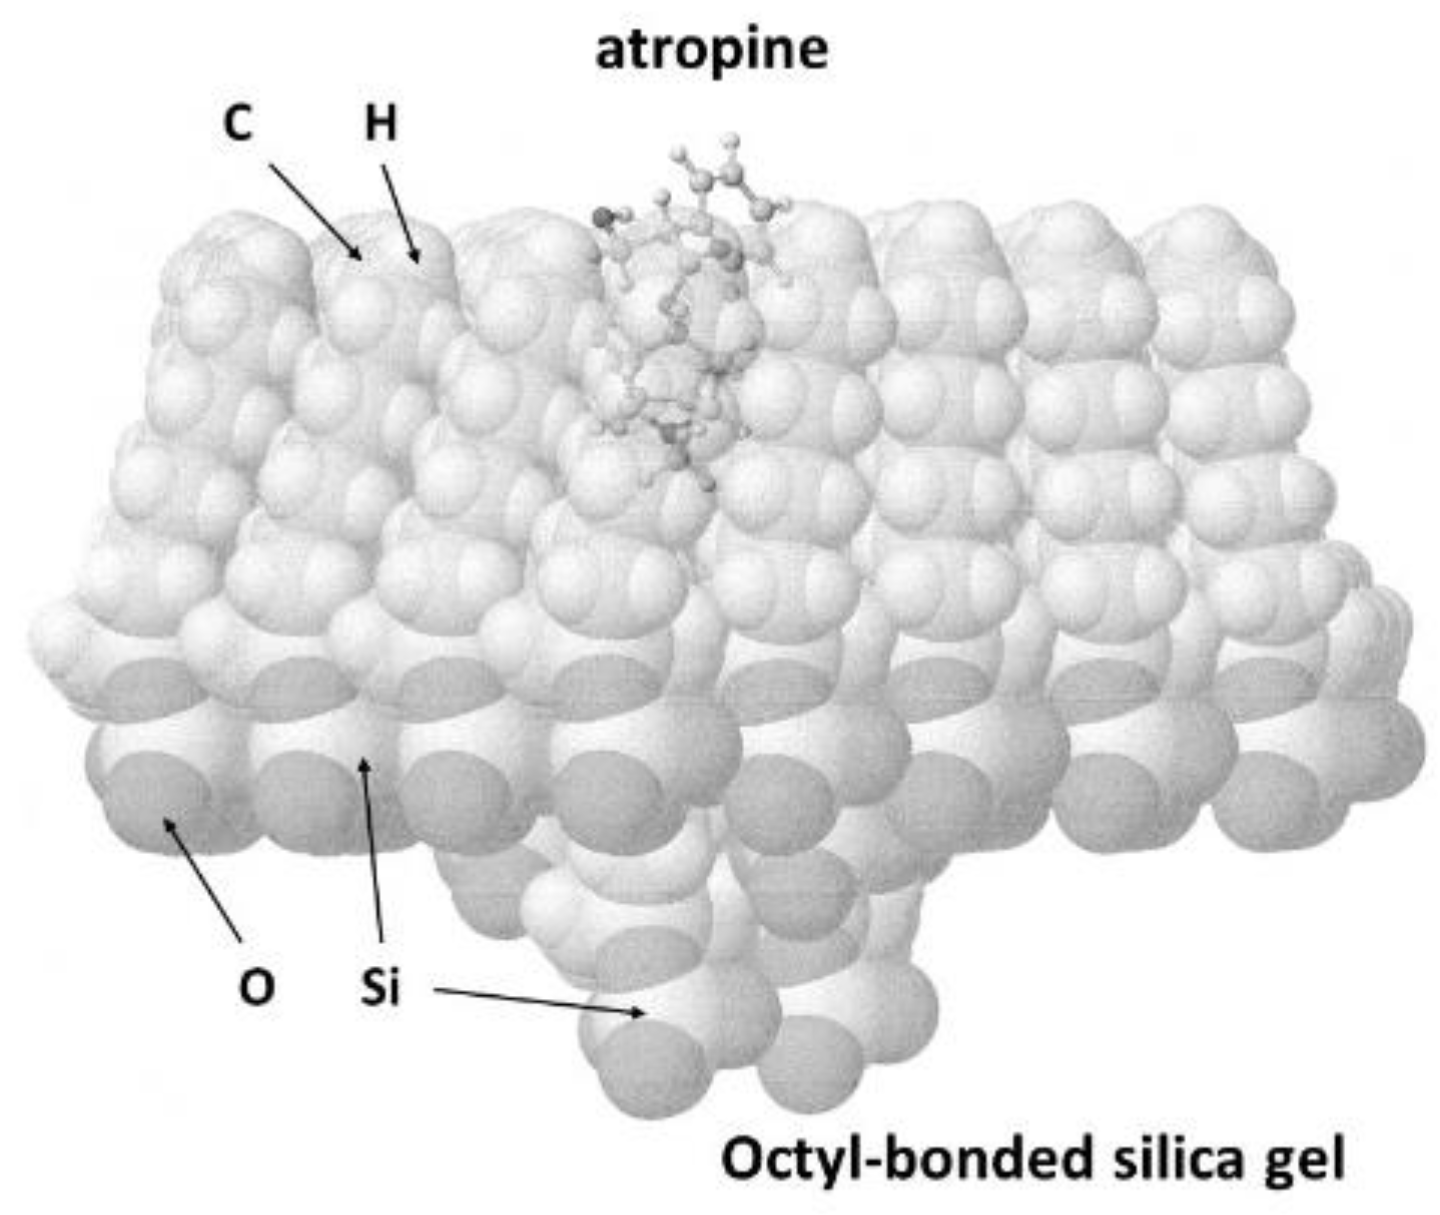
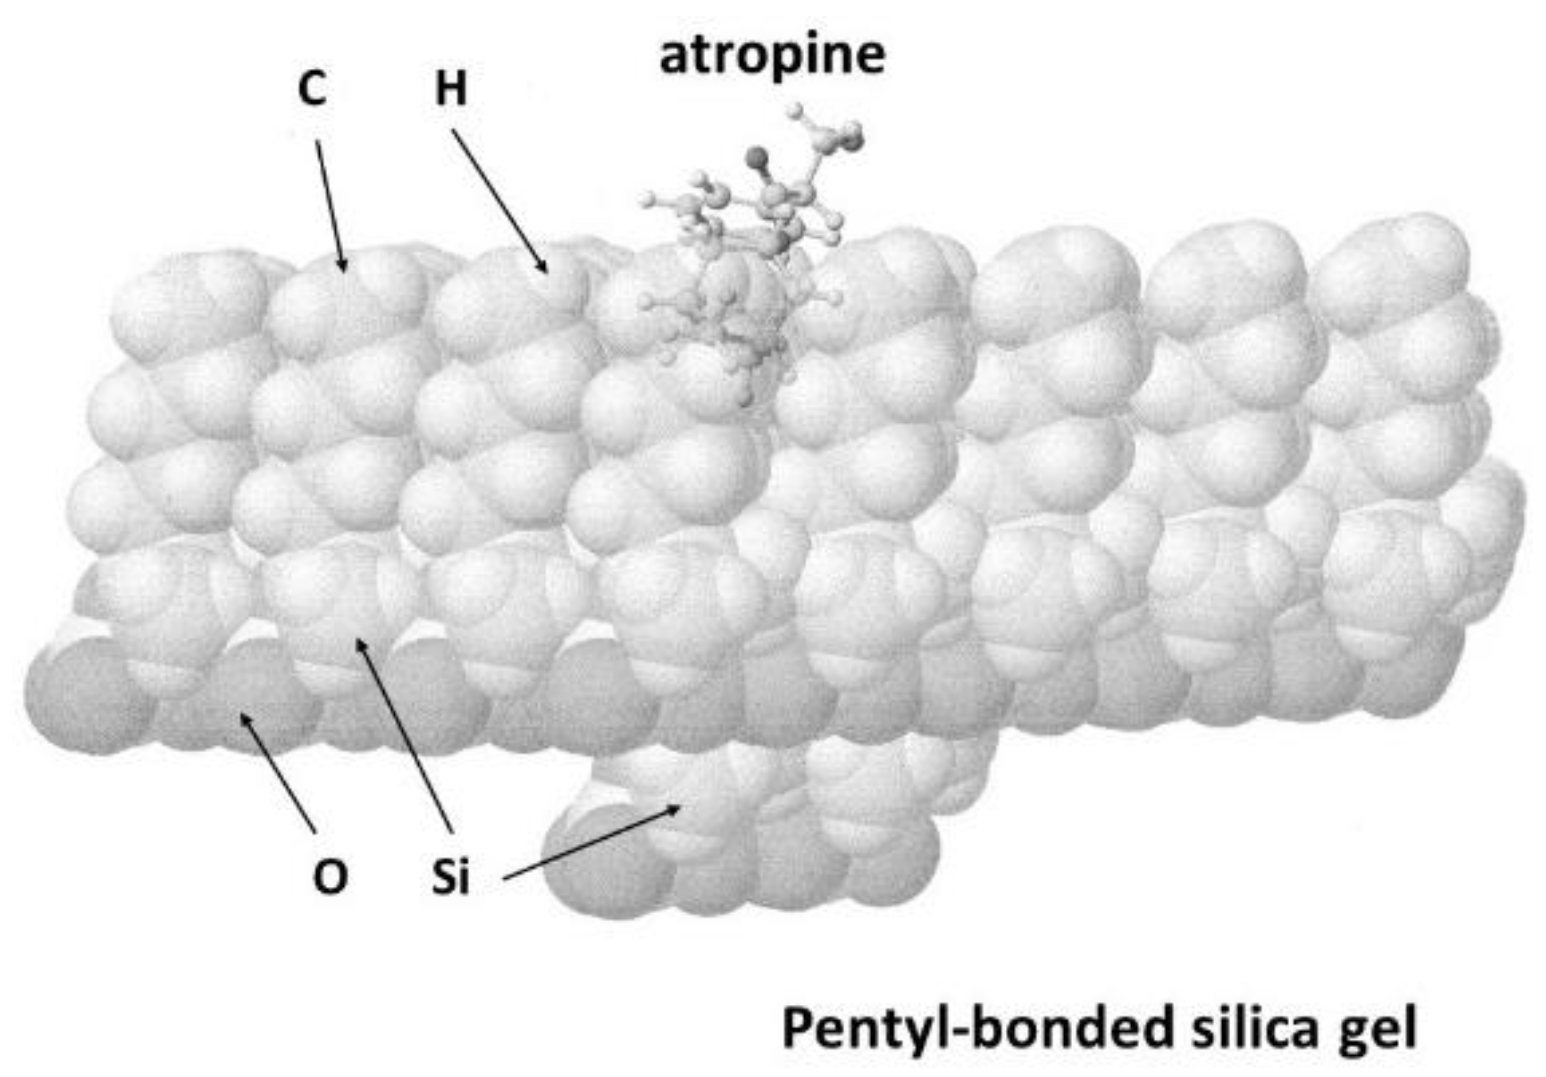
For further studies, the model phases were constructed employing the polysiloxane phase. The bonded groups were the R-dimethylsilicones where R presented the pentyl, hexenyl, and octyl-groups, and the number of bonded groups was 54 at the shortest calculation time. A flat and surface smooth model phase was suitable for phenolic compounds because the phenolic compounds analyzed were generally flat molecules and were different from drugs. Therefore, the model phase possessed a pocket because these bonded phases were synthesized with porous silica gels. The challenge was the maintenance of a similar entrance shape and area. Longer alkyl groups tightened the alkyl groups to themselves and narrowed the entrance area. Such a tightening interaction was caused by VW interaction of the alkyl groups. Therefore, some modifications were required for a longer alkyl bonded-phase. The construction of an octyl-bonded silica gel required a better modification than the model phase of the pentyl-bonded silica gel. Simply, three center groups among the 54 groups were pulled down to form a hole. However, three more groups were also slightly pulled down to form a better entrance for the model octyl-bonded phase. Imagine a lily flower. When many groups were pulled down to form a deep dish, the model was suitable for large flat molecules, although it did not exhibit a selective interaction with these compounds. Therefore, the construction of a balanced hole was required to analyze the selective retention of a variety of compounds. The following results demonstrated the difference between the model phases and the feasibility of the model phases to quantitatively explain the behaviors of basic compounds in reversed-phase mode LC. The octyl-, pentyl-, and hexenyl-bonded phase are shown in Figure 2, Figure 3 and Figure 4, where atropine was contacted. The calculated properties of basic compounds and the molecular interaction energy values (MIHB, MIES, MIVW) are summarized in Table 5.
Analyzed results of the octyl-bonded silica gel phase:
MIVW = 6.151 log k (pH 10.0) + 25.847, r = 0.750, n = 15
MIVW − 2.2mMIES = 8.052 log k (pH 10.0) + 22.326, r = 0.891, n = 15
The contributions of MIES, MIHB, and mMIHB were null. The VW interaction between the octyl phase and the basic compounds was the fundamental interaction, and mMIES contributed to the desorption of the basic compounds from the octyl-phase. These correlation coefficients were improved to 0.931 and 0.933 (n = 14) after the elimination of theophylline because of the very short retention time whose log k value was −1.644.
Analyzed results of the pentyl-bonded silica gel phase:
MIVW = 5.125 log k (pH 10.0) + 22.247, r= 0.677, n = 15
MIVW + MIES = 5.409 log k (pH 10.0) + 22.359, r = 0.702, n = 15
MIVW + MIES − 1.58mMIES = 7.911 log k (pH 10.0) + 17.061, r = 0.913, n = 15
MIVW + MIES − 1.58mMIES − 1.1mMIHB = 7.654 log k (pH 10) − 14.783, r = 0.917, n = 15
A reduced alkyl chain length of the bonded-phase silica gel appeared to be influenced by silicon dioxide oxygen. When an analyte penetrated silicon dioxide, the silicon dioxide oxygen affected MI. This phenomenon would be subsequently explained in the evaluation of the bonded-phase inertness.
Analyzed results of the hexenyl-bonded silica gel phase;
MIVW = 5.990 log k (pH 10.0) + 20.110, r = 0.737, n = 13
MIVW + MIES = 6.486 log k (pH 10.0) + 20.056, r = 0.767, n = 13
MIVW + MIES − 1.16mMIES = 8.260 log k (pH 10.0) + 15.913, r = 0.903, n = 13
MIVW + MIES − 1.16mMIES − 0.05mMIHB = 8.184 log k(pH 10.0) + 15.093, r = 0.906, n = 13
As expected from the hexenyl group, the ES energy contributed to the retention of the hexenyl-phase. Further, the solvation effects with methanol indicated that the contribution of the ES effect (mMIES) was significant while HB (mMIHB) contributed slightly.
Further analysis was carried out for results obtained, pH 3.0, on the octyl-bonded phase.
MIVW = 3.168 log k (pH 3.0) + 28.479, r= 0.316, n = 15
MIVW − 4.4mMIES = 11.319 log k (pH 3.0) + 19.706, r = 0.705, n = 15
MIVW − 4.4mMIES + 1.1mMIHB = 16.184 log k(pH3.0) + 46.283, r= 0.794, n = 15
The above results indicated the selectivity of model phases; the longer the alkyl-chain, the higher the contribution of the VW interaction; and the shorter the alkyl-chain, the higher the contribution of the silica gel matrix. The ES energy for solvation contributed more than HB energy for the retention of basic compounds in the pH of 10.00 eluent in the reversed-phase mode LC. This phenomenon was different from that of acidic drugs, where the contribution of HB energy was predominant. The poor correlation coefficients of these compounds, compared to those of acidic drugs, may be because the chromatography of basic compounds was performed as a mixture of both molecular and ionized compounds.

4. Conclusion

The retention mechanism of basic compounds in reversed-phase mode LC is the VW force interaction even when the chromatography was performed utilizing a pentyl-bonded silica gel whose inertness and prolonged operation was guaranteed. The pentyl-bonded phase exhibited low retention capacity, although it supported a greener operation. The quantitative analysis of the MI indicated that a pentyl-bonded silica gel may possess the contribution of an ES interaction from the silicon oxide oxygen. The hexenyl-bonded phase demonstrated selectivity because of the double bond, although the retention capacity was almost likely that of the pentyl-bonded phase. An interesting result that was observed for the basic compounds was the contribution of ES energy of solvation with methanol. These results were different from those observed for acidic compounds where the contribution of HB energy was significant.
This may be due to the lone-pair electron of nitrogen. A limitation of the study of the fundamental retention mechanism of basic compounds is the challenged in measuring the retention times of the molecular form. Silica gel-based packing materials could be greatly resolved and readily analyzed, although they are not stable in high pH eluents to measure the retention times of their molecular form.

Funding

This research received no external funding.

Conflicts of Interest

The authors declare no conflict of interest.

References

  1. Kurganov, A.; Trudinger, U.; Isaeva, T.; Unger, K. Native and modified alumina, titania and zirconia in normal and reversed-phase high-performance liquid chromatography. Chromatographia 1996, 42, 217–222. [Google Scholar] [CrossRef]
  2. McCalley, D.V. Effect of organic solvent modifier and nature of solute on the performance of bonded silica reversed-phase columns for the analysis of strongly basic compounds by high-performance liquid chromatography. J. Chromatogr. A 1996, 738, 169–179. [Google Scholar] [CrossRef]
  3. Andrisano, V.; Makamba, H.; Bovini, E.; Cavrini, V.; Zappoli, S. HPLC analysis of basic organic compounds in a multicomponent ion-interaction system: A mechanistic study. Chromatographia 1998, 47, 493–500. [Google Scholar] [CrossRef]
  4. Andersson, M.; Hultin, U.-K.; Sokolowski, A. Effects of amine additives on the resolution of antipsychotic and antidepressant drugs on a cyanoalkyl HPLC column. Chromatographia 1998, 48, 770–776. [Google Scholar] [CrossRef]
  5. Vervoort, R.J.M.; Ruyter, E.; Debets, A.J.J.; Claessens, H.A.; Cramers, C.A.; De Jong, G. Characterization of reversed-phase stationary phases for the liquid chromatographic analysis of basic pharmaceuticals by thermodynamic data. J. Chromatogr. A 2002, 964, 67–76. [Google Scholar] [CrossRef]
  6. Wu, A.-B.; Huang, M.-C.; Ho, H.-L.; Yeh, G.-C.; Sheu, M.-T. Investigation on liquid chromatographic separation of basic compounds using silica column with aqueous/organic mobile phase containing triethylamine and acetic acid. Biomed. Chromatogr. 2004, 18, 443–449. [Google Scholar] [CrossRef]
  7. Wang, X.; Carr, P.W. An unexpected observation concerning the effect of anionic additives on the retention behavior of basic drugs and peptides in reversed-phase liquid chromatography. J. Chromatogr. A 2007, 1154, 165–173. [Google Scholar] [CrossRef] [Green Version]
  8. Peng, L.; Farkas, T. Analysis of basic compounds by reversed-phase liquid chromatography-electrospray mass spectrometry in high-pH mobile phases. J. Chromatogr. A 2008, 1179, 131–144. [Google Scholar] [CrossRef]
  9. Calabuig-Hernandez, S.; Garcia-Alvarez-Coque, M.C.; Ruiz-Angel, M.J. Performance of amines as silanol suppressors in reversed-phase liquid chromatography. J. Chromatogr. A 2016, 1465, 98–106. [Google Scholar] [CrossRef]
  10. Manetto, S.; Mazzoccanti, G.; Ciogli, A.; Villani, C.; Gasparrini, F. Ultra-high performance separation of basic compounds on reversed-phase columns packed with fully/superficially porous silica and hybrid particles by using ultraviolet transparent hydrophobic cationic additives. J. Sep. Sci. 2020, 43, 1653–1662. [Google Scholar] [CrossRef]
  11. Hanai, T. Chromatography in silico for basic drugs. J. Chromatogr. Rel. Technol. 2005, 28, 2163–2177. [Google Scholar] [CrossRef]
  12. Stella, C.; Rudaz, S.; Mottaz, M.; Carrupt, P.-A.; Veuthey, J.-L. Analysis of basic compounds at high pH values by reversed-phase liquid chromatography. J. Sep. Sci. 2004, 27, 284–292. [Google Scholar] [CrossRef] [PubMed]
  13. Hanai, T.; Masuda, Y.; Homma, H. Chromatography in silico; retention of basic compounds on a carboxyl ion exchanger. J. Liq. Chromatogr. Rel. Technol. 2005, 28, 3087–3097. [Google Scholar] [CrossRef]
  14. Luo, H.; Ma, L.; Zhang, Y.; Carr, P.W. Synthesis and characterization of silica-based hyper-crosslinked sulfonate-modified reversed stationary phases. J. Chromatogr. A 2008, 1182, 41–55. [Google Scholar] [CrossRef] [PubMed] [Green Version]
  15. Luo, H.; Ma, L.; Paek, C.; Carr, P.W. Application of silica-based hyper-crosslinked sulfonate-modified reversed stationary phases for separating highly hydrophilic basic compounds. J. Chromatogr. A 2008, 1202, 8–18. [Google Scholar] [CrossRef] [Green Version]
  16. Morgan, P.E.; Manwaring, V.; Flanagan, R.J. HPLC of basic drugs using non-aqueous ionic eluents: Evaluation of a 3 μm strong cation-exchange material. Biomed. Chromatogr. 2010, 24, 318–323. [Google Scholar] [CrossRef]
  17. Zhang, Y.; Carr, P.W. Novel ultra-stable silica-based stationary phases for reversed phase liquid chromatography-Study of a hydrophobically assisted weak acid cation exchange phase. J. Chromatogr. A 2011, 1218, 763–777. [Google Scholar] [CrossRef] [Green Version]
  18. Mosiashvili, L.; Chankvetadze, L.; Farkas, T.; Chankvetadze, B. On the effect of basic and acidic additives on the separation of the enantiomers of some basic drugs with polysaccharide-based chiral selectors and polar organic mobile phases. J. Chromatogr. A 2013, 1317, 167–174. [Google Scholar] [CrossRef]
  19. Huo, Z.; Wan, Q.; Chen, L. Synthesis and evaluation of porous polymethylsilsesquioxane microspheres as low silanol activity chromatographic stationary phase for basic compound separation. J. Chromatogr. A 2018, 1553, 90–100. [Google Scholar] [CrossRef]
  20. Hanai, T.; Homma, H. Computational chemical prediction of the retention factor of aromatic acids. J. Liq. Chromatogr. Rel. Technol. 2002, 25, 1661–1676. [Google Scholar] [CrossRef]
  21. Hanai, T.; Mizutani, C.; Homma, H. Computational chemical simulation of chromatographic retention of phenolic compounds. J. Liq. Chromatogr. Rel. Technol. 2003, 26, 2031–2039. [Google Scholar] [CrossRef]
  22. Hanai, T. Simulation of chromatography of phenolic compounds with a computational chemical method. J. Chromatogr. A 2004, 1027, 279–287. [Google Scholar] [CrossRef]
  23. Hanai, T. Chromatography in silico, basic concept in reversed-phase liquid chromatography. Anal. Bioanal. Chem. 2005, 382, 708–717. [Google Scholar] [CrossRef] [PubMed]
  24. Hanai, T. Chromatography in silico, quantitative analysis of retention mechanisms of benzoic acid derivatives. J. Chromatog. A 2005, 1087, 45–51. [Google Scholar] [CrossRef] [PubMed]
  25. Hanai, T. Quantitative explanation of retention mechanisms in reversed-phase mode liquid chromatography, and utilization of typical reversed-phase liquid chromatography for drug discovery. Cur. Chromatogr. 2019, 6, 52–64. [Google Scholar] [CrossRef]
  26. Hanai, T. Quantitative in Silico Chromatography: Computational Modeling of Molecular Interactions; Royal Society of Chemistry: Cambridge, UK, 2014; pp. 1–338. ISBN 978-1-84973-991-7. [Google Scholar]
  27. Hanai, T.; Hatano, N.; Nimura, T.; Kinoshita, T. Molecular recognition in chromatography aided by computational chemistry. Supramol. Chem. 1994, 3, 243–247. [Google Scholar] [CrossRef]
  28. Hanai, T. HPLC, A Practical Guide; Royal Society of Chemistry: Cambridge, UK, 1999; pp. 1–134. ISBN 0-85404-515-5. [Google Scholar]
  29. Craig, P.N. Drug compedium, in Comprehensive Medicinal Chemistry: The Rational Design, Mechanic study and therapeutic. In Application of Chemical Compounds; Hansch, C., Sammes, P.G., Taylor, J.B., Eds.; Pergamon Press: Oxford, UK, 1990; Volume 6, pp. 237–965. [Google Scholar]
  30. Hanai, T. Evaluation of measuring methods of human serum albumin-drug binding affinity. Hanai, Toshihiko. Curr. Pharm. Anal. 2007, 3, 205–212. [Google Scholar] [CrossRef] [Green Version]
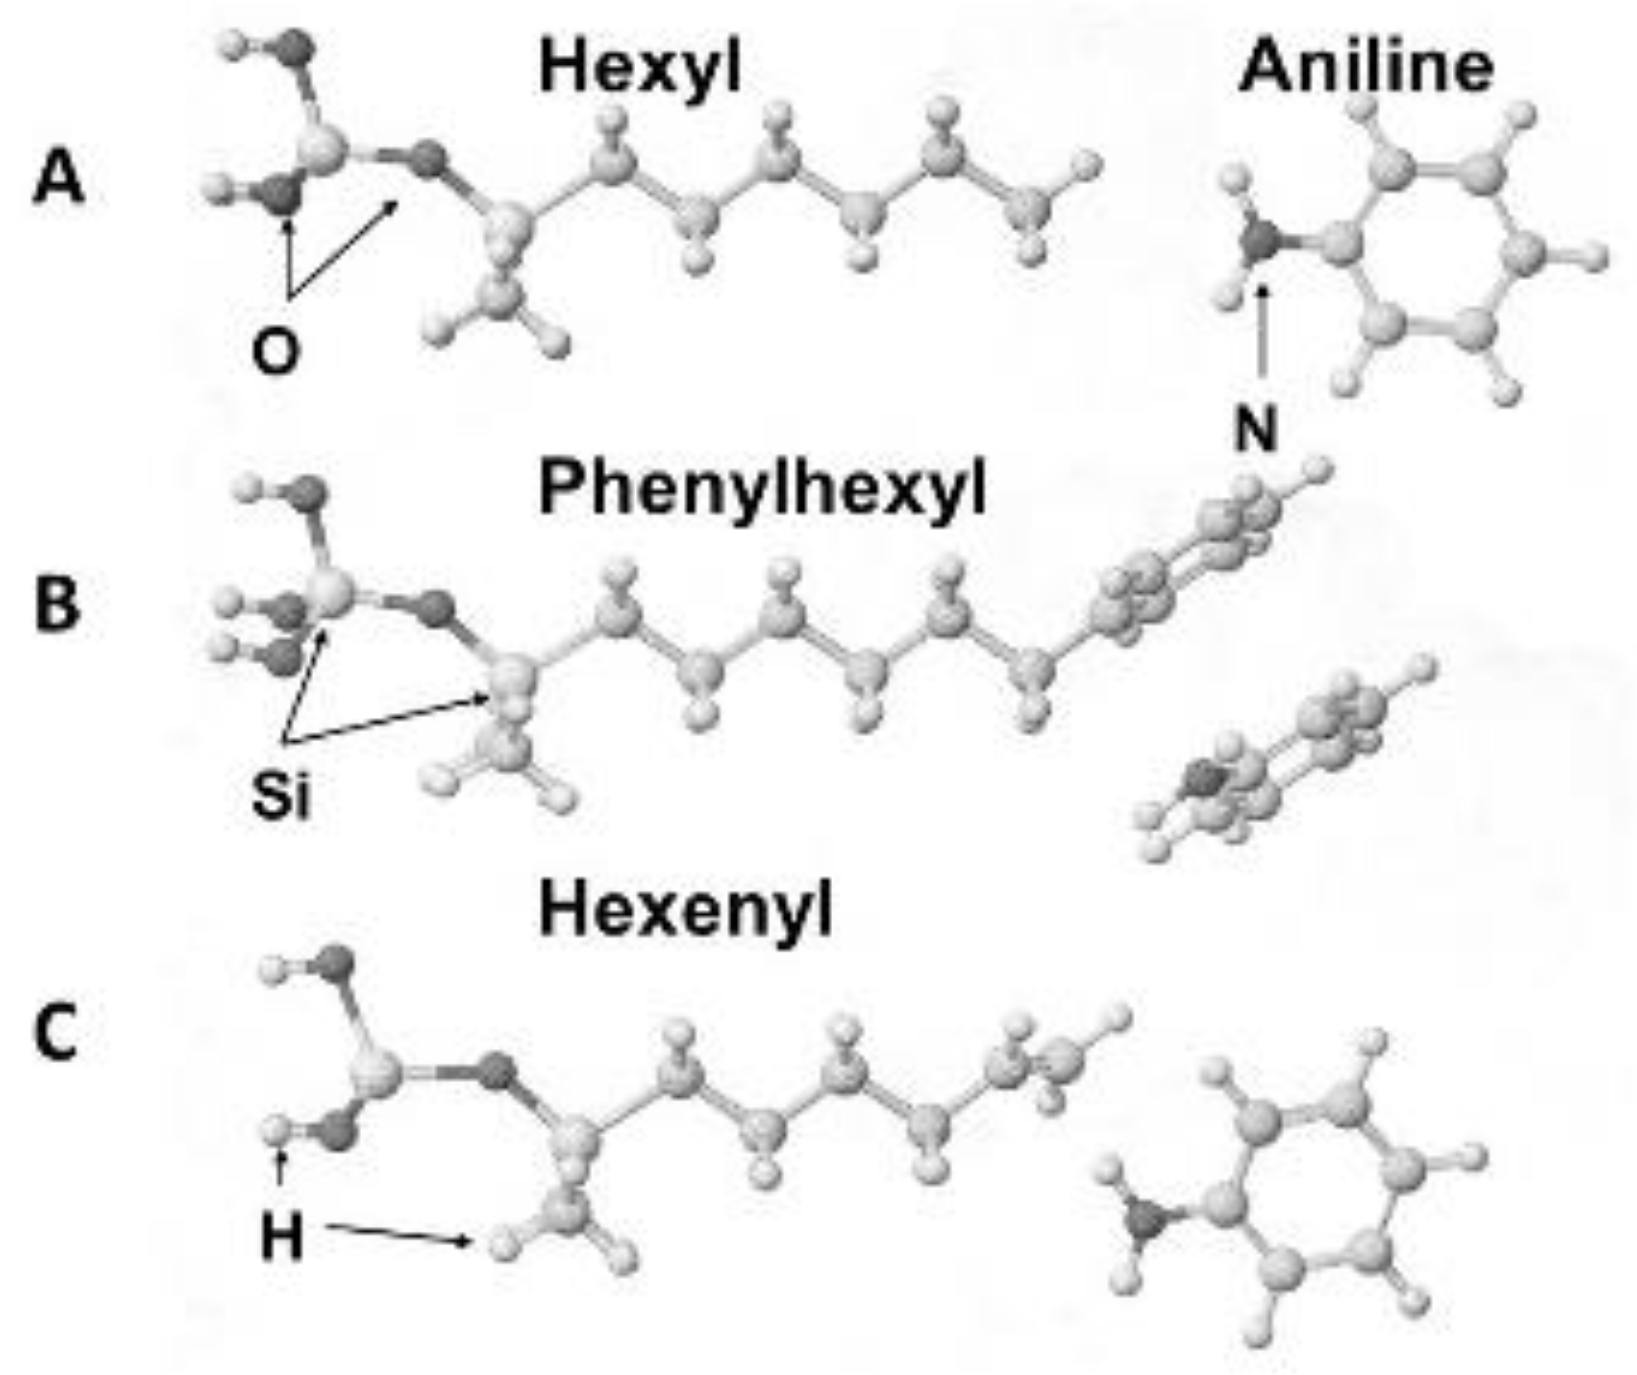
Figure 1. Model hexyl (A)-, phenylhexyl (B)-, and hexenyl (C)-phases. White small and large balls: hydrogen and carbon; black ball: oxygen; silicon and nitrogen (white and black balls): indicated.
Separations 07 00061 g001
Figure 2. Model octyl-bonded silica gel phase with adsorbed atropine.
Separations 07 00061 g002
Figure 3. Model pentyl-bonded silica gel phase with adsorbed atropine.
Separations 07 00061 g003
Figure 4. Model hexenyl-bonded silica gel phase with adsorbed atropine.
Separations 07 00061 g004
Table 1. Properties of analytes.
Benzene
Substitutes
Hammett’s
σ Constant
apc of Group
Unit: au
apc of
Head Atom
apc of
Balance
apc of
p-Hydrogen
log PpKa
p-Amino−0.570.118H 0.2550.0410.1591.034.69
p-Amino (I)-0.809H 0.2290.8930.207--
p-Hydroxy−0.38−0.081H 0.3050.2450.1641.5410.02
p-Methyl−0.140.066H 0.1070.0920.1582.59-
Hydrogen0.000.156H 0.1560.0000.1562.06-
p-Fluoro0.06−0.198F −0.1980.3650.1672.28-
p-Chloro0.24−0.051Cl −0.0510.2140.1632.81-
p-Carboxy0.44−0.105H 0.3240.2690.1641.794.20
p-Carboxy(I)-−0.808H −0.6470.9310.123--
I: ionized compounds, unit: atomic unit (au).
Table 2. Atomic partial charge of head substitute of model hexyl-bonded silica gels.
SubstituteapcSubstituteapcSubstituteapc
Ionized amino0.718Vinyl−0.061Ionized carboxy−0.888
Methyl−0.005Carboxy−0.130
Phenyl−0.028Amino−0.138apc unit: atomic unit (au)
Table 3. Calculated properties of analytes with different model phases.
AnalytesMIHBMIESMIVWapcapcAtomic Distance
kcal mol−1auÅ
Hexyl-phase CH3atom or group
Aniline0.000−0.0110.766−0.0370.208 H3.0
Ionized aniline0.0000.1440.808−0.0690.840 NH33.5
Benzene0.000−0.0260.985−0.0070.158 H3.0
Methylbenzene0.0020.020−2.155−0.0080.069 CH33.5
Chlorobenzene0.001−0.0062.3990.000Contact face ClBz4.0
Phenol0.000−0.0310.988−0.0090.166 H3.0
Benzoic acid0.005−0.0231.006−0.0120.166 H3.0
Ionized benzoic acid0.000−0.1890.6750.059−0.860 COO-3.5
Phenylhexyl-phase Phenyl
Aniline0.292−0.0275.367−0.0600.844 Total3.5
Ionized aniline0.0000.1891.044−0.1080.844 NH33.5
Benzene0.0000.0090.783−0.0760.156 H3.5
Methylbenzene0.0000.0141.116−0.0760.068 CH33.5
Chlorobenzene0.000−0.0220.751−0.074−0.053 Cl4.0
Phenol6.9220.0852.723−0.067−0.084 OH3.5
Benzoic acid6.9140.0302.313−0.062−0.108 COOH3.0
Ionized benzoic acid0.000−0.1930.745−0.040−0.864 COO-3.5
Hexenyl-phase Vinyl
Aniline−0.056−0.0311.732−0.0510.267 H/NH23.5
Ionized aniline0.0010.1693.319−0.0600.159 Ph3.5
Benzene0.002−0.0262.881−0.0510.000 Bz3.0
Methylbenzene0.001−0.0190.908−0.0580.071 CH34.0
Chlorobenzene0.0030.0053.565−0.0580.056 Ph4.0
Phenol2.3050.0712.187−0.055−0.084 OH3.5
Benzoic acid2.324−0.0081.222−0.055−0.110 COOH3.5
Ionized benzoic acid0.001−0.1953.328−0.061−0.136 Ph3.5
apc of CH3, Ph, and vinyl: apc of head of model phase; apc of atom or group: contact atom or group of analytes.
Table 4. Properties and log k values of basic compounds.
Chemicalslog PpKa log k
PhaseHexenyl Pentyl Octyl
pH3.010.03.010.03.010.0
Aniline 4.63−0.866−0.265−1.143−0.515−0.995−0.395
Atropine0.169.6−1.0330.7420.9010.449−0.7310.611
Caffeine0.070.6−0.271−0.471−0.714−0.763−0.668−0.660
Carbamazepine1.9813.90.4650.4610.2070.2330.3180.407
Dextromethorphan3.998.3−0.2071.599−0.0791.2920.0771.625
Diazepam3.183.3-1.0010.7010.7530.8730.994
Isoproterenol0.088.6-−0.599-−0.767-−0.716
Lidocaine1.987.9−0.9191.011−0.6350.878−0.5191.094
Prazosin2.166.5−0.8150.433−0.852−0.048−0.6920.120
Procaine2.248.11-0.513−1.6470.239−1.5120.410
Pyridine-5.19−0.555−0.212−1.206−0.361−0.734−0.370
Quinine3.204.1−0.3471.116−0.5230.858−0.2941.134
Scopolamine−0.207.75−1.3850.169−1.149−0.046−0.9650.097
Terbutaline0.488.8--−2.290−0.589−2.242−0.546
Theophylline−0.023.5/8.81−0.337-−0.797−1.725−0.766−1.644
log P. pKa from refs 20, 23, 24. log k measured in 50 mM sodium phosphate solution containing 50% methanol at 37 °C. Flow rate: 0.2 mL min−1; Column size: 100 × 2.1 mm I.D. packed 5 μm bonded silica gels.
Table 5. Properties of basic compounds and molecular interaction energy values.
Octyl PhaseMethanol PhasePentyl PhaseHexenyl Phase
ChemicalshbesvwMIHBMIESMIVWmMIHBmMIESMIHBMIESMIVWMIHBMIESMIVW
Aniline (I)0.0000.0003.4970.0000.27514.39715.4581.443
Aniline (M)−1.3340.0003.4160.0030.00014.44017.0170.6180.0080.00812.6550.9020.02011.457
Atropine (I)−3.435−0.71613.689−0.513−0.10239.18323.3444.418
Atropine (M)−3.451−1.04111.237−0.143−0.06630.55721.7673.511−0.0160.24324.1990.2670.08225.724
Caffeine (M)0.000−47.4214.8880.0000.06422.00619.4223.8220.000−0.07315.2370.000−0.29016.519
Carbamazepine (I)−10.401−7.18319.781−0.0590.29026.66737.2511.3710.4710.20623.2924.8200.55318.935
Dextromethorphan (I)0.0000.12014.7240.0000.28437.33014.1531.6830.0000.23530.4680.0000.54029.188
Diazepam (I)−4.1877.47613.6110.0000.27829.92728.1463.325
Diazepam (M)0.0000.67515.2430.000−0.13529.81128.5723.5610.0000.07927.3510.000−0.03425.505
Isoproterenol (I)−3.015−0.0416.071−0.1090.14824.45618.4518.710−0.067−0.03622.8322.171−1.15219.705
Lidocaine (I)−2.146−19.76212.606−0.0071.37727.69822.0643.183
Lidocaine (M)−2.1575.74411.0090.0011.41133.52618.1342.940−0.0101.61325.3200.2381.09825.184
Prazosin (I)0.0004.10413.1360.0000.22530.80024.8633.961
Prazosin (M)−1.2570.63313.8000.0080.00326.09827.8363.3030.0030.10926.1410.1920.86227.029
Procaine (I)0.000−1.33312.5530.0000.49327.78719.8993.697
Procaine (M)−1.334−0.2337.7960.000−0.03128.80019.3922.6140.000−0.03619.9380.226−0.00222.059
Pyridine (I)0.0000.0003.2060.0000.32212.14612.948−1.064
Pyridine (M)0.0000.0002.8580.0000.00912.73812.368−0.6910.0000.00910.8930.0000.0159.983
Quinine (I)−4.484−1.00112.917−0.0780.55530.83323.907−0.127
Quinine (M)−4.6060.01514.7820.0390.00535.95824.2960.524−0.086−0.00826.6510.541−0.06129.134
Scopolamine (I)−3.624−2.32710.3430.0190.18727.94324.8406.267
Scopolamine (M)−0.436−1.7638.506−0.034−0.08226.80419.9364.1690.025−0.12728.6312.6250.47324.690
Terbutaline (I)−3.028−1.8236.308−0.054−0.30723.18116.1549.079−0.045−0.40624.2882.851−0.90819.991
Theophylline (M)−0.485−47.4086.3000.011−0.12320.76916.6633.280
Theophylline (I)0.000−46.1335.6570.000−0.29422.08615.7815.4880.000−0.16715.2320.000−0.81015.606
hb, es, vw: hydrogen bonding, electrostatic, and van der Waals energy values of analyte (kcal mol−1); mMIHB and mMIES: molecular interaction energy values between an analyte and a model methanol-phase (kcal mol−1). M and I: molecular and ionized form.
Publisher’s Note: MDPI stays neutral with regard to jurisdictional claims in published maps and institutional affiliations.