Communication

Comparison of Pre-Processing and Variable Selection Strategies in Group-Based GC×GC-TOFMS Analysis

Chemical Sciences Division, National Institute of Standards and Technology, Gaithersburg, MD 20899, USA
*
Author to whom correspondence should be addressed.
Separations 2019, 6(3), 41; https://doi.org/10.3390/separations6030041
Submission received: 31 May 2019 / Revised: 17 July 2019 / Accepted: 22 July 2019 / Published: 21 August 2019
(This article belongs to the Special Issue Chromatography and Chemometrics)

Abstract

:
Chemometric analysis of comprehensive two-dimensional chromatography coupled to time-of-flight mass spectrometry (GC×GC-TOFMS) data has been reported with various workflows, yet little effort has been devoted to evaluating the impacts of workflow variation on study conclusions. The report presented herein aims to investigate the effects of different pre-processing and variable selection strategies on the scores’ plot outputs from GC×GC-TOFMS data acquired from lavender and tea tree essential oils. Our results suggest that pre-processing, such as applying log transformation to the data set, can result in significant differentiation of sample clustering when compared to only mean centering. Additionally, exploring differences between analysis of variance, Fisher-ratio, and partial least squares-discriminant analysis feature selection resulted in little variation in scores plots. This work highlights the effects different chemometric workflows can have on results to help facilitate harmonization efforts.

1. Introduction

Comprehensive two-dimensional gas chromatography (GC×GC) coupled to time-of-flight mass spectrometry (TOFMS) has become an established technique for the analysis of complex samples [1,2,3]. The increased peak capacity and sensitivity obtained through non-targeted GC×GC-TOFMS analysis result in complex data sets, which are time-consuming to analyze [4,5]. As such, multiple data reduction strategies have been implemented for the analysis of GC×GC-TOFMS data [6,7,8,9,10,11,12]. Algorithms aimed at exploiting mass-to-charge ratios of common classes of compounds have shown much utility in environmental and petrochemical analysis [6,7,8,9,10].
Recently, the field of GC×GC-TOFMS has embraced the non-targeted analysis of sample groups, where differences between sets of sample groups are of interest. Applications of sample group analysis have included archeological, forensic, environmental, and metabolomic samples and have relied on chemometric methods as data reduction strategies to visualize sample class differences [13,14,15,16,17,18,19,20,21]. Most commonly, principal component analysis (PCA) is used as an exploratory data analysis tool in group-based GC×GC-TOFMS analysis. Many workflows have been published in the literature which take various pre-processing paths [7,16]. PCA with varied pre-processing approaches can lead to variation in the final grouping of samples and to the determination of the features responsible for the differentiation between groups. These variations may result in an incorrect interpretation of the results. Unsupervised data analysis tools, like PCA, are used in conditions where the sample information is unknown. Notably, normalization and feature selection are also quite varied among the literature [7,16].
Non-targeted and other ‘omics analyses utilizing other instrumental platforms, such as liquid chromatography – high resolution mass spectrometry (LC-HRMS), have made efforts to harmonize chemometric analyses [22,23]. To facilitate harmonization in GC×GC-TOFMS analysis, exploration of different pre-processing and feature selection methods must be undertaken. Here, we report a comparison of scores obtained from various pre-processing and feature selection approaches of GC×GC-TOFMS data of lavender and tea tree oils to better understand the implication of these data manipulations on sample grouping outcomes.

2. Materials and Methods

Commercially obtained samples of lavender (L) and tea tree (TT) oils were diluted 1:100 in methanol and analyzed in triplicate by comprehensive two-dimensional gas chromatography coupled to a time of flight mass spectrometer (LECO Pegasus 4D GC×GC-TOFMS, St. Joseph, MI, USA). Additionally, a pooled quality control (QC) sample was analyzed, which was a mixture of the oils that were subjected to the same sample preparation and treatment. For separation, the first-dimension column was a Restek Rxi-624Sil MS (30 m × 0.25 mm × 1.4 µm; Bellafonte, PA, USA), a low-to mid-polarity stationary phase composed of 6% cyanopropylphenyl methypolysilozane. This was coupled to a Restek Stabilwax (2.0 m × 0.25 mm × 0.25 μm) in the second dimension, a high-polarity stable polyethylene glycol stationary phase. The column set was selected to maximize the separation of low-volatility, polar analytes in the essential oils. The inlet was operated in split mode (1:75) at 250 °C. A temperature ramp of 4.7 °C/min was used from 40 °C to 240 °C with a 5.0 min hold at 240 °C under a constant 1 mL/min He flow rate. The modulator temperature was offset at 5 °C positive to the primary GC oven and operated with a 3 s modulation period. Modulation was performed on the second dimension column, and the second dimension oven was offset by + 5 °C to the primary GC oven to minimize peak wraparound in the second dimension. The mass spectrometer was operated with a 250 °C ion source temperature, and −70 eV ionization energy. The collected mass range was 35 to 550 amu at 200 Hz with a positive mass defect offset of 20 mu/100 u. Data processing was performed using LECO ChromaTOF software version 4.51.6.0. The baseline level was offset to be at the noise (0.8), and automated peak finding was performed utilizing mass spectral deconvolution algorithms built into the ChromaTOF software. For identification, peaks required a signal-to-noise ratio (S/N) greater than 1000. Tentative identifications were based on a forward search in the NIST17 library for peaks with a spectral similarity score of 700. GC×GC subpeaks required a S/N greater than 6 and a spectral similarity score of 500 to recombine.
Chromatographic alignment was performed using the StatCompare feature of ChromaTOF Software. A mass threshold of 5 and a minimum match similarity of 600 were required for spectral matching amongst groups. Retention time differences of <1 s and a deviation of 3 modulation periods were required for positive alignment. The alignment results, represented as a peak list with corresponding peak areas for each individual sample, were exported for chemometric analysis in MetaboAnalyst 4.0. The peak lists of the 12 samples are provided in the Supplemental Information. For PCA, gap filling was performed through small value estimation and all peak areas were mean-centered and not auto-scaled. The evaluated pre-processing parameters include log-transformation of area and variable selection parameters. The supervised variable selection method is an approach aimed at reducing the number of features (peaks) that do not contribute to significant variability between the samples. For variable selection, two methods were used: F-statistic and ANOVA, which remove features that are not significant contributors to the between-sample variability.

3. Results and Discussion

Lavender and tea tree essential oils were analyzed by GC×GC-TOFMS, and the data were subjected to, group-based chemometric analysis. The GC×GC-TOFMS total ion chromatograms, as shown in Figure 1, had many similarities. Of the total compounds identified (211), there were 115 compounds found in common between lavender oil and tea tree oil, with 50 compounds found only in lavender oil and 46 compounds found only in tea tree oil. The identified compounds primarily consisted of terpenes and small molecular weight ketones and aldehyde, which provide the oils with their characteristic fragrances [24,25,26,27]. By simply evaluating chromatographic information, it was difficult to determine the chemical differences among the two oils. To facilitate the differentiation, chemometric analysis was employed, and the effects of manipulating chemometric parameters were explored, which was the main goal of the presented study. Because the oils shared many chemical characteristics, this data set was an ideal candidate for comparison of pre-processing and variable selection strategies in group-based GC×GC-TOFMS analysis.
After chromatographic alignment, the GC×GC-TOFMS data were manipulated in MetaboAnalyst 4.0 to evaluate the effects of pre-processing parameters that are commonly described in peer-reviewed literature. The aim of the data pre-processing before multivariate analysis is to mathematically remove sources of unwanted variation, such as instrument variability, that cannot be removed during typical data analysis steps, such as baseline correction. First, we evaluated the effects of data transformations on the sample clustering in PCA. Comparison of PCA scores plots of mean-centered data to mean-centered and log-transformed data, as shown in Figure 2, indicated that log transformation highly enhances the sample clustering and differentiation between sample groups. Mean centering is the minimum requirement for efficient PCA to ensure that the first principal component describes the direction of maximum variance in the data, as opposed to the mean of the data. While this technique helps to differentiate sample groupings by reducing extreme differences in scale between variables, it does little to correct nonlinear relationships between the variables, which may occur with time-of-flight mass spectral analysis.
As a result, data scaling and transformation approaches are often applied in PCA. While data scaling can influence individual components, generalized logarithmic transformation of the data can be utilized to linearize all variables before PCA. Log-transformations produce unitless data that is dimensionally homogeneous. Applying log-transformation to the GC×GC-TOFMS data presented herein (Figure 2b) significantly decreased the within-group variation while increasing the separation of the groups, as seen by the increase in the variance captured in the first two PCs from 64.2% (Figure 2a) to 86.6% (Figure 2b).
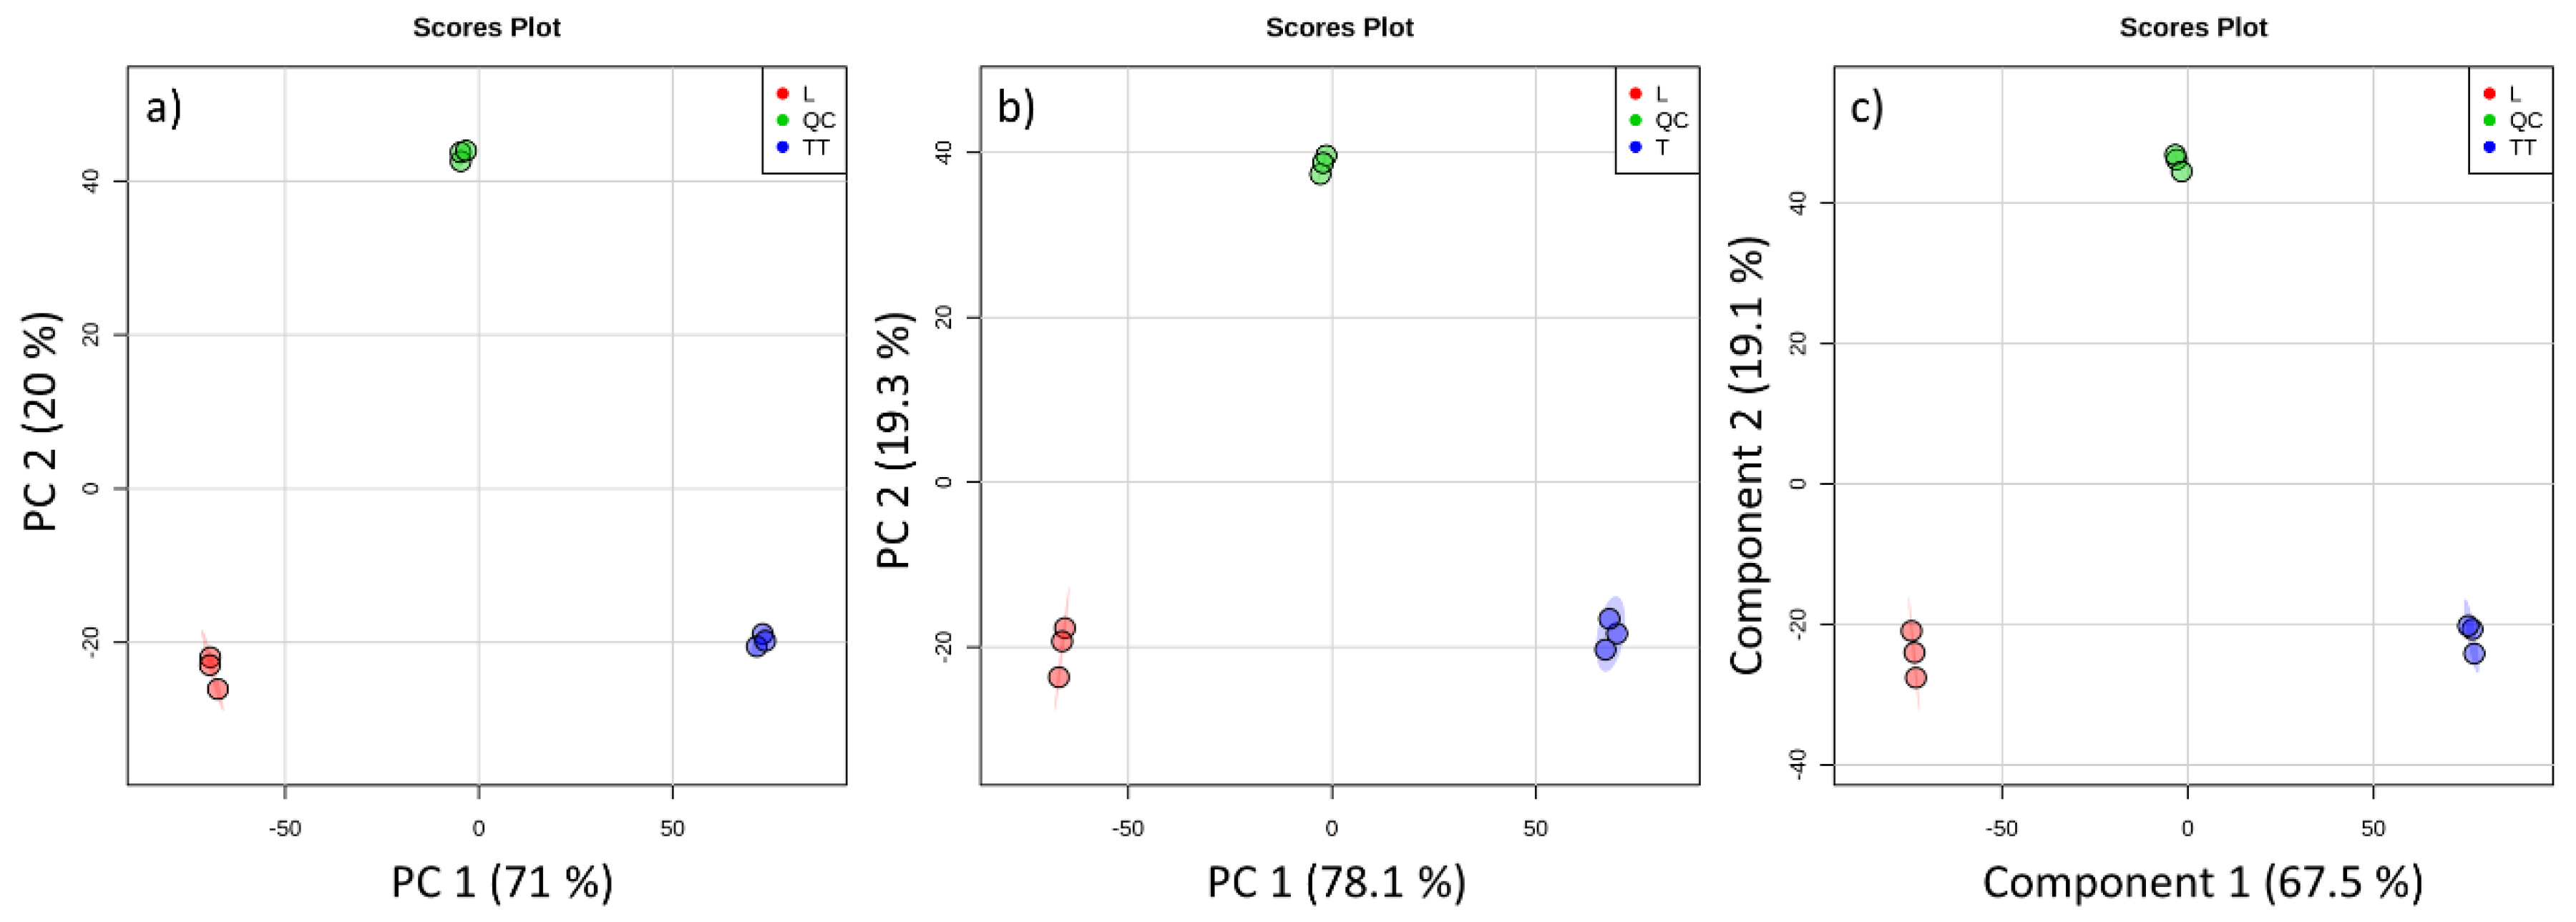
The reduction of variables for group-based analysis of GC×GC-TOFMS data is often employed. We explored the role of different variable reduction strategies to better understand if this process may introduce variation in published results. Comparing two common variable selection methods, F-ratio and ANOVA, to a partial least squares discriminant analysis (PLS-DA) resulted in very little variation in the resulting scores plots, as shown in Figure 3. All analyses were performed on mean-centered and log-transformed data; in the case of ANOVA and F-ratio variable selection was performed at p < 0.05. The three variable selection strategies resulted in slightly different clustering of samples within the groups, however, the clustering of the grouping relative to one another remained similar. We hypothesize that the variation in the samples was significant enough that each of the methods can discern the sample differences. Overall, F-ratio and ANOVA accounted for a greater percentage of variability than PLS-DA. Filtering by F-ratio accounted for 97.4% of the variability (Figure 3b), filtering by ANOVA accounted for 91% of the variability (Figure 3a), while filtering by PLS-DA accounted for 83.6% of the variability (Figure 3c). Additionally, as expected, a negative trend was observed between number of significant variables and the variation accounted for in the model. The slight increase in accounted variability by ANOVA vs. F-ratio may be due to the minimization in error when ANOVA is performed.
Furthermore, it should be noted that variable reduction did not influence the scores plot significantly, as the clustering of samples and sample groups of only log-transformed data (Figure 2b) remains similar in the variable reduced scores plots (Figure 3). These findings suggest that the PCA and PLS-DA models were influenced by the same variation within these data, as opposed to the noise that was removed through the variable reduction. Since PCA is often performed as a preprocessing step in PLS-DA regression algorithms to remove collinearity within the data set, the resulting PC axes may have been very close to optimal from a discriminant perspective for PLS-DA, and thus the results are nearly identical. In cases of smaller variability between sample sets, different variable reduction strategies may play more pivotal roles in differentiation. However, caution should be used when reducing large data sets to avoid overfitting the models.
The loadings of the PCA and PLS-DA were interpreted to determine the chromatographic features that were responsible for inducing differentiation among the essential oils. The three feature selection methods showed consensus in regard to the chromatographic features, which resulted in the differentiation among lavender and tea tree oils. The Santolina triene was the largest contributor in differentiating lavender, while alpha-Calacorene and ç-Terpinene were the largest contributors in differentiating tea tree. The consensus among the three feature selection methods indicates that results obtained from each of the three cases are largely comparable. These findings indicate that different chemometric workflows may lead to similar results. These phenomena should be evaluated on multiple different data sets to gain a broader consensus of the effects of different chemometric workflows to propose the most appropriate harmonized method.

Supplementary Materials

The The supplemental information is available online at https://www.mdpi.com/2297-8739/6/3/41/s1.

Author Contributions

P.P. and B.P. designed the experiment, P.P. performed the experiment and data analysis. P.P. and B.P. prepared and edited the manuscript.

Funding

This research received no external funding. PKP is funded through the National Institute of Standards & Technology—National Research Council Postdoctoral Associateship.

Acknowledgments

The authors would like to acknowledge Aaron Urbas for his input regarding the chemometric analysis and LECO Corporation for a trial version of StatCompare. Certain commercial equipment, instruments, or materials are identified in this paper to foster understanding. Such identification does not imply recommendation or endorsement by the National Institute of Standards and Technology, nor does it imply that the materials or equipment identified are necessarily the best available for the purpose.

Conflicts of Interest

The authors declare no conflict of interest.

References

  1. Gruber, B.; Weggler, B.A.; Jaramillo, R.; Murrell, K.A.; Piotrowski, P.K.; Dorman, L.F. Comprehensive two-dimensional gas chromatography in forensic science: A critical review of recent trends. TrAC Trends Anal. Chem. 2018, 105, 292–301. [Google Scholar] [CrossRef]
  2. Megson, D.; Reiner, E.J.; Jobst, K.J.; Dorman, F.L.; Robson, M.; Focant, J.F. A review of the determination of persistent organic pollutants for environmental forensics investigations. Anal. Chim. Acta 2016, 941, 10–25. [Google Scholar] [CrossRef] [PubMed]
  3. Keppler, E.A.H.; Jenkins, C.L.; Davis, T.J.; Bean, H.D. Advances in the application of comprehensive two-dimensional gas chromatography in metabolomics. TrAC Trends Anal. Chem. 2018, 109, 275–286. [Google Scholar] [CrossRef] [PubMed]
  4. Reichenbach, S.E.; Tian, X.; Tao, Q.; Ledford, E.B., Jr.; Wu, Z.; Fiehn, O. Informatics for cross-sample analysis with comprehensive two-dimensional gas chromatography and high-resolution mass spectrometry (GC×GC–HRMS). Talanta 2011, 83, 1279–1288. [Google Scholar] [CrossRef] [PubMed]
  5. De Carvalho Rocha, W.F.; Schantz, M.M.; Sheen, D.A.; Chu, P.M.; Lippa, K.A. Unsupervised classification of petroleum Certified Reference Materials and other fuels by chemometric analysis of gas chromatography-mass spectrometry data. Fuel 2017, 197, 248–258. [Google Scholar] [CrossRef] [PubMed] [Green Version]
  6. Jennerwein, M.K.; Eschner, M.; Gröger, T.; Wilharm, T.; Zimmermann, R. Complete group-type quantification of petroleum middle distillates based on comprehensive two-dimensional gas chromatography time-of-flight mass spectrometry (GC×GC-TOFMS) and visual basic scripting. Energy Fuels 2014, 28, 5670–5681. [Google Scholar] [CrossRef]
  7. Weggler, B.A.; Gröger, T.; Zimmermann, R. Advanced scripting for the automated profiling of two-dimensional gas chromatography-time-of-flight mass spectrometry data from combustion aerosol. J. Chromatogr. A 2014, 1364, 241–248. [Google Scholar] [CrossRef]
  8. Pena-Abaurrea, M.; Jobst, K.J.; Ruffolo, R.; Shen, L.; McCrindle, R.; Helm, P.A.; Reiner, E.J. Identification of potential novel bioaccumulative and persistent chemicals in sediments from Ontario (Canada) using scripting approaches with GC×GC-TOF MS analysis. Environ. Sci. Technol. 2014, 48, 9591–9599. [Google Scholar] [CrossRef] [PubMed]
  9. Hilton, D.C.; Jones, R.S.; Sjödin, A. A method for rapid, non-targeted screening for environmental contaminants in household dust. J. Chromatogr. A 2010, 1217, 6851–6856. [Google Scholar] [CrossRef]
  10. Piotrowski, P.K.; Weggler, B.A.; Barth-Naftilan, E.; Kelly, C.N.; Zimmermann, R.; Saiers, J.E.; Dorman, F.L. Non-Targeted chemical characterization of a Marcellus shale gas well through GC×GC with scripting algorithms and high-resolution time-of-flight mass spectrometry. Fuel 2018, 215, 363–369. [Google Scholar] [CrossRef]
  11. Piotrowski, P.K.; Weggler, B.A.; Yoxtheimer, D.A.; Kelly, C.N.; Barth-Naftilan, E.; Saiers, J.E.; Dorman, F.L. Elucidating Environmental Fingerprinting Mechanisms of Unconventional Gas Development through Hydrocarbon Analysis. Anal. Chem. 2018, 90, 5466–5473. [Google Scholar] [CrossRef] [PubMed]
  12. Bowman, D.T.; Warren, L.A.; McCarry, B.E.; Slater, G.F. Profiling of individual naphthenic acids at a composite tailings reclamation fen by comprehensive two-dimensional gas chromatography-mass spectrometry. Sci. Total Environ. 2019, 649, 1522–1531. [Google Scholar] [CrossRef] [PubMed]
  13. Perrault, K.; Stefanuto, P.H.; Dubois, L.; Cnuts, D.; Rots, V.; Focant, J.F. A new approach for the characterization of organic residues from stone tools using GC×GC-TOFMS. Separations 2016, 3, 16. [Google Scholar] [CrossRef]
  14. Stefanuto, P.H.; Perrault, K.A.; Stadler, S.; Pesesse, R.; LeBlanc, H.N.; Forbes, S.L.; Focant, J.F. GC×GC–TOFMS and supervised multivariate approaches to study human cadaveric decomposition olfactive signatures. Anal. Bioanal. Chem. 2015, 407, 4767–4778. [Google Scholar] [CrossRef] [PubMed]
  15. Weggler, B.A.; Ly-Verdu, S.; Jennerwein, M.; Sippula, O.; Reda, A.A.; Orasche, J.; Gröger, T.; Jokiniemi, J.; Zimmermann, R. Untargeted identification of wood type-specific markers in particulate matter from wood combustion. Environ. Sci. Technol. 2016, 50, 10073–10081. [Google Scholar] [CrossRef]
  16. Pesesse, R.; Stefanuto, P.H.; Schleich, F.; Louis, R.; Focant, J.F. Multimodal chemometric approach for the analysis of human exhaled breath in lung cancer patients by TD-GC×GC-TOFMS. J. Chromatogr. B. 2019, 1114, 146–153. [Google Scholar] [CrossRef]
  17. Berrueta, L.A.; Alonso-Salces, R.M.; Héberger, K. Supervised pattern recognition in food analysis. J. Chromatogr. A 2007, 1158, 196–214. [Google Scholar] [CrossRef]
  18. Escandar, G.M.; Olivieri, A.C. Multi-way chromatographic calibration—A review. J. Chromatogr. A 2019, 1587, 2–13. [Google Scholar] [CrossRef]
  19. Pierce, K.M.; Kehimkar, B.; Marney, L.C.; Hoggard, J.C.; Synovec, R.E. Review of chemometric analysis techniques for comprehensive two dimensional separations data. J. Chromatogr. A 2012, 1255, 3–11. [Google Scholar] [CrossRef]
  20. Gomez-Caravaca, A.M.; Maggio, R.M.; Cerretani, L. Chemometric applications to assess quality and critical parameters of virgin and extra-virgin olive oil. A review. Anal. Chim. Acta 2016, 913, 1–21. [Google Scholar] [CrossRef]
  21. Marriott, P.J.; Haglund, P.; Ong, R.C. A review of environmental toxicant analysis by using multidimensional gas chromatography and comprehensive GC. Clin. Chim. Acta 2003, 328, 1–19. [Google Scholar] [CrossRef]
  22. Martín-Alberca, C.; Ortega-Ojeda, F.E.; García-Ruiz, C. Analytical tools for the analysis of fire debris. A review: 2008–2015. Anal. Chim. Acta 2016, 928, 1–19. [Google Scholar] [CrossRef] [PubMed]
  23. Patterson, R.E.; Kirpich, A.S.; Koelmel, J.P.; Kalavalapalli, S.; Morse, A.M.; Cusi, K.; Sunny, N.E.; McIntyre, L.M.; Garrett, T.J.; Yost, R.A. Improved experimental data processing for UHPLC–HRMS/MS lipidomics applied to nonalcoholic fatty liver disease. Metabolomics 2017, 13, 142. [Google Scholar] [CrossRef]
  24. Da Silva, M.D.R.G.; Cardeal, Z.; Marriott, P.J. Comprehensive two-dimensional gas chromatography: Application to aroma and essential oil analysis. ACS Symp. Ser. 2008, 988, 3–24. [Google Scholar]
  25. Shellie, R.A. Volatile components of plants, essential oils, and fragrances. Compr. Anal. Chem. 2009, 55, 189–213. [Google Scholar]
  26. Tranchida, P.Q.; Shellie, R.A.; Purcaro, G.; Conte, L.S.; Dugo, P.; Dugo, G.; Mondello, L. Analysis of fresh and aged tea tree essential oils by using GC×GC-QMS. J. Chromatogr. Sci. 2010, 48, 262–266. [Google Scholar] [CrossRef]
  27. Smelcerovic, A.; Djordjevic, A.; Lazarevic, J.; Stojanovic, G. Recent advances in analysis of essential oils. Curr. Anal. Chem. 2013, 9, 61–70. [Google Scholar] [CrossRef]
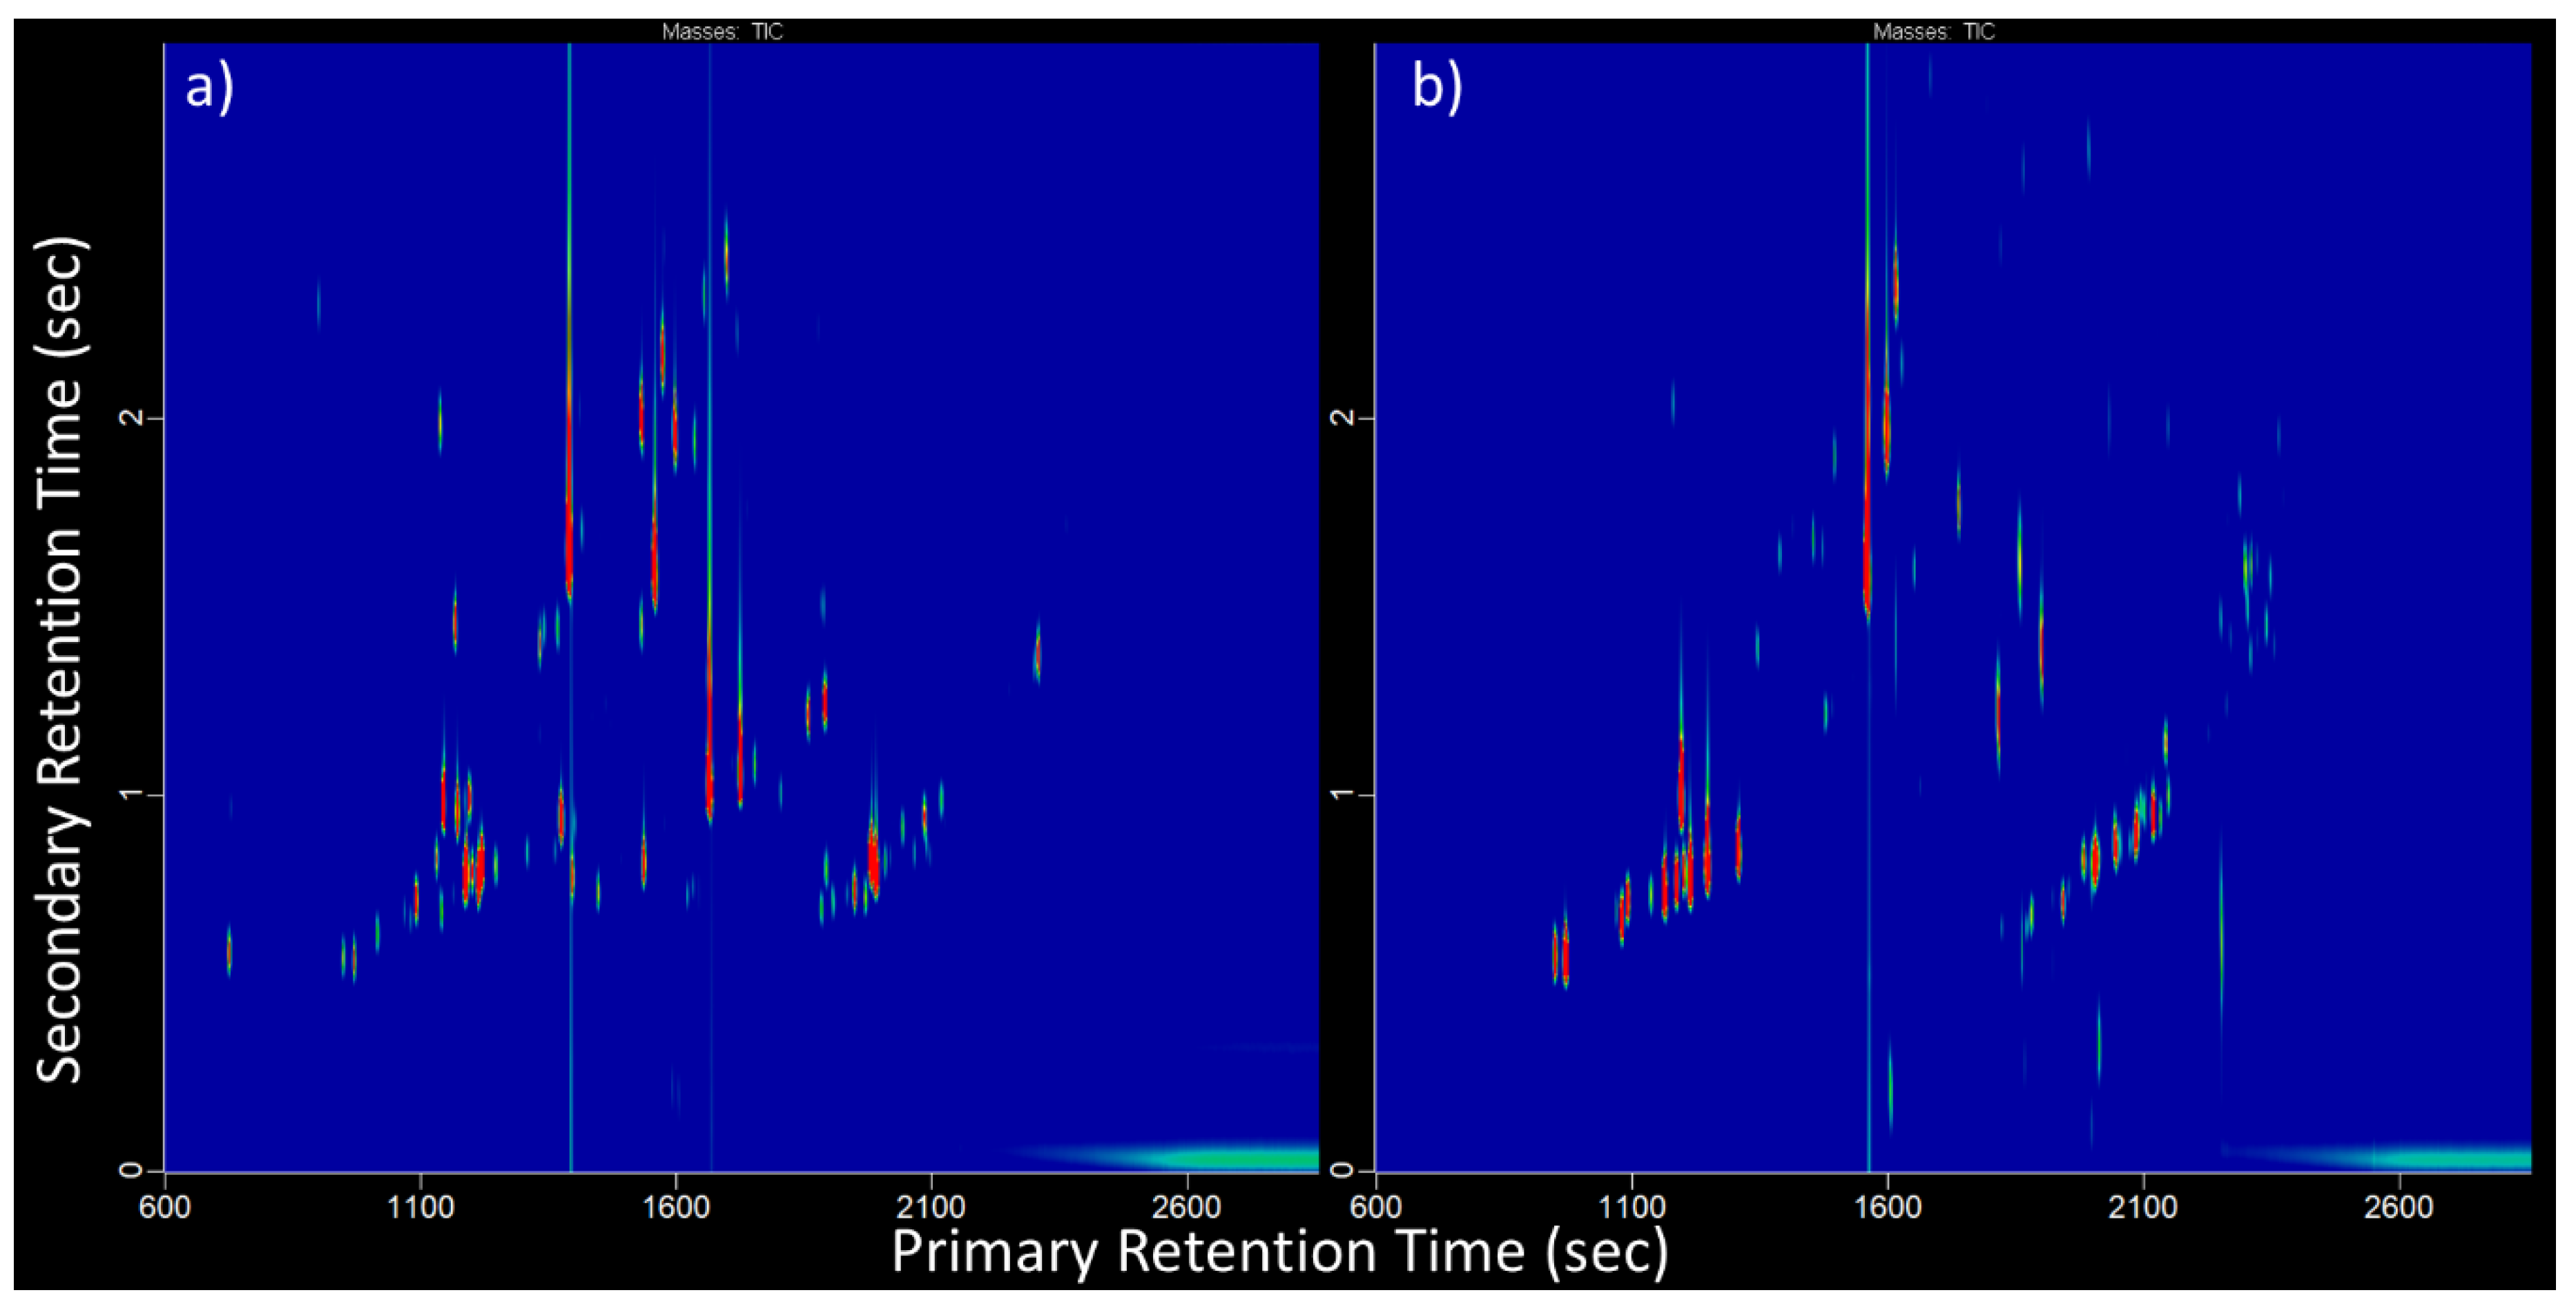
Figure 1. The total ion two-dimensional chromatography time-of-flight mass spectrometry (GC×GC-TOFMS) chromatograms of (a) lavender oil; (b) tea tree oil. The GC×GC chromatograms show many common terpene components.
Separations 06 00041 g001
Figure 2. A comparison of pre-processing protocols in group-based analysis. (a) Principal component analysis (PCA) of mean-centered analytes; (b) PCA of mean-centered and log-transformed analytes. The shaded regions represent the 95% confidence interval the individual groups.
Separations 06 00041 g002
Figure 3. A comparison to feature selection protocols in group-based analysis. (a) PCA of analytes selected with ANOVA p < 0.05; (b) PCA of analytes selected with a Fisher Ratio p < 0.05; (c) Partial least squares-discriminant analysis (PLS-DA).
Separations 06 00041 g003