Article

Multiple-stage Precursor Ion Separation and High Resolution Mass Spectrometry toward Structural Characterization of 2,3-Diacyltrehalose Family from Mycobacterium tuberculosis

1
Department of Medicine, Washington University School of Medicine, St. Louis, MO 63110, USA
2
Department of Microbiology and Molecular Genetics, Michigan State University, East Lansing, MI 48824, USA
3
Department of Molecular Microbiology and Immunology, Oregon Health & Science University, Portland, OR 97239, USA
4
Univ Rennes, Ecole Nationale Supérieure de Chimie de Rennes, CNRS, ISCR–UMR 6226, F-35000 Rennes, France
*
Author to whom correspondence should be addressed.
These authors contributed equally as co-first author.
Separations 2019, 6(1), 4; https://doi.org/10.3390/separations6010004
Submission received: 1 December 2018 / Revised: 2 January 2019 / Accepted: 7 January 2019 / Published: 15 January 2019
(This article belongs to the Special Issue Five Years of Separations: Feature Paper 2018)

Abstract

:
Mass spectrometry (MS)-based precursor ion isolation, collision-induced dissociation (CID) fragmentation, and detection using linear ion-trap multiple-stage mass spectrometry (LIT MSn) in combination with high resolution mass spectrometry (HRMS) provides a unique tool for structural characterization of complex mixture without chromatographic separation. This approach permits not only separation of various lipid families and their subfamilies, but also stereoisomers, thereby, revealing the structural details. In this report, we describe the LIT MSn approach to unveil the structures of a 2,3-diacyl trehalose (DAT) family isolated from the cell envelope of Mycobacterium tuberculosis, in which more than 30 molecular species, and each species consisting of up to six isomeric structures were found. LIT MSn performed on both [M + Na]+ and [M + HCO2] ions of DAT yield complimentary structural information for near complete characterization of the molecules, including the location of the fatty acyl substituents on the trehalose backbone. This latter information is based on the findings of the differential losses of the two fatty acyl chains in the MS2 and MS3 spectra; while the product ion spectra from higher stage LIT MSn permit confirmation of the structural assignment.

Graphical Abstract

1. Introduction

Tandem mass spectrometry is a powerful tool for structural analysis of unknown molecules. Tandem mass spectrometry consists of several sequential events including formation and mass selection of the precursor ions, collision induced dissociation (CID) with inert target gas for fragment ion formation, followed by mass analysis and detection of the product-ions. For tandem mass spectrometry with quadrupole (e.g., triple quadrupole, TSQ), sector, and hybrid Q-TOF instruments, these processes occur sequentially in the separate regions of the instruments and the MS/MS process is tandem-in-space. For quadrupole ion-trap (QIT) and linear ion trap (LIT) instruments, the precursor ion selection, CID, and product-ion analysis and detection events are all executed in the ion trap in a timing sequence manner, and the MS/MS process is tandem-in-time [1]. Linear ion trap multiple stage tandem mass spectrometry (LIT MSn) permits the repeat of the precursor ion selection-CID-product-ion analysis process, and up to 10 cycles can be performed using modern commercial LIT mass spectrometers such as Thermo LTQ Orbitrap. This instrument is also featured with an extreme high resolving power and up to a million resolution (at m/z 200) can be reached [2].
Due to its MSn capability with high resolution, LIT/Orbitrap with MSn approach has been widely used in the structural characterization of a wide range of biomolecules [3,4,5,6,7]. LIT MSn with high resolution is also extremely useful for identification of complex lipid structures, in particular, microbial lipid, permitting revelation of numerous isomeric molecules in lipid extracts. For example, we demonstrated that sulfolipid II in Mycobacterium tuberculosis (M. tuberculosis) H37Rv cells is the predominated lipid family, consisting of hundreds of molecular species rather than the sulfolipid I family as previously reported [8,9]. LIT MSn with high resolution mass spectrometry has also been successfully applied to delineate the structures of phosphatidylinositol mannosides (PIMs) [10,11], and phthiocerol dimycocerosates (PDIMs) [12] in the cell envelope of M. tuberculosis. The former lipid family is known to have played important roles in M. tuberculosis adhesins that mediate attachment to nonphagocytic cells [13], while the latter is recently found to play role in drug resistance to M. tuberculosis [14].
In addition to the above complex lipid families, other glycolipids found in the mycobacterial cell wall include acylated trehaloses [15,16,17,18]. These trehalose-containing glycolipids consist of many families [18,19,20,21,22], of which the 2,3-di-O-acyltrehaIose (DAT) family was previously defined as glycolipid B. DAT is a mycobacterial factor capable of modulating host immune responses [23] and can inhibit the proliferation of murine T cells [24]. DAT along with pentaacyl trehalose (PAT) also play an important role in pathogenesis and a structural role in the cell envelope, promoting the intracellular survival of the bacterium [25]. The DATs from M. tuberculosis and M. fortuitum have been shown to be antigenic [24,26,27] and their potential use in serodiagnosis has been postulated [28,29].
Besra and coworker defined the structures of the acylated trehalose lipid family using gas chromatography-mass spectrometry, in conjunction with normal/reversed phase TLC, and one/two-dimensional 1H, and 13C nuclear magnetic resonance spectroscopy [21]. However, there is no report in the detailed structural assignment of the various molecular species with many isomeric structures for the entire lipid family.
In this report, we applied multiple stage precursor ion isolation and resonance excitation activation to generate distinct MSn spectra to explore the structure details of the 2,3-diacyl trehalose (DAT) lipid family found in M. tuberculosis. This study highlights the unique feature of the technique of LIT MSn for tandem-in-time precursor ion separation that affords structural characterization of a complex lipid family, while a similar structural analysis would be very difficult to perform utilizing the tandem mass spectrometric approach with a sector, TSQ or QTOF instrument.

2. Materials and Methods

2.1. Materials

All solvents (spectroscopic grade) and chemicals (ACS grade) were obtained from Sigma Chemical Co. (St. Louis, MO, USA).

2.2. Sample Preparation

M. tuberculosis strain H37Rv were grown and total lipids were extracted and isolated as previously described [8]. Briefly, the total lipid was separated by a Phenomenex C18 Kinetex (100 × 4.6 mm, pore size 100 Å, particle size 2.6 μm) column at a flow rate of 300 μL/min with a gradient system as previously described [12]. DAT (eluted at 24.45–26.43 min) fraction from three injections (~200 μg total lipid/injection) were collected and pooled, dried under a stream of nitrogen, and stored at −20 °C until use.

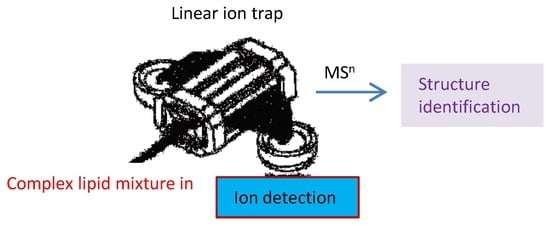
2.3. Mass Spectrometry

Both high-resolution (R = 100,000 at m/z 400) low-energy CID and higher collision-energy dissociation (HCD) tandem mass spectrometric experiments were conducted on a Thermo Scientific (San Jose, CA, USA) LTQ Orbitrap Velos mass spectrometer (MS) with Xcalibur operating system. Samples in CH3OH were infused (1.5 μL/min; ~10 pmol/μL) to the ESI source, where the skimmer was set at ground potential, the electrospray needle was set at 4.0 kV, and temperature of the heated capillary was 300 °C. The automatic gain control of the ion trap was set to 5 × 10⁴, with a maximum injection time of 100 ms. Helium was used as the buffer and collision gas at a pressure of 1 × 10⁻³ mbar (0.75 mTorr). The MSn experiments were carried out with an optimized relative collision energy ranging from 25–35% and with an activation q value at 0.25. The activation time was set for 10 ms to leave a minimal residual abundance of precursor ion (around 20%). For the HCD experiments, the collision energy was set at 50–55% and mass scanned from m/z 100 to the upper m/z value that covers the precursor ions. The mass selection window for the precursor ions was set at 1 Da wide to admit the monoisotopic peak to the ion-trap for collision-induced dissociation (CID) for unit resolution detection in the ion-trap or high resolution accurate mass detection in the Orbitrap mass analyzer. Mass spectra were accumulated in the profile mode, typically for 3–10 min for MSn spectra (n = 2,3,4).

2.4. Nomenclature

To facilitate data interpretation, the following abbreviations were adopted. The abbreviation of the long-chain fatty acid such as the stearic acid attached to the C2 position of the trehalose backbone is designated as 18:0. The multiple methyl-branched mycolipenic acid, for example, the 2,4,6-trimethyl-2-tetracosenoic acid attached to the C3-position is designated as 27:1 to reflect the fact that the acid contains a C27 acyl chain with one double bond. Therefore, the DAT species consisting of 18:0- and 27:1-FA substituents at C2-, and C3-position, respectively, is designated as 18:0/27:1-DAT.

3. Results and Discussion

DAT formed [M + Alk]+ ions (Alk = NH4, Li, Na, etc.) in the positive ion mode; and [M + X] (X = Cl, RCO2; R = H, CH3, C2H5, etc.) ions in the negative-ion mode when subjected to ESI in the presence of Alk+ and X. For example, when dissolved in CH3OH with the presence of HCO2Na, adduct ions in the fashions of [M + Na]+ (Figure 1) in the positive ion mode and [M + HCO2] ions (data not shown) in the negative ion mode were observed. The formation of these adduct ions was revealed by the elemental composition of the molecular species deduced by high resolution mass spectrometry (Table 1). Upon being subject to CID in a linear ion-trap, the MSn (n = 2,3,4) spectra of both the [M + Na]+ and [M + HCO2] ions contain rich structural information readily applicable for structural identification.

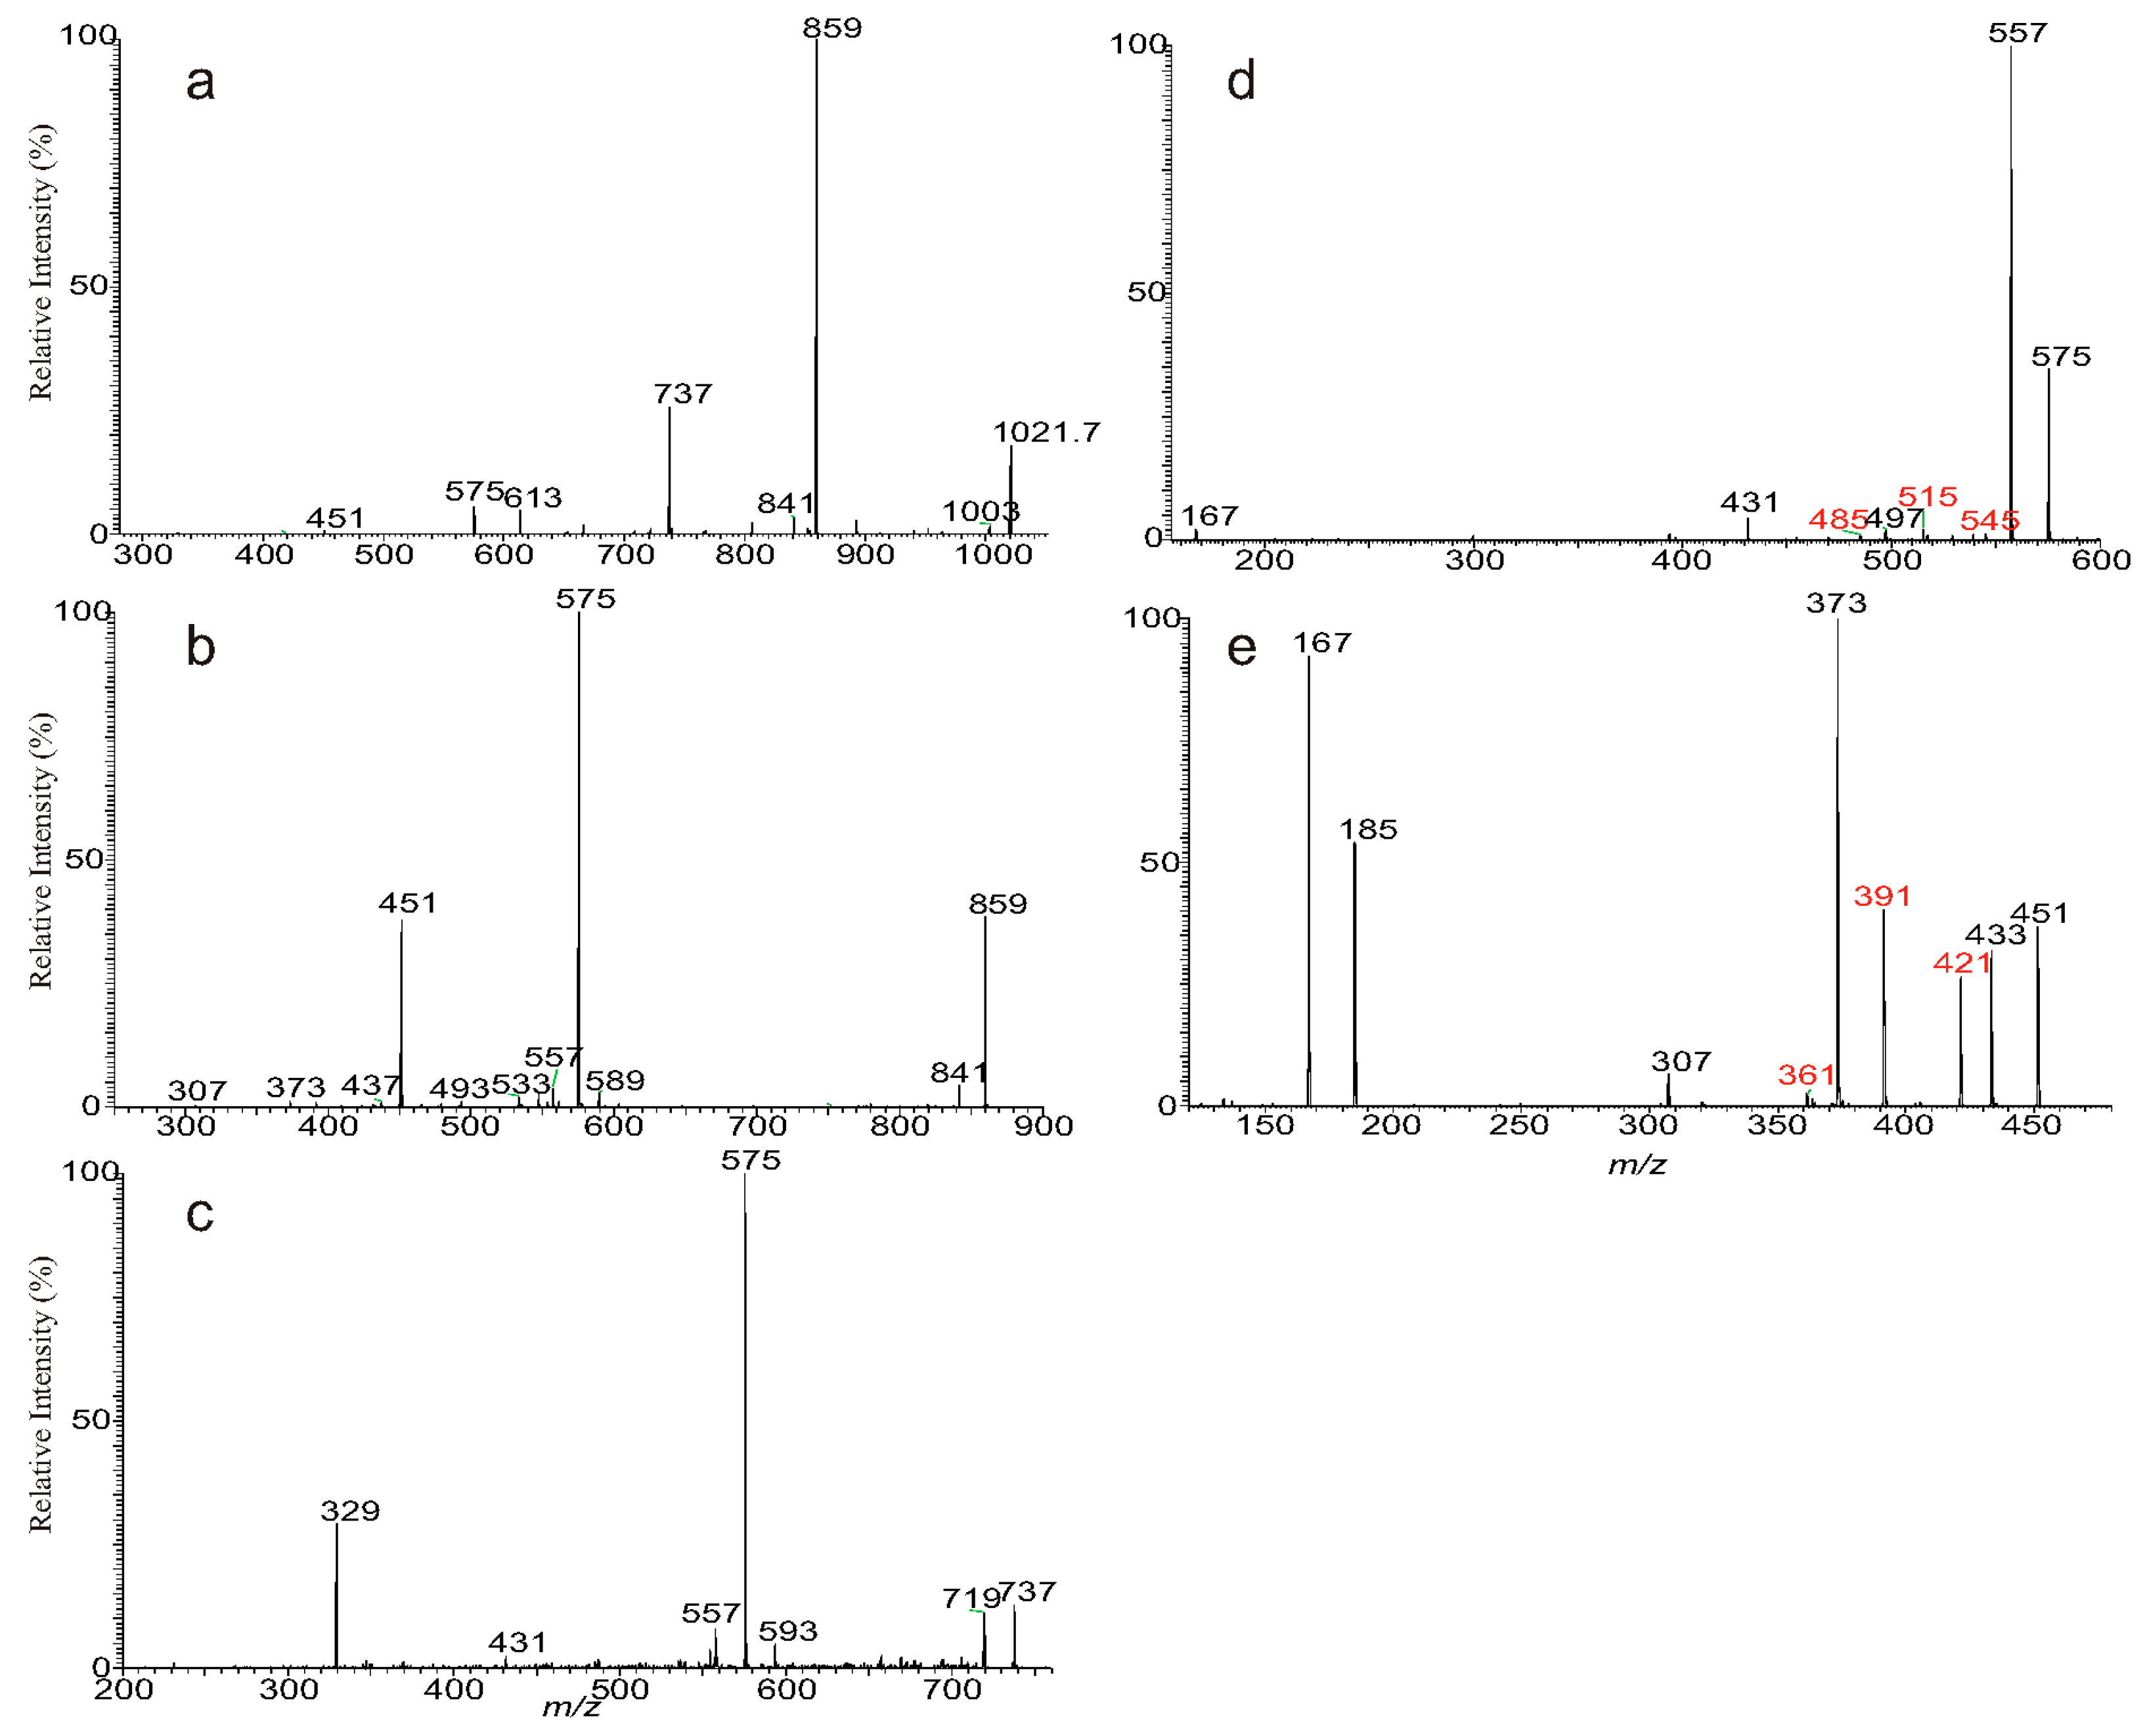
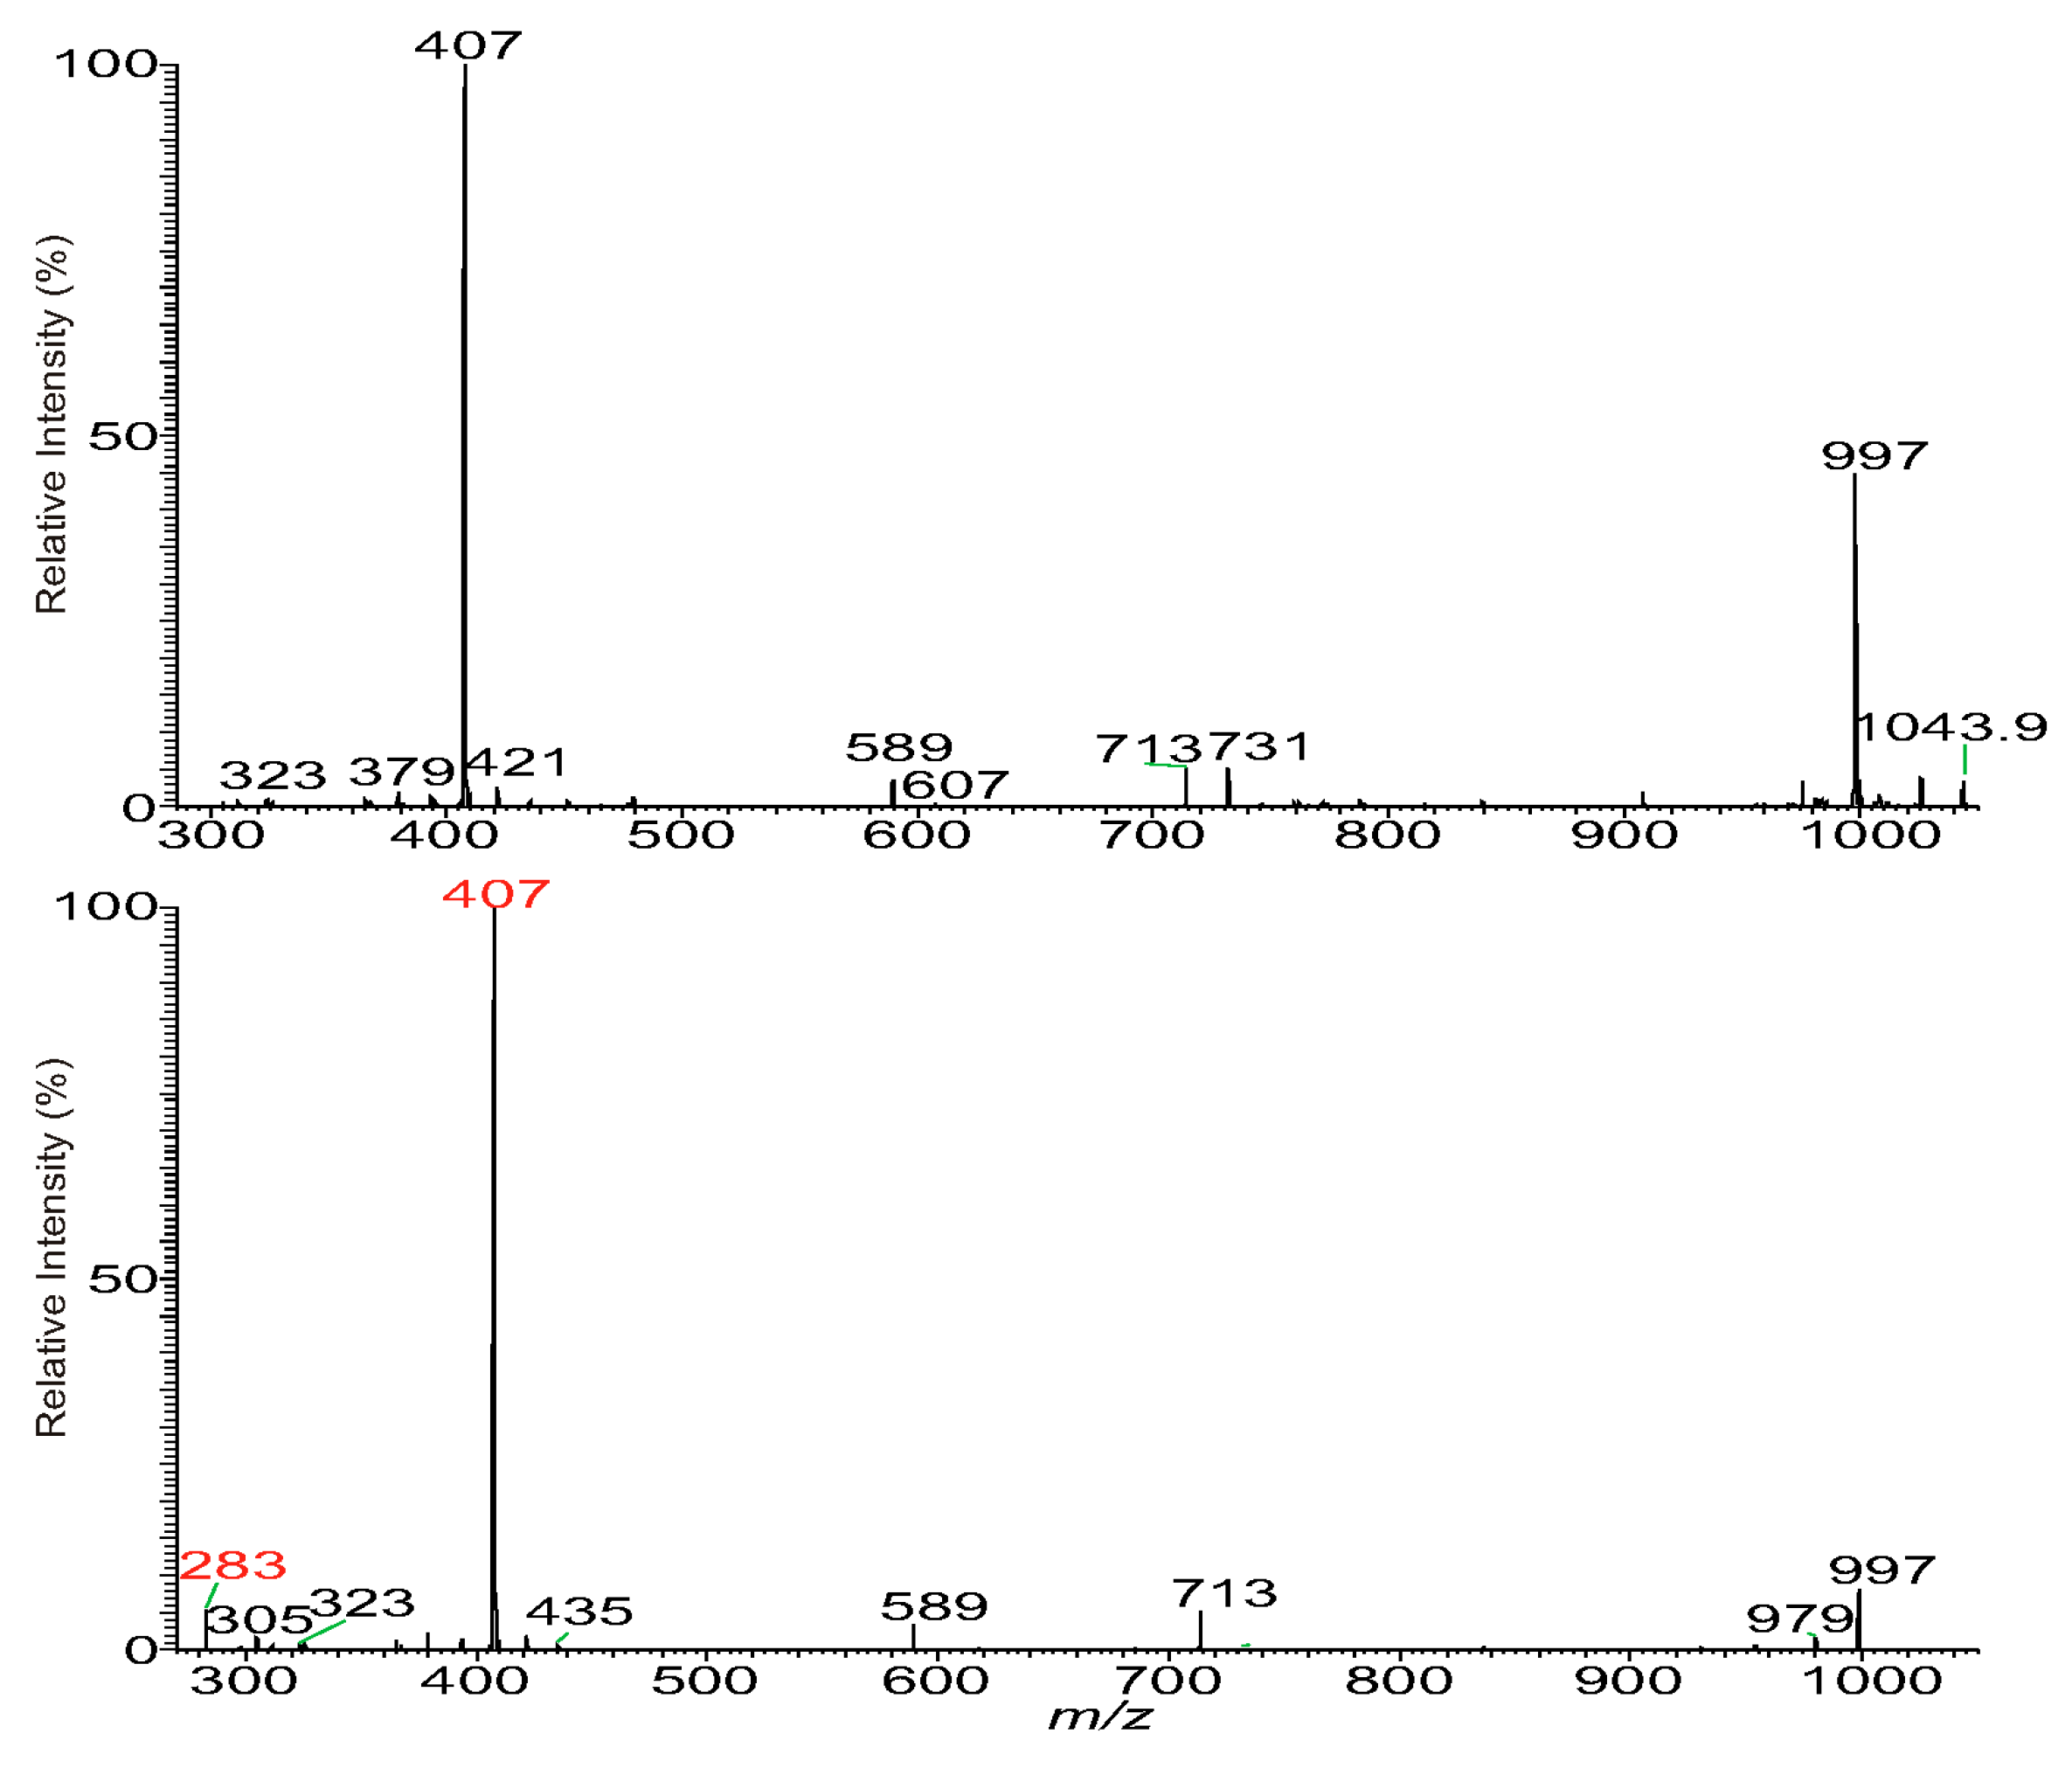
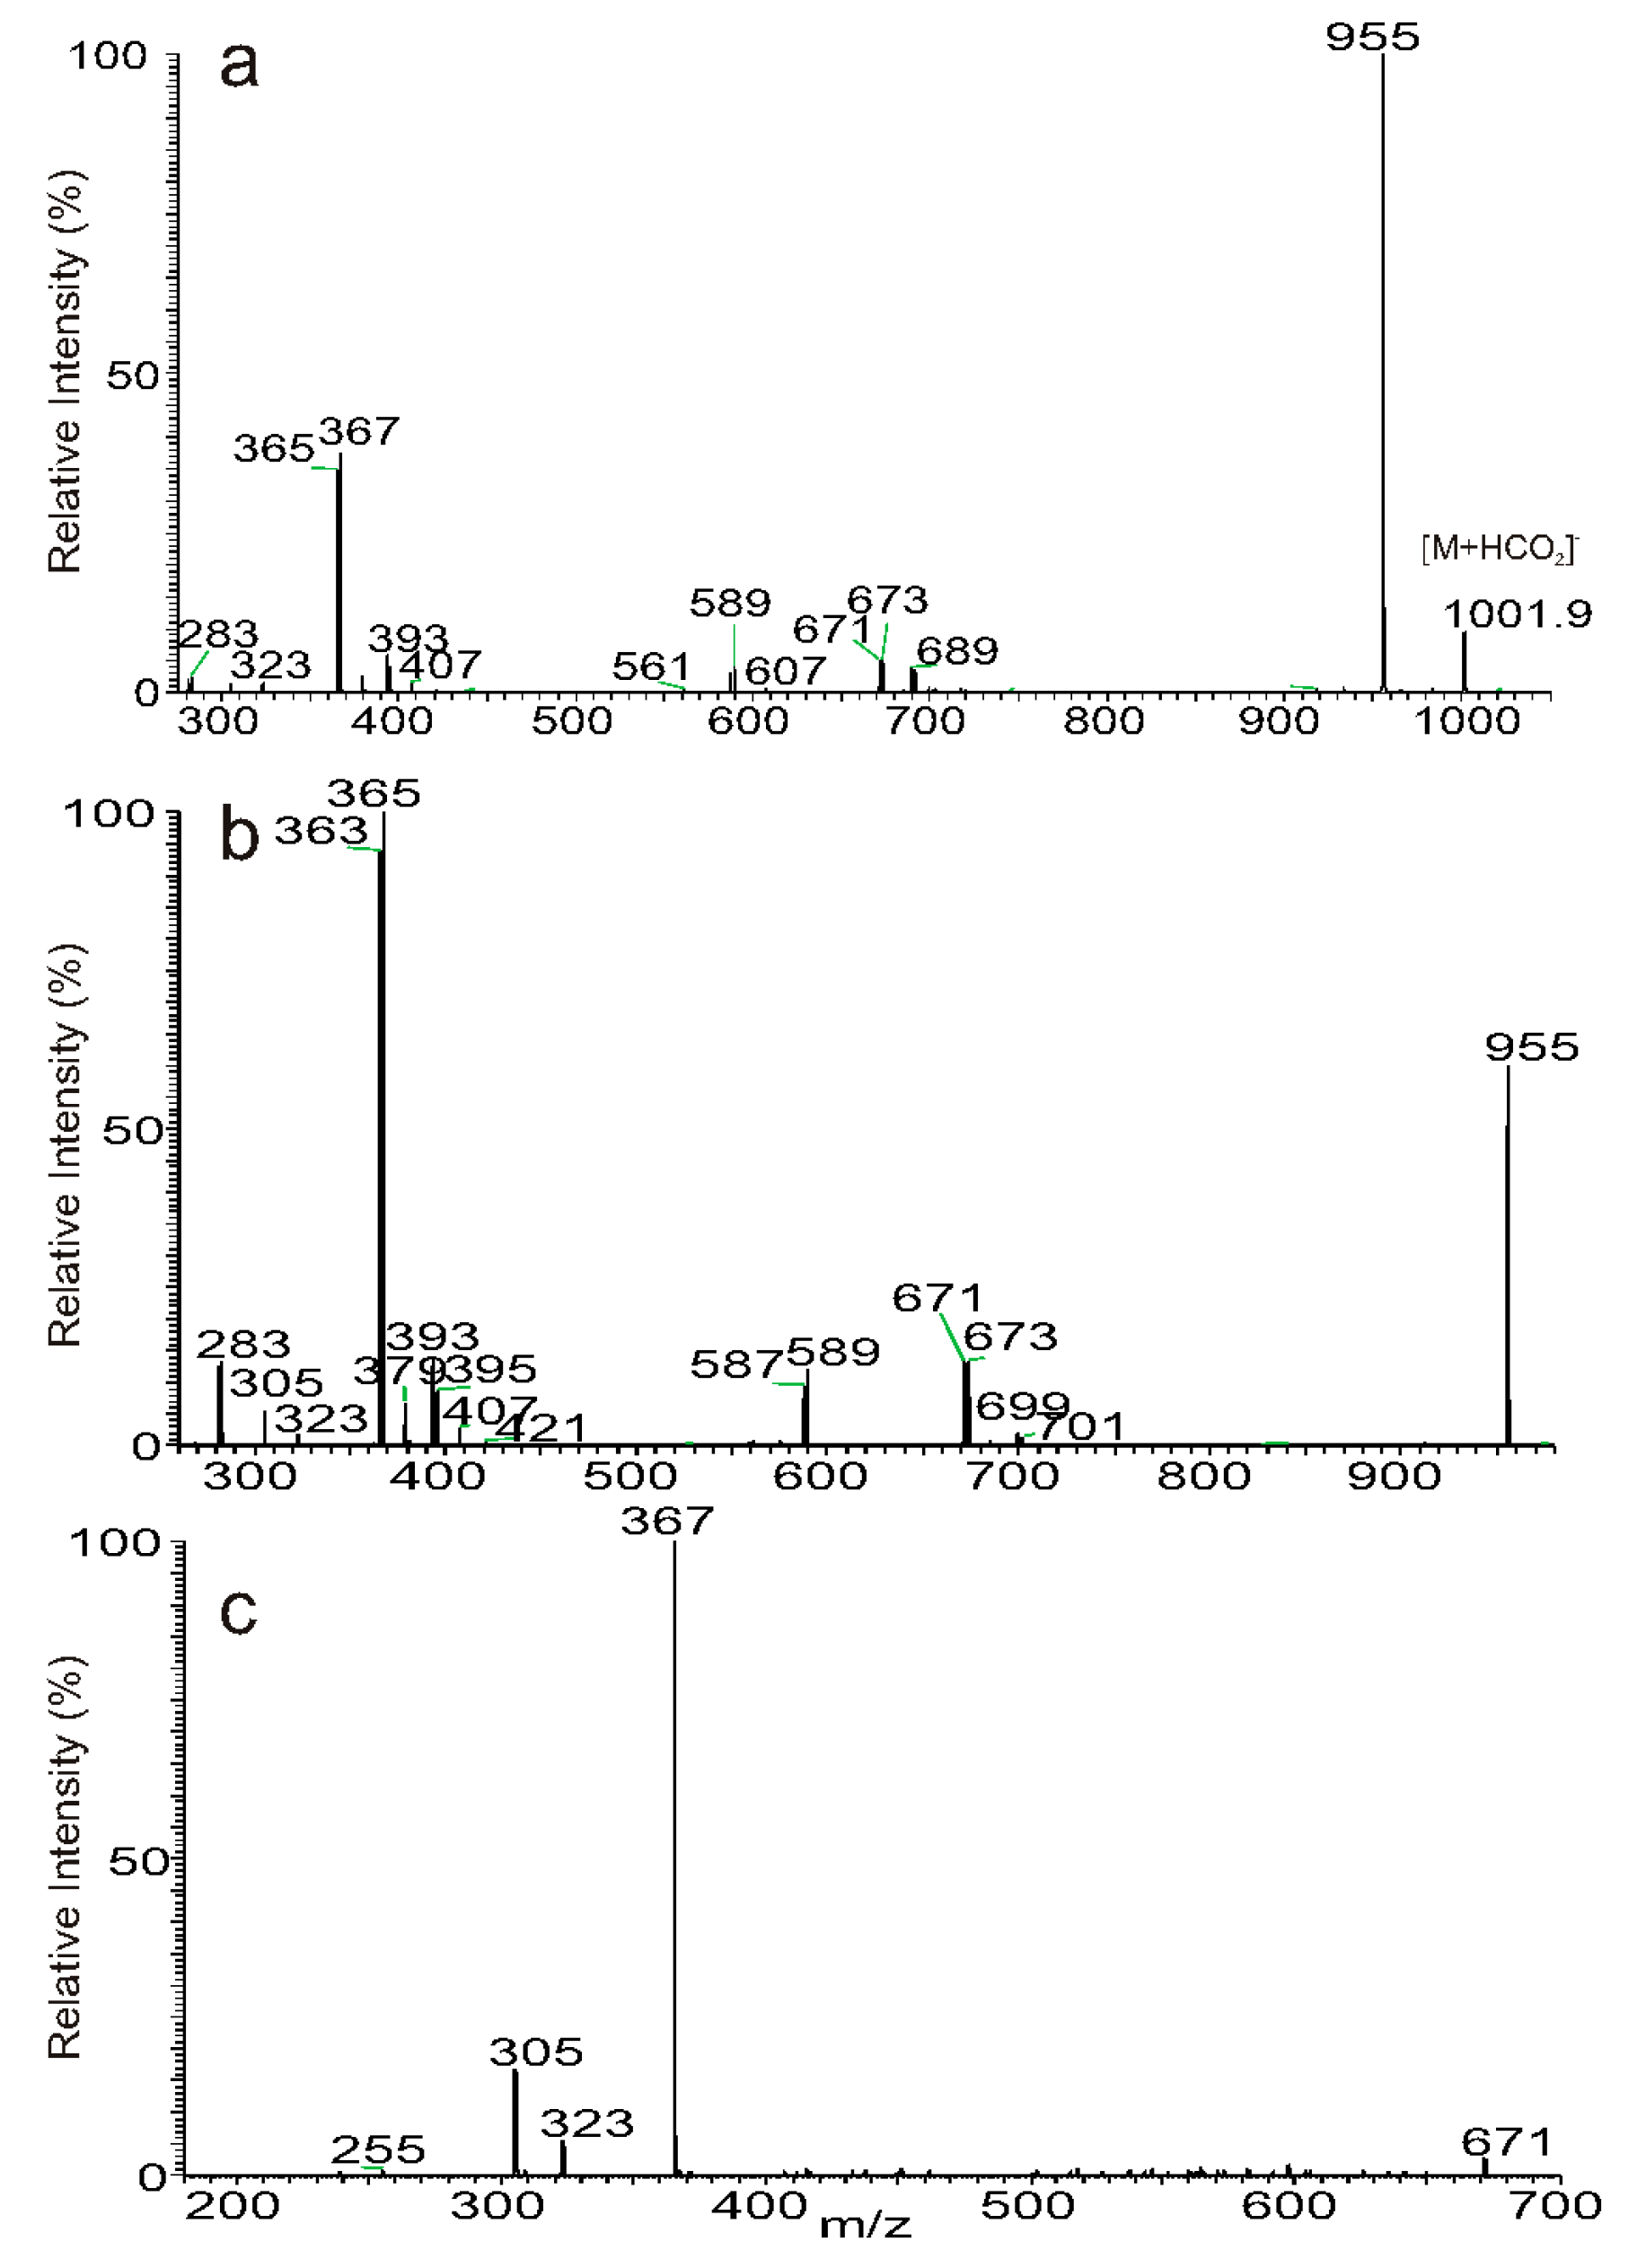
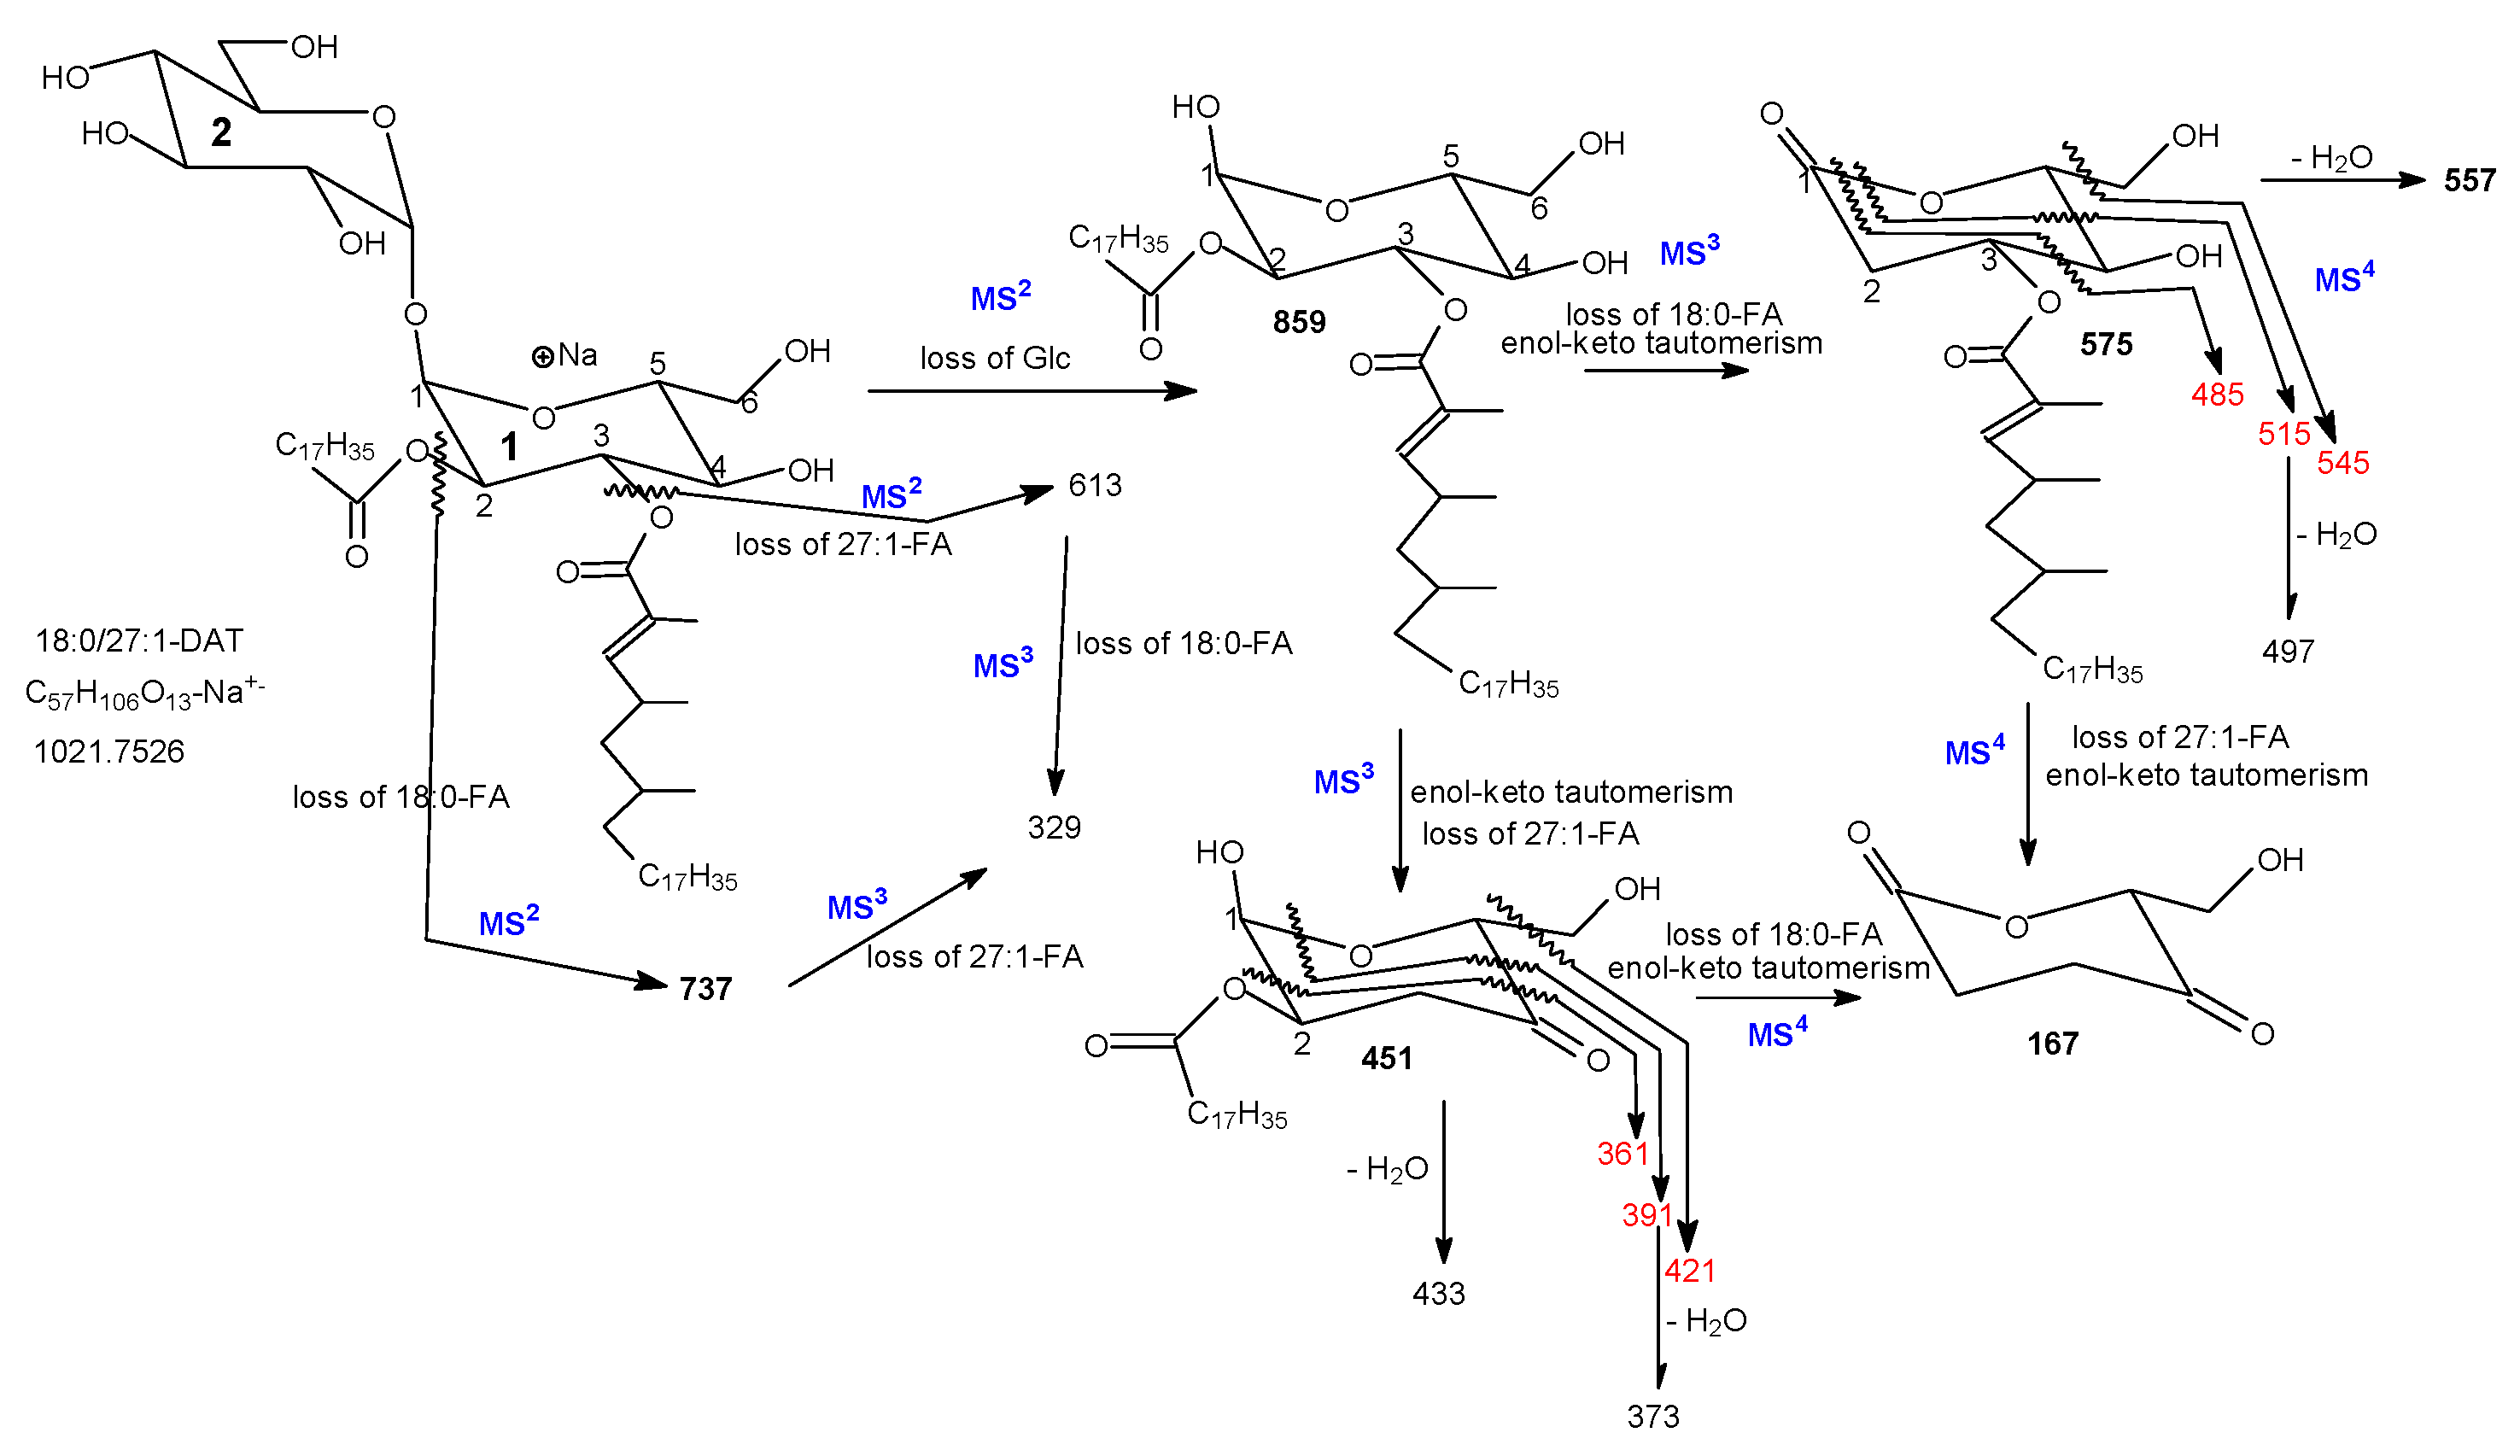
3.1. The Fragmentation Processes of the [M + Na]+ Ions of DAT Revealed by LIT MSn

The utility in the performance of sequential precursor ion separation, CID, and acquiring MSn spectra of LIT MSn mass spectrometry permits insight into not only the fragmentation processes, but also the structural details of the molecules. For example, the LIT MS2 spectrum of the [M + Na]+ ions of 18:0/27:1-DAT at m/z 1021 contained the dominated ions of m/z 859 (Figure 2a) arising from loss of glucose residue, along with the ion set at m/z 737 and 613, arising from losses of 18:0-, and 27:1-fatty acid substituents, respectively (Scheme 1). The ions of m/z 859 represent the sodiated diacylglucose with both the 18:0-, and 27:1-fatty acyl substituents. This notion is further supported by the MS3 spectrum of the ions of m/z 859 (1021 → 859, Figure 2b) which contained ions of m/z 575 (859 – 284) and 451 (859 – 408), arising from losses of 18:0-, and 27:1-fatty acid substituents, respectively. The results also suggest that the Na+ charge site most likely resides at the glucose ring with the two acyl groups (Glc 1). In contrast, the MS2 spectrum of the [M + Na]+ ions of the 6,6′-dioleoyltrehalose standard [30] at m/z 893 forms abundant ions at m/z 467, representing the sodiated oleoylglucose (data not shown), consistent with the fact that the 18:1 fatty acyl substituents in the 18:1/18:1-DAT are located on the separate Glc (i.e., Glc1 and Glc 2). Further dissociation of the ions of m/z 737 (1013 → 737, Figure 2c) gave rise to the prominent ions of m/z 329 by loss of 27:1-fatty acid substituent, and m/z 575, arising from loss of glucose residue (Glc 2), together with m/z 431 representing a sodiated ion of 27:1-FA. These results further support the fragmentation processes as proposed in Scheme 1.
The formation of the ions of m/z 575 from m/z 859 by loss of 18:0-FA residue at C2 may involve the participation of the hydrogen atom at C1 to form an enol, which undergoes enol-keto tautomerism to yield a stable sodiated ion of monoacyl (27:1) glucose as the keto form (Scheme 1). This fragmentation processes are further supported by MS4 on the ions of m/z 575 (1013 → 859 → 575, Figure 2d), which yielded ions of m/z 545, 515, and 475, likely arising from the across cleavages of the glucose ring, suggesting that the 27:1-fatty acyl substituent is located at C3 (Scheme 1).
Similarly, MS4 on the ion of m/z 451 (1013 → 859 → 451, Figure 2e) gave rise to ions of m/z 421, 391, and 361 arising from the similar rupture of the glucose ring, indicating that the 18:0-fatty acyl substituent is most likely located at C2 of the glucose ring. The preliminary loss of the 27:1-FA substituent may involve the participation of the adjacent hydrogen at C4 of Glc 1 to form an enol, which sequentially rearranges to keto form via the similar enol-keto tautomerism mechanism.
The preferential formation of the ions of m/z 575 from loss of the 18:0-FA substituent over the ions of m/z 451 from similar loss of the 27:1-FA as seen in Figure 2a is readily applicable for locating the FA substituents on the trehalose backbone.

3.2. LIT MSn on the [M + Na]+ Ions of DAT for Stereoisomer Recognition

To define the structures of DAT species with many isomeric structures using LIT MSn is exemplified by characterization of the [M + Na]+ ions of m/z 979, which gave rise to the prominent ions at m/z 817 (Figure 3a) arising from loss of glucose. Further dissociation of the ions of m/z 817 (979 → 817; Figure 3b) yielded the ion pairs of m/z 533/451, arising from losses of 18:0/24:1 fatty acid substituents, indicating that the these two acyl groups are situated at Glc 1, giving assignment of the 18:0/24:1-DAT structure. The spectrum also contained the m/z 535/449, 561/423, 547/437, 563/421, 575/409 ion pairs, arising from losses of 18:1/24:0, 16:0/26:1, 17:0/25:1, 16:1/26:0, and 15:0/27:1 FA pairs, respectively. The results indicate the presence of the 18:1/24:0-, 16:0/26:1-, 17:0/25:1-, 16:1/26:0-, and 15:0/27:1-DAT isomers. The above structure assignments were further confirmed by the MS3 and MS4 spectra. For example, the MS3 spectrum of the ions of m/z 697 (979 → 697; Figure 3c) from primary loss of a 18:1-FA residue at C2 (Figure 3a) gave the abundant ions of m/z 535 (loss of Glc 2), along with ions of m/z 329 arising from loss of 24:0-FA substituent, and of m/z 391, representing a sodiated 24:0-FA cation. The results confirm the presence of 18:1/24:0-DAT. The MS4 spectrum of the ions of m/z 535 (979 → 817 → 535; Figure 3d) contained ions of m/z 517 (loss of H2O) and 505, 475, 445 arising from cleavages of the sugar ring similar to that shown in Scheme 1, along with ions of m/z 167 from loss of 24:0-FA, pointing to notion that the 24:0-FA is located at C3.
The MS3 spectrum of the ions of m/z 695 (979 → 695; Figure 3e) contained the ions of m/z 533 and 329 arising from further losses of Glc and 24:1-FA residues (Figure 3a), respectively. The MS4 spectrum of the ions of m/z 533 (979 → 817 → 533; data not shown) gave ions of m/z 503, 473, and 443 from the similar fragmentation processes that cleave the sugar ring (Scheme 1), confirming that the 24:1-FA substituent is located at C3. The results led to assign the 18:0/24:1-DAT structure. Using this LIT MSn approach, a total of six isomeric structures were identified.

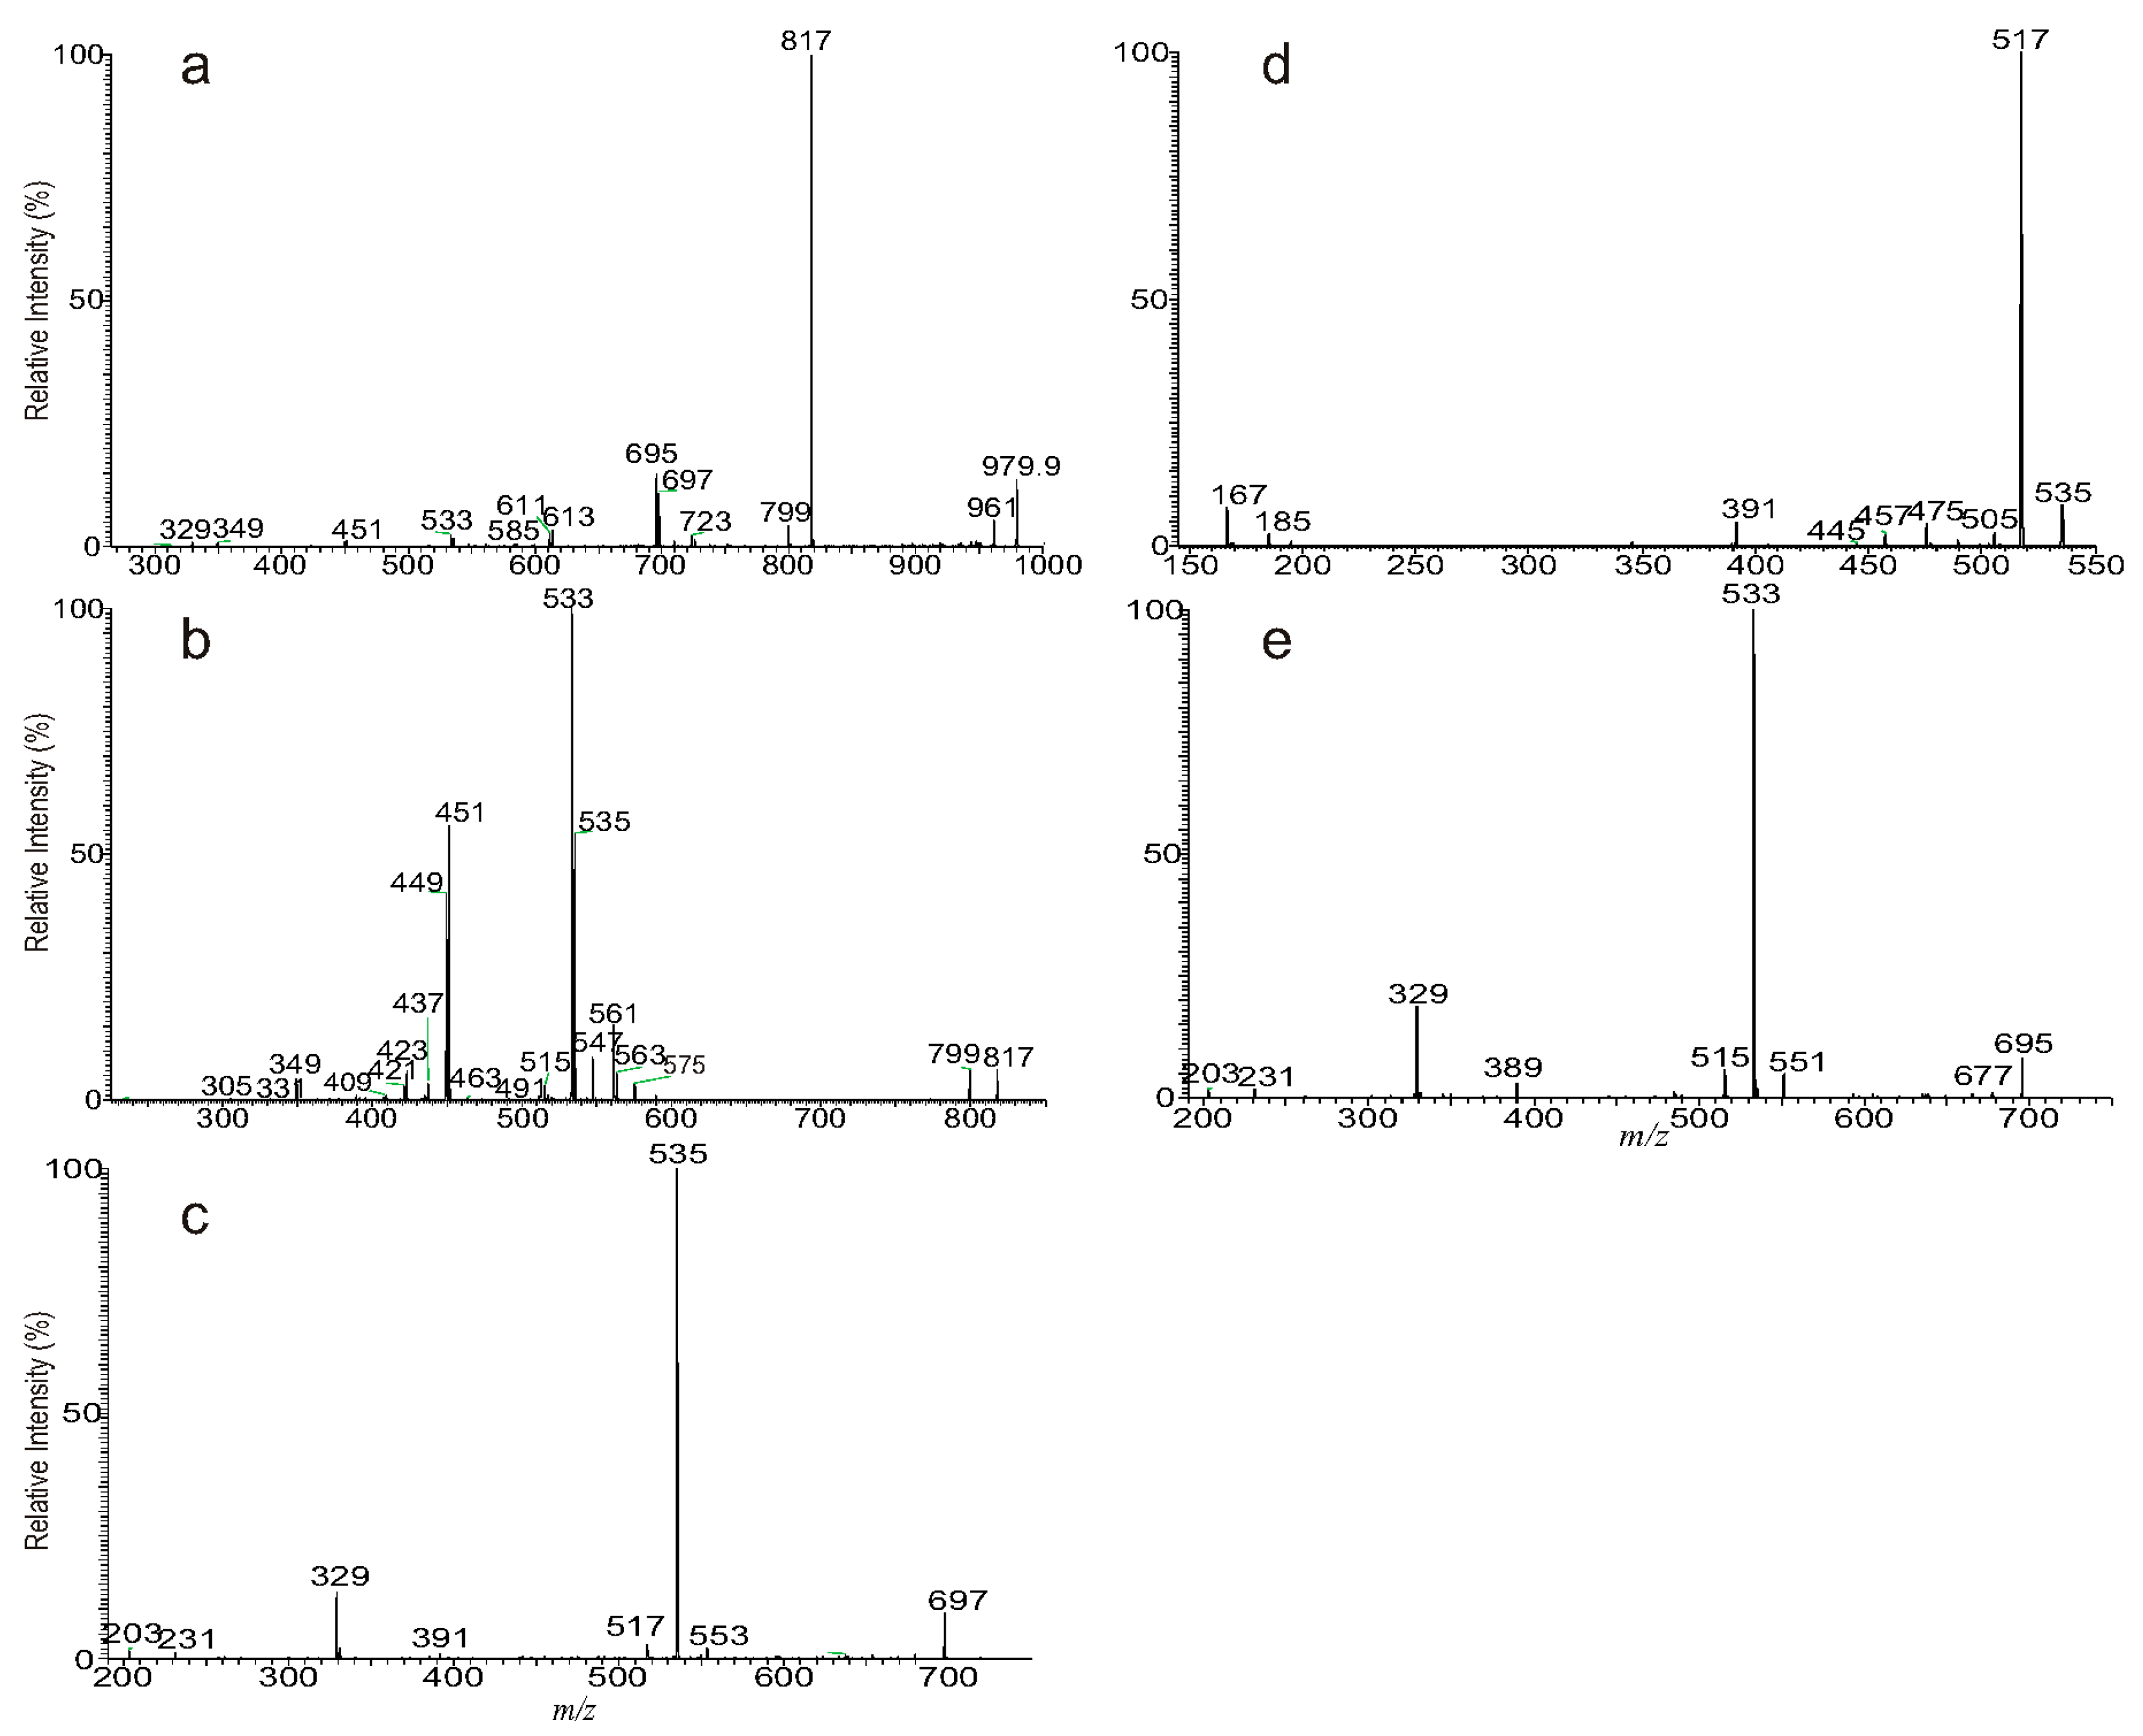
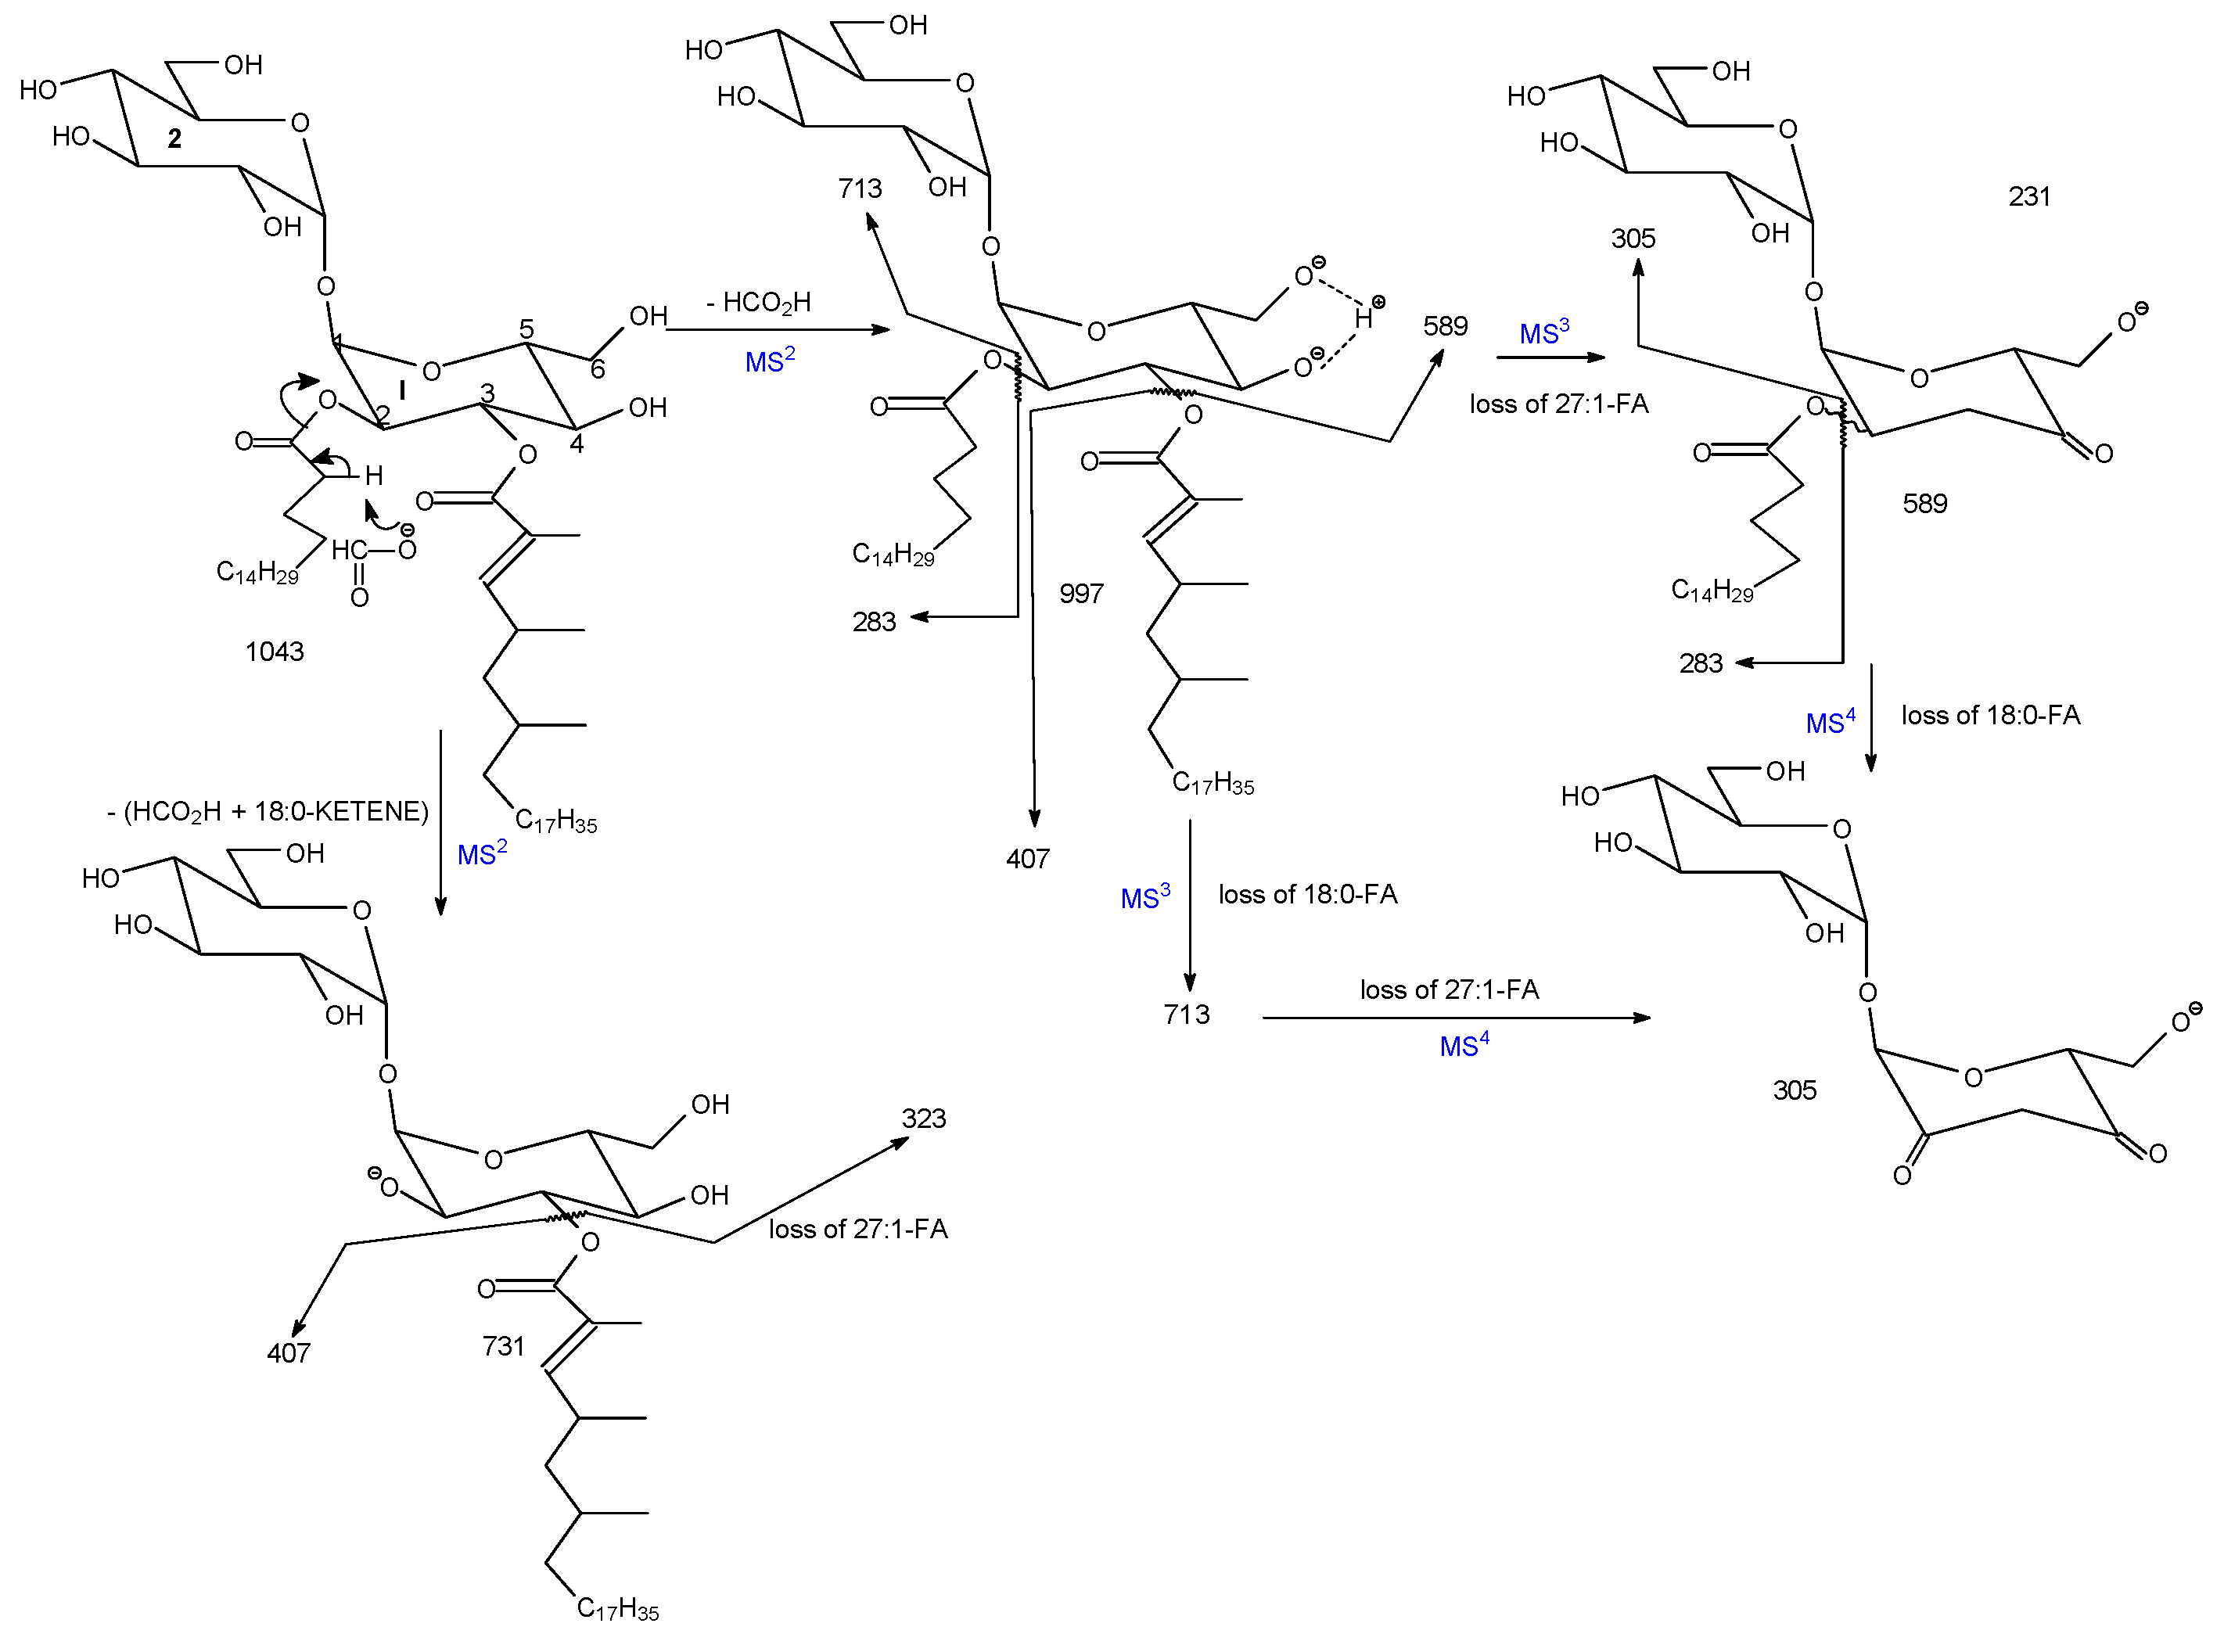
3.3. The Fragmentation Processes of the [M + HCO2] Ions of DAT Revealed by LIT MSn

In the negative-ion mode in the presence of HCO2, 18:0/27:1-DAT formed [M + HCO2] ions of m/z 1043, which gave rise to the prominent ions of m/z 997 by loss of HCO2H, along with ions of m/z 713 and 589 by further losses of 18:0- and 27:1-FA substituents, respectively (Figure 4a) (Scheme 2). This fragmentation process is further supported by the MS3 spectrum of the ions of m/z 997 (1043 → 997, Figure 4b), which are equivalent to the [M − H] ions of 18:0/27:1-DAT. The ions of m/z 731 (Figure 4a) arising from loss of 18:0-FA as a ketene is more prominent than the ions of m/z 607 arising from analogous 27:1-ketene loss. This preferential formation of m/z 731 corresponding to loss of the FA-ketene at C2 over ions of m/z 607 from the FA-ketene loss at C3 was seen in all the MS2 spectra of the [M + HCO2] ions of DAT, providing useful information for distinction of the FA substituents at C2 and C3. The ketene loss process probably involves the participation of HCO2, which attracts the labile α-hydrogen on the fatty acid group to eliminate FA-ketene and HCO2H simultaneously (Scheme 2). Therefore, the low abundance of the ions of m/z 607 arising from loss of the FA-ketene at C3 may reflect the fact that the 27:1-FA substituent at C3 contains an α-methyl side chain [19,21,22,31], and does not contain labile α-hydrogen required for ketene loss. This is in contrast to the 18:0-FA substituent at C2, which possesses two α-hydrogens (Scheme 2).
The ions at m/z 731 and 607 arising from losses of 18:0-ketene and 27:1-ketene, respectively, are absent in Figure 4b. This is consistent with the notion that the ketene loss requires the participation of HCO2. The ketene loss pathway becomes not operative after the [M − H] ions are formed from [M + HCO2] by loss of HCO2H.
The spectrum (Figure 4b) also contained the prominent ions of m/z 407, representing 27:1-fatty acid carboxylic anions, and the ions of m/z 283 representing 18:0-FA carboxylate anions, along with ions of m/z 305 arising from losses of both 18:0- and 27:1-FA substituents. The preferential formation of the ions of m/z 407 (at C3) over m/z 283 (at C2) is also a reflection of the location of the fatty acid substituents on the Glc ring, leading to the assignment of 18:0/27:1-DAT structure.

3.4. Recognition of Stereoisomers Applying LIT MSn on the [M + HCO2] Ions

Similarly, the MS2 spectrum of the ions of m/z 1001 is dominated by the ions of m/z 955 from loss of HCO2H (Figure 5a). The MS3 spectrum of the ions of m/z 955 (1001 → 955) (Figure 5b) contained ions at m/z 701, 699, 685, 673, 671, 589, 587, 575, 561, 559, similar to those seen in Figure 5a, consistent with the consecutive dissociation processes of the [M − H] ions that eliminate the FA substituents. These ions arose from losses of 16:1-, 16:0-, 17:0-, 18:1-, 18:0-, 24:1-, 24:0-, 25:0-, 26:1, and 26:0-fatty acid substituents, respectively. The spectrum also contained the major m/z 283/365, 281/367 ion pairs, together with the minor ion pairs of m/z 255/393, 253/395, 269/379, 241/407. These structural information led to assignment of the major 18:0/24:1-, and 18:1/24:0-DAT isomers, together with the 16:0/26:1-, 16:1/26:0-, 17:0/25:1, and 15:0/27:1-DAT minor isomers. It should be noted that the absence of ions at m/z 241, 253, 255, and 269 representing 15:0-, 16:1-, 16:0-, and 17:0-carboxylate anions, respectively, in Figure 5b, are attributable to the low mass cutoff nature of an ion-trap instrument. In contrast, these ions are abundant in the HCD production ion spectrum (data not shown), similar to that obtained by a triple quadrupole instrument [32]. The location of the fatty acid substituent position on the glucose skeleton is again confirmed by observation of the ions corresponding to loss of the fatty acid substituents as ketenes. For example, ions at m/z 691 and 689 (Figure 5a) derived from losses of (HCO2H + 18:1-ketene) and (HCO2H + 18:0-ketene), respectively, pointing to the notion that both 18:1- and 18:0-FA are situated at C2 of the 18:1/24:0-, and 18:0/24:1-DAT isomers, respectively. The assigned structure of 18:0/24:1-DAT, for example, is further confirmed by MS4 on the ions of m/z 671 (1001 → 955 → 671) (Figure 5c), which formed ions of m/z 365, representing a 24:1-carboxylate anion, and ions of m/z 323 and 305 arising from further loss of 24:1-FA substituent as ketene and FA, respectively.

3.5. Characterization of Minor Species Applying LIT MSn on the [M + HCO2] Ions

Applying multiple-stage mass spectrometry (LIT MSn) for consecutive ion separation followed by CID mass spectrometry is particularly useful for characterization of minor DAT species as [M + HCO2] ions. For example, the MS2 spectrum of the [M + HCO2] ion of the minor DAT at m/z 989 (Figure 6a) gave a major [M − H] fragment ions at m/z 943, but the spectrum also contained many unrelated fragment ions (e.g., ions of m/z 957, 930, 921, and 905) that complicate the structural identification. These fragment ions may arise from the adjacent precursor ions admitted together with the desired DAT ions for CID, due to that the precursor ion selection window (1 Da) cannot sufficiently isolate the isobaric ions (the mass selection window and injection time govern the total ions admitted to the trap for CID and >1 Da mass selection window is often required to maintain the sensitivity). Thus, fragment ions unrelated to the targeted molecule were formed simultaneously and complicating the structure analysis. However, the MS3 spectrum of m/z 943 (Figure 6b) contained only the fragment ions related to the DAT species, due to that the [M − H] ions still retain the complete structure but have been further segregated, and fragment ions unrelated to the structure have been filtrated by another stage (MS3) isolation. In this context, the MS4 spectrum of the ions of m/z 589 (989 → 943 → 589; Figure 6c), which were further “purified”, becomes even more specific, due to that only the fragment ions from DAT that consists of 23:0-FA substituent at C3 were subjected to further CID. Thus, the spectrum only contained ions of m/z 283, representing a 18:0-carboxylate anion, along with ions at m/z 323 and 305, representing the dehydrated trehalose anions. These results led to specifically define the 18:0/23:0-DAT structure. The spectrum (Figure 6b) also contained the m/z 269/367 and 255/381 ion pairs, representing the 17:0/24:0-, 16:0/25:0-FA carboxylate anion pairs, together with ions of m/z 687/561 and 673/575 ion pairs, arising from losses of 17:0/24:0-, 16:0/25:0-FA substituents, respectively. These results readily led to the assignment of 17:0/24:0- and 16:0/25:0-DAT isomeric structures.

4. Conclusions

Sequential precursor ion isolation applying multiple-stage mass spectrometry (LIT MSn) adds another dimension of separation in the analysis, providing a powerful tool for structural identification of various compounds. Thereby, many isomeric structures of the molecule can be unveiled in a very short period of time. By contrast, using the conventional chromatographic separation combined with a TSQ or QTOF instrument, the consecutive precursor ion isolation by MS is not achievable, and the species separation can only rely on column separation. Thus, complete separation of a complex lipid mixture with a wide range of molecular species and many isomeric structures is often difficult. Compound separation by chromatographic means also requires significantly more times [33], as compared to the LIT MSn approach, by which the separation-CID-detection process can be completed within a very short period of time.
LIT MSn permits ion isolation in the time sequence manner, and the separation of ions is flexible (i.e., the types of ions selected and the mass selection window of precursor ions). The selected ions become more specific, and the MSn spectrum provides more structurally specific information as the MSn stage advances, therefore, resulting in a confident and detailed structural identification. The structures of minute ion species that are often difficult to define by other analytical method can also be assigned (Table 1). However, the sensitivity declines as the higher order of MSn stage proceeds. Other drawback includes that a complete structural information is not necessary extractable by MSn. For example, the positions of the double bond and methyl side chain of the fatty acid substituents at C3 have not been defined in this study.
The LIT MSn approach as described here affords near complete structural characterization of a complex DAT lipid family, locating the fatty acyl groups on the trehalose backbone, and recognizing many isomeric structures. A LIT MSn approach combined with chemical reaction modification [9,34] for locating the functional groups including the methyl, hydroxyl, and the double bond on the fatty acid substituents are currently in progress in our laboratory.

Author Contributions

C.F. performs lipid separation; R.B.A. and G.E.P. grow cell and extract total lipids; L.L. and L.L. synthesize DAT standards. F.-F.H. performs mass spectrometry analysis and write the manuscript.

Funding

This research was funded by US Public Health Service Grants P41GM103422, P30DK020579, R01AI130454, R21AI128427, R21HL120760, and R21AI113074.

Acknowledgments

This research was supported by US Public Health Service Grants P41GM103422, P30DK020579, R01AI130454, R21AI128427, R21AI113074 and R21HL120760.

Conflicts of Interest

The authors declare no conflict of interest.

Abbreviations

LIT, linear ion trap; MSn, multiple stage mass spectrometry; Glc, glucose; DAT, diacyltrehalose; FA, fatty acid; FA-ketene, fatty acyl ketene; CID, collision induced dissociation; ESI, electrospray ionization; HRMS, high-resolution mass spectrometry.

References

  1. Johnson, J.V.; Yost, R.A.; Kelley, P.E.; Bradford, D.C. Tandem-in-space and tandem-in-time mass spectrometry: triple quadrupoles and quadrupole ion traps. Anal. Chem. 1990, 62, 2162–2172. [Google Scholar] [CrossRef]
  2. Markarov, A.; Cousijn, E.; Cantebury, J.; Denisov, E.; Thoeing, C.; Lange, O.; Kreutzman, A.; Ayzikov, K.; Damoc, E.; Tabiwang, A.; et al. Extension of Orbitrap capabilities to enable new applications. In Proceedings of the 65th Conference on Mass Spectrometry and Allied Topics, Indianapolis, IN, USA, 4 June 2017. [Google Scholar]
  3. Vogel, C.; Marcotte, E.M. Insights into the regulation of protein abundance from proteomic and transcriptomic analyses. Nat. Rev. Genet. 2012, 13, 227–232. [Google Scholar] [CrossRef] [PubMed] [Green Version]
  4. Perry, R.H.; Cooks, R.G.; Noll, R.J. Orbitrap mass spectrometry: Instrumentation, ion motion and applications. Mass Spectrom. Rev. 2008, 27, 661–699. [Google Scholar] [CrossRef] [PubMed] [Green Version]
  5. Senyuva, H.Z.; Gökmen, V.; Sarikaya, E.A. Future perspectives in Orbitrap™-high-resolution mass spectrometry in food analysis: A review. Food Addit. Contam. A 2015, 32, 1568–1606. [Google Scholar] [CrossRef] [PubMed]
  6. Jabbour, R.E.; Snyder, A.P. Chap. 14—Mass spectrometry-based proteomics techniques for biological identification. In Biological Identification; Schaudies, R.P., Ed.; Woodhead Publishing: Sawston, UK, 2014; pp. 370–430. [Google Scholar]
  7. Eliuk, S.; Makarov, A. Evolution of Orbitrap Mass Spectrometry Instrumentation. Ann. Rev. Anal. Chem. 2015, 8, 61–80. [Google Scholar] [CrossRef] [PubMed]
  8. Rhoades, E.R.; Streeter, C.; Turk, J.; Hsu, F.-F. Characterization of Sulfolipids of Mycobacterium tuberculosis H37Rv by Multiple-Stage Linear Ion-Trap High-Resolution Mass Spectrometry with Electrospray Ionization Reveals That the Family of Sulfolipid II Predominates. Biochemistry 2011, 50, 9135–9147. [Google Scholar] [CrossRef] [PubMed]
  9. Hsu, F.-F. Characterization of Hydroxyphthioceranoic and Phthioceranoic Acids by Charge-Switch Derivatization and CID Tandem Mass Spectrometry. J. Am. Soc. Mass Spectrom. 2016, 27, 622–632. [Google Scholar] [CrossRef] [Green Version]
  10. Hsu, F.F.; Turk, J.; Owens, R.M.; Rhoades, E.R.; Russell, D.G. Structural Characterization of Phosphatidyl-myo-Inositol Mannosides from Mycobacterium bovis Bacillus Calmette Guerin by Multiple-Stage Quadrupole Ion-Trap Mass Spectrometry with Electrospray Ionization. II. Monoacyl- and Diacyl-PIMs. J. Am. Soc. Mass Spectrom. 2007, 18, 479–492. [Google Scholar] [CrossRef]
  11. Hsu, F.F.; Turk, J.; Owens, R.M.; Rhoades, E.R.; Russell, D.G. Structural characterization of phosphatidyl-myo-inositol mannosides from Mycobacterium bovis Bacillus Calmette Guerin by multiple-stage quadrupole ion-trap mass spectrometry with electrospray ionization. I. PIMs and lyso-PIMs. J. Am. Soc. Mass Spectrom. 2007, 18, 466–478. [Google Scholar] [CrossRef]
  12. Flentie, K.N.; Stallings, C.L.; Turk, J.; Minnaard, A.J.; Hsu, F.-F. Characterization of phthiocerol and phthiodiolone dimycocerosate esters of M. tuberculosis by multiple-stage linear ion-trap MS. J. Lipid Res. 2016, 57, 142–155. [Google Scholar] [CrossRef]
  13. Hoppe, H.C.; de Wet, B.J.; Cywes, C.; Daffe, M.; Ehlers, M.R. Identification of phosphatidylinositol mannoside as a mycobacterial adhesin mediating both direct and opsonic binding to nonphagocytic mammalian cells. Infect. Immun. 1997, 65, 3896–3905. [Google Scholar] [PubMed]
  14. Howard, N.C.; Marin, N.D.; Ahmed, M.; Rosa, B.A.; Martin, J.; Bambouskova, M.; Sergushichev, A.; Loginicheva, E.; Kurepina, N.; Rangel-Moreno, J.; et al. Mycobacterium tuberculosis carrying a rifampicin drug resistance mutation reprograms macrophage metabolism through cell wall lipid changes. Nat. Microbiol. 2018, 3, 1099–1108. [Google Scholar] [CrossRef] [PubMed]
  15. DaffÉ, M.; Lacave, C.; LanÉElle, M.-A.; Gillois, M.; LanÉElle, G. Polyphthienoyl trehalose, glycolipids specific for virulent strains of the tubercle bacillus. Eur. J. Biochem. 1988, 172, 579–584. [Google Scholar] [CrossRef] [PubMed] [Green Version]
  16. Minnikin, D.E.; Dobson, G.; Sesardic, D.; Ridell, M. Mycolipenates and Mycolipanolates of Trehalose from Mycobacterium tuberculosis. J. Gen. Microbiol. 1985, 131, 1369–1374. [Google Scholar] [CrossRef] [PubMed]
  17. Munoz, M.; Laneelle, M.A.; Luquin, M.; Torrelles, J.; Julian, E.; Ausina, V.; Daffe, M. Occurrence of an antigenic triacyl trehalose in clinical isolates and reference strains of Mycobacterium tuberculosis. FEMS Microbiol. Lett. 1997, 157, 251–259. [Google Scholar] [CrossRef]
  18. Lemassu, A.; Laneelle, M.A.; Daffe, M. Revised structure of a trehalose-containing immunoreactive glycolipid of Mycobacterium tuberculosis. FEMS Microbiol. Lett. 1991, 62, 171–175. [Google Scholar] [CrossRef] [PubMed]
  19. Ariza, M.A.; Martín-Luengo, F.; Valero-Guillén, P.L. A family of diacyltrehaloses isolated from Mycobacterium fortuitum. Microbiology 1994, 140, 1989–1994. [Google Scholar] [CrossRef] [PubMed] [Green Version]
  20. Ariza, M.A.; Valero-Guillen, P.L. Delineation of molecular species of a family of diacyltrehaloses from Mycobacterium fortuitum by mass spectrometry. FEMS Microbiol. Lett. 1994, 119, 279–282. [Google Scholar] [CrossRef]
  21. Besra, G.S.; Bolton, R.C.; McNeil, M.R.; Ridell, M.; Simpson, K.E.; Glushka, J.; Van Halbeek, H.; Brennan, P.J.; Minnikin, D.E. Structural elucidation of a novel family of acyltrehaloses from Mycobacterium tuberculosis. Biochemistry 1992, 31, 9832–9837. [Google Scholar] [CrossRef]
  22. Gautier, N.; Marín, L.M.L.; Lanéelle, M.A.; Daffé, M. Structure of mycoside F, a family of trehalose-containing glycolipids of Mycobacterium fortuitum. FEMS Microbiol. Lett. 1992, 77, 81–87. [Google Scholar]
  23. Lee, K.-S.; Dubey, V.S.; Kolattukudy, P.E.; Song, C.-H.; Shin, A.R.; Jung, S.-B.; Yang, C.-S.; Kim, S.-Y.; Jo, E.-K.; Park, J.-K.; et al. Diacyltrehalose of Mycobacterium tuberculosis inhibits lipopolysaccharide- and mycobacteria-induced proinflammatory cytokine production in human monocytic cells. FEMS Microbiol. Lett. 2007, 267, 121–128. [Google Scholar] [CrossRef] [PubMed] [Green Version]
  24. Saavedra, R.; Segura, E.; Leyva, R.; Esparza, L.A.; López-Marín, L.M. Mycobacterial Di-O-Acyl-Trehalose Inhibits Mitogen- and Antigen-Induced Proliferation of Murine T Cells In Vitro. Clin. Diagn. Lab. Immun. 2001, 8, 1081–1088. [Google Scholar] [CrossRef] [Green Version]
  25. Bailo, R.; Bhatt, A.; Ainsa, J.A. Lipid transport in Mycobacterium tuberculosis and its implications in virulence and drug development. Biochem. Pharmacol. 2015, 96, 159–167. [Google Scholar] [CrossRef] [PubMed]
  26. Papa, F.; Cruaud, P.; David, H.L. Antigenicity and specificity of selected glycolipid fractions from Mycobacterium tuberculosis. Res. Microbiol. 1989, 140, 569–578. [Google Scholar] [CrossRef]
  27. Hamid, M.E.; Fraser, J.L.; Wallace, P.A.; Besra, G.; Goodfellow, M.; Minnikin, D.E. Antigenic glycolipids of Mycobacterium fortuitum based on trehalose acylated with 2-methyloctadec-2-enoic acid. Lett. Appl. Microbiol. Rev. 1993, 16, 132–135. [Google Scholar] [CrossRef]
  28. Ridell, M.; Wallerstr6m, G.; Minnikin, D.E.; Bolton, R.C.; Magnusson, M. A comparative serological study of antigenic glycolipids from Mycobacteriurn tuberculosis. Tubercle Lung Dis. 1992, 73, 71–75. [Google Scholar] [CrossRef]
  29. Tórtola, M.T.; Lanéelle, M.A.; Martín-Casabona, N. Comparison of two 2,3-diacyl trehalose antigens from Mycobacterium tuberculosis and Mycobacterium fortuitum for serology in tuberculosis patients. Clin. Diagn. Lab. Immun. 1996, 3, 563–566. [Google Scholar]
  30. Prabhakar, S.; Vivès, T.; Ferrières, V.; Benvegnu, T.; Legentil, L.; Lemiègre, L. A fully enzymatic esterification/transesterification sequence for the preparation of symmetrical and unsymmetrical trehalose diacyl conjugates. Green Chem. 2017, 19, 987–995. [Google Scholar] [CrossRef] [Green Version]
  31. Botté, C.Y.; Deligny, M.; Roccia, A.; Bonneau, A.-L.; Saïdani, N.; Hardré, H.; Aci, S.; Yamaryo-Botté, Y.; Jouhet, J.; Dubots, E.; et al. Chemical inhibitors of monogalactosyldiacylglycerol synthases in Arabidopsis thaliana. Nat. Chem. Biol. 2011, 7, 834–842. [Google Scholar] [CrossRef]
  32. Olsen, J.V.; Macek, B.; Lange, O.; Makarov, A.; Horning, S.; Mann, M. Higher-energy C-trap dissociation for peptide modification analysis. Nat. Meth. 2007, 4, 709–712. [Google Scholar] [CrossRef]
  33. Hsu, F.F. Mass spectrometry-based shotgun lipidomics—A critical review from the technical point of view. Anal. Bioanal. Chem. 2018, 410, 6387–6409. [Google Scholar] [CrossRef] [PubMed]
  34. Frankfater, C.; Jiang, X.; Hsu, F.F. Characterization of Long-Chain Fatty Acid as N-(4-Aminomethylphenyl) Pyridinium Derivative by MALDI LIFT-TOF/TOF Mass Spectrometry. J. Am. Soc. Mass Spectrom. 2018, 29, 1688–1699. [Google Scholar] [CrossRef] [PubMed]
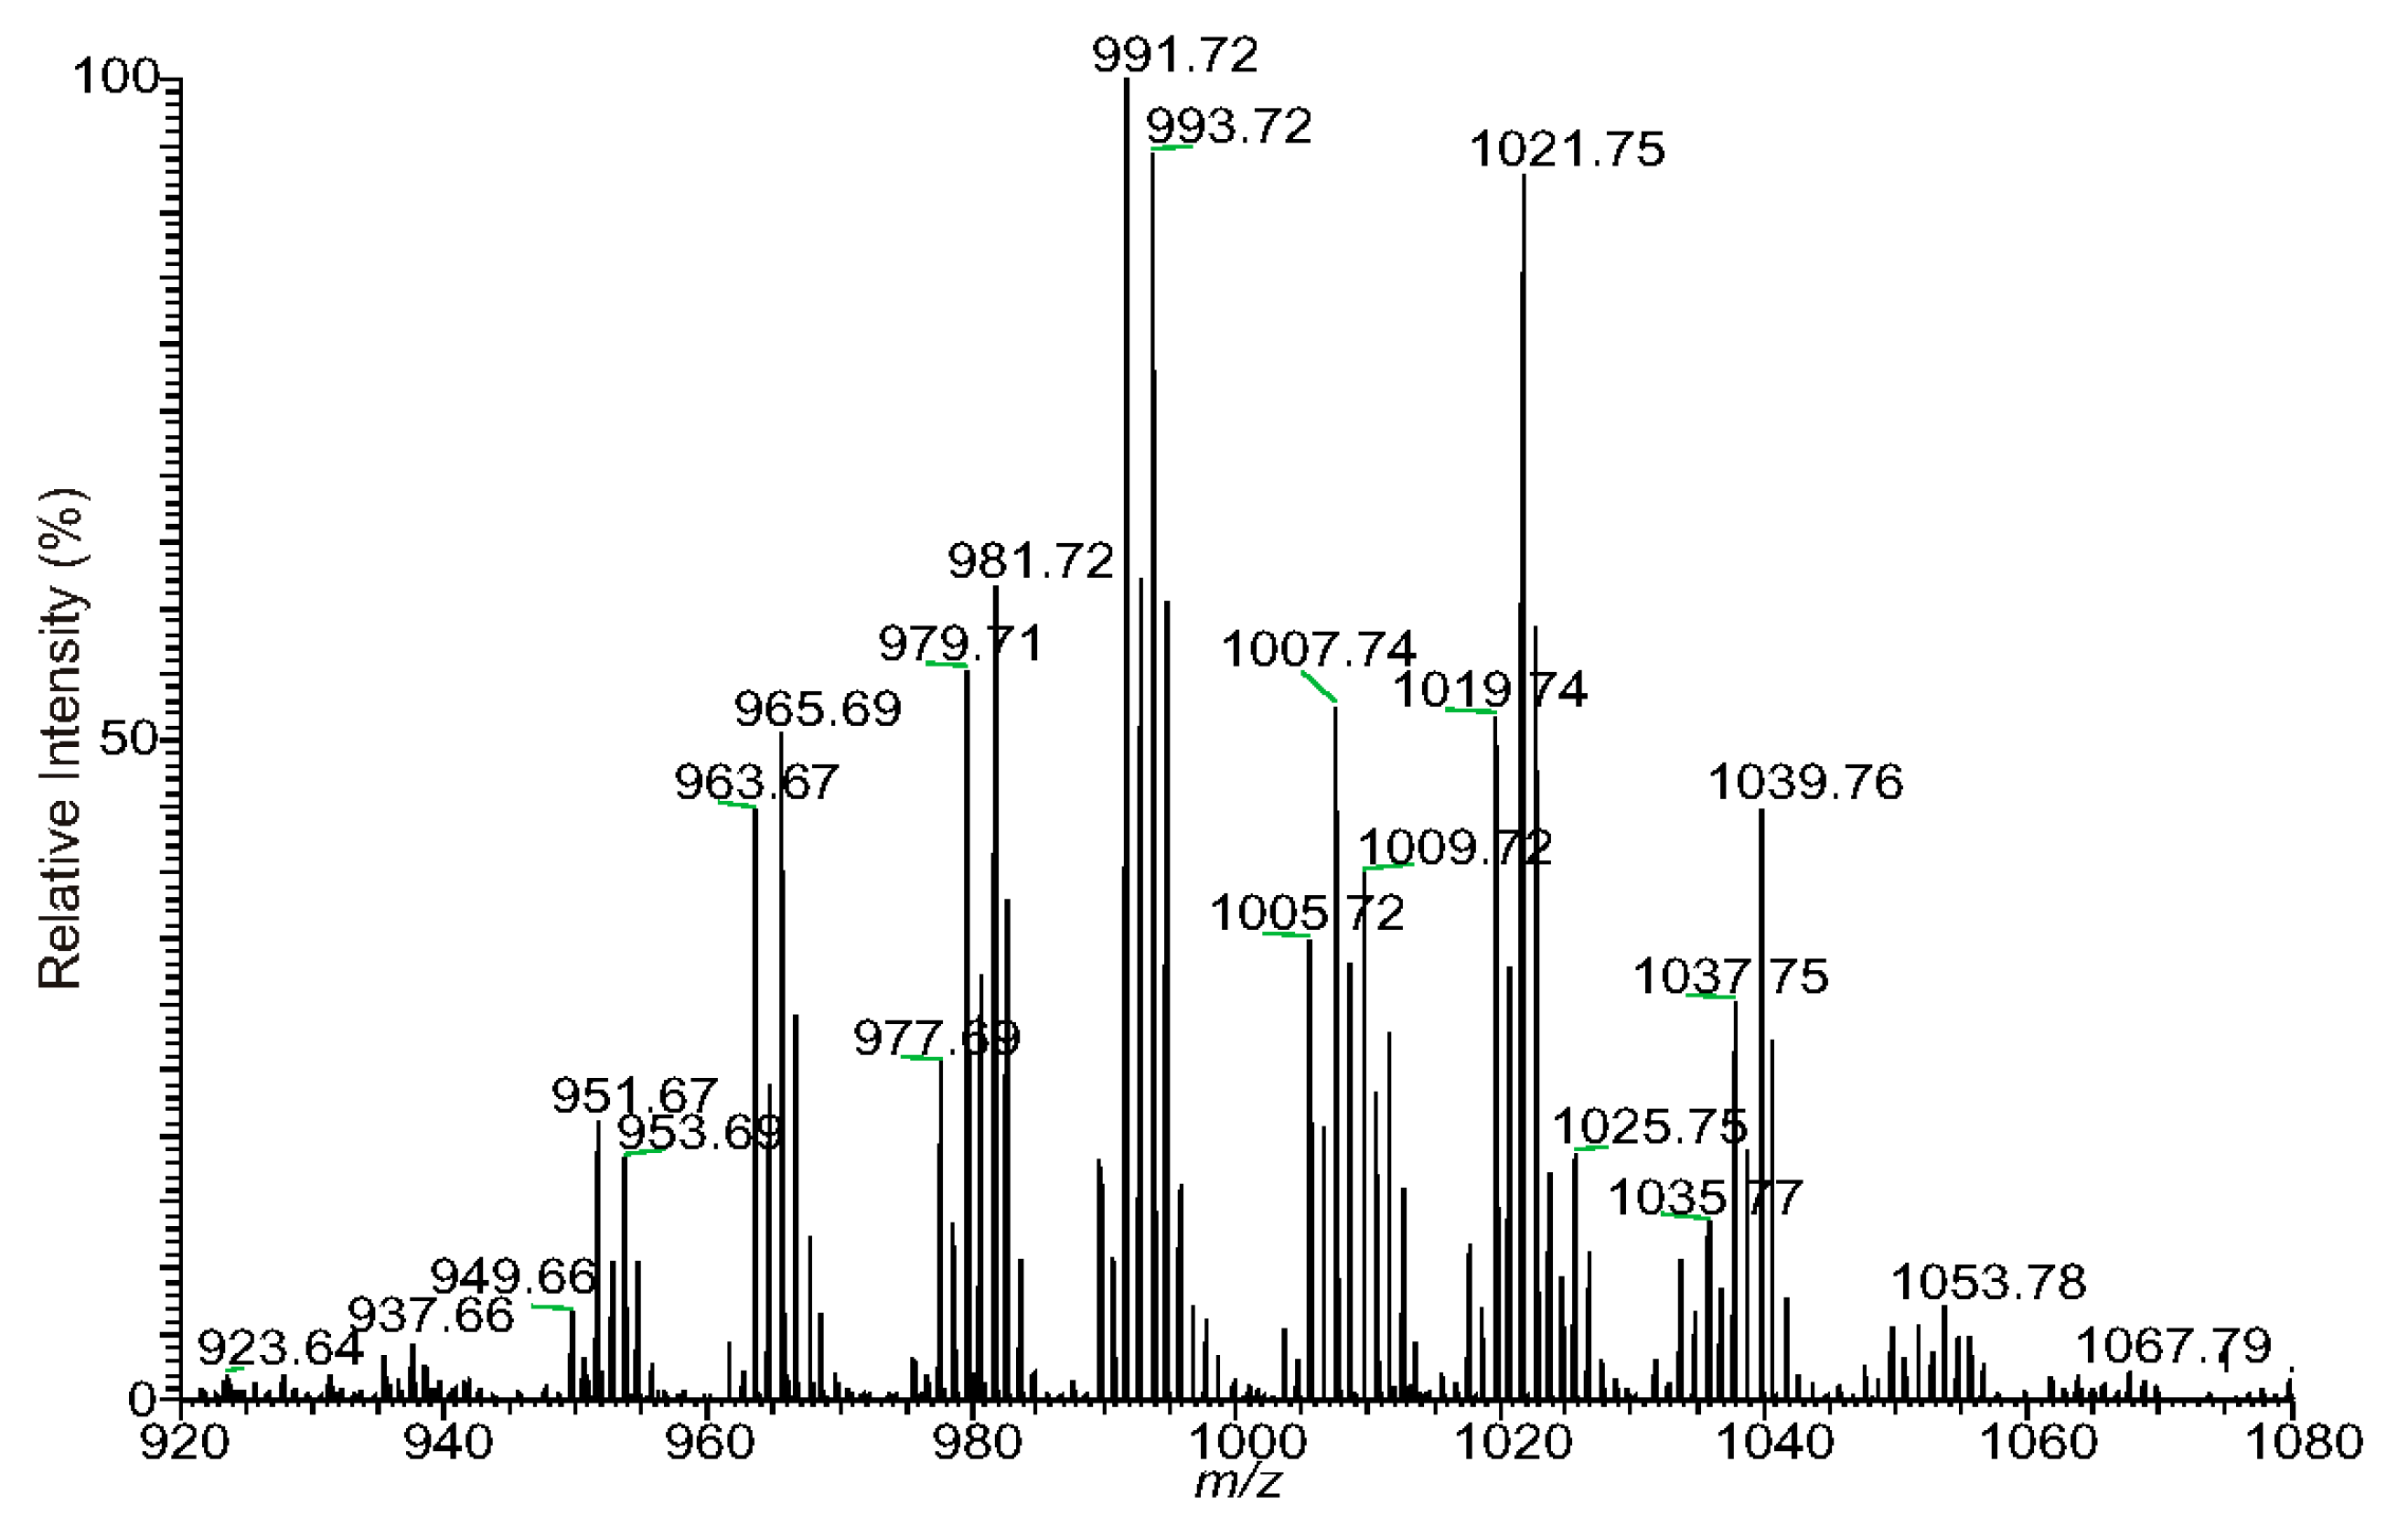
Figure 1. The positive-ion ESI mass spectrum of the [M + Na]+ ions of the DAT species isolated from cell envelope of M. tuberculosis.
Separations 06 00004 g001
Figure 2. The LIT MS2 spectrum of the [M + Na]+ ion of 18:0/27:1-DAT at m/z 1021 (a), its MS3 spectra of the ions of m/z 859 (1021 → 859) (b), and of m/z 737 (1021 → 737) (c); and its MS4 spectra of the ions of m/z 575 (1021 → 859 → 575) (d), and of m/z 451 (1021 → 859 → 451) (e).
Separations 06 00004 g002
Scheme 1. The structure of [M + Na]+ ion of 18:0/27:1-DAT at m/z 1021 and proposed LIT MSn fragmentation processes*. * All the ions represent the sodiated species. To simplify, the drawing of “Na+” is omitted from the scheme.
Separations 06 00004 sch001
Figure 3. The MS2 spectrum of the [M + Na]+ ions of m/z 979 (a), its MS3 spectra of the ions of m/z 817 (979 → 817)) (b), of m/z 697 (979 → 697) (c), its MS4 spectrum of the ions of m/z 535 (979 → 817 → 535) (d); and the MS3 spectrum of the ions of m/z 695 (979 → 695) (e).
Separations 06 00004 g003
Figure 4. The negative-ion MS2 spectrum of the [M + HCO2] ions of 18:0/27:1-DAT at m/z 1043 (a), its MS3 spectrum of the ions of m/z 997 (1043 → 997) (b).
Separations 06 00004 g004
Scheme 2. The proposed LIT MSn fragmentation processes of the [M + HCO2] ions of 18:0/27:1-DAT at m/z 1043.
Separations 06 00004 sch002
Figure 5. The negative-ion MS2 spectrum of the [M + HCO2] ions of m/z 1001 (a), its MS3 spectrum of the ions of m/z 955 (1001 → 955) (b), and the MS4 spectrum of the ions of m/z 671 (1001 → 955 → 671) (c).
Separations 06 00004 g005
Figure 6. The negative-ion MS2 spectrum of the [M + HCO2] ions of DAT at m/z 989 (a), its MS3 spectrum of the ions of m/z 943 (989 → 943) (b), MS4 spectrum of the ions of m/z 589 (989 → 943 → 589) (c). The ions of m/z 989 are minor species and its MS2 spectrum contains several ions (shown in red in (a)) unrelated to the structure, but have been filtrated from higher stage MSn, as shown in (b) (MS3) and (c) (MS4).
Separations 06 00004 g006
Table 1. The high resolution mass measurements of the [M + Na]+ ions of DATs isolated from M. tuberculosis and the assigned structues (* structure not defined).
Measured m/zTheo. Mass m/zDeviation mmuRel. Intensity %Ele. CompositionMajor structuresMinor structures
935.6436935.64300.553.42C51H92O13Na14:1/25:112:1/27:1
937.6594937.65870.734.34C51H94O13Na14:0/25:112:0/27:1; 16:1/23:0; 15:1/24:0; 13:0/26:1
939.6747939.67430.371.48C51H96O13Na*
949.6585949.6587−0.196.58C52H94O13Na16:1/24:1
951.6742951.6743−0.1520.8C52H96O13Na16:1/24:016:0/24:1; 15:0/25:1; 17:1/23:0; 14:0/26:1; 13:0/27:1
953.6898953.6900−0.1218.49C52H98O13Na16:0/24:0
961.6587961.65870.014.31C53H94O13Na*
963.6743963.6743−0.0544.16C53H96O13Na16:1/25:1; 14:1/27:1
965.6898965.6900−0.1250.07C53H98O13Na16:0/25:114:0/27:1; 18:0/23:1
967.7054967.7056−0.2212.26C53H100O13Na18:0/23:0; 17:0/24:016:0/25:0
975.6740975.6743−0.33.03C54H96O13Na*
977.6899977.6900−0.0625.16C54H98O13Na16:1/26:1
979.7056979.7056−0.0654.48C54H100O13Na18:0/24:1; 18:1/24:016:0/26:1; 17:0/25:1; 16:1/26:0; 15:0/27:1
981.7211981.7213−0.1562.62C54H102O13Na18:0/24:017:0/25:0; 16:0/26:0
989.6898989.6900−0.1718.03C55H98O13Na16:1/27:2
991.7054991.7056−0.2100C55H100O13Na16:1/27:118:1/25:1; 16:0/27:2; 17:0/26:2
993.7210993.7213−0.2995.91C55H102O13Na16:0/27:118:0/25:1; 17:0/26:1
1005.72111005.7213−0.234.31C56H102O13Na16:1/28:1; 17:1/27:117:0/27:2; 18:1/26:1; 18:0/26:2
1007.73661007.7369−0.3151.54C56H104O13Na17:0/27:116:0/28:1; 18:0/26:1; 19:0/25:1; 16:1/28:0
1009.75181009.7526−0.757.65C56H106O13Na18:0/26:020:0/24:0
1017.72091017.7213−0.3811.79C57H102O13Na18:1/27:2
1019.73671019.7369−0.2552.39C57H104O13Na18:1/27:118:0/27:2; 17:1/28:1
1021.75221021.7526−0.3792.1C57H106O13Na18:0/27:117:0/28:1
1033.75211033.7526−0.4710.49C58H106O13Na18:1/28:119:0/27:2; 19:1/27:1; 18:0/28:2; 19:0/27:2
1035.76781035.7682−0.4513.33C58H108O13Na19:0/27:1; 18:0/28:118:1/28:0; 17:0/29:1
1047.76771047.7682−0.52.56C59H108O13Na18:0/28:2
1049.78351049.7839−0.315.47C59H110O13Na19:0/28:120:0/27:1; 18:0/29:1; 17:0/30:1
1061.78371061.7839−0.191.63C60H110O13Na18:1/30:1
1063.79911063.7995−0.381.83C60H112O13Na18:0/30:1

