1. Introduction
There is no doubt that many separation techniques have advanced significantly over the decades, and many have reached very high, reliable as well as reproducible standards. This is particularly true for small molecules and mixtures of limited chemical complexity, typically encountered in classical pharmaceutical industry. However, when small biomolecules are studied or analyzed, which are the topic of interest in this review, although essentially belonging to the class of small organic molecules as well, purification techniques often represent a key obstacle in advancing basic science research in many related fields, such as glycomics, lipidomics, analysis of natural compounds, etc. This is commonly not due to theoretical limitations of separation techniques themselves, but primarily due to the requirement for purified biomolecules/standards and lack thereof. The lack of accompanying, yet very practical commercial accessories, such as mass spectroscopy sample preparation kits, also represents a strong practical limitation for advancement of both basic and applied research.
Mass spectroscopy (MS) represents a leading technique for the analysis of all classes of small biomolecules, due to its versatility, high sensitivity, speed, tandem MS capability, as well as the ability to deal with complex mixtures, particularly when coupled with liquid chromatography (LC) separation [
1,
2,
3,
4,
5,
6]. Mass spectrometers can also isolate single biomolecules of interest from complex mixtures and perform structural analyses on them. In the majority of cases, MS is coupled to LC in order to significantly enhance analysis of complex mixtures [
7,
8,
9]. Therefore successful application of modern separation techniques in LC-MS analyses of biomolecules is unquestionable. However, this technology is still in development, especially for proteomic applications, where LC techniques available are not appropriate to address all challenges—primarily the coverage of protein structure for analysis of posttranslational modifications (PTMs) and the coverage of the proteome in terms of the dynamic range of protein amounts present in cellular samples. For non-proteomic applications, LC-MS techniques available are in much better shape, both theoretically and practically. Current limitations are bioinformatic support and the ability to perform high quality tandem MS experiments during LC-MS runs.
However, classical modalities of the use of separation techniques in biomolecular research are often lacking, primarily with respect to the purification and commercial availability of pure standards. Although many complex mixtures of biomolecules can be, and often are, baseline separated in LC-MS analyses, these analytical nanoLC methods are of very limited use in their current form for purification of biomolecules. Pure standards for many research applications—MS in particular—in the fields of glycomics, lipidomics, analysis of natural compounds, etc. are not commercially available for the most part. Analogously, separation techniques commonly used in biomolecular research fields are mostly limited to simplification of MS analyses of complex biomolecular mixtures, and are commonly neither used nor studied for purification of individual small biomolecules. Therefore, the applicability of many separation techniques for state-of-the-art basic research in biomedical sciences is still very limited, and could be even called stagnant over the last decade, primarily with respect to functional studies/analyses.
While mass spectroscopy had allowed significant development of science fields related to glycomics, lipidomics, natural compounds, etc., most often with significant help of analytical LC tools, it also introduced a series of new challenges for separation sciences, as well as the related industry: (a) MS requires pure biomolecules (standards) for MS and MS/MS method development, as well as the development of MS methods for quantitative analyses, (b) MS does not require pure compounds for analysis, but samples (either single compounds or mixtures) often need to be desalted, and incompatible buffers/detergents need to be removed or exchanged prior to MS analysis, (c) separation/purification methods available must be applicable for pmol or subpmol sample amounts, and finally (d) separation/purification methods available must be applicable for microliter sample volumes. While in this decade many more commercially available kits became available in the field of biomolecular analysis, particularly for glycomic analyses, these are often quite expensive and much better suited for large
omic application studies, rather than for small-scale basic research studies. Classic examples for such applications are glycan/lectin/peptide arrays [
10,
11] and related de-
N-glycosylation and oligosaccharide labeling kits optimized for high-throughput applications, such as highly efficient RapiFluor-MS kit [
12]. Thus, many modalities of separation/purification techniques are still not commonly available to biomolecular scientists, particularly those outside of state-of-the-art research laboratories, which often do have required separation/purification tools/methods/materials/instrumentation, as well as respective trained personnel available for their research, due to years of dedication to these tasks [
13,
14,
15,
16,
17,
18,
19,
20,
21,
22].
Finally, the issue(s) of protein purification will be addressed, with emphasis on modern biomedical research. Protein purification methods were very efficient in the second half of 20th century, albeit developed often empirically, as well as mostly focusing on separation from major impurities rather than absolute purification (which often was defined in relation to the instrumental technique/assay used, for many practical reasons). Such purified proteins were predominantly of sufficient quality for analytical techniques available in the 20th century. However, with (significant) advancement in biotechnological analysis of proteins at the turn of the century, the requirement for higher protein purification standards has also increased significantly. Nevertheless, very little progress has been made in protein purification methods over the last couple of decades, particularly when purification of native proteins from human cells is considered. Purification of genetically engineered or overexpressed proteins has progressed, as well as reached high standards, and will not be discussed here. However, mass spectroscopy (and other techniques/tools available) allows us today to look at proteins at a higher (more detailed) level, compared to what we were able to do in the previous century. Best known examples are the studies of posttranslational modifications (PTMs) of proteins [
5,
6] and glycoproteins [
23]. Another exciting emerging field is the study of noncovalent protein complexes [
24,
25], including protein-protein (interactome) analyses [
26,
27]. Where the analysis of PTMs is concerned, heterologous (over)expression of human proteins in simpler or primitive cells is often either not adequate or not even possible. Another practical limitation for use of genetically engineered proteins for biomedical research today is that with the variety of high-tech protein research tools available, the time and personnel available for molecular biology tasks are much more limited than they used to be (especially in a modern protein biomedical research laboratory). This is particularly an issue considering that proteins expressed in bacteria and viruses are often not adequate for most advanced biomedical research studies.
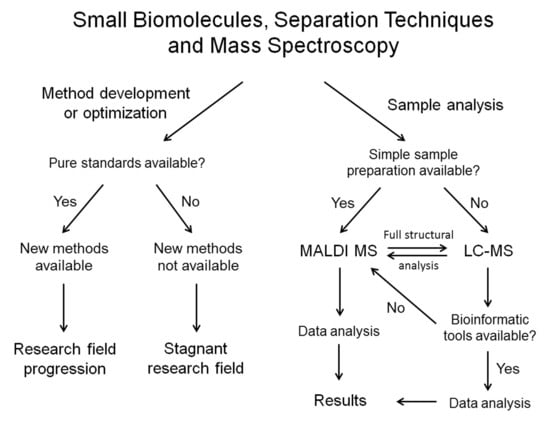
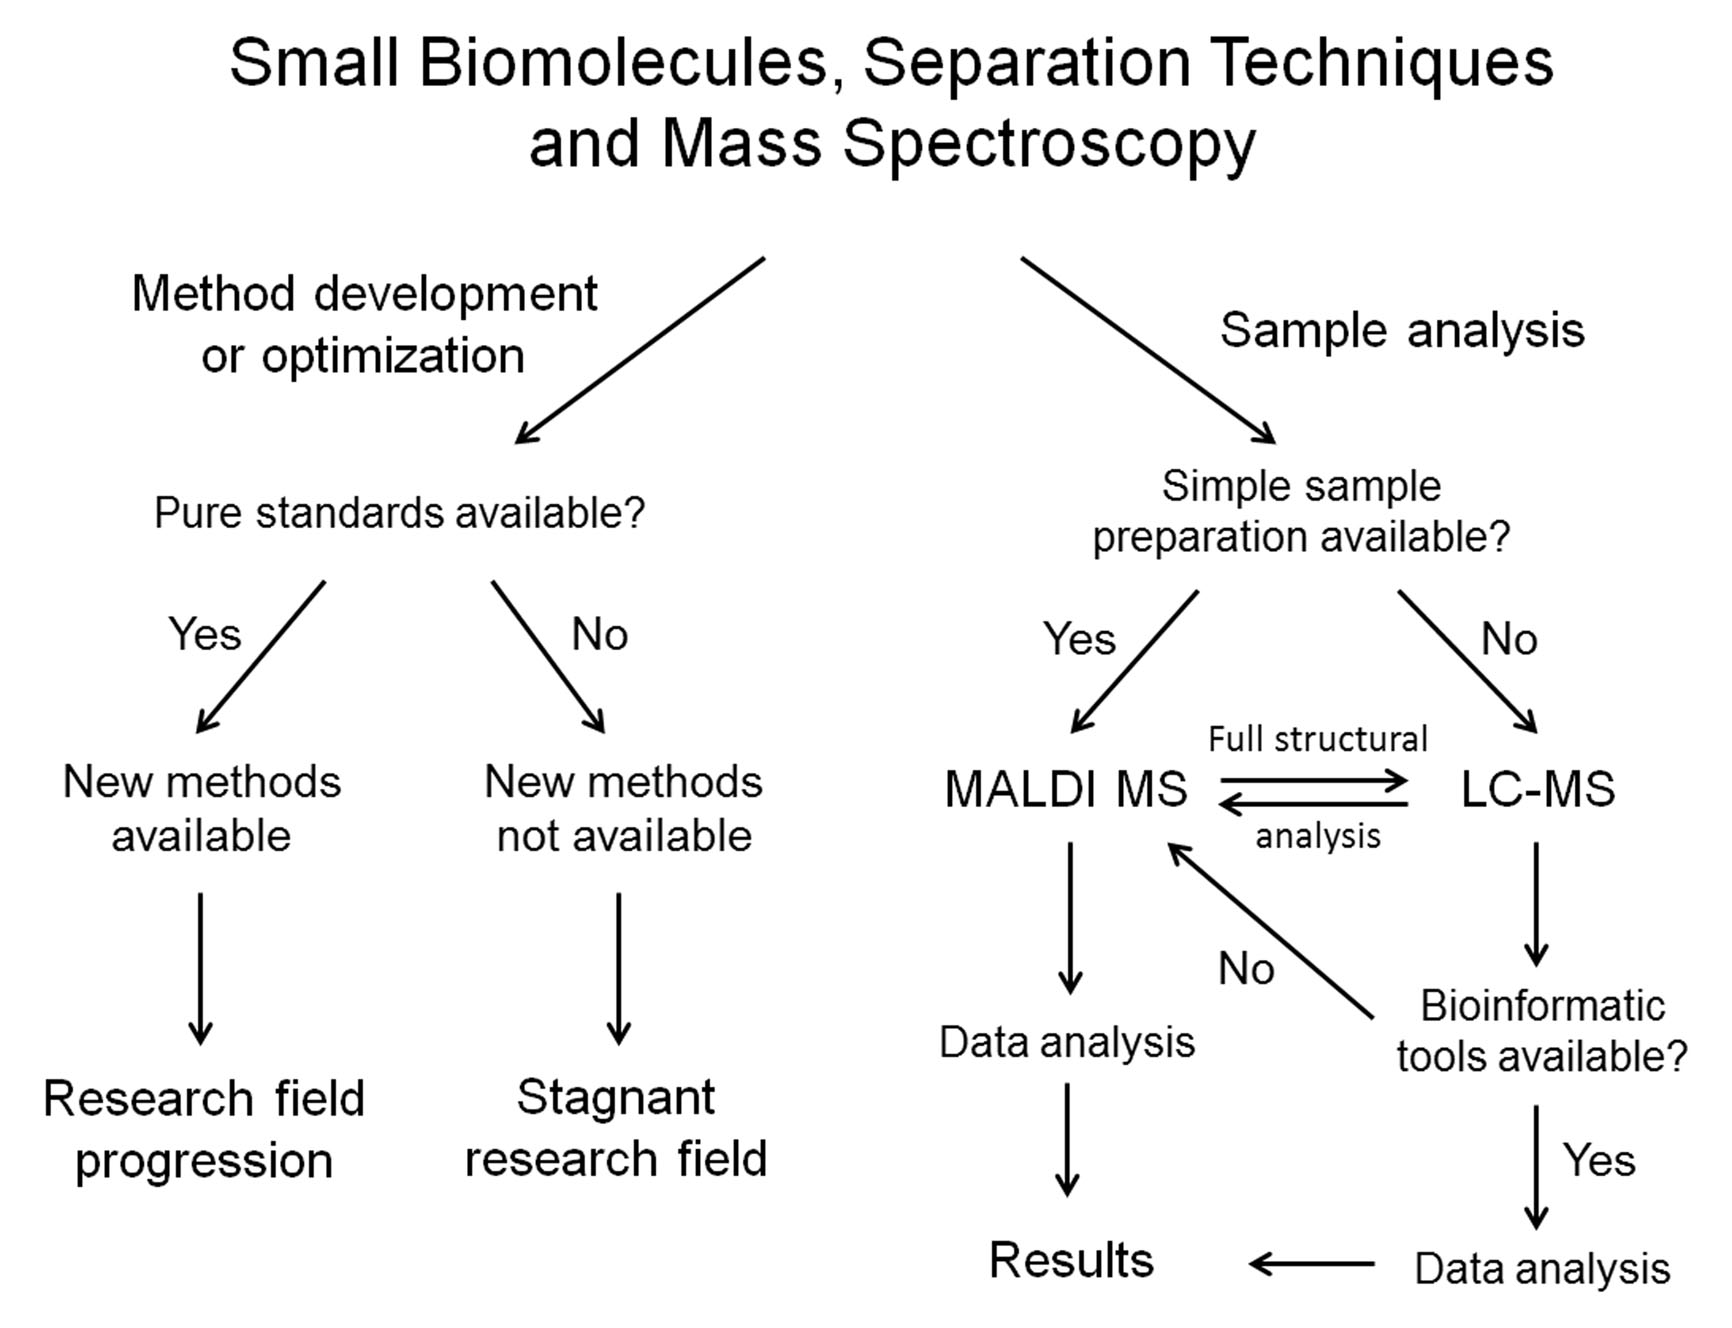
In this review, these topics will be discussed on specific examples. In most cases, the examples will show successful application of modern separation methods/techniques for solving bioanalytical challenges related to analysis of small biomolecules, as well as proteins. For each example, influence of availability of (better) purification tools/methods, as well as availability of pure compounds on advancing the related field of interest (glycomics/lipidomics/protein research) will also be shown. I will try to explain and emphasize the requirement of mass spectroscopy research for better purification methods/tools available, instead of heavily relying on the use of mass spectroscopy to solve limitations of separation techniques available today. Finally examples of available industrial support (or lack thereof) in each example discussed will be given. Overall the audience should get a clear picture of power of modern separation techniques for analyzing complex biomolecular mixtures, as well as of the need of biomolecular research field for significant advances in the purification aspect of separation techniques in the near future. The complex issue of bioinformatics will be discussed on given examples as well. Although modern separations and mass spectroscopy research are inseparable from the development of related bioinformatic tools, these are often not commercially available today and need to be developed in-house. However, bioinformatics is crucial for almost all LC-MS analyses today, and especially for making LC-MS available to a broader scientific community. Therefore, some successful examples of how this issue should be approached for topics of interest will be given here.
2. Challenges in Separation/Purification of Human Proteins in Their Native Form
Proteins are the most difficult class of biomolecules to purify in their native form. Over the course of the last ~50 years, three distinct phases of protein purification methods can be broadly recognized. Prior to the development of genetic engineering tools, alongside with the accompanying molecular biology techniques, sequential use of carefully selected chromatography columns was the method of choice. A typical result of sequential chromatography techniques can be seen in
Figure 1a [
28]. Here, human HeLa cells were the starting material, and three chromatographic steps were used in order to purify a DNA repair protein Ku, which is a heterodimer comprised of Ku80 and Ku70 subunits. The first (general) separation step was based on the protein size, using gel filtration chromatography, and the following two chromatographic steps were based on the Ku’s affinity for DNA, using ssDNA-agarose and heparin-agarose pseudoaffinity chromatographies [
28]. Although this and similar results were often considered to be of high purity, minor impurities were often barely visible with Coomassie staining, as well as the usual “smir” due to the trace amounts of various proteins present in chromatographic fractions (see
Figure 1a). For most functional analyses prior to the biotech era, this was an acceptable result due to the high specificity of proteins (particularly enzymes) towards their ligands or substrates. However, this level of protein purity is not sufficient for most biotechnological analyses performed today. Thus, affinity purification method is desired whenever possible. In
Figure 1b, an example of an affinity purified protein, the DNA-dependent protein kinase catalytic subunit (DNA-PKcs), is shown [
28]. Here, a synthetic peptide KGSGEEGGDVDDLLDMI was coupled to a Hi-Trap NHS-activated HP column [
29] and used for affinity purification of DNA-PKcs from a HeLa cell nuclear protein extract. Although absolute purity of this protein sample was not determined, the Coomassie-stained SDS PAGE gel appears much cleaner, even with respect to the usual “smir”, which is not clearly visible on this gel. Indeed, the functional data for DNA-PKcs using surface plasmon resonance (SPR) were of much higher quality compared to those obtained when sequential chromatography method was used for DNA-PKcs purification (data not shown). We will discuss this issue later in more detail (see
Figure 2 and
Figure 3 and the related text).
With the development of the genetic engineering methods and tools, as well as accompanying molecular biology techniques, the focus of many bioresearch groups has shifted towards the purification of overexpressed recombinant proteins from simple cells, often prokaryotic ones (such as bacterium E. coli). Due to the overexpression methods used, the starting amount of a protein to be purified was much higher than in native cells, and due to the simplicity and speed of working with bacterial cells, large amounts of highly pure proteins could be obtained quickly in a cost-effective manner. This subsequently enabled a mini-boom in the field of protein crystallography, and many protein structures were successfully solved (with high resolution) over the past three decades. Genetic engineering tools also allowed quick production of protein mutants, allowing many biochemical and biological structure–function relationship studies, at least for small proteins with limited or no post-translational modifications. However, as the field of biomedical sciences progressed over the decades, on the heels of the progress made in the field of molecular biology and genetic engineering/cloning techniques, the drawbacks of this approach started to become more apparent. Aside from protein solubility/precipitation issues, large proteins were less susceptible to genetic engineering/cloning techniques, and posttranslational modifications could not be studied efficiently in yeast or bacteria. Today, even much better model organisms, such as A. thaliana or even mice/rats are not considered as a method of choice for cutting-edge biomedical research. Thus, the importance of purification of native proteins from human cells (typically limited to various cell lines obtained from cell culture laboratories) is becoming the “holy grail” of biomedical research.
Today, biomedical scientists wish to study glycoproteins, membrane proteins, protein interaction networks, protein kinases, etc., in their native environment, e.g., in human cells or from pathological samples. Pathology has greatly advanced at the turn of the century, and today is essential for molecular medicine, translational research, as well as other medicine-related topics. One of the very popular pathology tools today is laser-capture microdissection (LCM) [
30] of cells from pathological tissue samples, because it allows isolation of diseased and control (healthy) cells from tissue samples obtained from patients. However, these samples typically contain only couple of thousands cells or less. Therefore, both for the established biomedical research field, as well as the emerging translational research field, the first question is not just how do we efficiently separate/isolate/purify glycoproteins, membrane proteins, large proteins, extracellular matrix proteins, mutated proteins, etc. but how do we do that from 5000 cells, 500 cells, 50 cells, or even 5 cells (with single-cell analyses becoming more and more popular/in demand today). Thus, advanced protein purification topics, such as miniaturization, sensitivity, enhanced separation/purification, etc. represent state-of-the-art purification research, as these tools are today rarely available to cutting-edge biomedical protein scientists. However, basic research on protein purification topics of interest, such as purification of membrane proteins with intact native membrane environment using nanotechnology approaches, is ongoing [
31].
With respect to these research topics, a third phase/era of protein purification methods has slowly progressed in this century as necessary tools became available. The most popular method of protein purification today is affinity purification [
32,
33], using antibodies [
34], synthetic peptides [
29] or other affinity reagents [
35]. Immunoprecipitation is highly popular today, due to the significantly increased industrial supply of antibodies, particularly against human and mouse proteins. Another popular tool is LCM in combination with difference gel electrophoresis (DIGE), for separating proteins from LCM-treated tissue samples [
36]. However, these tools are technologically very limited and yield poor or moderate results at best [
36], particularly in the context of modern biomedical protein research. Although DIGE is often performed with fluorescent dies, the sensitivity of the method is very low and results in very poor coverage of the human proteome. Mass spectroscopy plays a major role here, since DIGE separated proteins are typically identified using classic MS protein ID methodology [
37]. Immunoprecipitation/affinity purification of proteins commonly “pulls-down” complex protein mixtures, due to both specific (biological) and nonspecific (biophysical) protein-protein interactions, even without taking the dynamic range of specific protein-protein interactions into account. Due to sensitivity issues, mass spectroscopy is again pivotal in most studies of thus obtained protein sample mixtures, and AP-MS (affinity purification-mass spectroscopy) represents a state-of-the-art tool for studies of protein-protein interaction networks [
38]. Note that application of quantitative MS proteomic methods is recommended to separate “noise” from specific protein-protein interactions detected. These methods are often complex, expensive, time consuming and require a significant level of expertise for performing them in a reliable manner. AP-MS and CoAP-MS (co-affinity purification mass spectroscopy) are actively studied today from separations point of view as well [
39,
40,
41], while MS-based mapping of protein-protein interactions is progressing more slowly [
42,
43].
In terms of modern separation techniques, desalting of samples, as well as removal of detergents is pivotal for successful MS analyses. When Electrospray Ionization (ESI) MS is used, buffer exchange is often also necessary. For buffer exchange, centricon® centrifugal filters and microdialysis are often employed successfully. Nevertheless, for cutting-edge biomedical research, when only one or few microliters of (concentrated) sample needs to be desalted/buffer exchanged/ detergent removed, these simple (but efficient) tools are not adequate, due to miniaturization/adsorption/loss of sample issues. There is no doubt that Millipore ZipTip pipette tips and POROSTM chromatography resins made life of many mass spectroscopists easier, allowing efficient MS sample cleanup, as well as a certain degree of in-house column customization for specific needs, and made many successful MS experiments possible. Yet these are commonly used for chromatography of proteolyzed protein samples (mostly peptides and phosphopeptides) prior to MS structural analyses, rather than for separation of native protein samples prior to functional studies. Applying MS analyses predominantly for structural studies makes many aspects of protein research (present in native studies) much simpler. Limited separation options exist today even for cutting-edge structural MS proteomic analyses, but purification and functional studies of pmol or subpmol sample amounts, present in microliter volumes, are much more difficult to carry out today due to the lack of general separation strategies/industrial support (commercially available kits) for this type of biomedical protein samples/complex sample mixtures. Thus, in spite of the very advanced MS technology available today, as well as sophisticated methods available for biomedical protein research, significant advances in both these fields are severely hampered due to the lack of concurrent progress in both separation and purification techniques/reproducible methods available/commercially available kits for small amounts of protein samples, often present in small volumes.
3. Importance of High Purity Protein Samples for Biotechnological Analyses
Mass spectroscopy (MS) and surface plasmon resonance (SPR) represent today two important biotechnological tools for functional protein studies. This is primarily due to their high sensitivity, which is of primary importance for modern biomedical research, although they both possess distinct advantages enabling many state-of-the-art experiments which could not be performed earlier. However, they require high(er) purity protein samples, with MS additionally requiring samples to be desalted, detergents/buffers/glycerol removed, and sometimes the buffers to be exchanged. We will first give an example of an SPR study, due its higher tolerance towards chemical impurities.
As discussed previously, in
Figure 1, examples of a sequential (three step) column chromatography of Ku heterodimer (see
Figure 1a) and affinity (one step) chromatography of DNA-PKcs (see
Figure 1b) are given. Here we will focus on
Figure 1b, since we used this sample for SPR analyses shown in
Figure 2 and
Figure 3. A three step column chromatography of DNA-PKcs was also attempted, but yielded much poorer results (data not shown). In
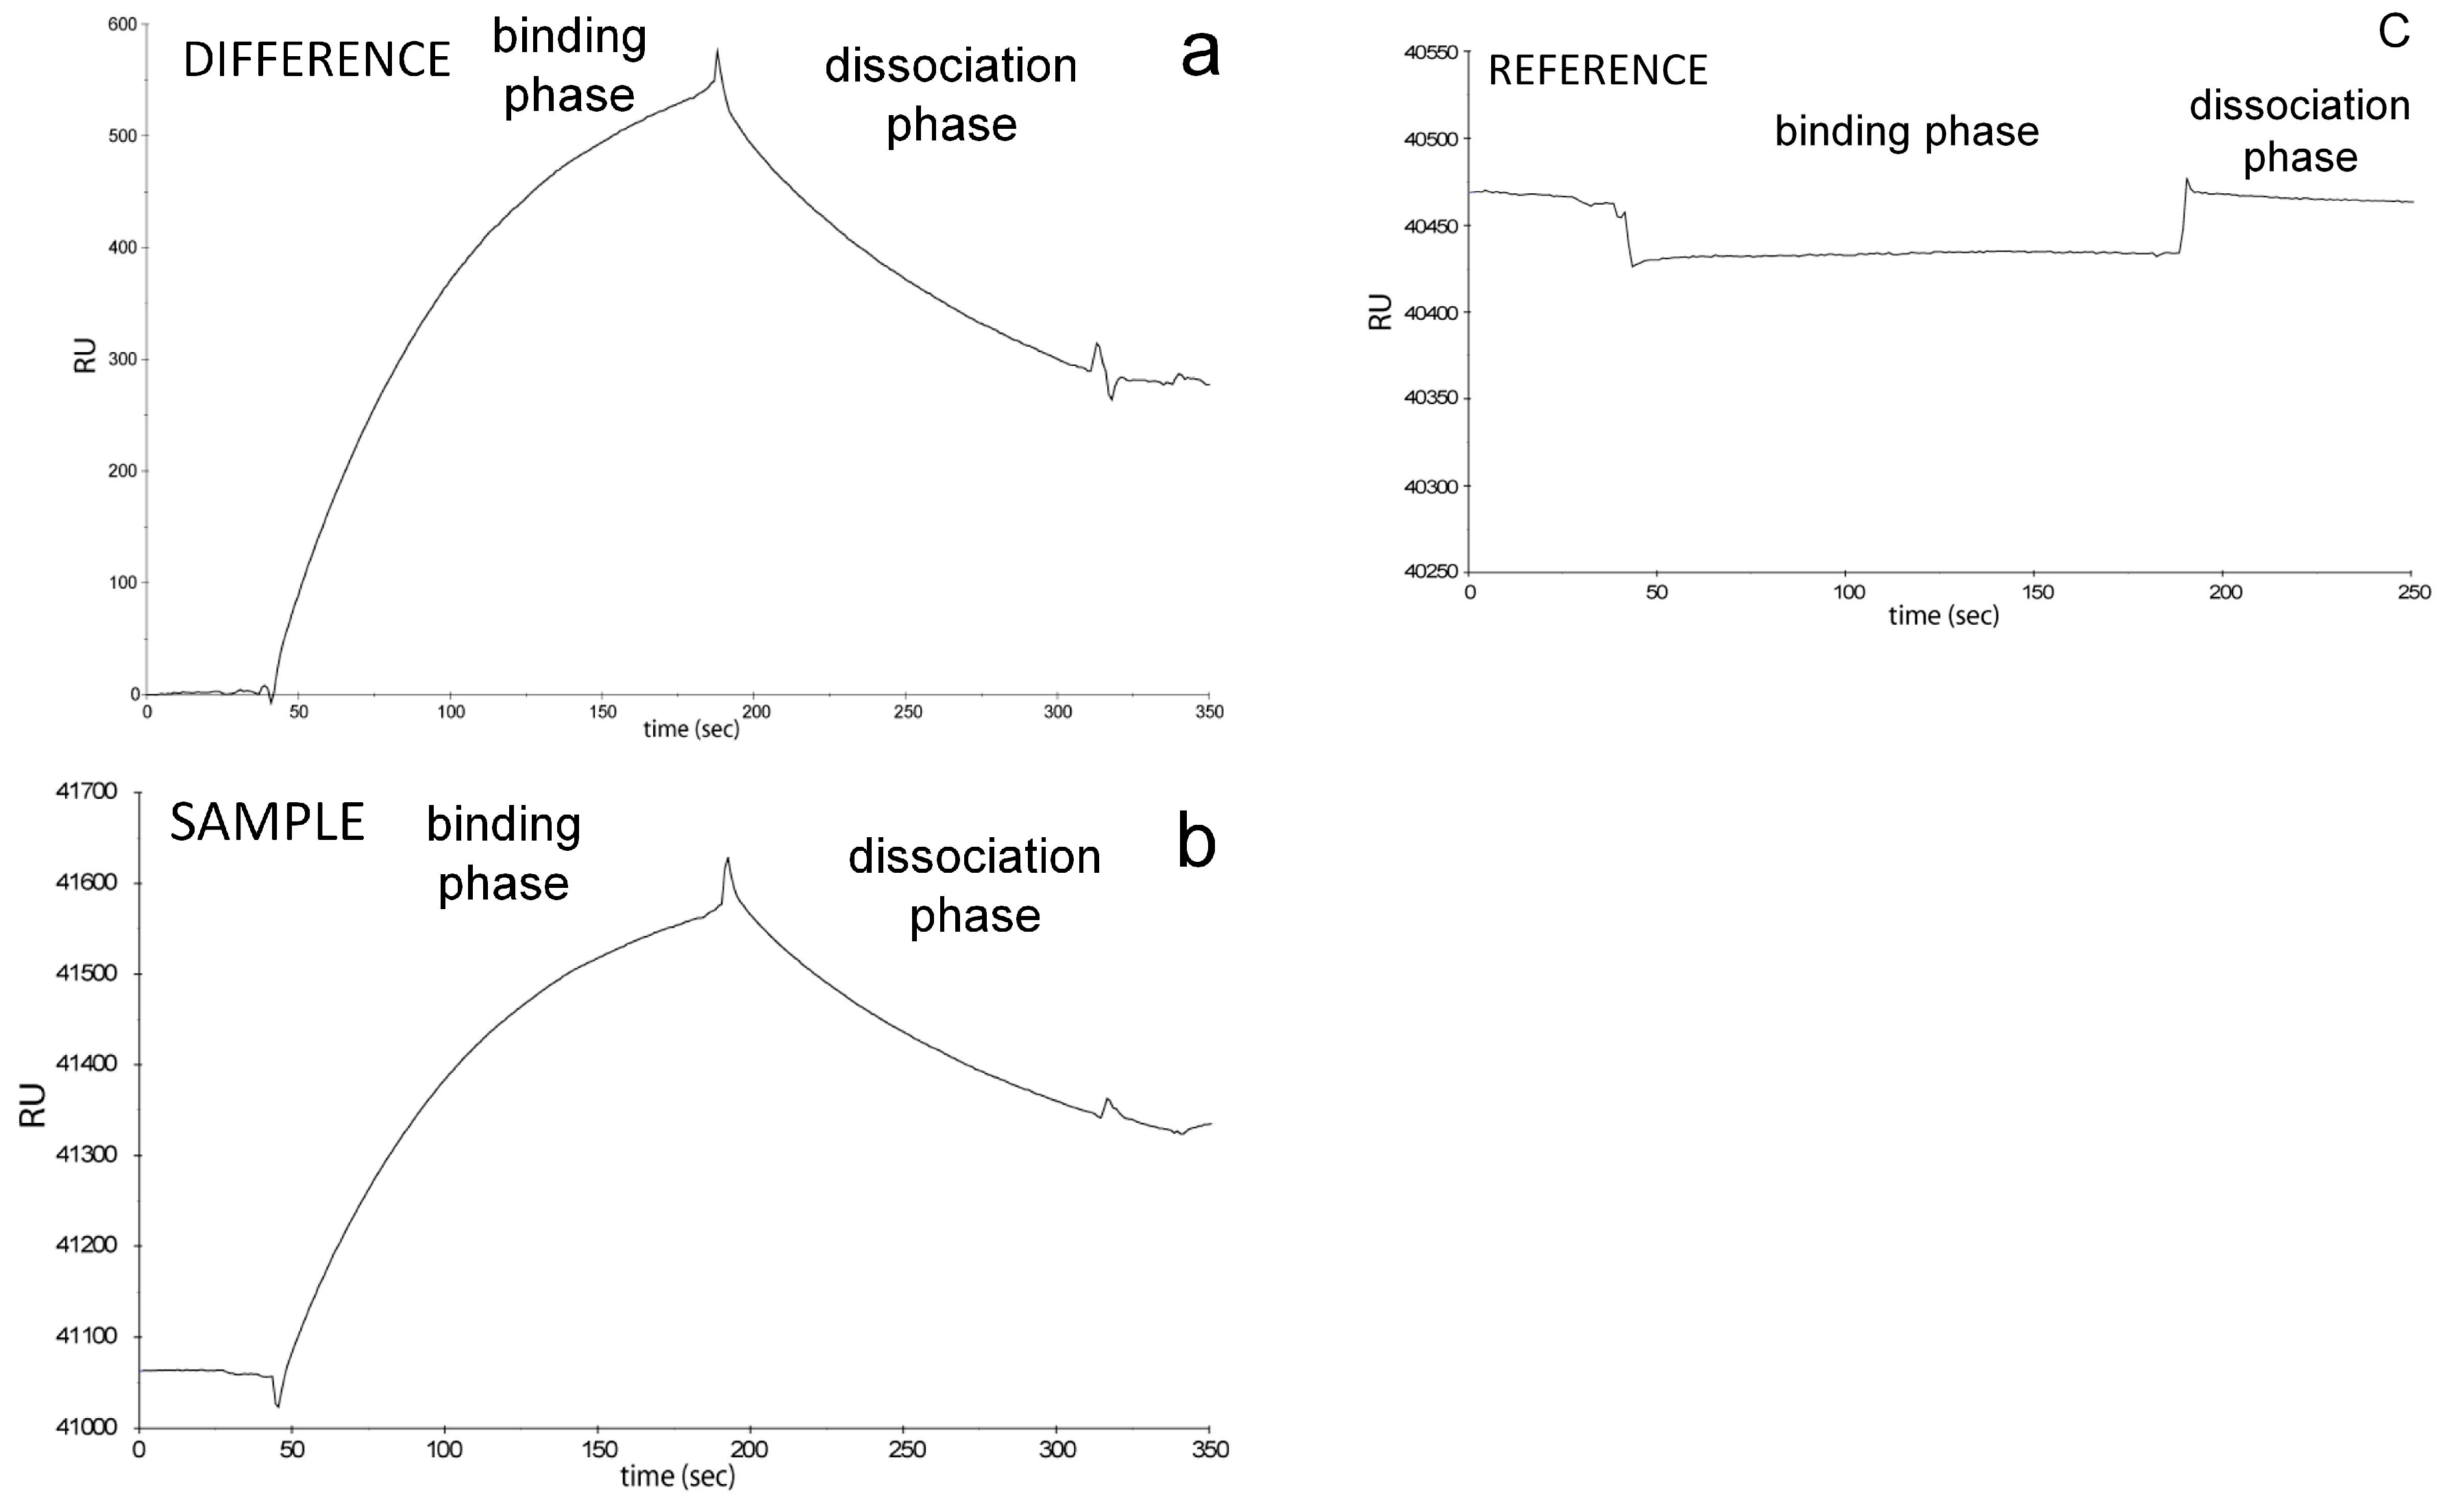
Figure 2, control SPR data for the affinity purified DNA-PKcs sample are shown, when the sample was flowed over a streptavidin-coated sensor chip to which a synthetic biotinylated oligonucleotide was bound. In the figure data for the sample cell (see
Figure 2b), reference cell (unliganded control, see
Figure 2c), as well as the respective difference (see
Figure 2a) are presented [
28]. In ideal case scenario, nonspecific binding to the reference cell is equal to zero, or minimal (negligible), as was the case with the affinity purified DNA-PKcs here. Contrary to these data, three-step column chromatography purification method for DNA-PKcs resulted in significant amount of nonspecific binding to the reference cell of the sensor chip (data not shown). The full SPR data shown in
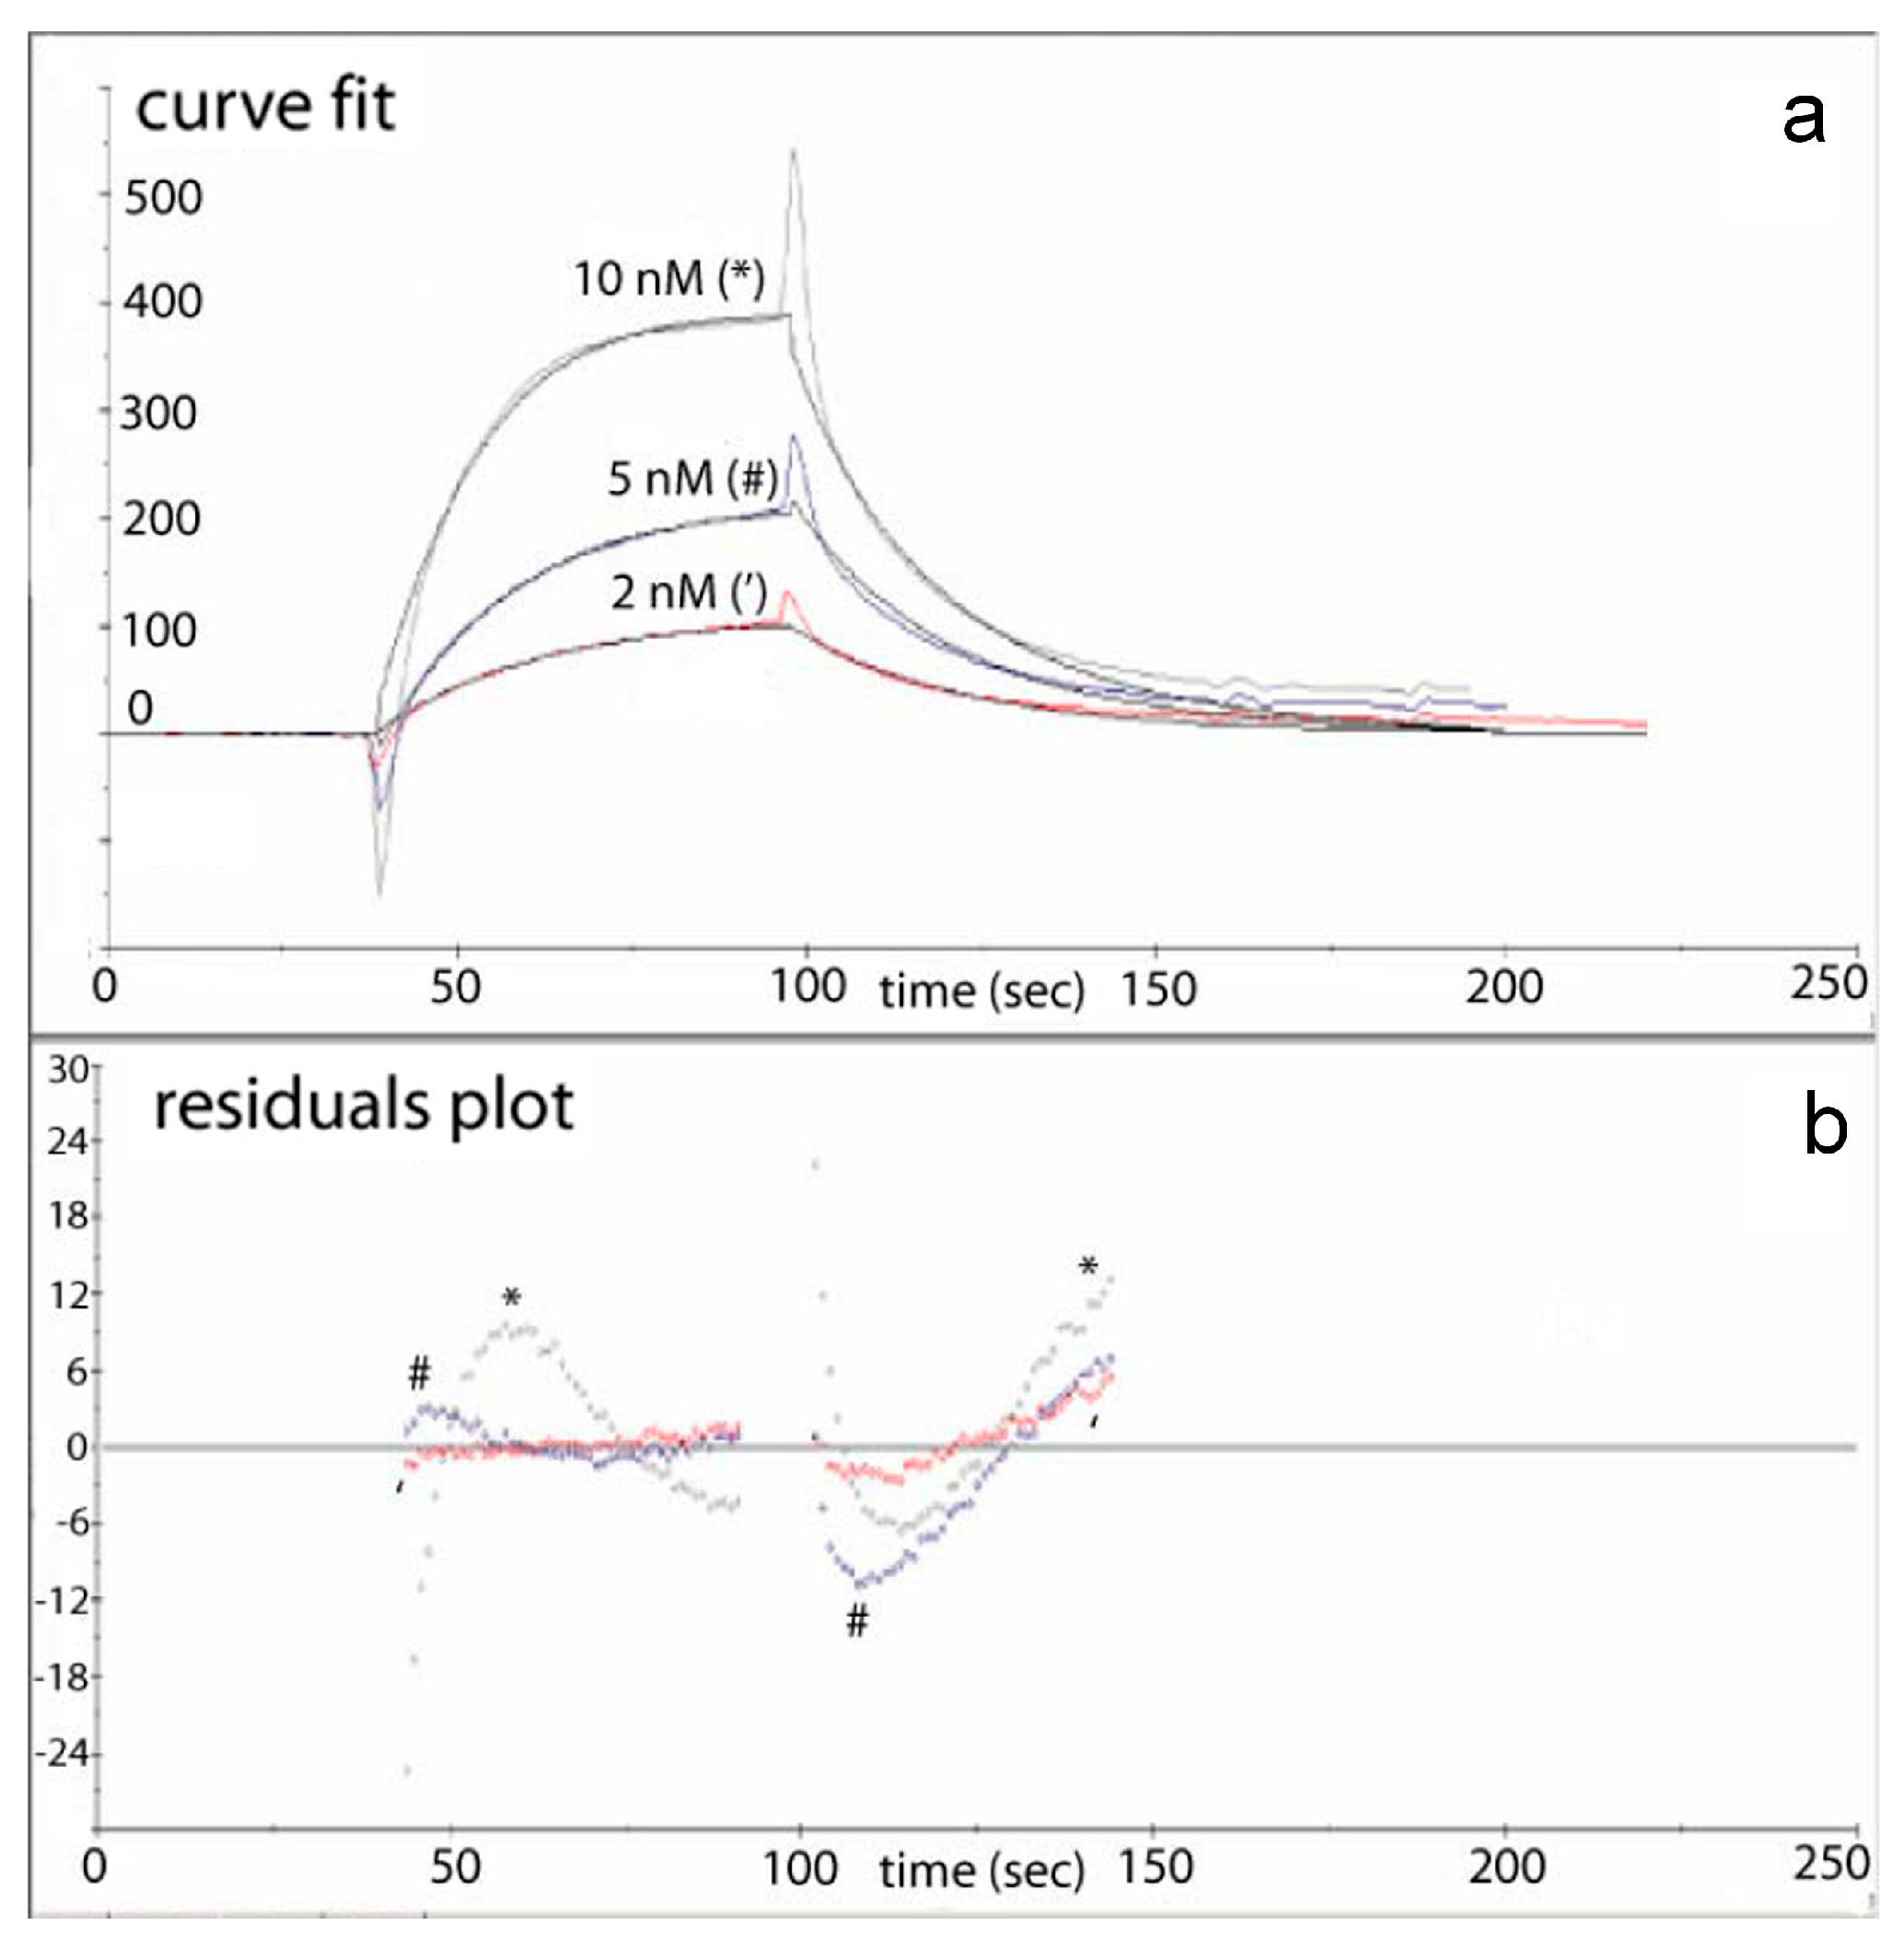
Figure 2 are typically not shown in the literature, since values of residuals (obtained with the SPR instrument built-in software) are a reliable indicator for quality of curve-fitting algorithm used. In
Figure 3, built-in software curve fits and respective residuals plots for both the binding and the dissociation phases are shown for three DNA-PKcs concentrations tested—2 nM, 5 nM and 10 nM [
28]. In ideal case scenario, residuals should be close to zero. Here the residuals for the 2 nM and 5 nM DNA-PKcs in the binding phase were indeed close to zero, while the 10 nM sample deviated significantly more. In the dissociation phase all three concentrations behaved similarly, albeit with lesser accuracy. One possible cause for deviation of residuals for 10 nM DNA-PKcs in the binding phase is mass transfer effects in SPR experiments.
In summary, the data quality with the affinity-purified DNA-PKcs sample was high, nonspecific binding to the SPR chip surface was negligible, curve fits were excellent and residuals close to minimum. Contrary, in the case of three-step (nonspecific) column chromatography-purified DNA-PKcs, nonspecific binding to the SPR chip surface was high, resulting in poor curve fits, and abnormally high residuals (>100) (data not shown). Thus, high purity protein samples are needed for the SPR experiments. The affinity-purified DNA-PKcs sample was subsequently successfully employed for an SPR binding study of different synthetic oligonucleotide probes [
29]. Nevertheless, it should be pointed out that affinity-purification of native human proteins is not always possible today, due to poor knowledge of specific peptide probes that can be used for such a purpose. Interestingly, the purity of affinity-purified DNA-PKcs sample was so high, that the protein was unstable when kept on ice for longer periods (hours), and required addition of trehalose for stabilization [
29] (less pure protein preparations are known/presumed to be more stable). These issues are important for protein purification field, in order to minimize the luck factor in obtaining highly pure stable protein samples for modern biomedical research.
In
Figure 4 and
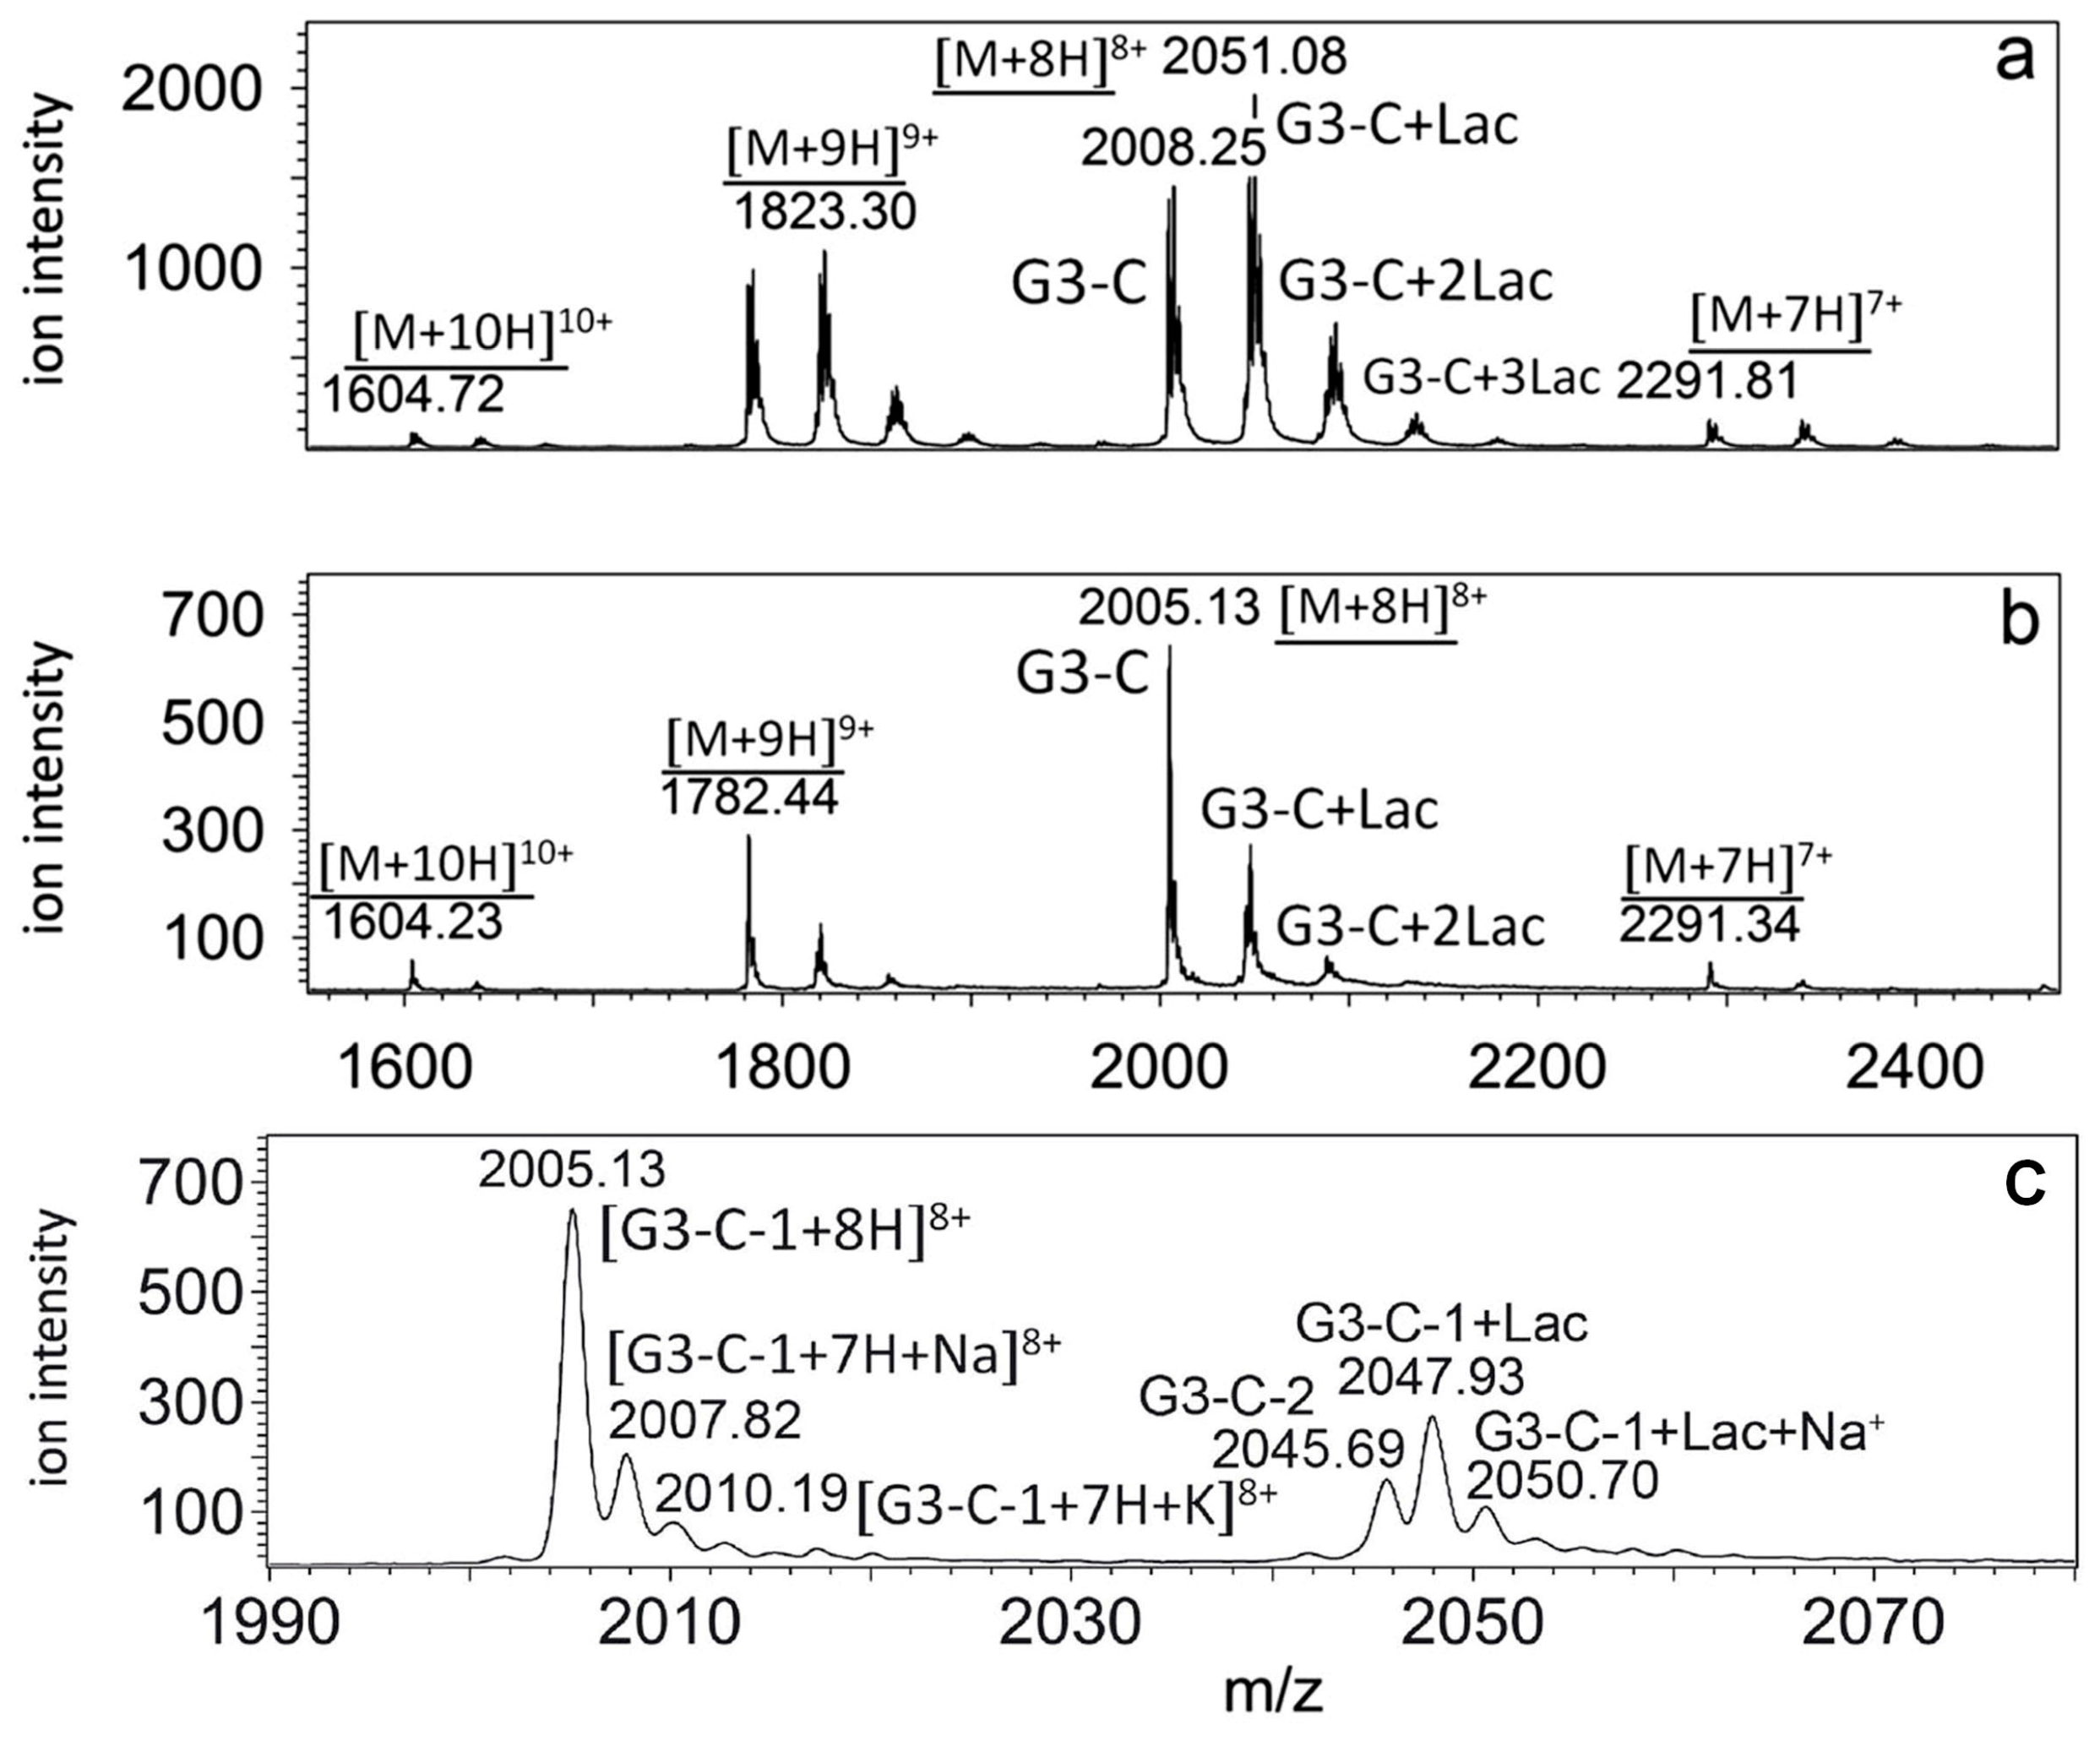
Figure 5, an example of an MS study of a human galectin-3 protein sample is shown. In
Figure 4, MALDI-TOF (matrix-assisted laser desorption/ionization-time-of-flight) maps of human galectin-3C (
Figure 4a) and human galectin-3 (
Figure 4b) are shown [
44]. In this case, galectin-3 was obtained using affinity chromatography with lactose as eluent. Galectin-3C (containing the carbohydrate recognition domain) was obtained using collagenase VII digestion [
45]. Comparison of the two samples clearly indicates that the purity of the galectin-3C sample was much higher. Due to their high mass, the contaminants present in the galectin-3 sample were most likely proteins/galectin-3 degradation products. While MALDI MS is relatively tolerant to the presence of salts, detergents and various buffers, ESI MS is much less so. Indeed, we were not able to obtain quality nanoESI MS spectra with this galectin-3 sample, and had to focus on galectin-3C in further studies. A detailed biophysical characterization study of these two samples was published separately [
44].
In
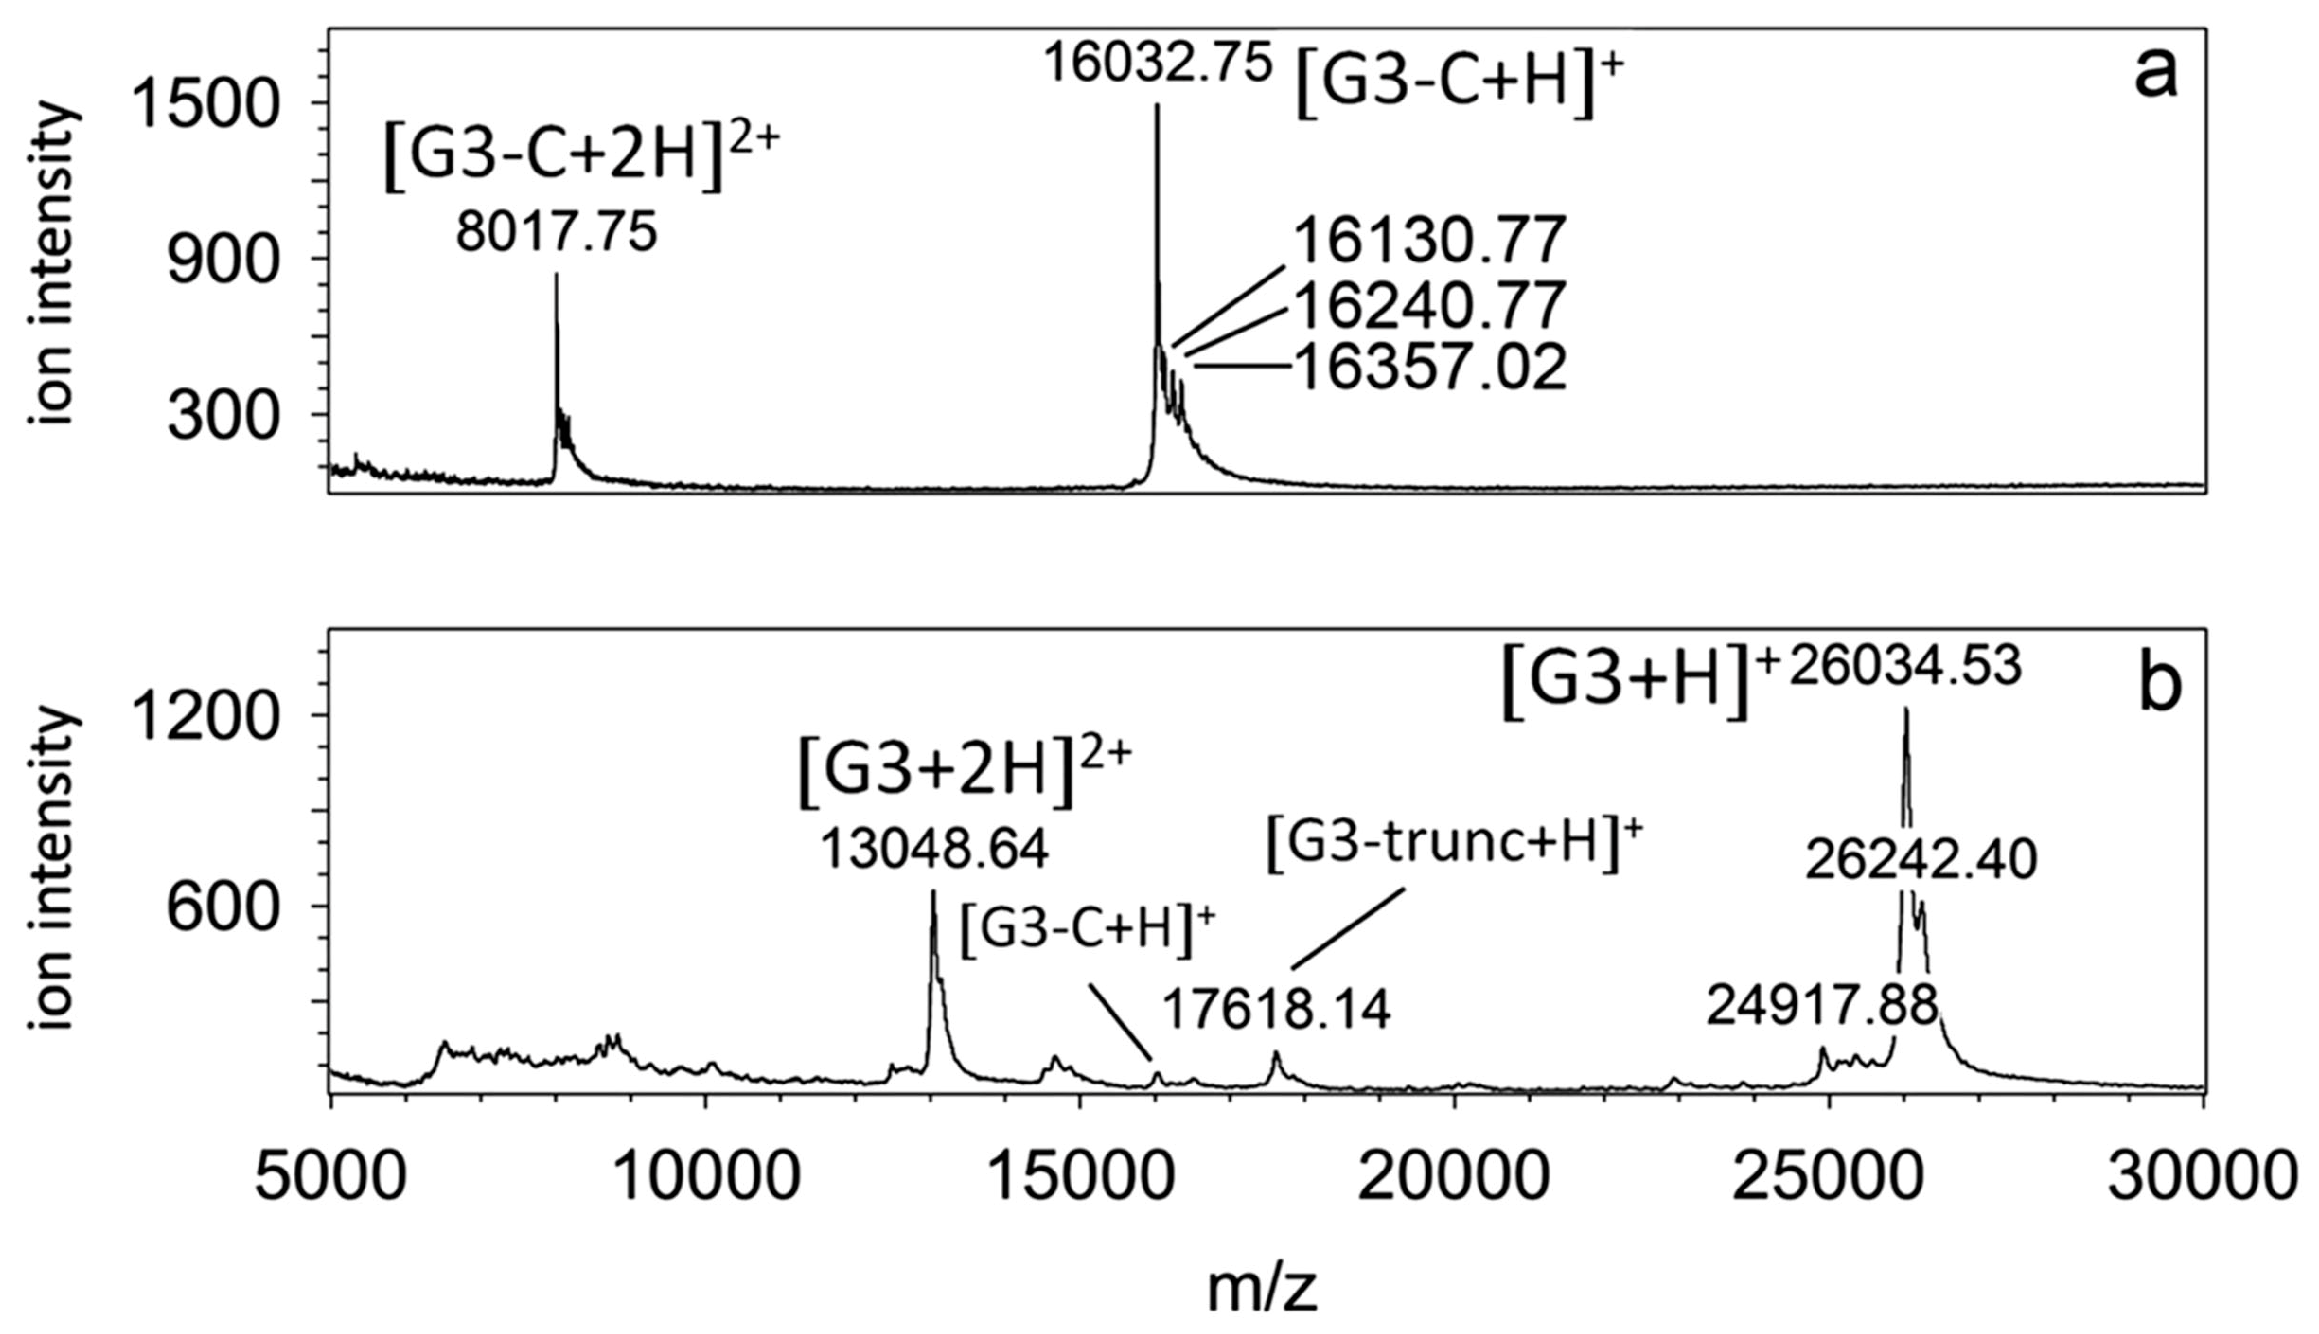
Figure 5a, a nanoESI map of the same galectin-3C sample under native conditions is shown [
44]. Huge amounts of excess lactose, remaining from the affinity purification step, can clearly be seen. We therefore had to dialyze the sample, but failed to remove the lactose completely, as can be seen in
Figure 5b. These data show the value of MS for assessment of, as well as proving the purity of protein samples. High purity of protein samples (see
Figure 4a) is crucial for obtaining high quality native ESI MS protein functional data (see
Figure 5c). Today, galectin-3 is purified using a similar affinity chromatography procedure, but using pH-dependent elution of galectin-3 from the affinity column, instead of using lactose (a weak competitor) as an eluent.
For the separation science, it is important to note that MS can distinguish fully protonated, sodiated and potassiated protein signals (see
Figure 5c) [
24]. While not a significant issue in qualitative analyses, this may become a significant issue for quantitative analyses. Therefore, complete removal (separation) of salts from proteins in biomedical protein samples is a highly sought method today. Similar is true for detergents, as well as for exchange of buffers, often of (sub)pmol amounts of samples, present in microliter volumes. Additionally, note that in
Figure 5c, 2 G3-C isoforms were detected, G3-C-1 (theoretical) and G3-C-2 (lactosylated G3-C-1) [
24,
44]. In our experiments signals related to the G3-C-2 isoform (with covalently bound lactose) overlapped with signals related to the G3-C-1 isoform in complex with non-covalently bound lactose. Additional methods of protein purification, with the emphasis on purification of protein isoforms, where protein molecules differing in small mass values (300 Da–3000 Da) need to be efficiently separated, are highly sought today, since this cannot be achieved using traditional gel-filtration columns. However, for functional analyses, separation of protein isoforms is a crucial problem. Apart from covalent protein modifications due to experimental procedures used, heterogeneity in posttranslational modifications (PTMs) of proteins, such as glycosylation and phosphorylation, is a common source of problems (or errors) for both structural MS analyses and functional studies.
4. LC, MALDI MS and LC-MS of Human Milk Oligosaccharides
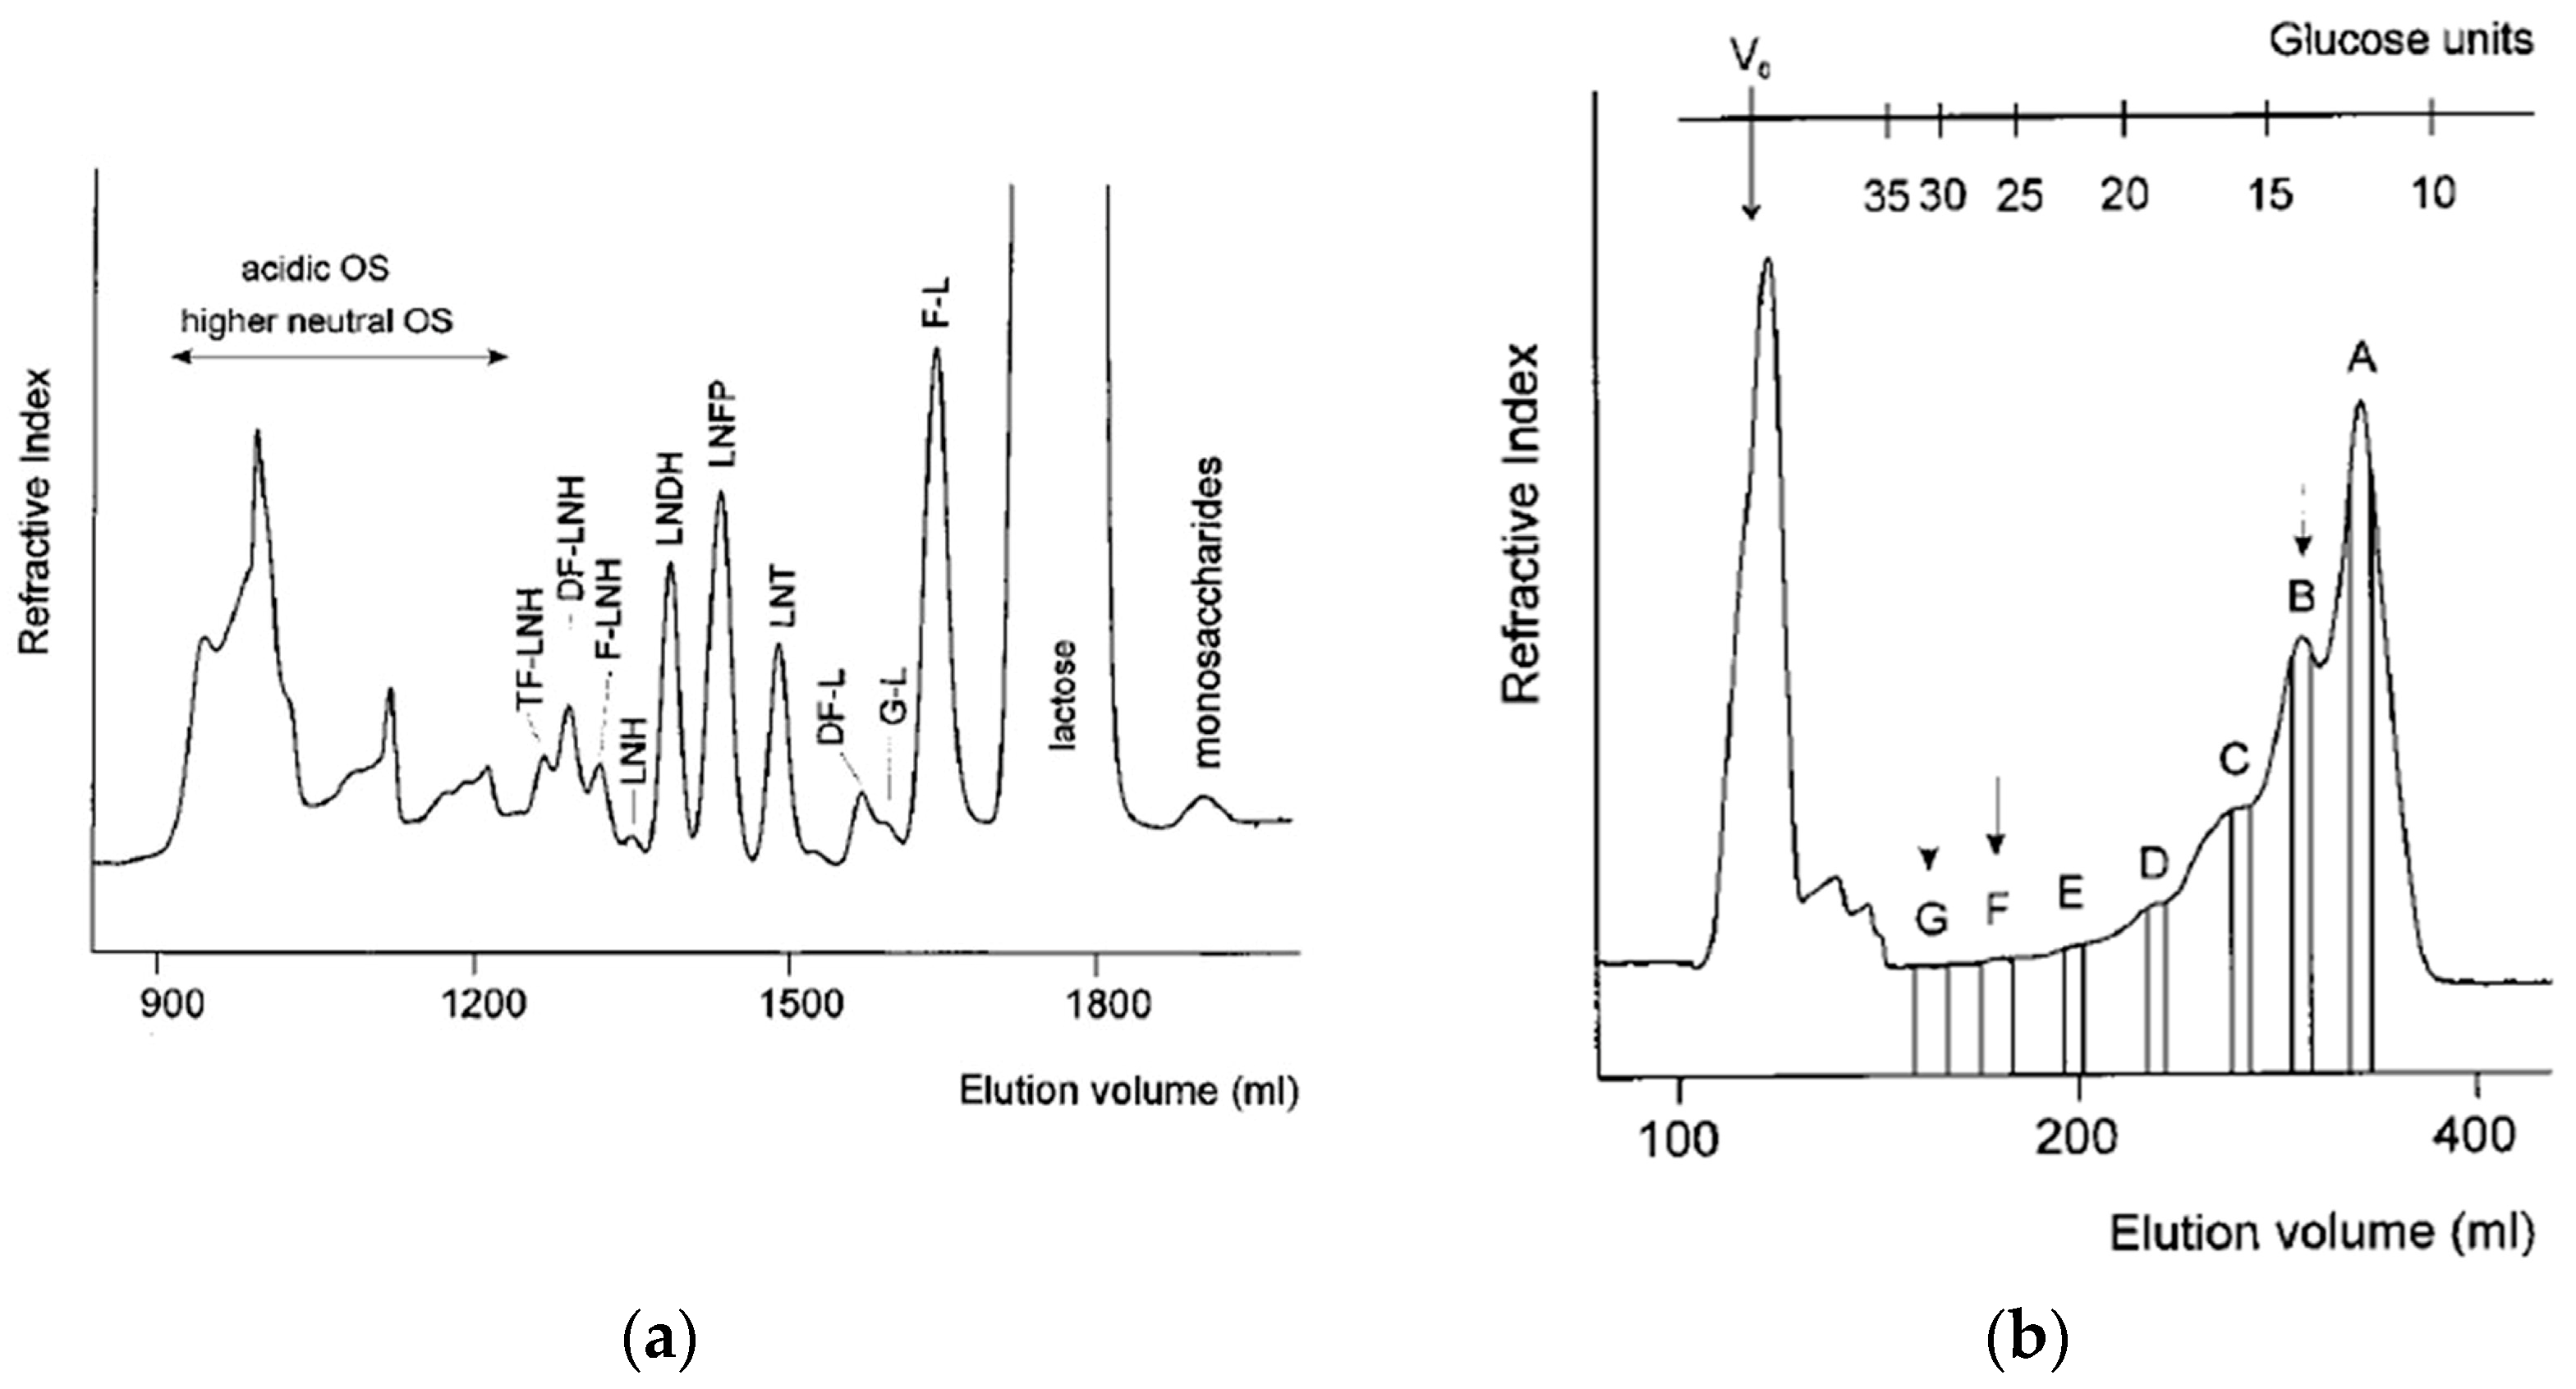
Human milk oligosaccharides (HMOs) represent a well-studied class of biomolecules. Most advances in the HMO field are closely interwoven with liquid chromatography separation techniques. This is due to the fact that MS played a crucial role in the elucidation of many structural properties of HMOs, and its heavy reliance on LC separation of complex HMO mixtures, particularly of HMO isomers. At the end of the last century, liquid chromatography techniques were being developed for separation of HMOs, either to be able to analyze chromatographic fractions using MALDI MS, or to apply nuclear magnetic resonance (NMR) spectroscopy on purified HMOs. These included ion exchange and gel filtration liquid chromatographies. Ion exchange chromatographies were used for sample desalting, while anion exchange chromatography was used for separation of neutral and acidic HMOs. Apart from consisting of neutral and acidic (sialylated) structures, all HMO structures share a high degree of similarity, with difference in mass being the most useful separation property (for both neutral and acidic subfractions). Most HMO structures fall in the mass range of 700 Da–6000 Da, and therefore gel filtration was the most useful separation technique. In
Figure 6a, gel filtration elution profile obtained on a Toyopearl HW 40 (S) column of a carbohydrate fraction of human milk sample is shown, monitored with refractive index (RI) detection [
46]. The higher-mass neutral fraction, containing acidic HMOs as well, was further fractionated on a Bio-Gel P-6 column (see
Figure 6b) [
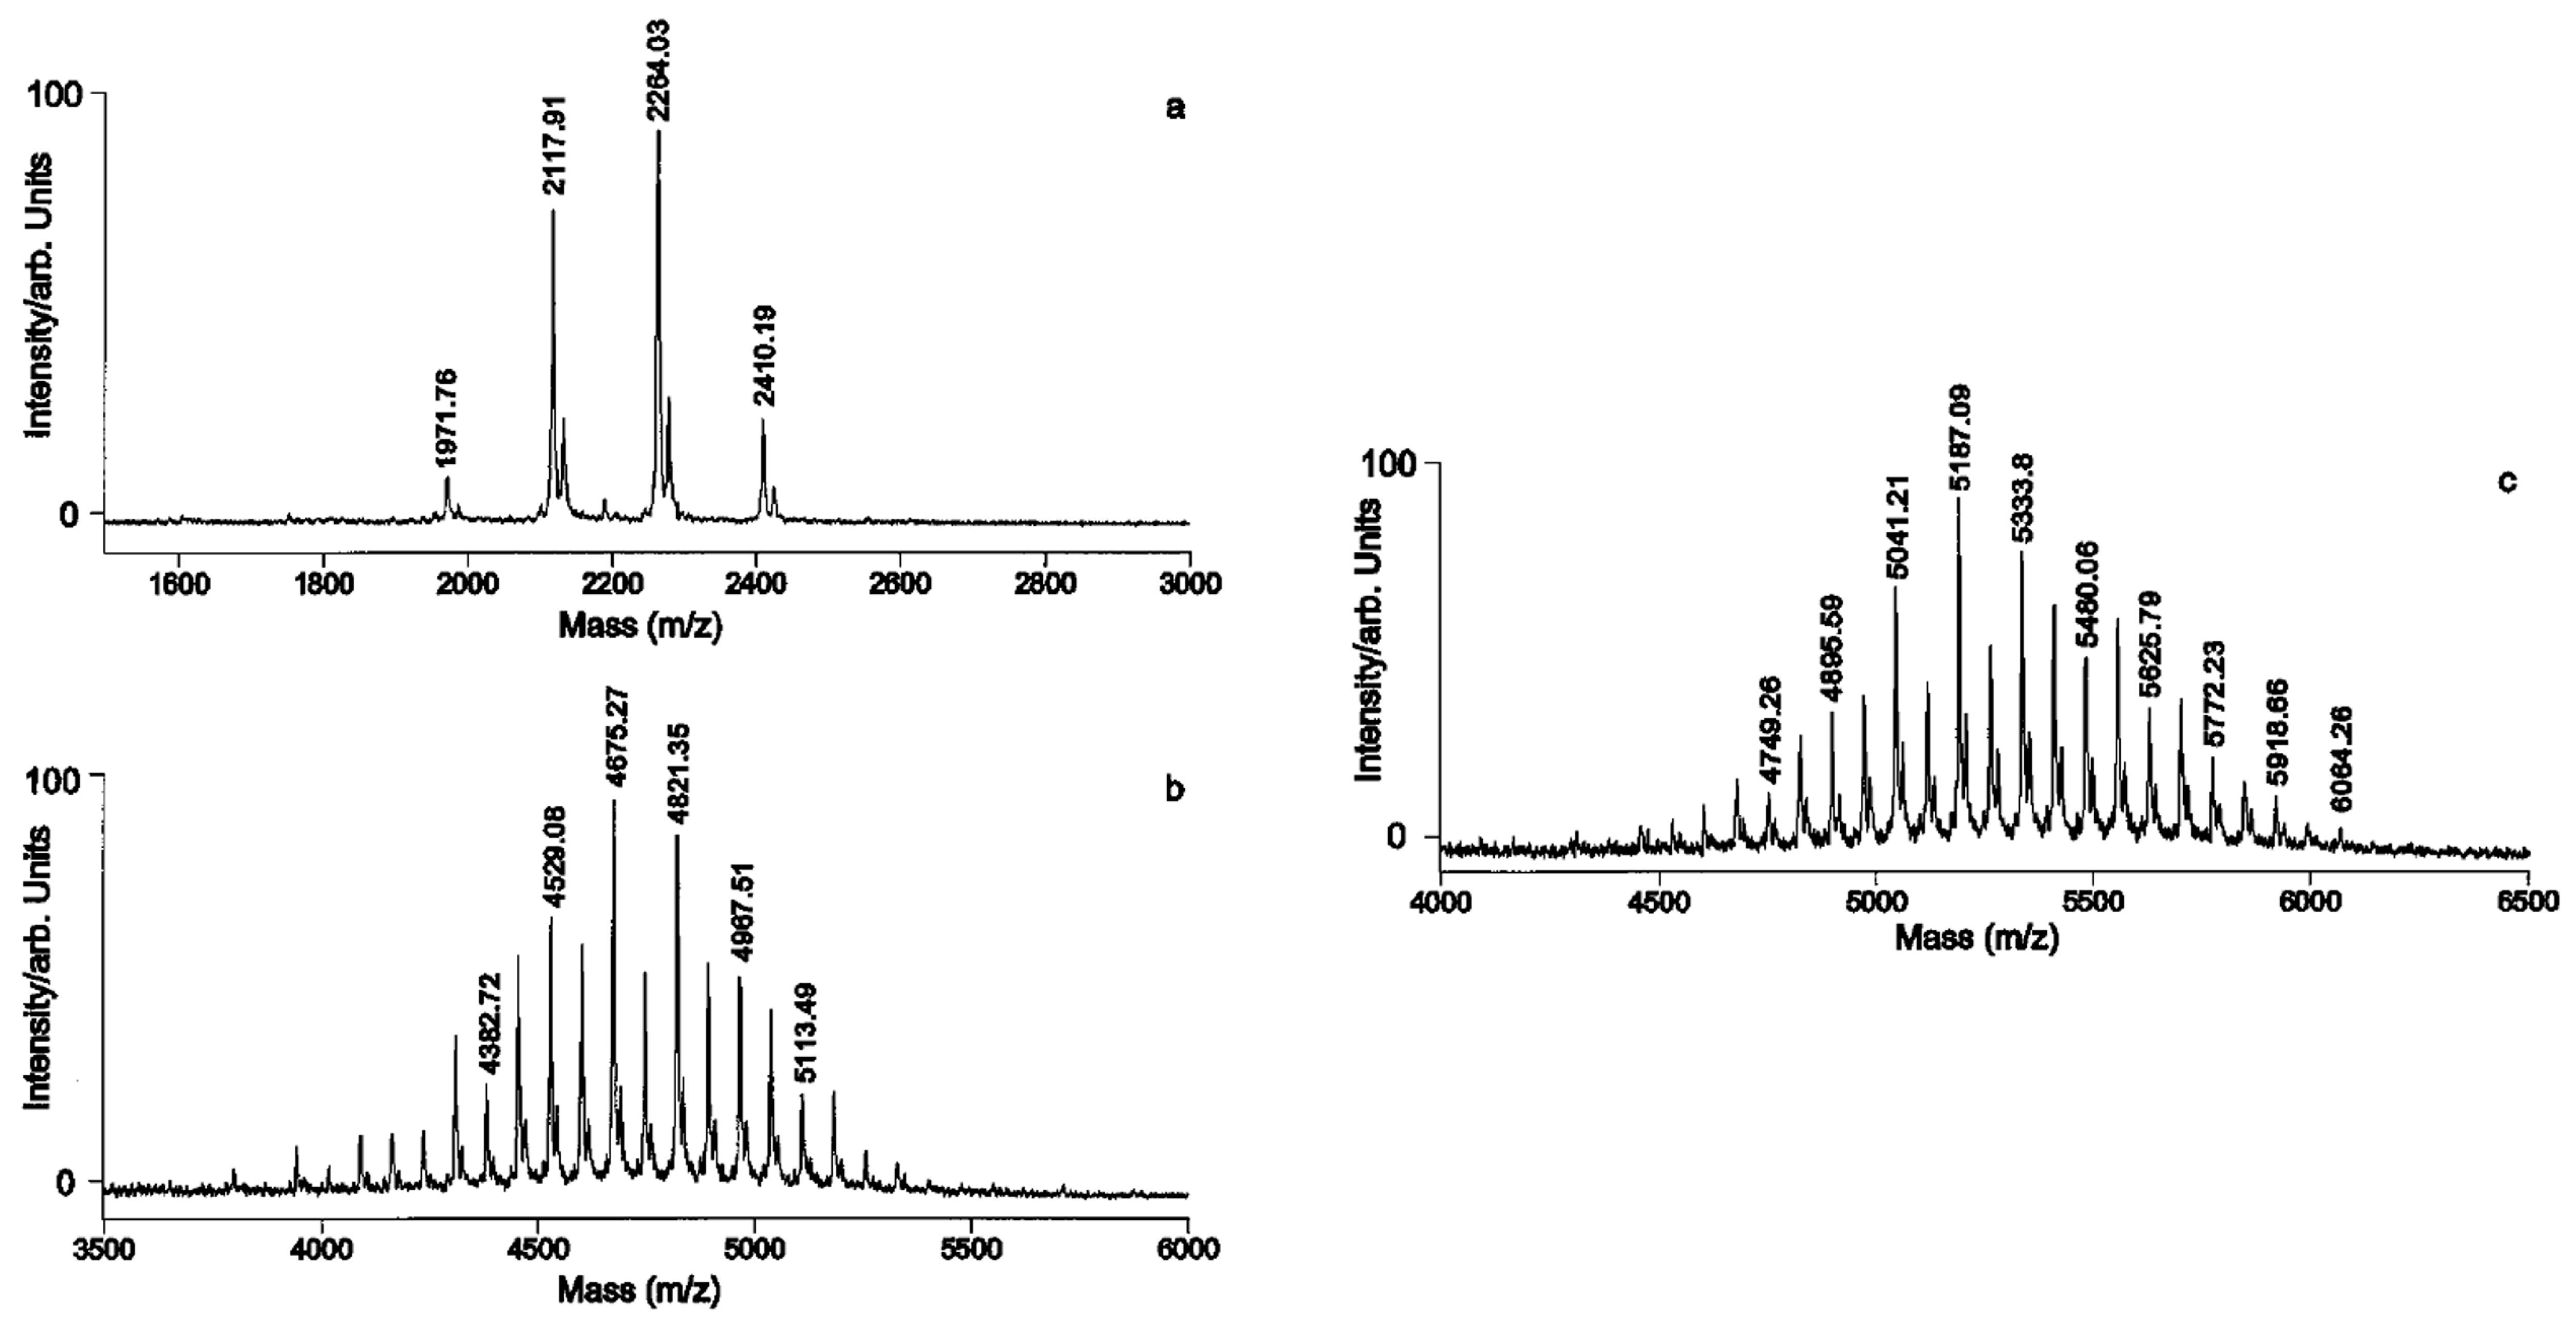
46]. The fractions were then analyzed with MALDI MS. In
Figure 7, linear (+) MALDI MS spectra of fractions B, F and G are shown [
46]. This was a standard protocol in the ‘90s for analysis of HMOs and discovery of novel HMO structures, predominantly with respect to their mass and degree of fucosylation or sialylation [
46,
47,
48]. LC was used to fractionate and separate complex HMO mixtures as much as possible, while MALDI MS was used to detect and measure HMO’s masses, which allowed deduction of HMO molecular formulae. Using this approach, tables of detected HMOs could be constructed, similar to the one shown in
Table 1 [
47].
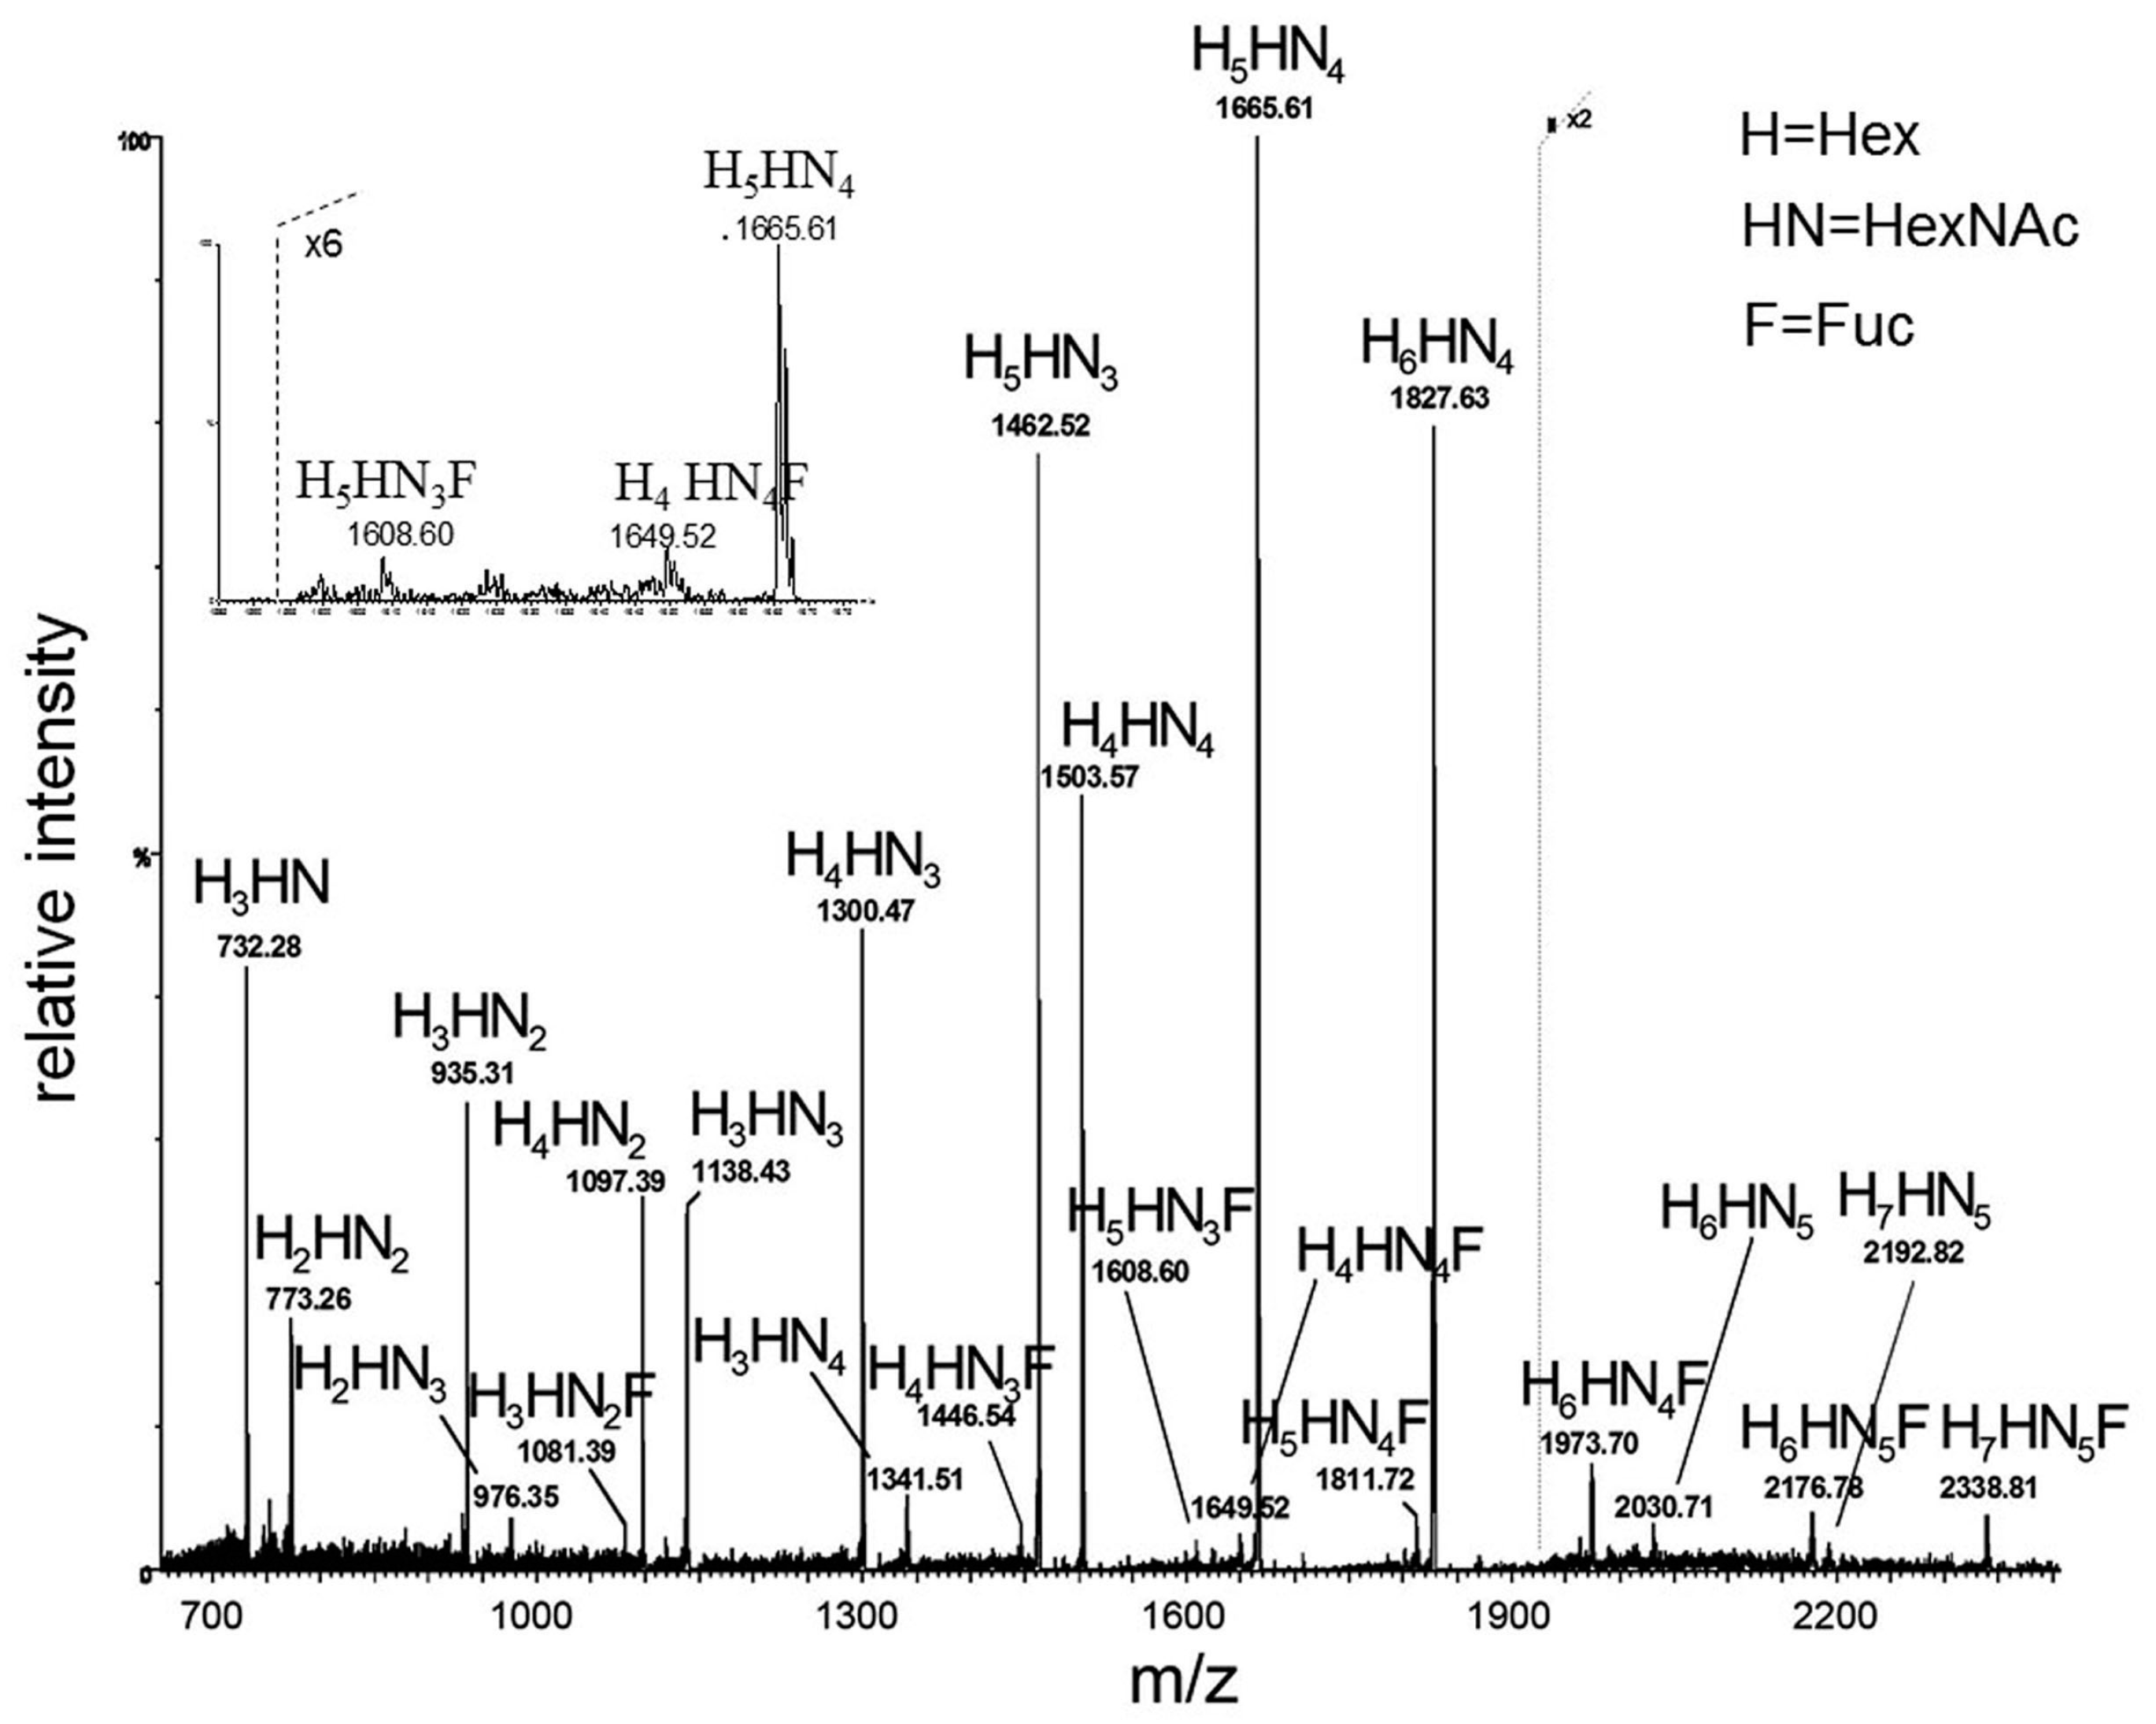
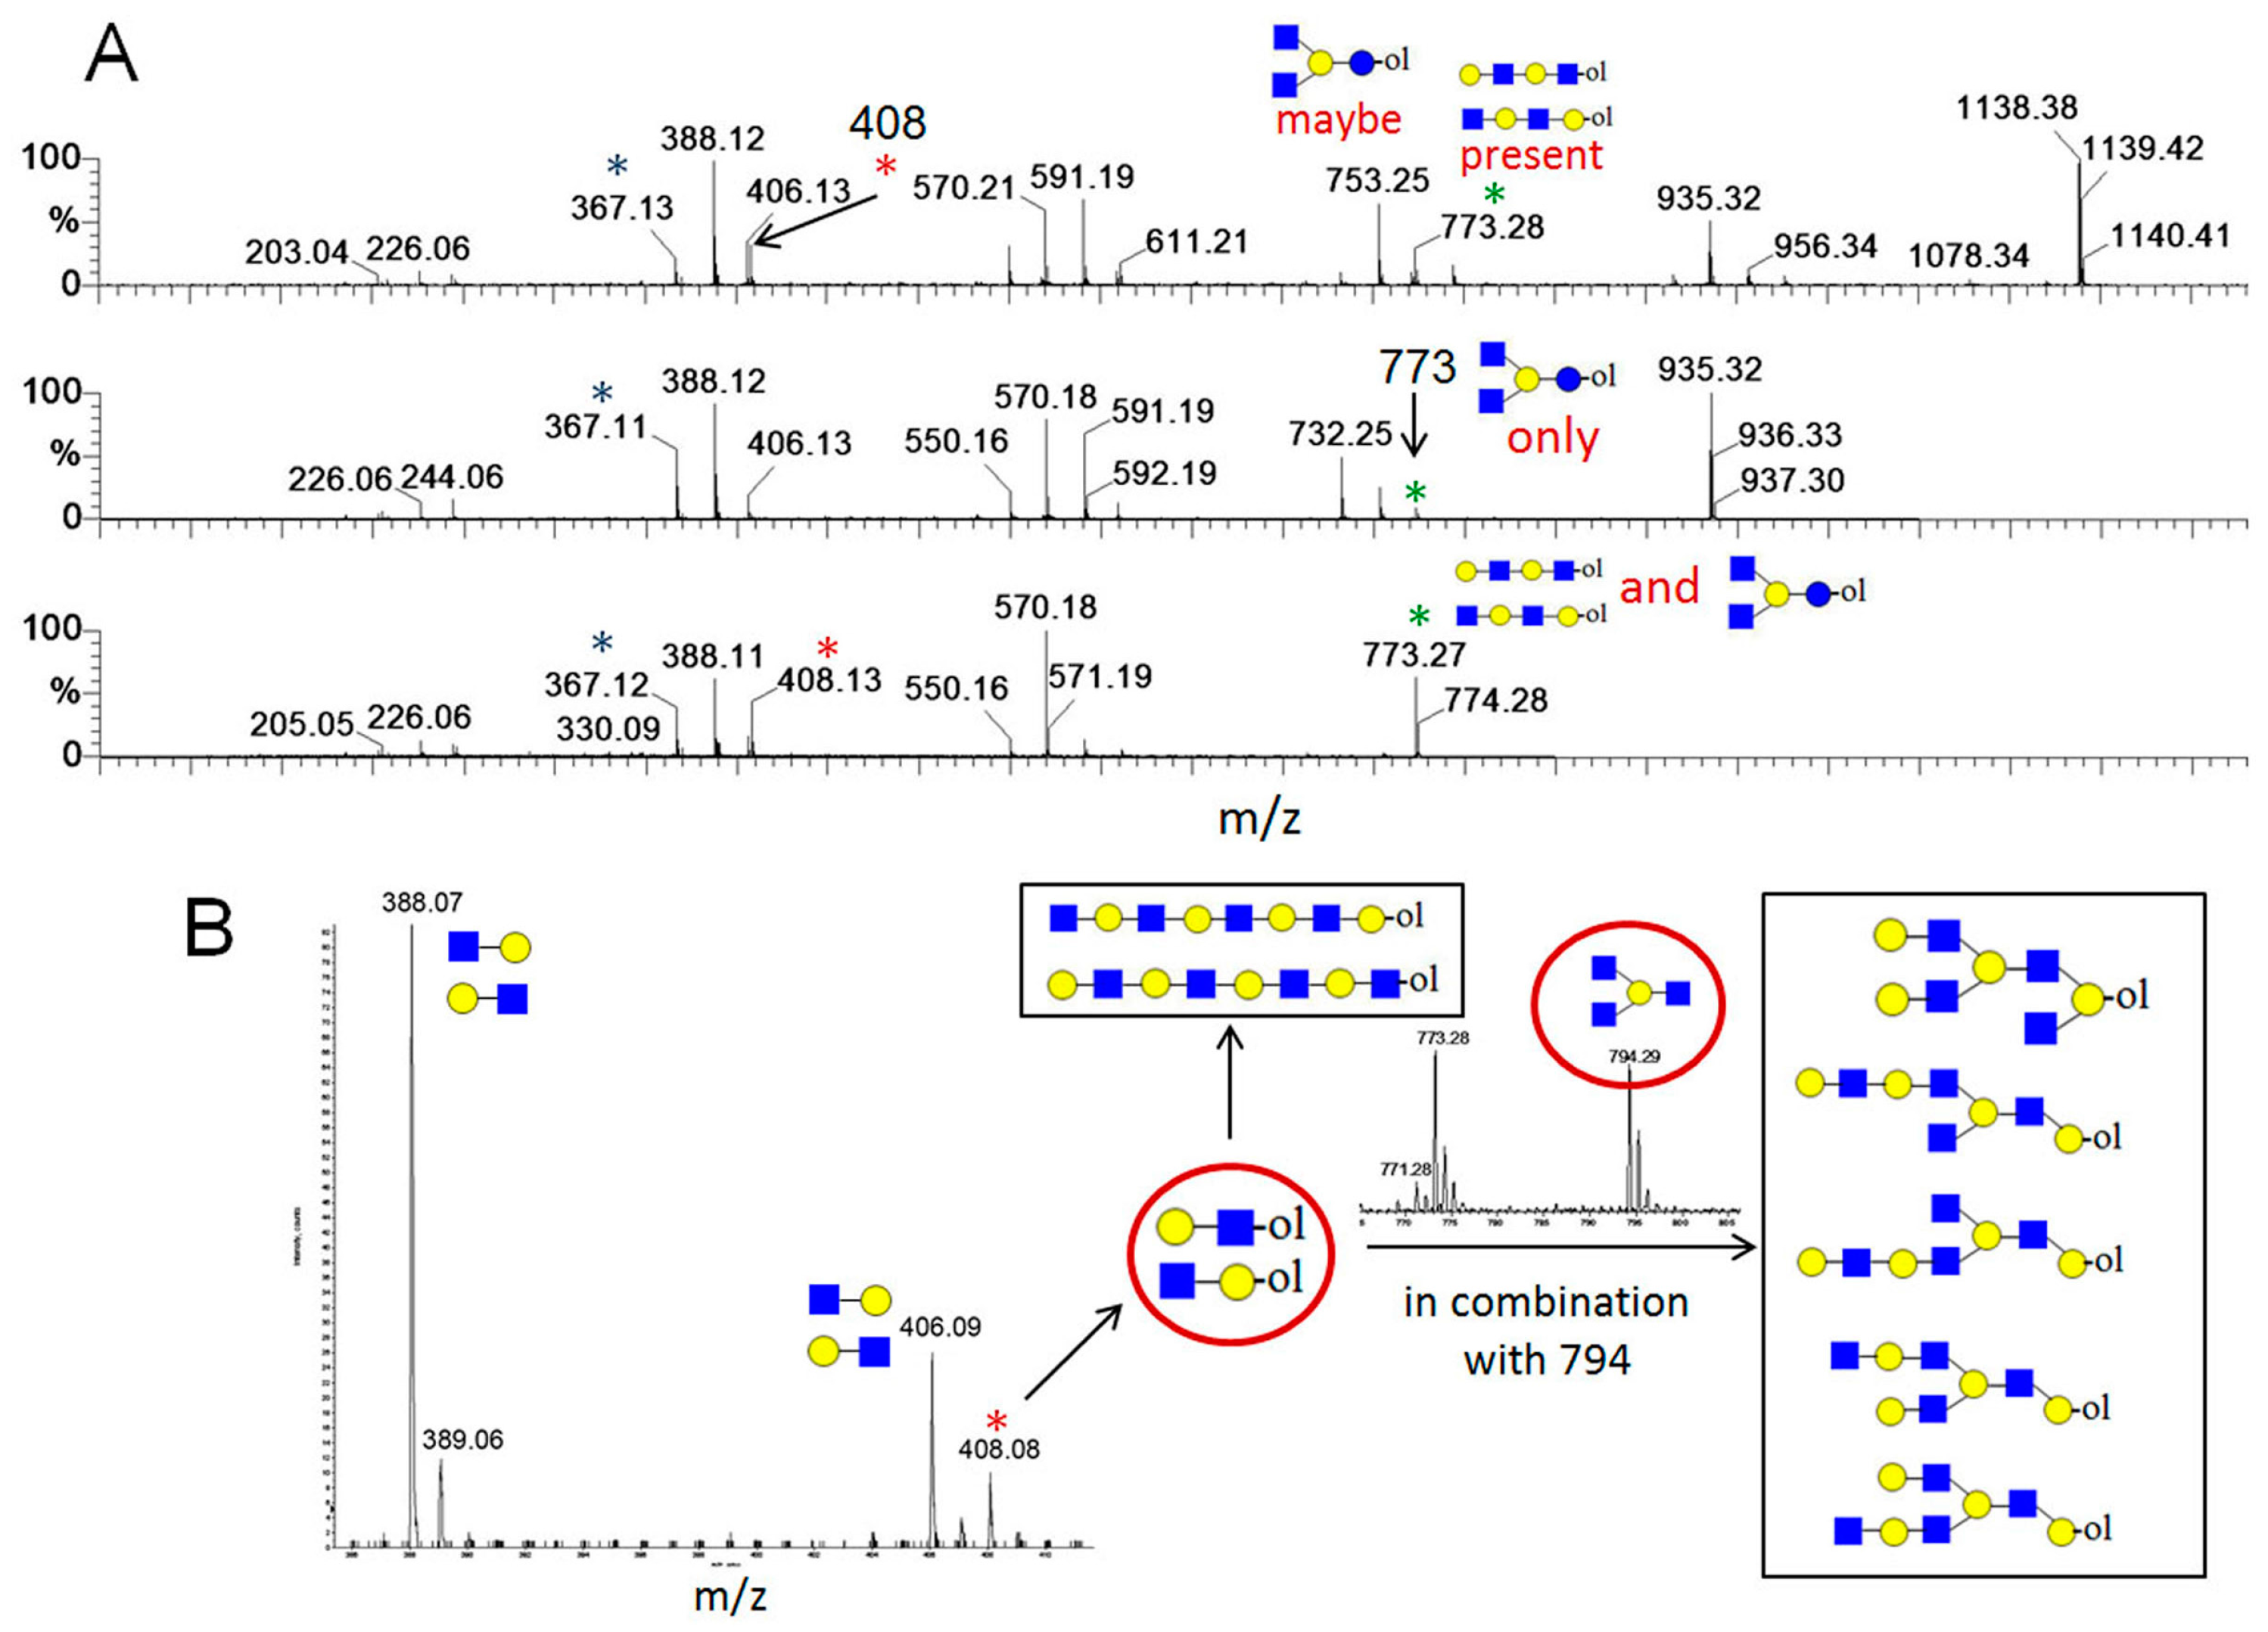
Although very practical, as well as very useful in the 1990s, this approach was limited both for the detection of present HMO structures, as well as their structural characterization. This is due to the problem of structural isomerism of carbohydrates and technical difficulties and limitations of MS/MS technique in analysis of complex (branched) structures. These problems are briefly explained on an example of a MALDI MS spectrum of a neutral HMO chromatographic subfraction shown in
Figure 8 [
49]. In this example 22 carbohydrate-related ions were detected, based on mass accuracy of the experiment and HMO monosaccharide composition. However, after performing MS/MS experiments on ions of interest, it was found out that many precursor ions were in fact isobaric ion mixtures. Using the diagnostic ion screening approach (see
Figure 9), at least 34 structure types could be deduced (see
Table 2) [
49]. However, based on Y product ions only, it was not possible to deduce linkages between monosaccharide units, particularly those on branching points. Thus the number of individual HMOs present in the sample (one chromatographic fraction) was much higher than 34 (but probably less than 100).
Over the last decade, Lebrilla et al. developed an LC-MS method for the analysis of HMO samples, based on a nanoHPLC Chip/TOF MS approach [
7,
8,
14,
15,
22,
50,
51,
52] using graphitized carbon chromatography (GCC). GCC is stable, has a long life [
53] and is effective for the separation of both neutral and acidic oligosaccharides, including isomers [
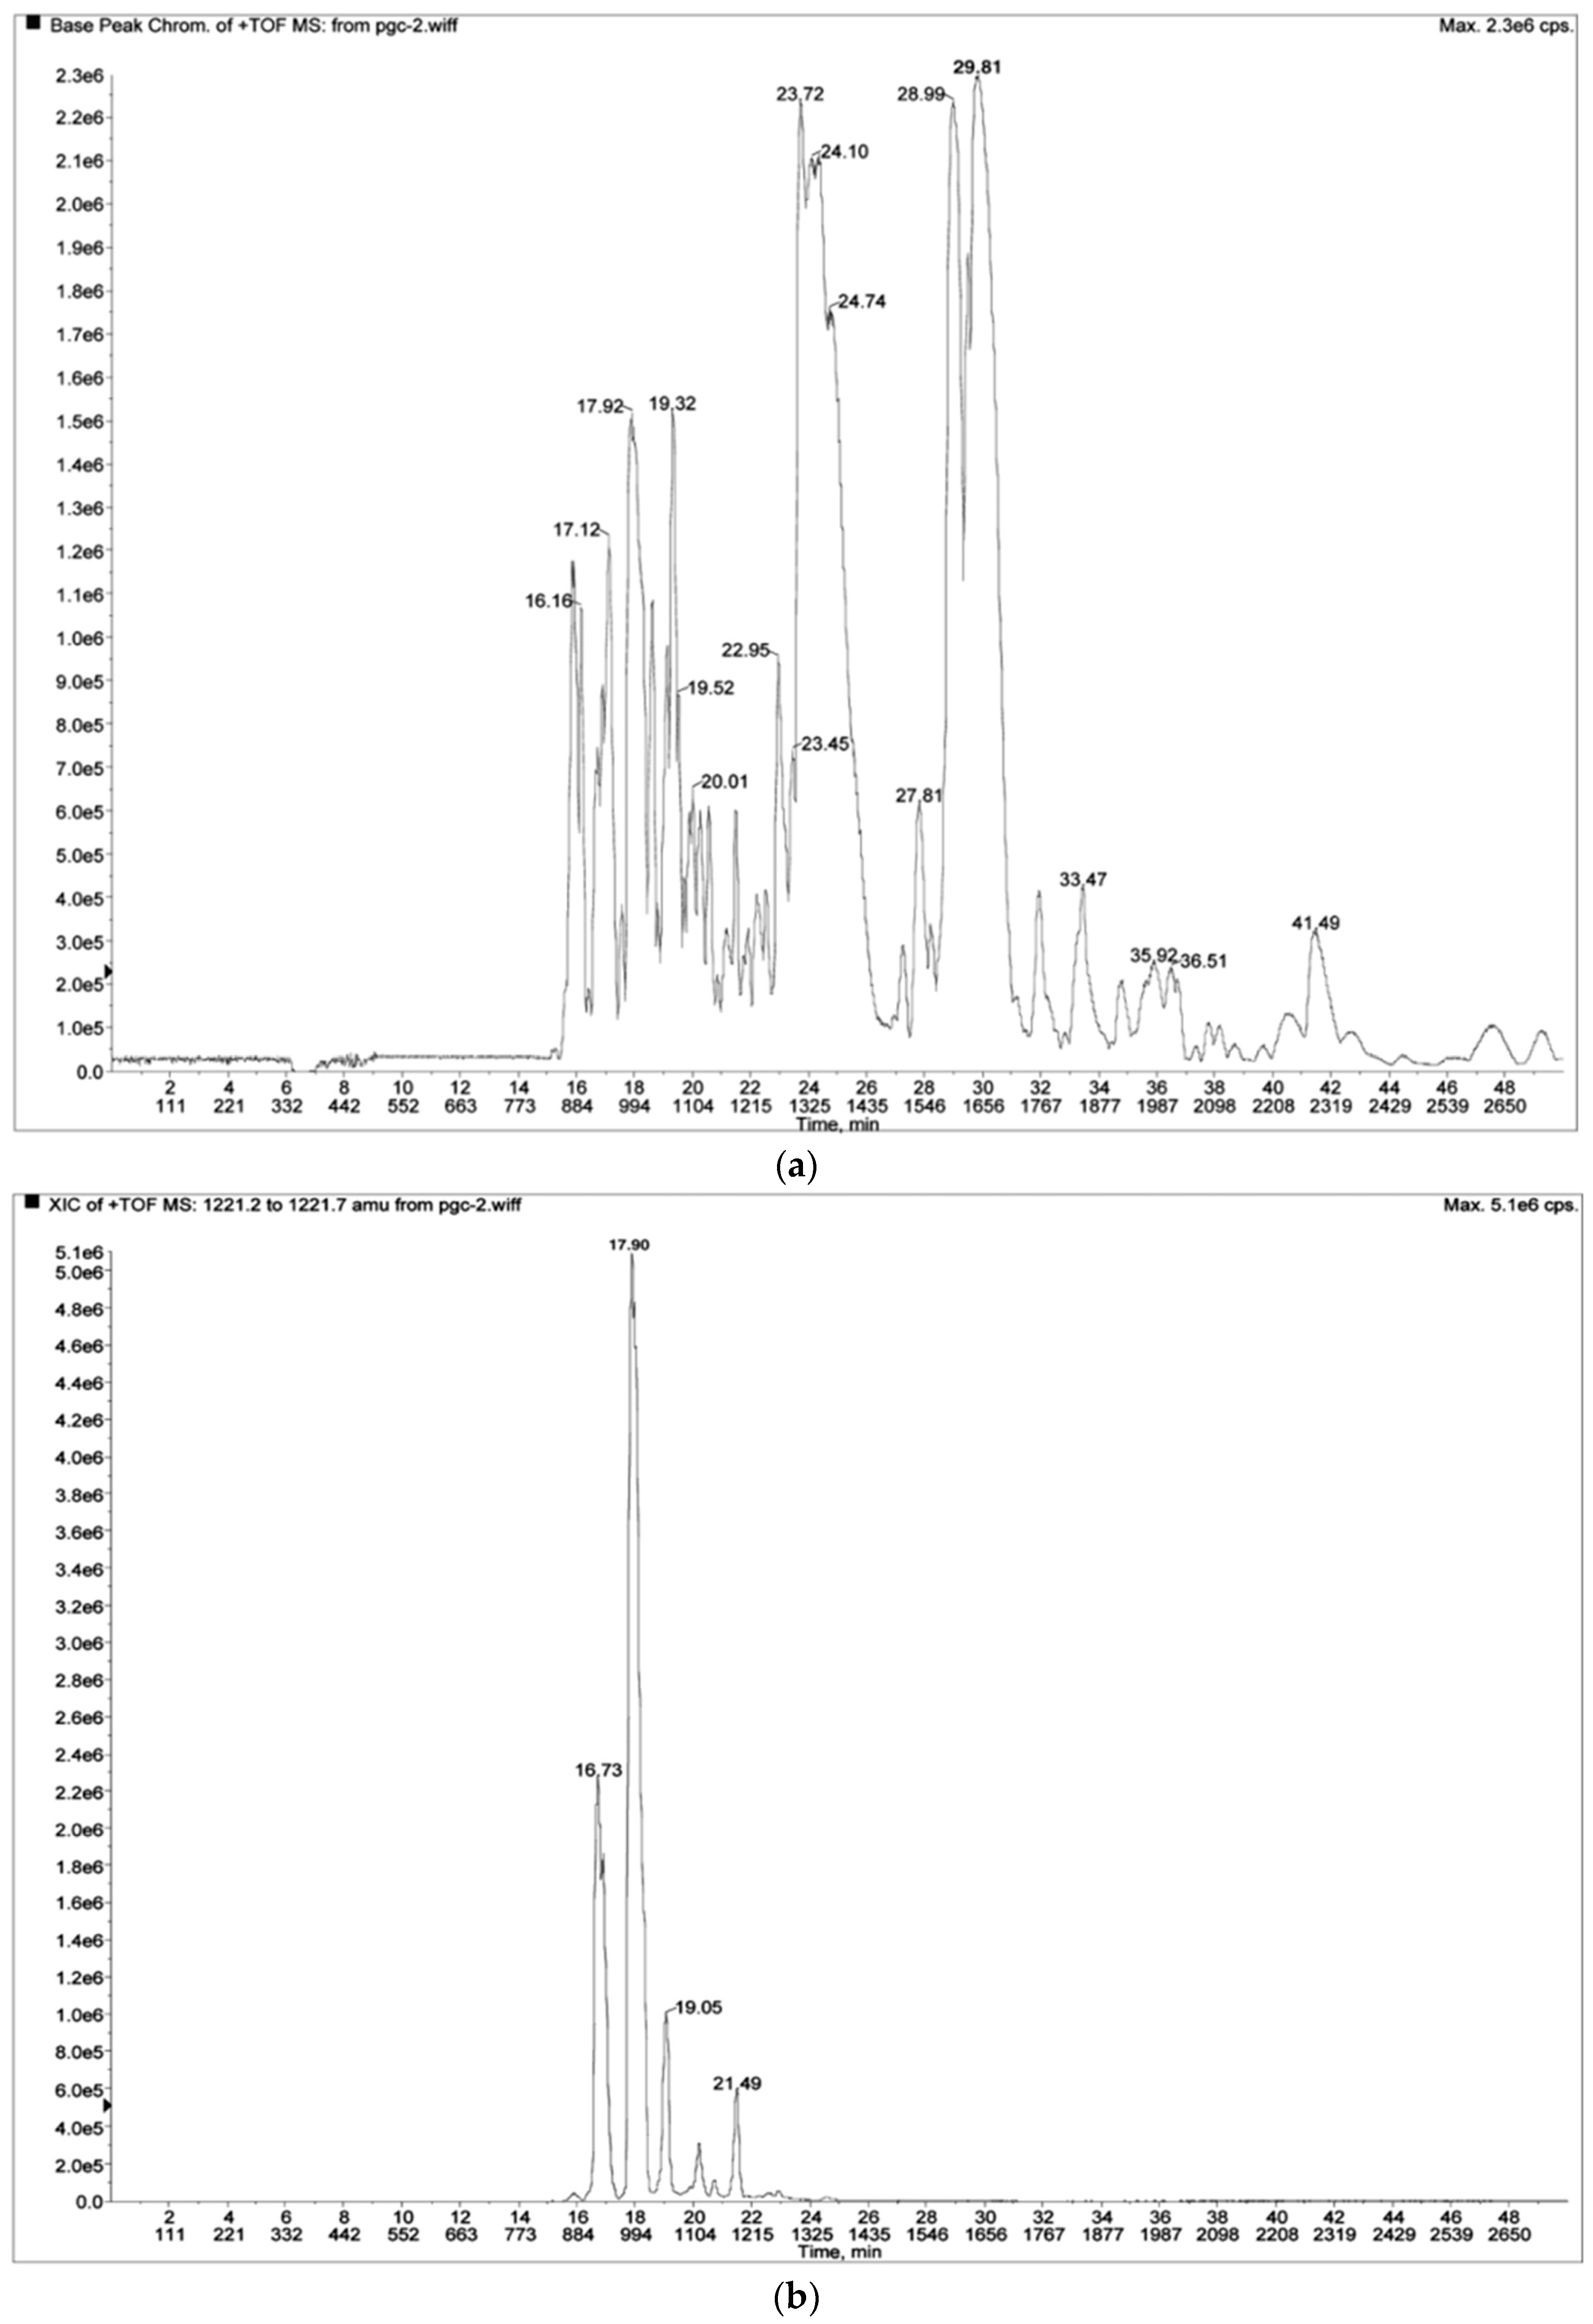
54]. In
Figure 10a, a base peak chromatogram of an HMO sample is shown [
50]. Although 97 HMO structures were identified [
50], these could not be identified from the base peak chromatogram. In
Figure 10b, extracted ion chromatogram for the ion at
m/
z = 1221.5 is shown [
50]. Several base-resolved peaks can clearly be distinguished. In
Table 3, the data for all 8 related isomers is shown [
50]. Taken together, the data indicate that 7 peaks were baseline resolved, while only 2 isomers practically coeluted, at
Rt = 16.78 and 16.87 min, respectively, but could be identified based on a detailed look at the LC-MS data. In general, some HMOs may coelute, and some isomers may be poorly resolved, but with
m/
z data available, 200–300 HMOs can be easily identified in a single LC-MS run [
7,
8], based on previously
m/
z and
Rt constructed tables with identified HMO structures, such as
Table 4 [
7]. In conclusion, nanoHPLC Chip/TOF MS approach using GCC for separation of HMOs, shows an excellent example of a successful interplay between MS and a modern LC separation technique for analysis of a very complex class of biomolecules, where isomeric structures represent a significant portion of the total analyte pool analyzed. Note however that this separation technique has still not been applied/modified for purification of HMOs, which is very important for the MS research field, both basic and applied.
5. MS Analysis of Lipids
Phospholipids and glycolipids represent a diverse class of lipids, and have been studied the most amongst lipids using various MS techniques over the last decade [
3,
4,
55,
56,
57,
58,
59]. MALDI MS/MS approach, using diagnostic precursor ion and neutral loss scans was shown to be highly efficient for analysis of biological lipid mixtures [
3]. LC-MS approach has been applied as well [
60]. Although LC-MS methodology has many advantages for analysis of complex biological mixtures, MALDI MS is advantageous for detailed MS/MS structural analyses. Lipids present unique challenges for MS/MS structural analyses. Position of C=C double bonds cannot be determined using the widely used CID (collision-induced dissociation) technique. Also, in order to identify structural isomers cleavage of “inert” C–C and C–N bonds in the lipid part are highly desirable. A novel MS/MS fragmentation technique, UVPD (ultraviolet photodissociation) excels in both these aspects [
55,
57,
58,
59].
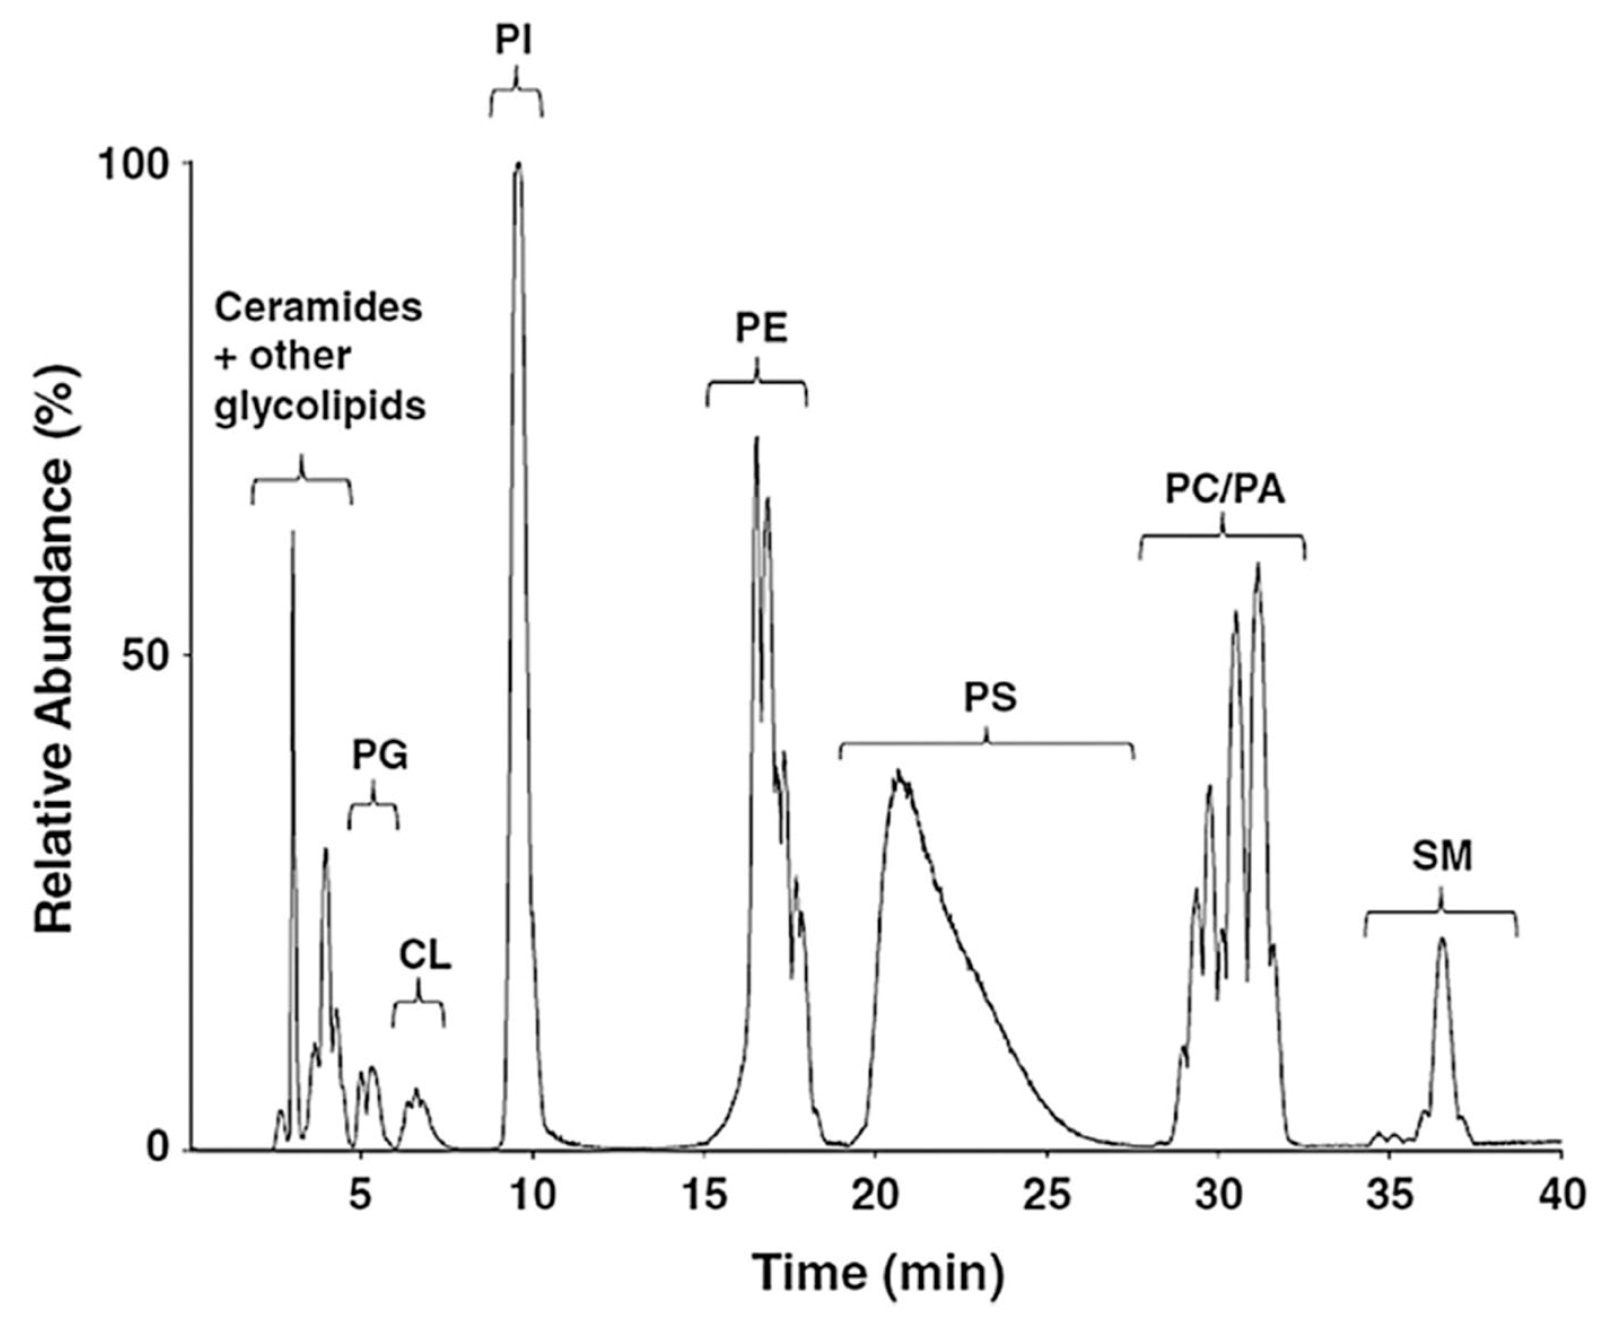
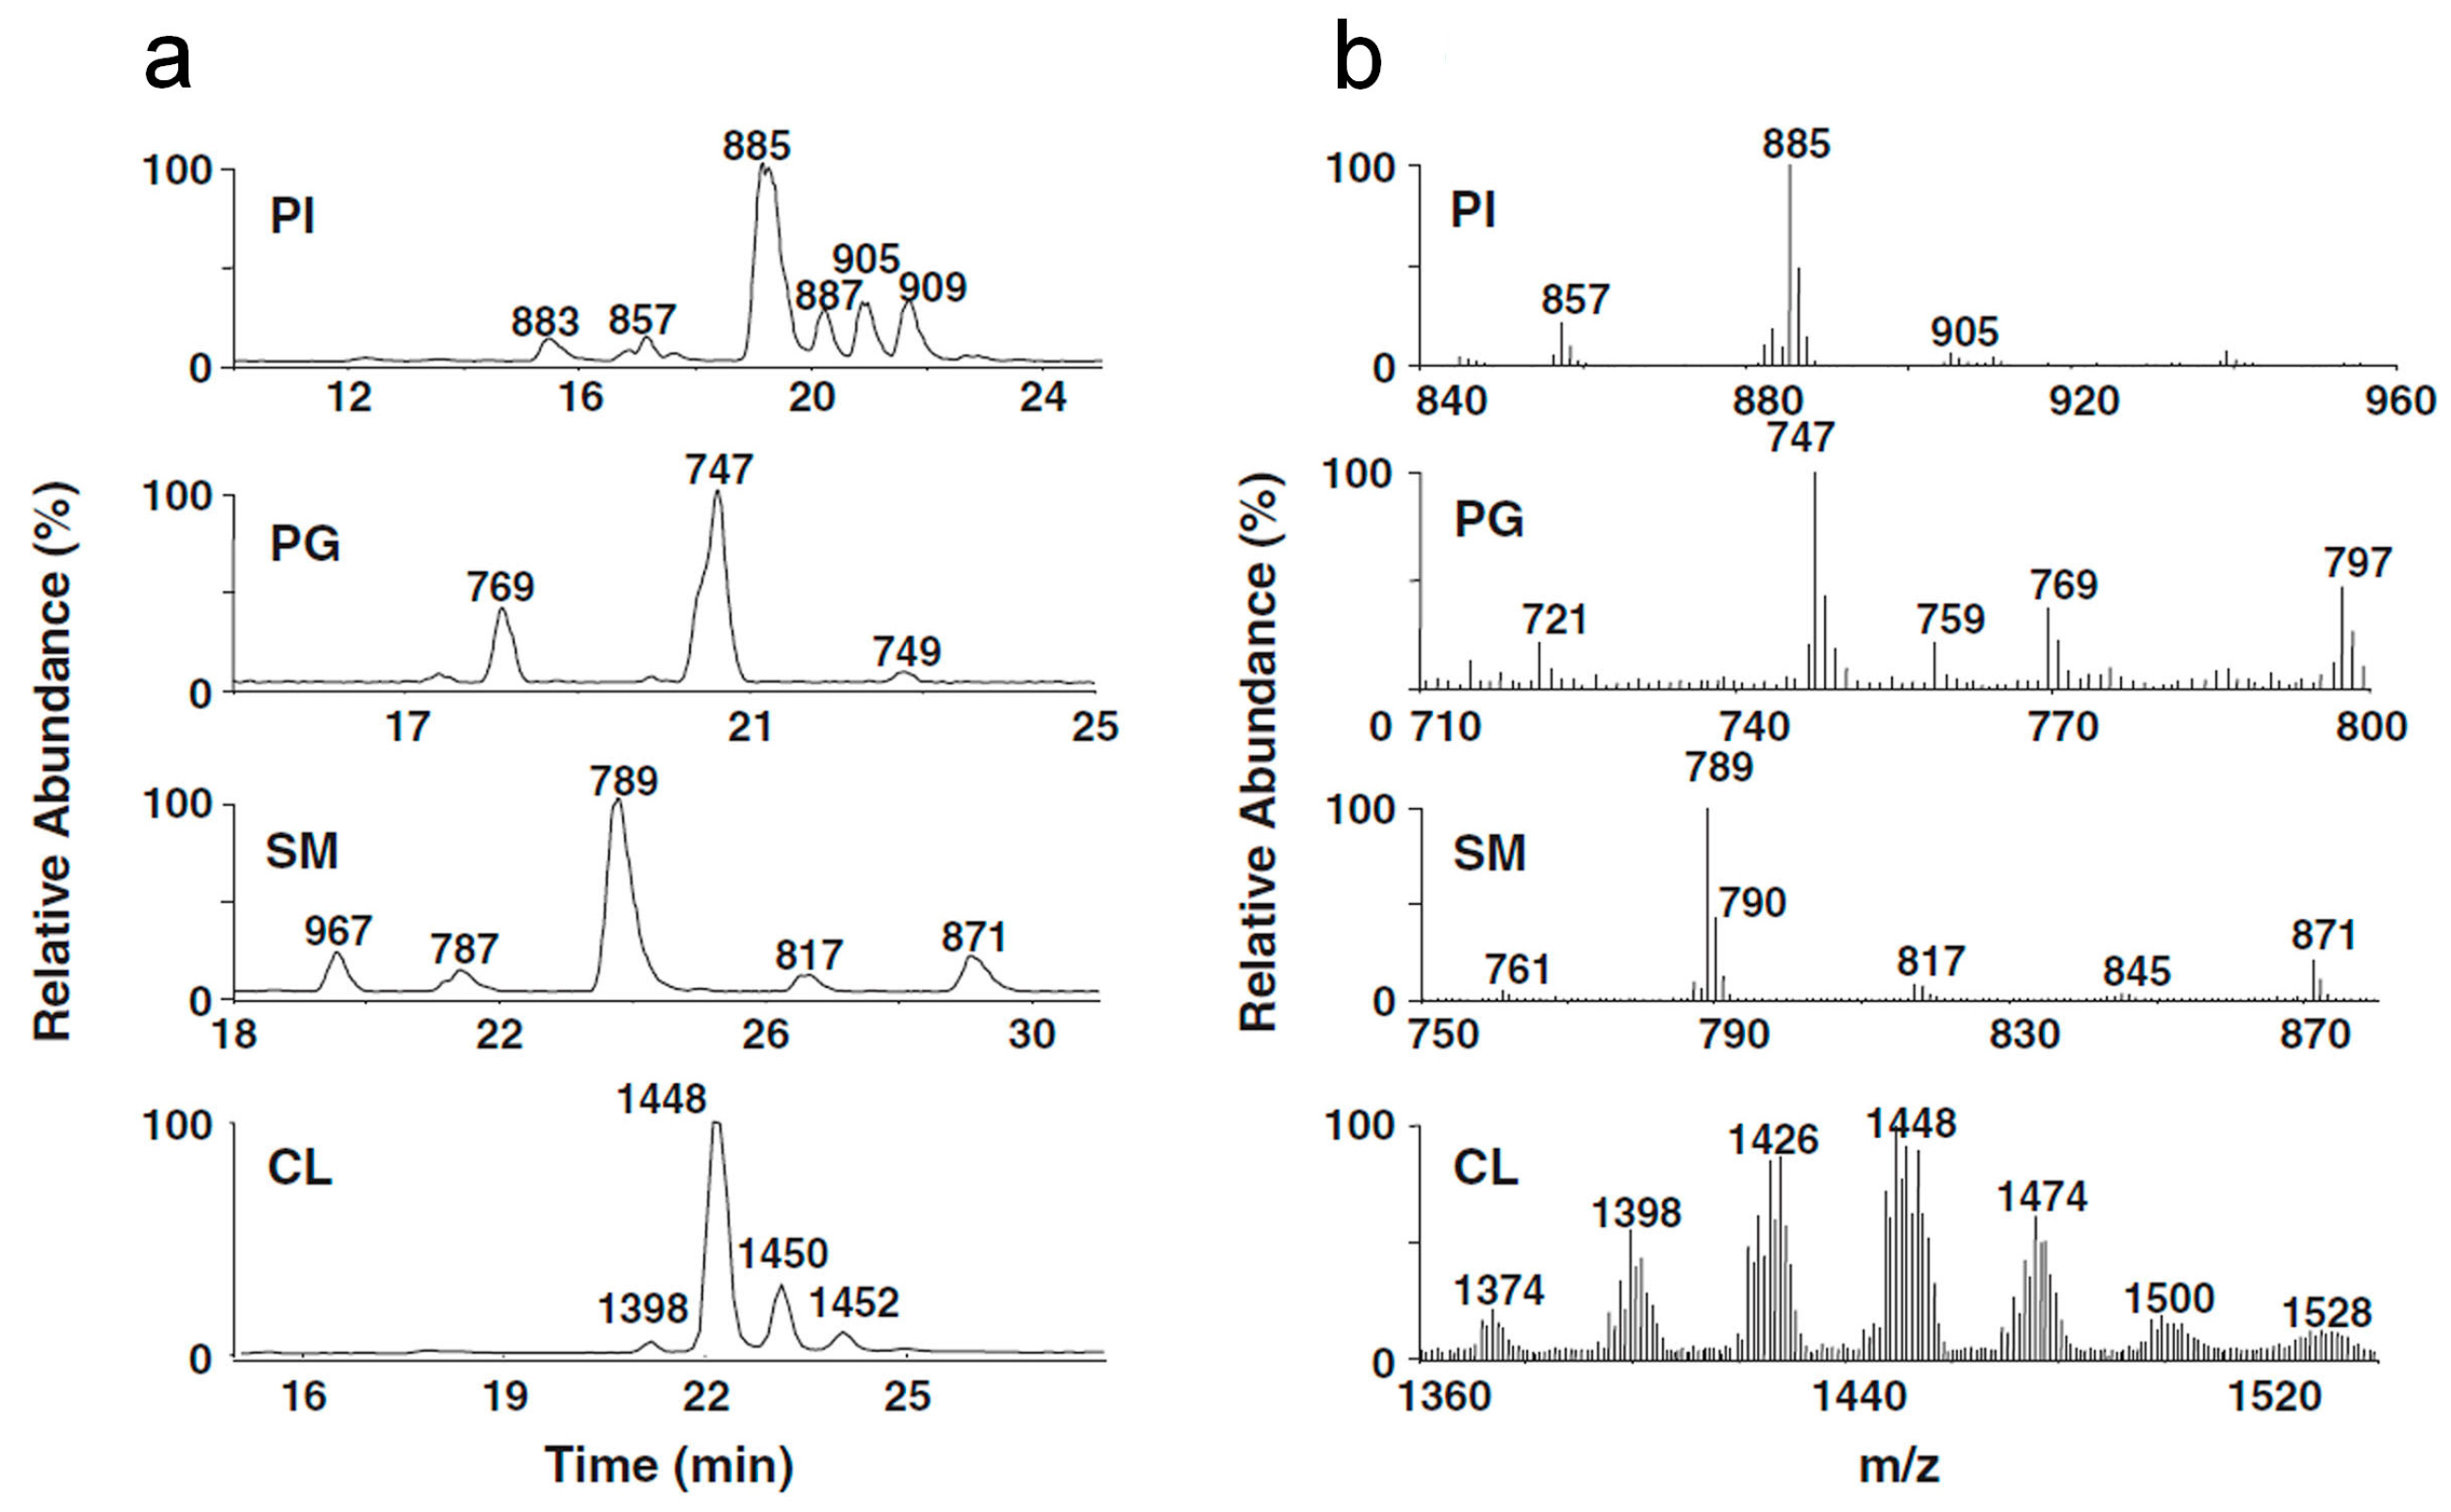
In a study shown in
Figure 11 and
Figure 12 [
60], 2D chromatography (normal-phase+reverse-phase chromatography) in combination with MS was employed. In
Figure 11, the first dimension chromatogram (normal-phase chromatography) is shown. Although various classes of lipids and phospholipids (ceramide/glycolipids, phosphatidylglycerols, cardiolipins, phosphatidylinositols, phosphatidylethanolamines, phosphatidylserines, phosphatidylcholines, phosphatidic acids and sphingomyelins were efficiently separated, individual lipids within those classes were either poorly resolved or not separated at all [
60]. Thus, a second dimension, using reverse-phase chromatography was employed, as shown in
Figure 12. In panel a, one can see that 6 phosphatidylinositols, 3 phosphatidylglycerols, 5 sphingomyelins, and 4 cardiolipins were efficiently separated and detected using MS.
With both MALDI MS/MS and LC-MS approaches being actively investigated, at the present time there is no golden standard for MS analysis of lipids. Both approaches are capable of identifying dozens-hundreds of lipids in a reliable manner, although they may yield additional complementary data when carried out simultaneously on the same sample. Ion mobility MS is being actively pursued in order to enhance lipidomic analyses as well, but with limited success so far [
61,
62,
63].
6. LC-MS Analysis of Polyphenols
Phenolic compounds include various plant metabolite structures, ranging from simple phenolic acids and phenyl alcohols, to very complex tannin structures [
2,
64]. Polyphenols represent one of the least favorable classes of biomolecules for structural MS analysis. For simple polyphenols, MS alone cannot always determine the position of key hydroxyl groups, nor stereochemistry of anomeric carbon atoms key for identification of many polyphenols. For complex polyphenols, appropriate MS/MS methods, which are typically a product of laborious basic MS research, are missing, and at the present time we cannot say how much can MS contribute in identification of large molecular weight polyphenols (5000–20,000 Da). While the LC-MS approach does simplify identification of polyphenols significantly, due to the efficient separation of various classes of polyphenol structural isomers, it often requires purified standards for assigning
Rt values to specific polyphenol structures, and these are not readily available, especially when novel polyphenols or their derivatives are detected in various plant/food samples. Thus, while the LC-MS approach excels in partial characterization of complex polyphenol mixtures [
2,
64,
65,
66], full characterization of all polyphenols and their derivatives detected using MS alone has not yet been attempted, unless simpler mixtures were analyzed. In order to achieve that, appropriate intra-laboratory databases have to be constructed [
67], which requires focus on one sample/plant type, respective standards and literature data.
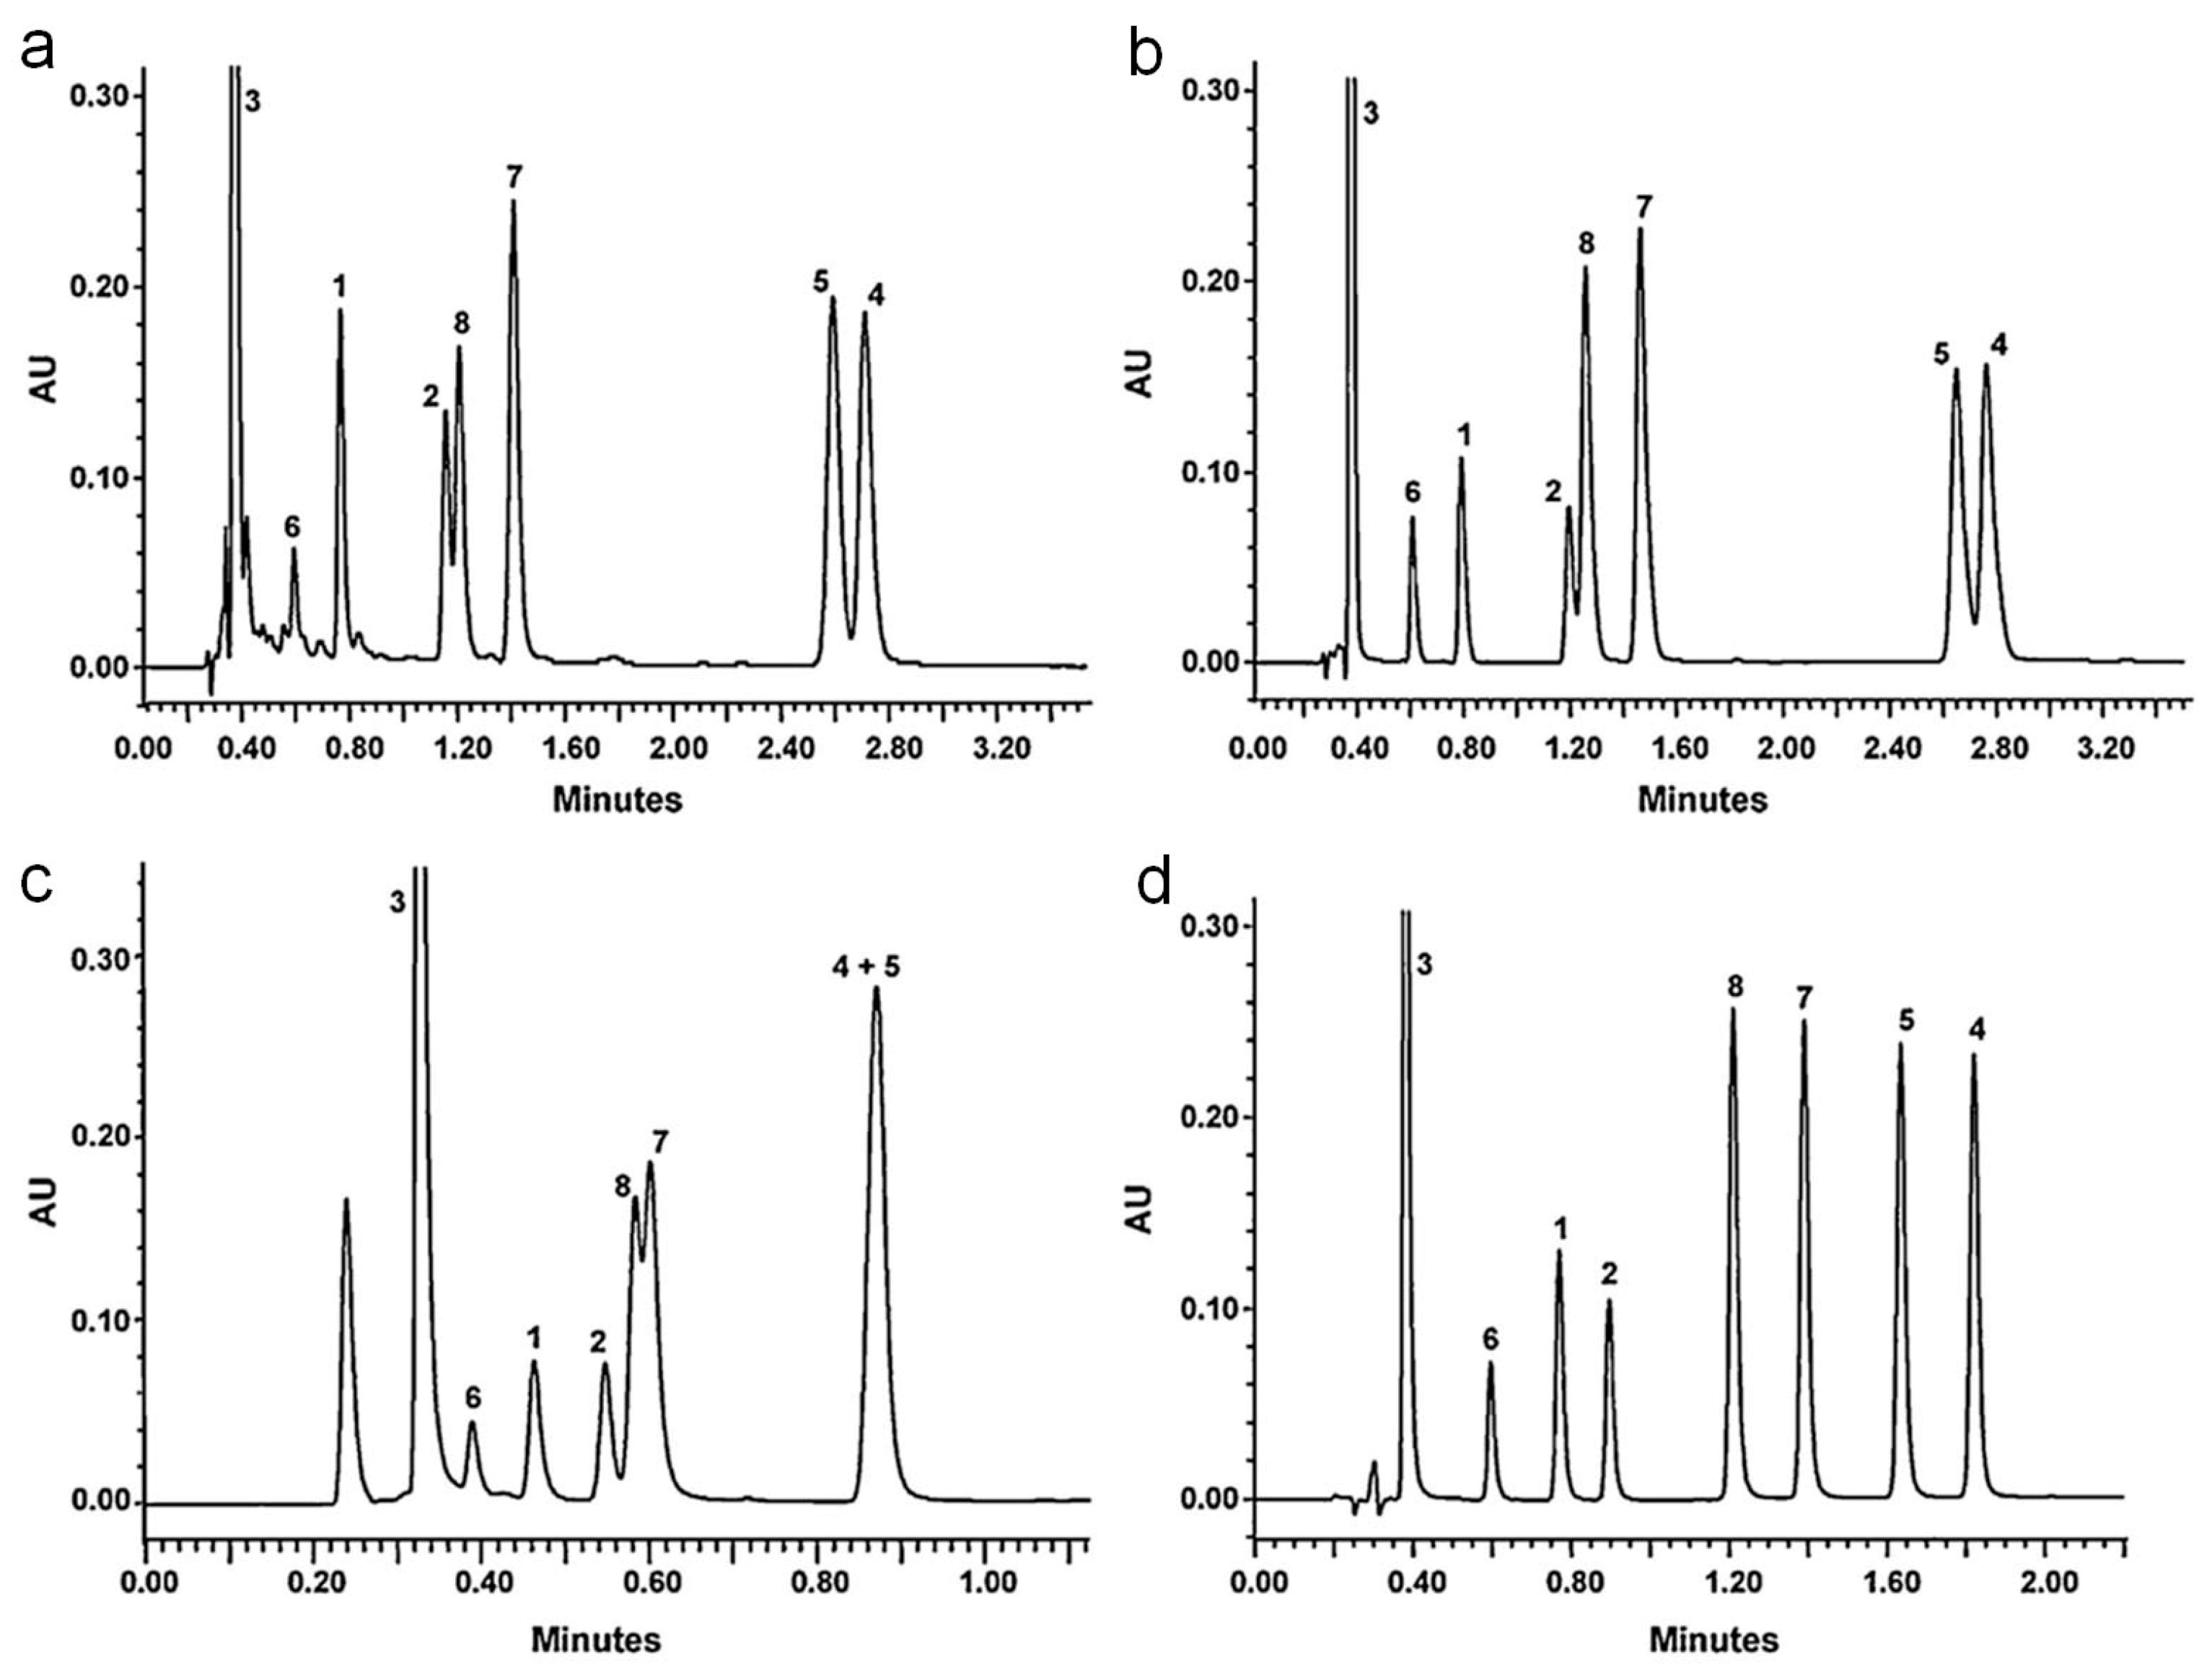
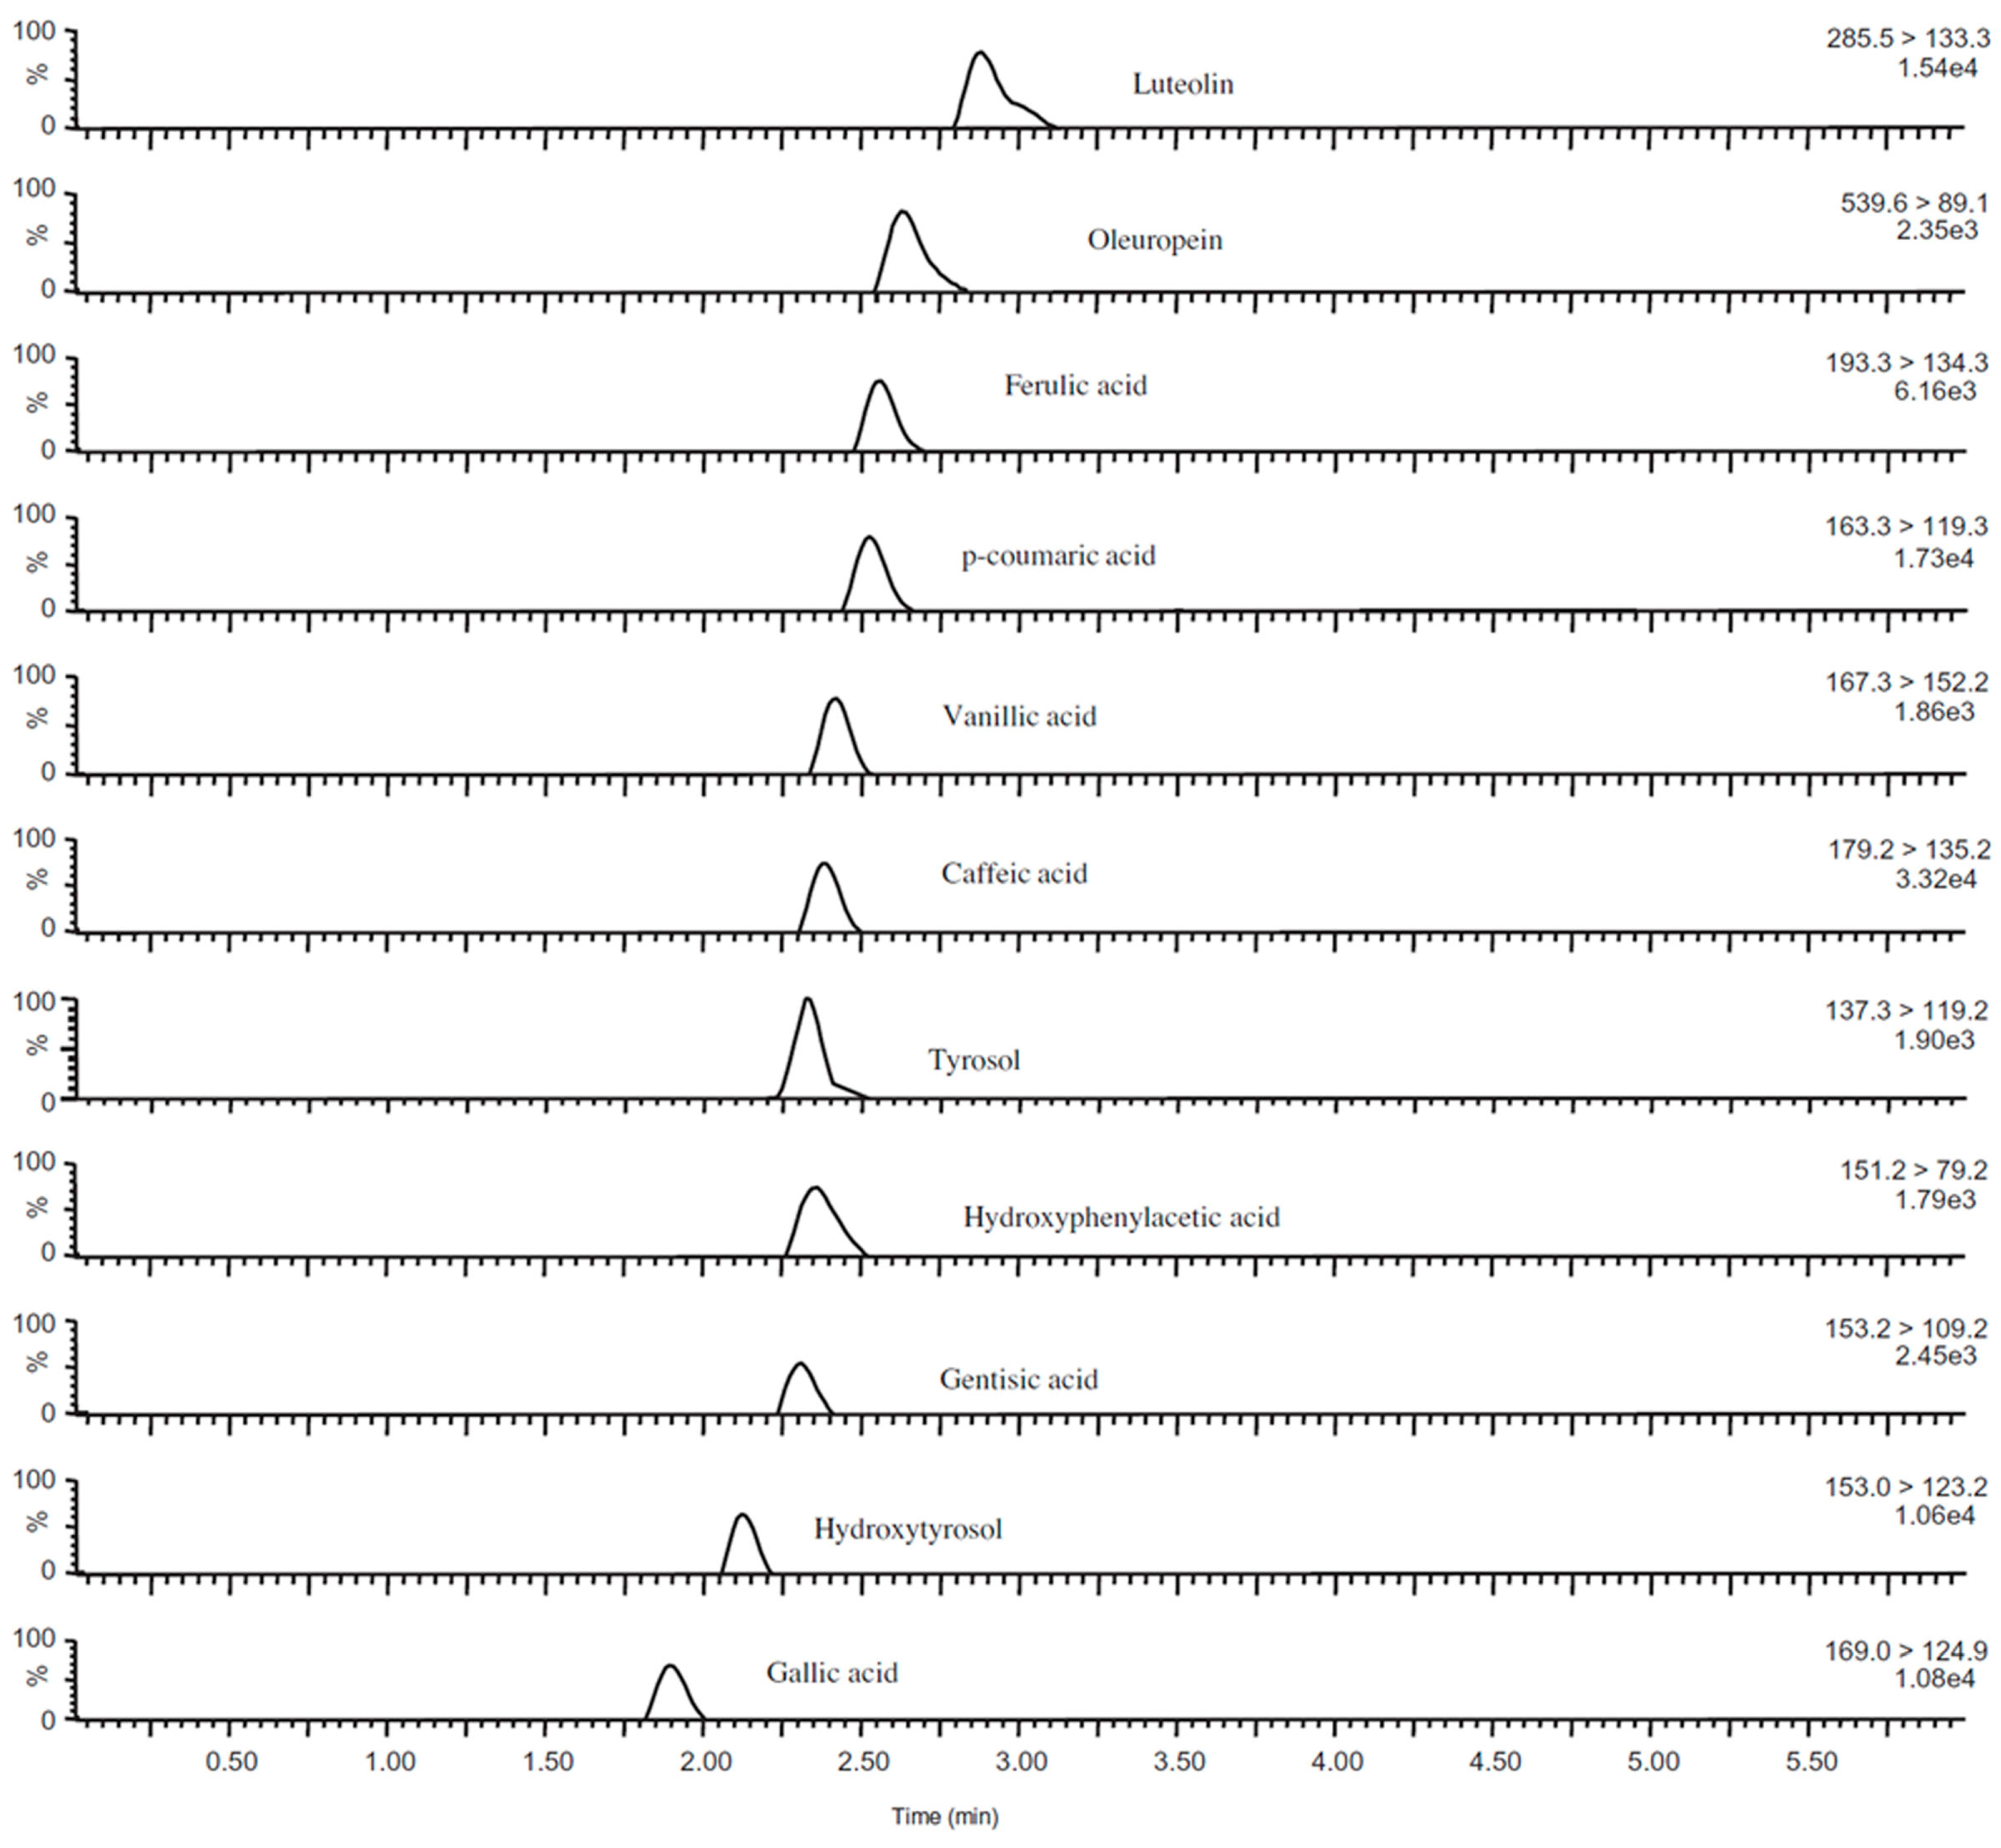
LC plays a pivotal role in LC-MS analysis of polyphenol mixtures. The polyphenol analysis field benefited highly from advances in HPLC column packings, and readily transitioned to UPLC (ultra performance liquid chromatography) columns as they became available, both due to increased resolution and shorter chromatography runs. In
Figure 13, 4 different RP (reverse-phase) columns (Acquity BEH C
18 (50 mm × 2.1 mm ID, 1.7 μm), Hypersil GOLD (50 mm × 2.1 mm ID, 1.9 μm), Acquity BEH phenyl (50 mm × 2.1 mm ID, 1.7 μm) and Acquity BEH Shield RP18 (50 mm × 2.1 mm ID, 1.7 μm)) were tested for resolving a simple mixture consisting of 8 flavanols (catechin, epicatechin, gallic acid, catechin gallate, epicatechin gallate, epigallocatechin, gallocatechin gallate, and epigallocatechin gallate) [
68]. Although better resolution can be achieved by optimizing the LC gradient as well as buffer compositions, in this example Acquity BEH Shield RP18 (50 mm × 2.1 mm ID, 1.7 μm) provided best resolution of the tested flavanols within a 2 min run. Choice of column is important for LC-MS analysis of polyphenols, due to importance of LC for identification of polyphenols and their derivatives using
Rt values, particularly when combined with MS data.
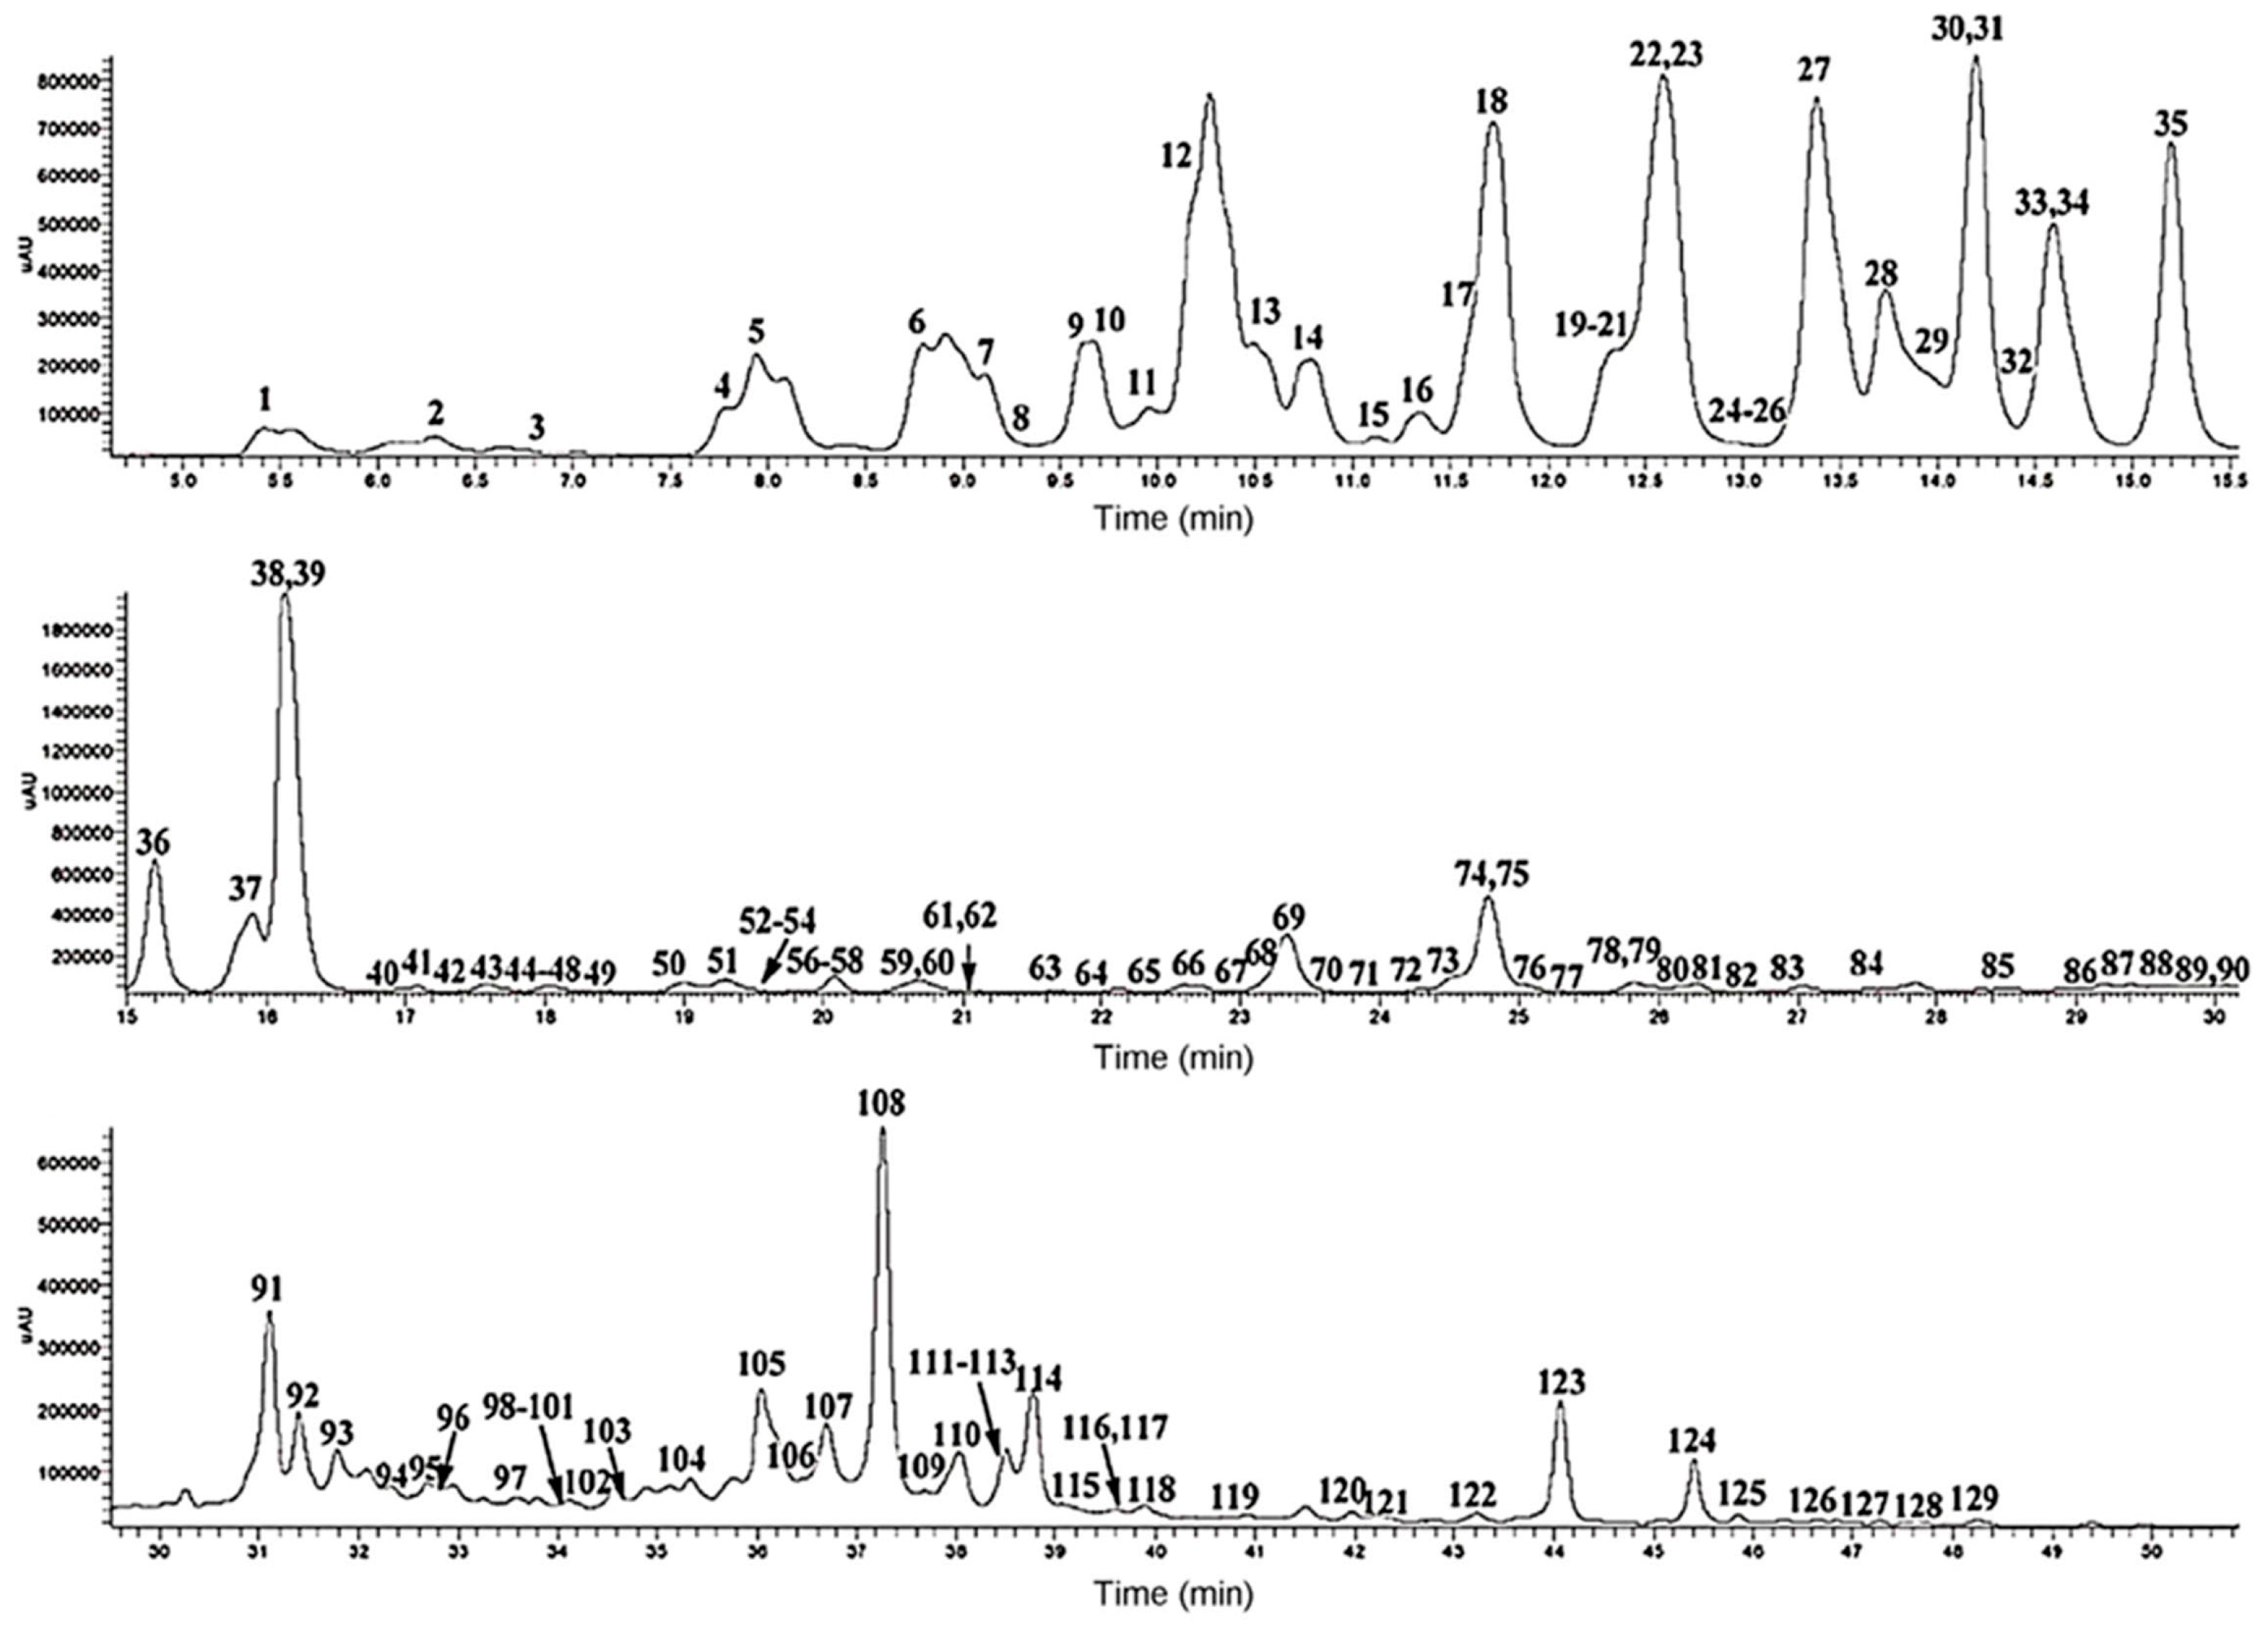
We will here provide one state-of-the-art example of LC-MS/MS analysis of a polyphenol sample [
67]. In
Figure 14, a UPLC-DAD (diode array detector) chromatogram at 330 nm is shown. In this study 67 anthocyanins, 102 flavonol glycosides and 40 hydroxycinnamic acid derivatives were identified [
67]. However, in order to do so, 200 phenolic standards and 400 food samples were screened, and the data for the identified compounds have been collected in a reference compounds database [
69,
70,
71,
72]. Using this optimum approach to this complex analytical problem, more than 100 polyphenols were reported in brassica vegetables for the first time, as expected [
67]. Detailed identification analyses were based on
m/
z and
Rt values, elution order, MS/MS data, as well as UV-VIS (ultraviolet–visible) spectra. Further identifications were made by comparing the UPLC-PDA-ESI/HRMS/MS
n data with those of reference compounds in the polyphenol database and in the literature [
67]. Thus the authors were able to identify 27 acylated cyanidin 3-sophoroside-5-diglucosides, 24 acylated cyanidin 3-sophoroside-5-glucosides, 3 acylated cyanidin triglucoside-5-glucosides, 37 flavonol glycosides and 10 hydroxycinnamic acid derivatives for the first time in brassica vegetables [
67]. Note that the 37 flavonol glycosides could not be identified using this approach, primarily due to lack of respective polyphenol standards. While flavonol core structure can be deduced based on UV-VIS spectra, and glycoside derivatives can be identified based on MS/MS data, identification of polyphenol aglycone structure and carbohydrate units attached cannot be carried out using UV-VIS and MS/MS spectra alone.
7. LC-IMS Analysis of Metabolites
Metabolites represent another numerous class of biomolecules, consisting of practically every non-major class of small organic and biomolecular compounds found in cells. They include, but are not limited to organic acids, aminoacids, purines, pirimidines, nucleosides, nucleotides, monosaccharides, peptides, neurotransmitters, coenzymes, vitamins, various lipids, hormones, etc. Metabolomics is a fast growing field, but will not be reviewed here. Instead, a brief overview of the utility of separation techniques in metabolomic analyses and challenges in related LC-MS analyses. In
Table 5, a partial dataset of a typical metabolomic experiment is shown [
73]. Metabolomic experiments are typically conducted in LC-IMS (ion mobility mass spectroscopy) setting, because collision cross-section (CCS) values are used together with
m/
z and
Rt data for reliable identification of metabolites from various databases (see
Table 5). The most commonly used databases are HMDB (Human Metabolome Database) [
74], METLIN [
75] and in-house databases. Typical tolerance parameters are ∆ppm < 10,
Rt range < 0.3 s and CCS < 5 Å
2 [
73].
IMS is a relatively new experimental technique. Although CCS data are valuable, they are of limited use depending on the class of biomolecules analyzed. Common issues are the accuracy of CCS measurements, inter-laboratory reproducibility, and different IMS techniques used between different manufacturers. In
Table 6, results of a comparison study obtained from three different laboratories on a same mass spectrometer (Synapt G2 HDMS, Waters Corporation, Manchester, UK). The data show good overall agreement between measured CCS values, although significant deviations ≥5 Å
2 can occur. Taken together, CCS values proved valuable for increasing the accuracy of database searches for identification of metabolites. Although more data is needed in order to correctly assess the state of IMS technology at the present time, general consensus is that further improvements, characterization, as well as standardization of IMS methodology is needed for most applications.
8. LC-MS Analysis of Peptides
Peptides represent an important class of biomolecules due to the fact that proteins are commonly proteolyzed in “bottom-up” MS approaches, were the resulting peptide mixtures are analyzed using MS and MS/MS techniques. Although individual peptides represent a relatively simple analyte for MS (assuming they ionize well, and their respective protein sequences are known), there are several significant challenges in most proteomic studies when cell lysates are proteolyzed; (i) the resulting peptide mixtures can contain anywhere from 100,000 to >1,000,000 peptides [
5], (ii) peptides with posttranslational modifications often represent a technically more challenging analyte, particularly in LC-MS analyses, and (iii) bioinformatic analysis of LC-MS data is often complex, particularly in quantitative studies and when PTM sites (on proteins) have to be identified [
5,
16,
21,
76].
Again, the LC-MS approach is the most widely used in proteomic analyses, particularly since MALDI MS of cell lysates is not possible/feasible. Proteomic LC-MS analyses are significantly different from LC-MS analyses of other classes of biomolecules. First, identification of the detected peptides is rarely an issue, at least for biomedical samples. Second, while most other biomolecular sample mixtures consist of ~100–1000 biomolecules or less, peptides are often present in a range from 100,000 to >1,000,000 in sample mixtures. Third, the databases with Rt and m/z values do not exist for peptides. Instead, proteomic databases contain primary structures of all proteins present in a defined organism. MS/MS analysis of peptides (linear aminoacid polymers) is straightforward, unlike structural characterization of other biopolymers (branched oligosaccharides) and their conjugates, such as glycolipids and glycopeptides, or small biomolecules such as lipids, polyphenols and metabolites. Major challenges in proteomic analyses are the coverage of proteome, the coverage of identified proteins, and identification of PTM sites.
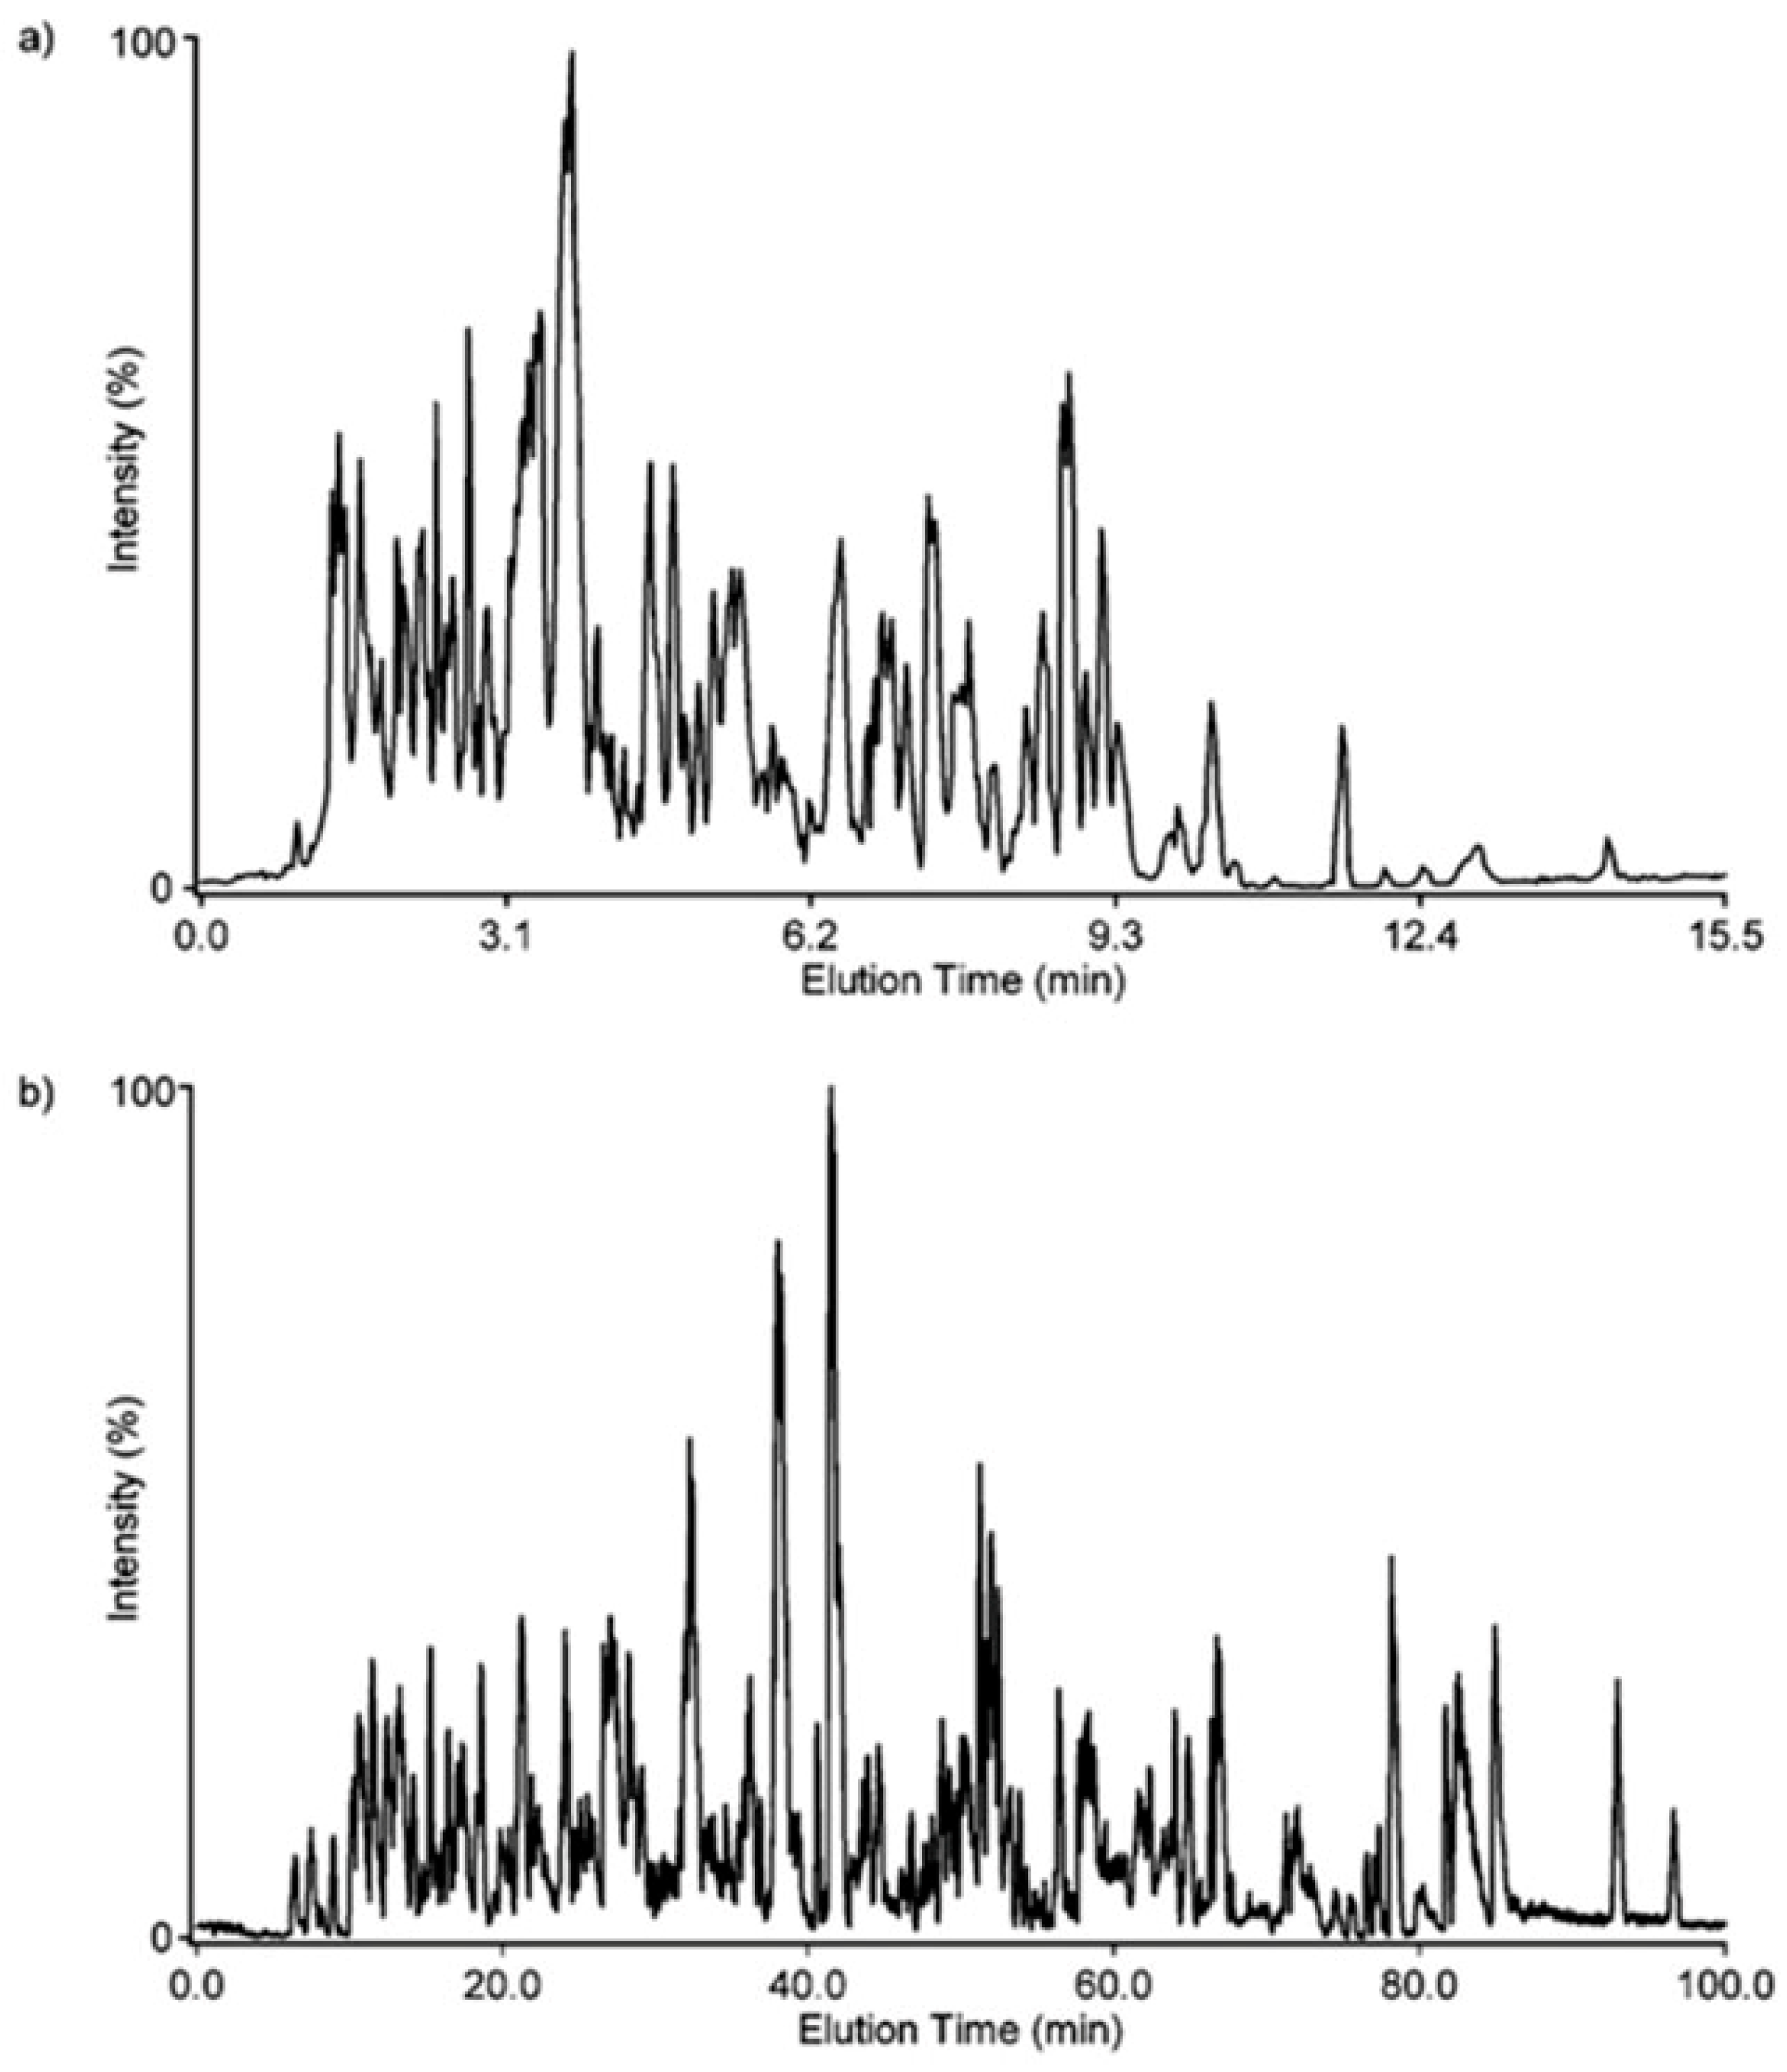
In
Figure 15, a key problem related to LC-MS analyses of peptides is shown. In this experiment, mouse plasma sample was spiked with 20 standard peptides [
9]. In a 15.5 min gradient, 13 out of 20 peptides were detected at concentrations ≥100 ng/mL [
9]. Increasing the length of the gradient to 100 min resulted in only a minor improvement, were 14 out of 20 peptides were detected at concentrations ≥100 ng/mL [
9]. Thus, it is easy to deduce that the length of the gradient cannot solve the problem of proteome coverage in LC-MS experiments, where 100,000 s of peptides are present in the sample mixture. Technical problems related to LC-MS analyses of peptide mixtures are (i) poor ionization properties of some peptides; (ii) suppression of ionization of coeluting peptides; and (iii) time available for MS/MS experiments on a timescale available during LC-MS runs, particularly for coeluting peptides and for detailed PTM structural analyses. Nevertheless, >10,000 proteins can be identified with a 200 min gradient [
77].
Since proteomic analyses are commonly carried out today, the market potential for proteomic-related kits and accessories is huge. Accordingly, a large number of useful kits are available to MS researchers. Of primary importance are desalting kits or ZipTips (Merck Millipore, Billerica, MA, USA). ZipTips are essentially pipette tips that contain a C18 chromatographic bed suitable for desalting small peptide sample volumes (1–10 μL). Similarly, IMAC (immobilized metal affinity chromatography) and TiO2 (Pierce, Thermo Fisher Scientific, Waltham, MA, USA) resins are available for selective enrichment of phosphopeptides from peptide mixtures. Additionally, for quantitative analyses, 4plex and 8plex iTRAQ reagent kits are available (Sciex, Framingham, MA, USA). There are other proteomics-related kits available as well, but they are aimed at proteins, rather than peptides themselves.
9. MS Analysis of N-Glycans and N-Glycopeptides
Glycopeptides represent the most complex class of small biomolecules that are reviewed here. Aside from the analytical problems related to the separation and analysis of glycans, the additional challenges in analysis of glycopeptides are: (i) presence of the peptide backbone, (ii) identification of glycopeptides (typically mixed with peptides), (iii) identification of glycosylation sites, (iv) identification of glycan structures, and (v) characterization of microheterogeneity of glycosylation. Negative ion mode MALDI MS/MS has been successfully applied for analysis of
N-glycopeptides [
78]. MALDI MS allows detailed MS/MS characterization of small biomolecules, but it lacks efficient separation of isomers capability. Thus typically less complex mixtures (either prefractionated mixtures or samples containing smaller number of glycopeptides) can be successfully analyzed with MALDI MS. On the other hand, LC-MS excels in separation of structural isomers, but is suboptimal for detailed MS/MS structural analyses. Therefore
N-glycans are often released from the peptide backbone prior to LC-MS analysis. In both cases, bioinformatics is crucial for data analysis, as will be discussed later. For LC-MS analyses, porous graphitized carbon (PGC) chromatography represents again the method of choice for separation of
N-glycans [
79].
In
Figure 16, extracted compound chromatograms show elution profiles of human (
Figure 16a) and bovine (
Figure 16b) milk
N-glycans, with putative glycan structures assigned [
79]. In this example 38
N-glycan compositions were assigned for the human milk
N-glycan pool, while 51
N-glycan compositions were assigned for the bovine one [
79]. Taking into account isomeric structures, over a hundred compounds were present in both mixtures [
79]. The biggest drawbacks of LC-MS analyses of released
N-glycans are twofold: (i) loss of information about
N-glycosylation sites on proteins from which the
N-glycans were released; and (ii) loss of information about
N-glycosylation microheterogeneity patterns on
N-glycosylation sites on respective proteins. This information can be obtained using MALDI MS/MS approach, as shown in
Figure 17, on example of bovine lactoferrin [
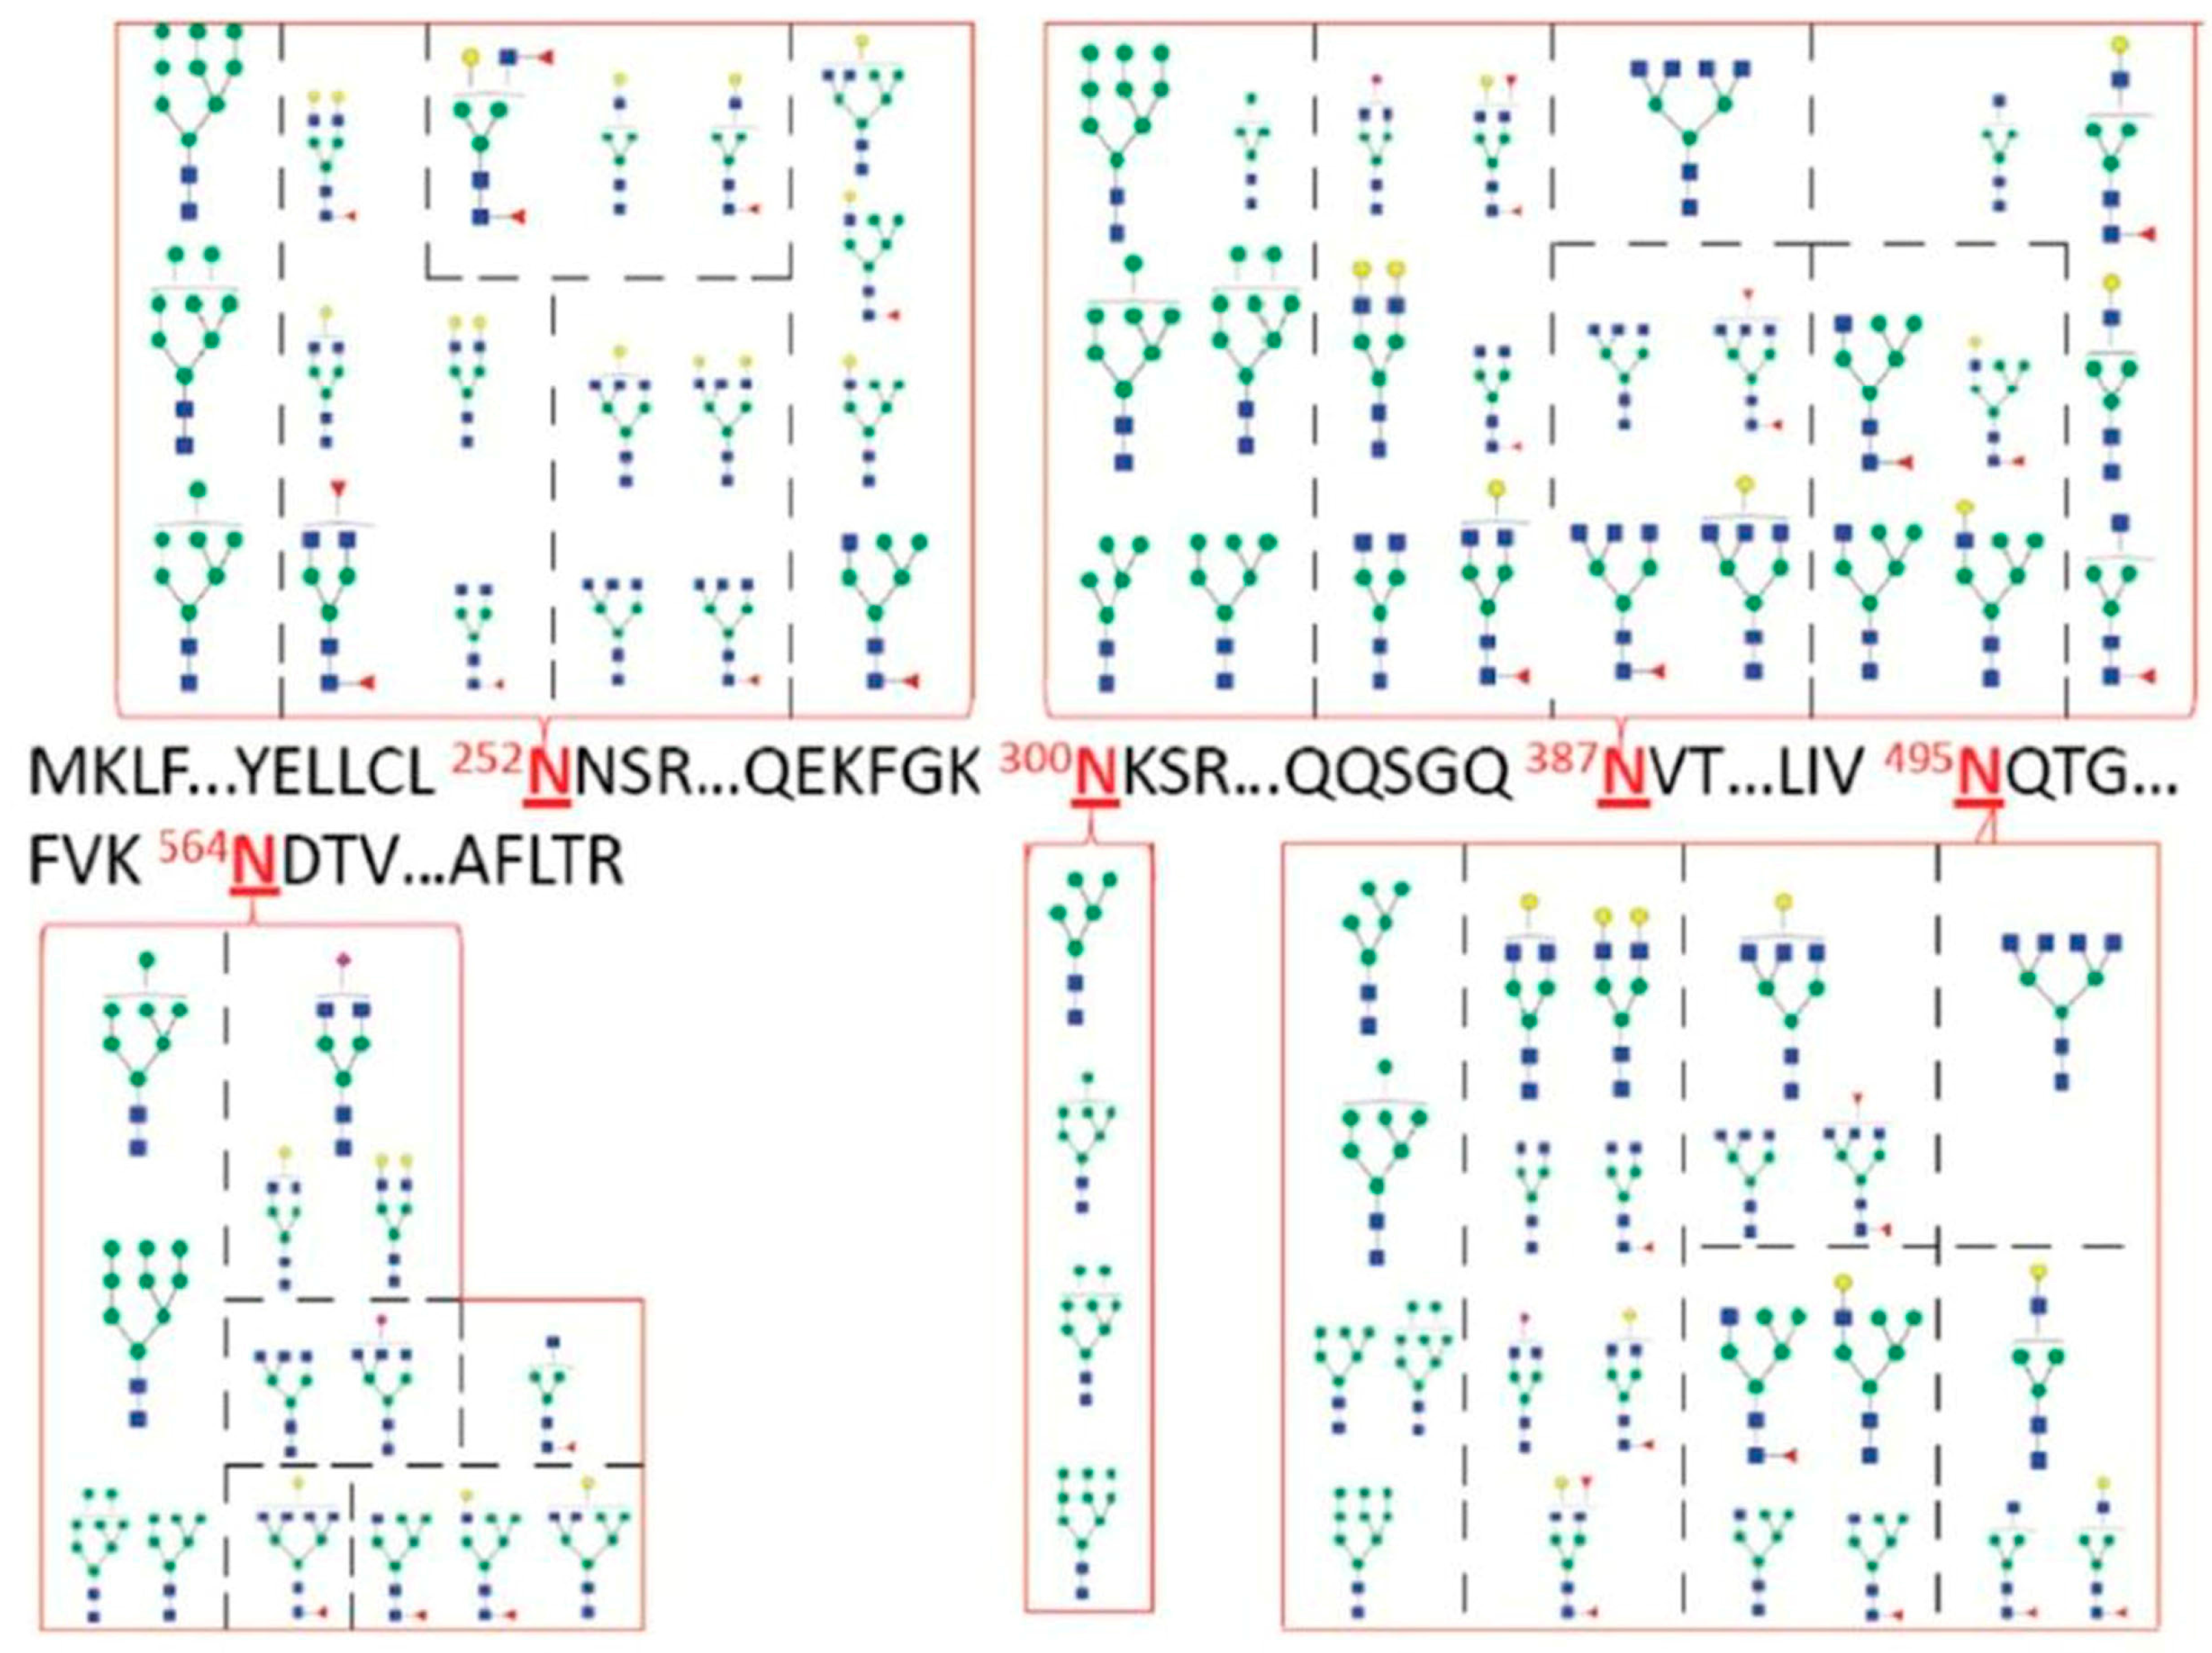
78]. Such glycoprotein samples are extremely complex to analyze using MS, especially when present in complex glycoproteomic sample mixtures. The most complex analytical challenge is the heterogeneity of
N-glycosylation, as depicted in
Figure 17. Thus, the ability to effectively separate either
N-glycoproteins or
N-glycopeptides represents state-of-the-art separation challenge for glycoproteomic and glycobiology fields.
10. Mass Spectroscopy and Bioinformatics in LC-MS Analyses of Biomolecules
There is no doubt that LC-MS/MS represents the method of choice for the analysis of complex mixtures of small biomolecules. This has been long true for peptides [
80], while the respective methods have been extensively refined over the last decade for glycans [
14,
15,
22,
52], and lipids [
81]. Aside from efficiently dealing with separation of isomeric structures, LC is not hindered with small amounts of salts, detergents or buffers. A great bonus is providing
Rt values for known (previously characterized) biomolecules, which can make LC-MS data analysis fast and simple via a database search, at least for routine analyses. Thus very complex mixtures of biomolecules can be readily analyzed, without extensive separation/fractionation of starting material.
However, high-throughput LC-MS or LC-MS/MS analyses have a price—the availability of necessary bioinformatic tools for dealing with many aspects of LC-MS data analysis. MS is known to require bioinformatic tools for structural analysis of MS/MS data at any appreciable speed. These tools vary in complexity, as well as availability for each class of biomolecules. Often, in-house built software routines are necessary for efficient qualitative and quantitative analyses of LC-MS data [
7,
8,
51]. Simple scripts typically deal with peak alignment between multiple LC-MS runs, auto peak search, glyco-peak search, glycopeptide-peak search, lipid-peak search, etc. Medium level software tools deal with database creation for the class of biomolecules of interest [
7,
8], as well as identification of biomolecules present in the database based on
m/
z and
Rt values from LC-MS runs [
15]. In addition, these compound databases may contain MS/MS data as well. Finally, quantitation routines often need to be scripted as well, and their complexity varies on quantitation method used. For simpler tools, scripting languages such as Python are sufficient. LC-MS vendor’s software packages should be fully exploited, such as MassHunter (Agilent Technologies, Santa Clara, CA, USA). Additional commercial software is often required, such as Personal Compound Database and Library (PCDL) for generating a library of structures characterized by tandem MS [
22].
There are several practical issues that are important regarding the use and development of essential bioinformatic tools for LC-MS analyses: (i) the availability of specialized and experienced bioinformatic personnel; (ii) the availability of expensive commercial software packages; (iii) updating, curating and bug fixing of in-house built software tools; (iv) inter-laboratory (in)compatibility of in-house built tools, etc. While these issues do not represent a serious obstacle for basic research groups that develop LC-MS methods for specific classes of biomolecules, they do represent a key obstacle towards dissemination of state-of-the-art LC-MS/MS methodologies in various applied research fields.
11. Mass Spectroscopy in Bypassing Fractionation/Purification for Structural Analytical Studies of Complex Mixtures of Small Biomolecules
We have shown previously how MS, particularly when combined with LC—either in form of LC-MS or LC-MS/MS—can be used efficiently for both qualitative and quantitative analyses of complex mixtures of small biomolecules, without the need for extensive fractionation or purification of individual mixture components. Two main MS methods have been successfully employed for structural analyses of such mixtures: (i) MALDI MS and (ii) nanoESI-LC-MS. Although more limited compared to LC-MS, MALDI MS has been shown to be capable of analyzing very complex mixtures of small biomolecules, such as glycopeptides [
78] and lipid extracts [
3]. While the data analysis part of these analyses is inherently more complex, especially when isomeric structures are present in the sample, they do not require an extensive set of bioinformatic tools which LC-MS analyses rely on. MALDI MS also allows plenty of time for detailed MS/MS structural analyses. On the other hand, LC-MS analyses are more popular, because they provide the
Rt value, crucial for quick identification of previously characterized biomolecules, and can typically easily baseline separate isomers. Additionally, they provide extensive separation of biomolecules in the course of a 30–45 min experiment, which provides better coverage of more complex mixtures, as well as allows some time for accompanying MS/MS experiments as well. However, heavy reliance on a whole set of bioinformatic tools makes them more difficult to adopt outside of basic MS research laboratories. Nevertheless, both MALDI MS and nanoESI-LC-MS allow a highly efficient bypass of extensive fractionation/purification of complex mixtures of small biomolecules today, although this would significantly enhance many structural MS analyses.
In effect, LC-MS methods are highly sought and are being implemented whenever possible in many laboratories across the world. However, in almost all cases, these methods are good only for analytical purposes, and analogous preparative methods either do not exist or have not been implemented so far. The major reason for that today is perhaps that the number of research groups in respective fields (such as glycomics and lipidomics) is too small for the respective commercial industries that need to be developed to become profitable. Nevertheless, the need for development of state-of-the-art separations techniques for commercial purification of glycans, glycopeptides, lipids, etc. is in high demand today.
12. Purification and Separation of pmol Amounts and Microliter Sample Volumes
There are several research topics that require purified compounds. First and foremost are functional studies. Although structural characterization LC-MS studies of many (if not most) biomolecular mixtures revealed that single compound functional analyses might not be sufficient in many cases, due to microheterogeneity issues (particularly when glycans are involved), purified compounds must be available in order to study their function, as well as to prepare defined biomolecular mixtures of (much) more limited complexity. For MALDI MS, purified compounds are necessary first and foremost because they have a defined biochemical structure. Thus they can be used for method development and particularly for validation purposes. Although MALDI MS typically relies to a certain degree on separation techniques, especially for quantitative analyses, in many instances MALDI methods can be developed for both qualitative and quantitative analyses of mixtures of limited complexity. However, in order to be able to develop and validate such advanced methods, purified biomolecules (standards) are needed. Second important property of commercially available purified compounds is their known amount. Thus, appropriate calibration curves/mixtures may be constructed for advanced MALDI MS studies as well [
82,
83]. Although LC-MS combined with bioinformatic tools represents a state-of-the-art screening tool, state-of-the-art MALDI MS methods are more appropriate for detailed structural characterization of previously uncharacterized biomolecules. For example, nanoHPLC Chip/TOF MS approach is excellent for rapid-throughput screening of HMO samples for identification of HMO structures present in the database [
7,
8], but negative ion mode MALDI MS of derivatized HMOs, in combination with use of specific exoglysidases is necessary for structural characterization of novel HMO structures [
84].
Prior to the widespread use of LC-MS, traditional liquid chromatographies were used, and MALDI MS provided excellent support for analysis of obtained chromatographic fractions [
46,
47]. However, these chromatographies used huge amounts of samples compared to what is required for MS analysis and compared to what cutting-edge basic biomedical research can provide. The separation techniques available today are theoretically capable of separating complex biomolecular mixtures, leaving technical issues to be dealt with in order to purify these compounds on a larger scale. Solid phase extraction (SPE) cartridges exist today for desalting of most biomolecular samples. PGC column material is excellent for separating carbohydrates. C
18 cartridges could certainly efficiently separate many lipids. Two most popular ZipTip pipette tips contain C
18 and IMAC (immobilized metal affinity chromatography) resins and are efficient for desalting (and even partial fractionation) of small sample amounts present in 1–10 μL volumes. POROS
TM chromatography resins can be used for home-made chromatography columns of variable size. However, interlaboratory reproducibility may be low, and thus commercially available standard kits may be either preferred or required, depending on the application in question. Taken together, reproducible scaling (most often for 10 fmol, 1 pmol and 100 pmol sample amounts) is one common issue for separation techniques in the field of small biomolecules, since they would require a separate set of techniques and accompanying materials.
A separate set of technical issues is related to purification of individual biomolecules. First of all, there are hundreds, if not thousands of potentially interesting biomolecules today worth studying. Second, the market is small, leading to discontinuation of some already available standards (purified compounds) or disappearance of the industrial supplier altogether, as was the case with N-glycan standards, as well as respective suppliers in the past two decades. Third, MS does not require mg amounts of standards (sometimes available, but very expensive), but rather μg or less, which are rarely available. The transition from nanoLC-MS analytical methods to μLC preparative methods may not be straightforward. For example, MS detection does not require sample derivatization. However, non-MS based chromatographies require another detector, which is typically both less specific and less sensitive. Since all these technical issues do not represent a serious obstacle for any industry, the biggest issue preventing appearance of “small biomolecular industry” are perhaps finances, first and foremost related to a small market, as often is the case with basic research groups. Nevertheless, these separation challenges today exist, and they need to be solved, either in industrial or academic setting. This is particularly true considering that organic and bioorganic synthesis of biomolecules is even more cost prohibiting.
Similar practical challenges/obstacles exist in protein, glycoprotein and membrane protein basic research. However, these separation challenges are much greater. First and foremost, protein mixtures require separation techniques with much higher resolution compared to those needed for small biomolecules, especially when heterogeneous populations of one protein have to be separated. Second, proteins must commonly be separated in their native form, limiting further the choice of solvents, as well as additives used, such as detergents. Commercially available proteins are typically much more expensive compared to small biomolecule standards, while the respective research market is much smaller. While small biomolecules can be envisaged to be purified in an industrial setting in the future, advanced protein separations will still have to be carried out in an academic laboratory setting for quite some time.
13. Requirement for High Purity Standards in MS and LC-MS Research
Standard compounds of high purity are often used in LC analyses, both qualitative and quantitative. Qualitative analytical LC analyses often rely on standard compounds for proving the identity of chromatographic peaks of interest. On the other hand, quantitative LC analyses rely on internal standards in order to quantitate chromatographic peaks of interest. Standard compounds are known to be both expensive and limited in availability, depending on the class of compounds studied. This is particularly true today, when resolution, speed and sensitivity of LC, and particularly LC-MS analyses, enables efficient analysis of complex biomolecular mixtures obtained from both biological and natural sources. MS is the primary analytical tool responsible for identification of less abundant, as well as high molecular weight biomolecules. Taken together, the industrial suppliers of standard compounds cannot keep up with the demands of scientific community, most often due to high pricing of rarely used biomolecules, as well as due to small market available. Therefore, in many LC research laboratory settings, MS is primarily employed for structural characterization of novel compounds found in biomolecular mixtures, using
m/
z value and appropriate MS/MS data when necessary, in order to circumvent the use of standard compounds. However, there are various practical limitations in this approach. First and foremost, stereochemistry is a very important aspect of biomolecular structures, and furthermore they often form isomeric structures. Use of MS is rarely straightforward when these aspects need to be identified de novo. The only practical way to deal with this is combination of LC-MS and basic research in order to construct tables (databases), such as
Table 4 and
Table 5. Otherwise, preliminary characterization of structural properties of biomolecules of interest under various MS/MS conditions needs to be carried out, typically using standards with a defined structure. In effect, all signals detected in LC-MS experiments are commonly not identified, and often some ambiguities in structural properties remain, such as identity of glycans, glycan branching, stereochemistry of some carbon atoms of interest, etc.
Besides their use in LC-MS experiments, MS requires standard biomolecules for standalone MS research, such as (i) characterization of properties of a mass spectrometer for MS/MS analyses of a targeted class of biomolecules; (ii) characterization of ionization properties of biomolecules of interest; (iii) characterization of MS/MS properties of a targeted class of biomolecules; (iv) development of quantitative MS analytical methods; and (v) development of novel MS/MS techniques. For example, in
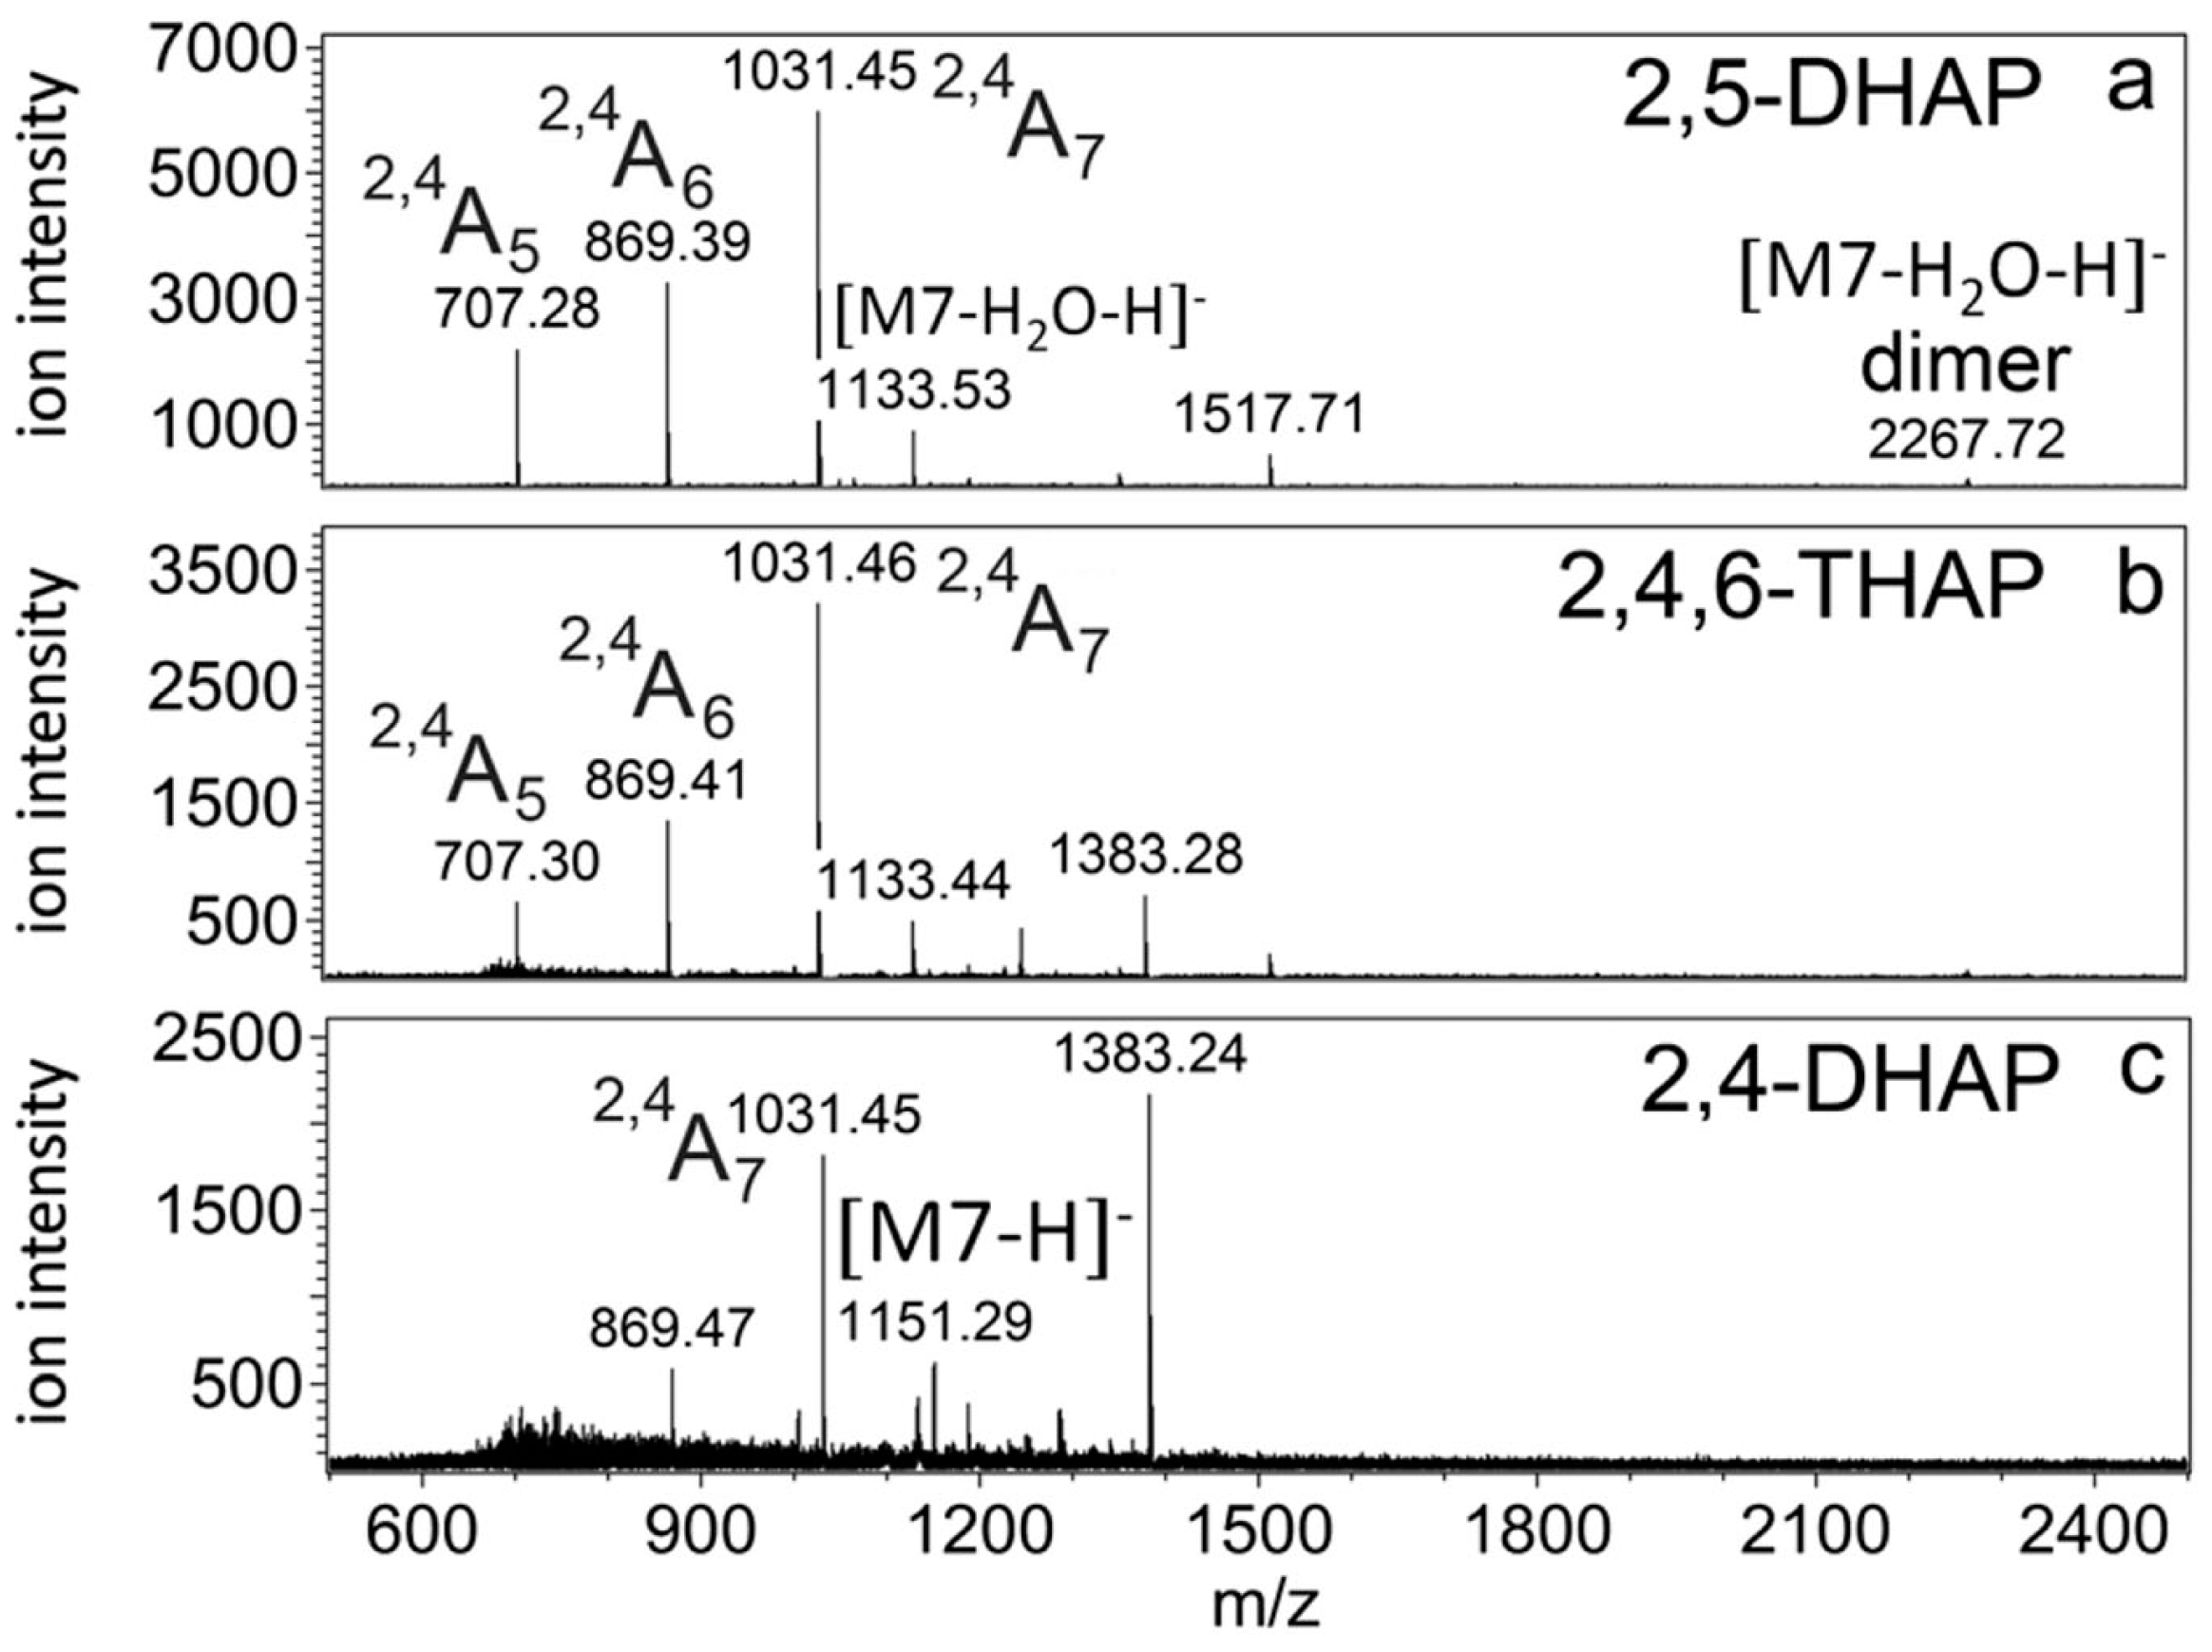
Figure 18, the use of an oligosaccharide standard, maltoheptaose, representing a neutral linear non-fucosylated oligosaccharide, is shown. In this study [
85], ionization properties of neutral oligosaccharides in negative ion mode MALDI MS were studied. In
Figure 18, ionization properties of maltoheptaose were studied when three different MALDI matrices were used; 2,5-DHAP (dihydroxyacetophenone), 2,4,6-THAP (trihydroxyacetophenone) and 2,4-DHAP. Due to the instability of non-reduced neutral oligosaccharides in the negative ion mode MALDI MS, multiple cross-ring fragment ions were detected (
2,4A
5,
2,4A
6 and
2,4A
7), along with the deprotonated and deprotonated dehydrated maltoheptaose signals. Matrix adduct signals were detected as well. This simple example clearly illustrates the need for pure oligosaccharide standards in MALDI MS basic research. Similarly, an important example of the use of standard biomolecules for development of novel MS/MS techniques is represented by C12 β-D-lactosyl ceramide (LacCer (18:1/12:0)), bovine milk ganglioside GM3 (18:1/23:0) and porcine brain ganglioside GD1 (18:1/18:0), purchased from Avanti Polar Lipids, Inc. (Alabaster, AL, USA). They were all used during the development of UVPD (ultraviolet photodissociation) MS/MS technique [
59].
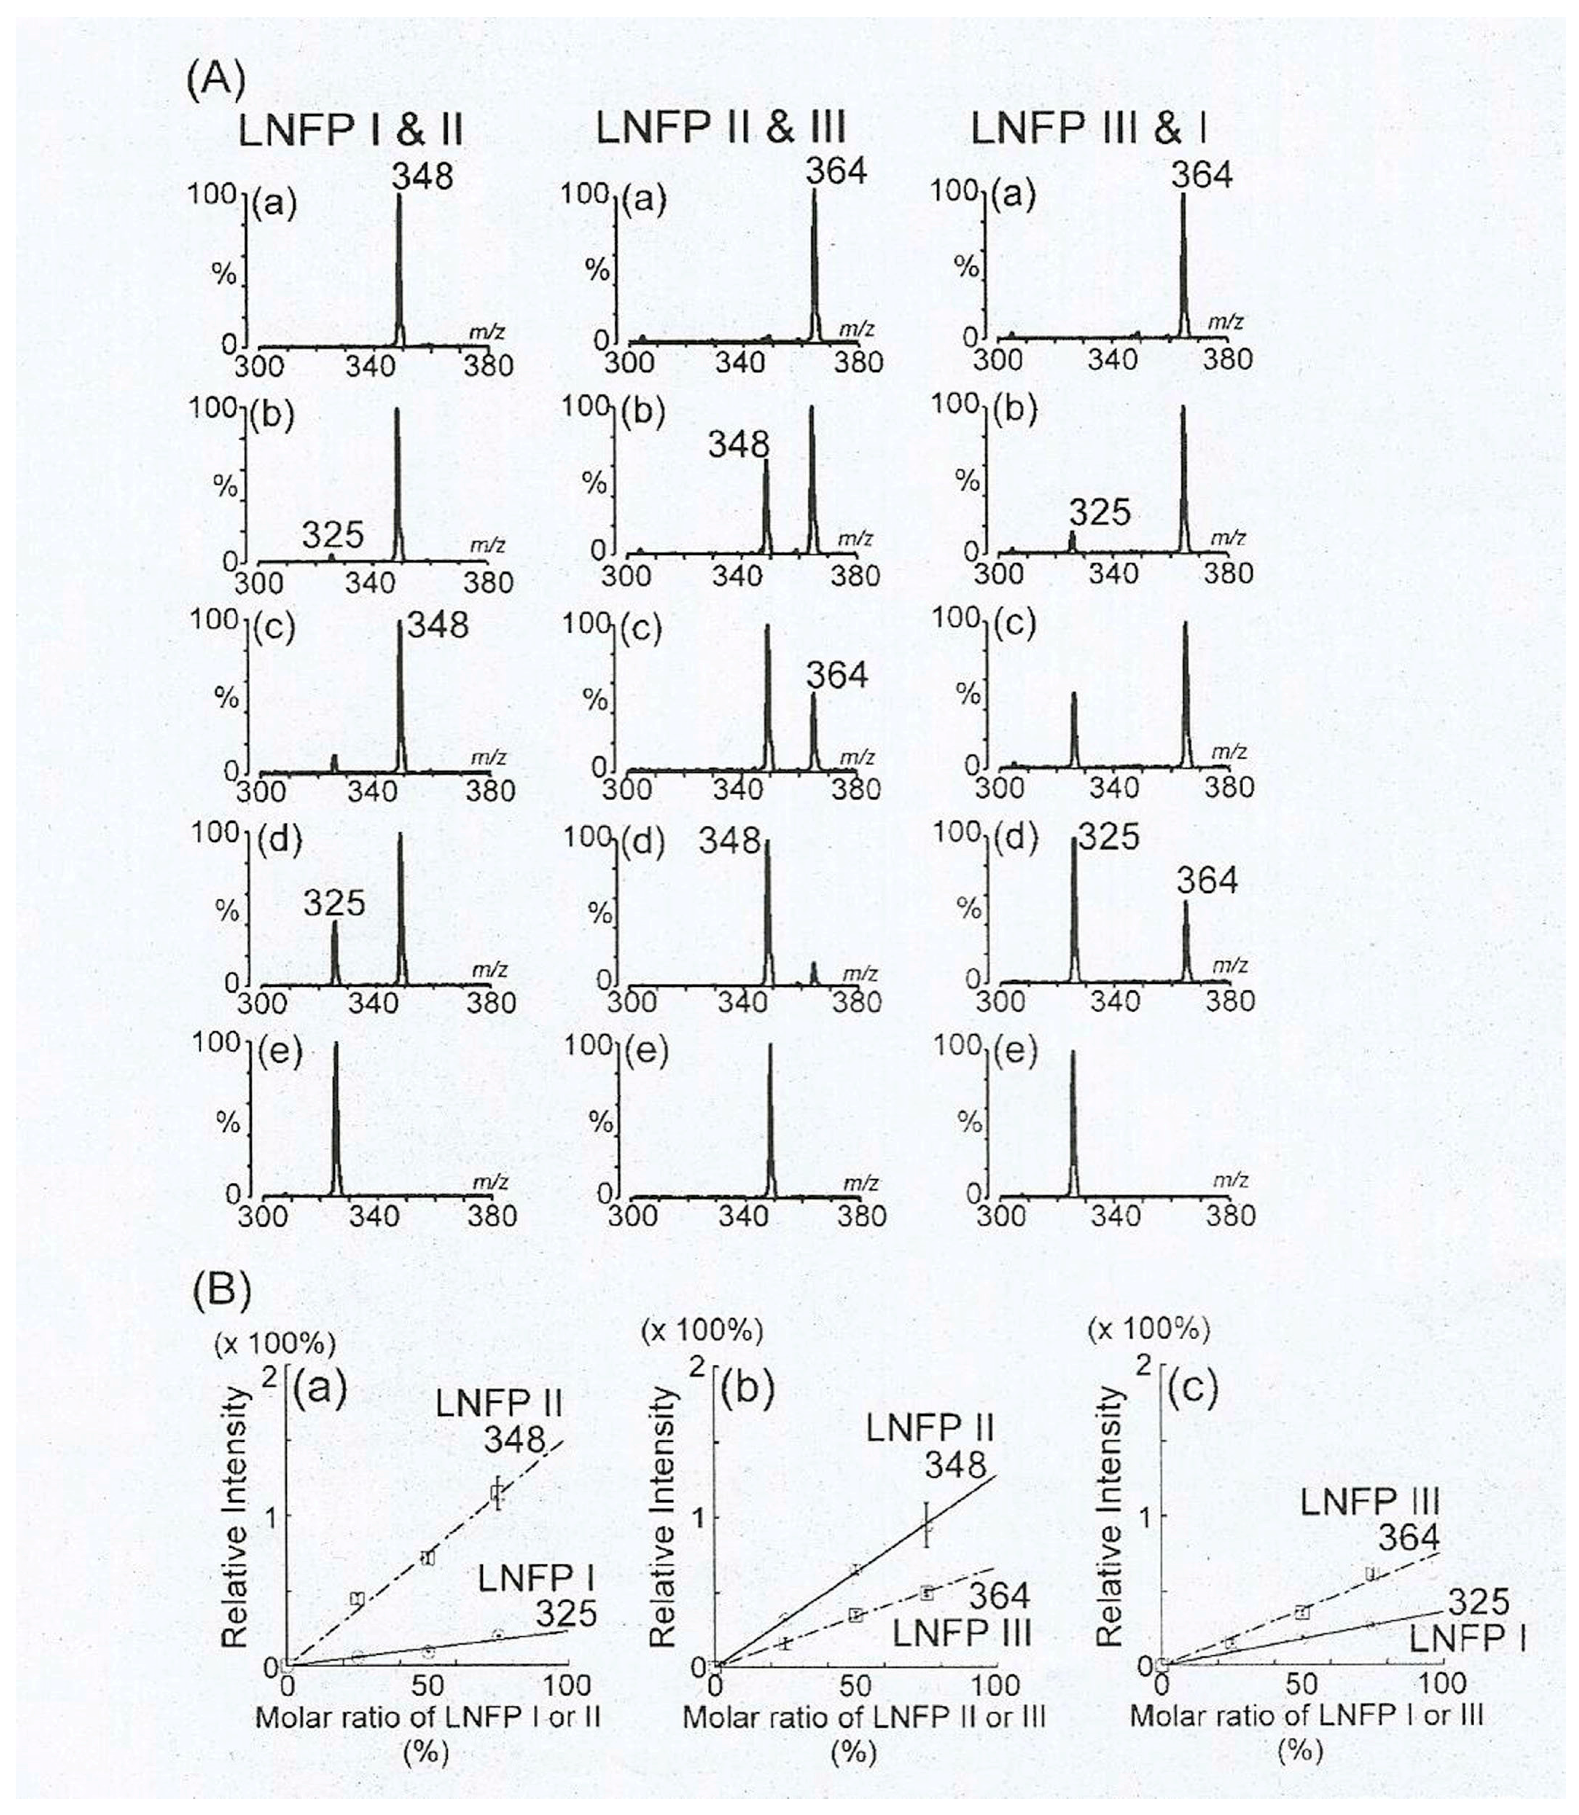
Another type of a high profile MALDI MS basic research are quantitative studies and analyses of HMO mixtures. Common problem in analysis of HMOs is a high degree of isomeric structures present in sample mixtures. This is particularly true for MALDI MS analyses, where isomers cannot be separated, making data analysis complex. However, HMO isomers tend to have different behavior under MS/MS conditions, resulting in discernable patterns of fragment ion intensities [
82]. However, for more detailed analyses, and especially quantitative ones, appropriate calibration mixtures with known amounts of individual structures are required. An example of such study is shown in
Figure 19 [
83], where various mixtures of three isomers, lacto-
N-monofucosylpentaose I, II and III were analyzed, based on which the respective calibration curves were constructed. Although these proof-of-concept studies show encouraging data, in order to be able to utilize this approach reliably, all ~500 HMO structures must be commercially available in a purified form. Considering that not even 50 purified HMOs can be purchased at the moment, applicability of these studies are very limited today. Therefore some low molecular weight HMO isomers can be studied with MALDI MS, but most of the longer ones cannot. Longer HMOs are of much higher importance for MS research and MS method development, due to more extensive branching, higher number of isomers, and higher degree of fucosylation as well as sialylation. However, without purified standards, the LC-MS approach described in
Section 4, which is highly dependent on appropriate bioinformatic support (see
Section 10), remains the only viable method for quantitative analyses of HMO mixtures.
Another good example of the usefulness of purified standards for development of LC-MS methods is the analysis of polyphenols. Analytical LC represented a method of choice for decades in analysis of this popular class of biomolecules present in various food sources, and thus basic industrial support with respect to many simple polyphenol standards (typically small molecular weight nonglycosylated polypenols) already exists and is applicable to many LC-MS analyses as well. This is particularly true since the main role of LC is separation of stereoisomers, as well as their identification based on
Rt values, determined with the help of available standards. Thus the polyphenol standards are still widely used for both qualitative [
64] and quantitative [
65] analyses. In
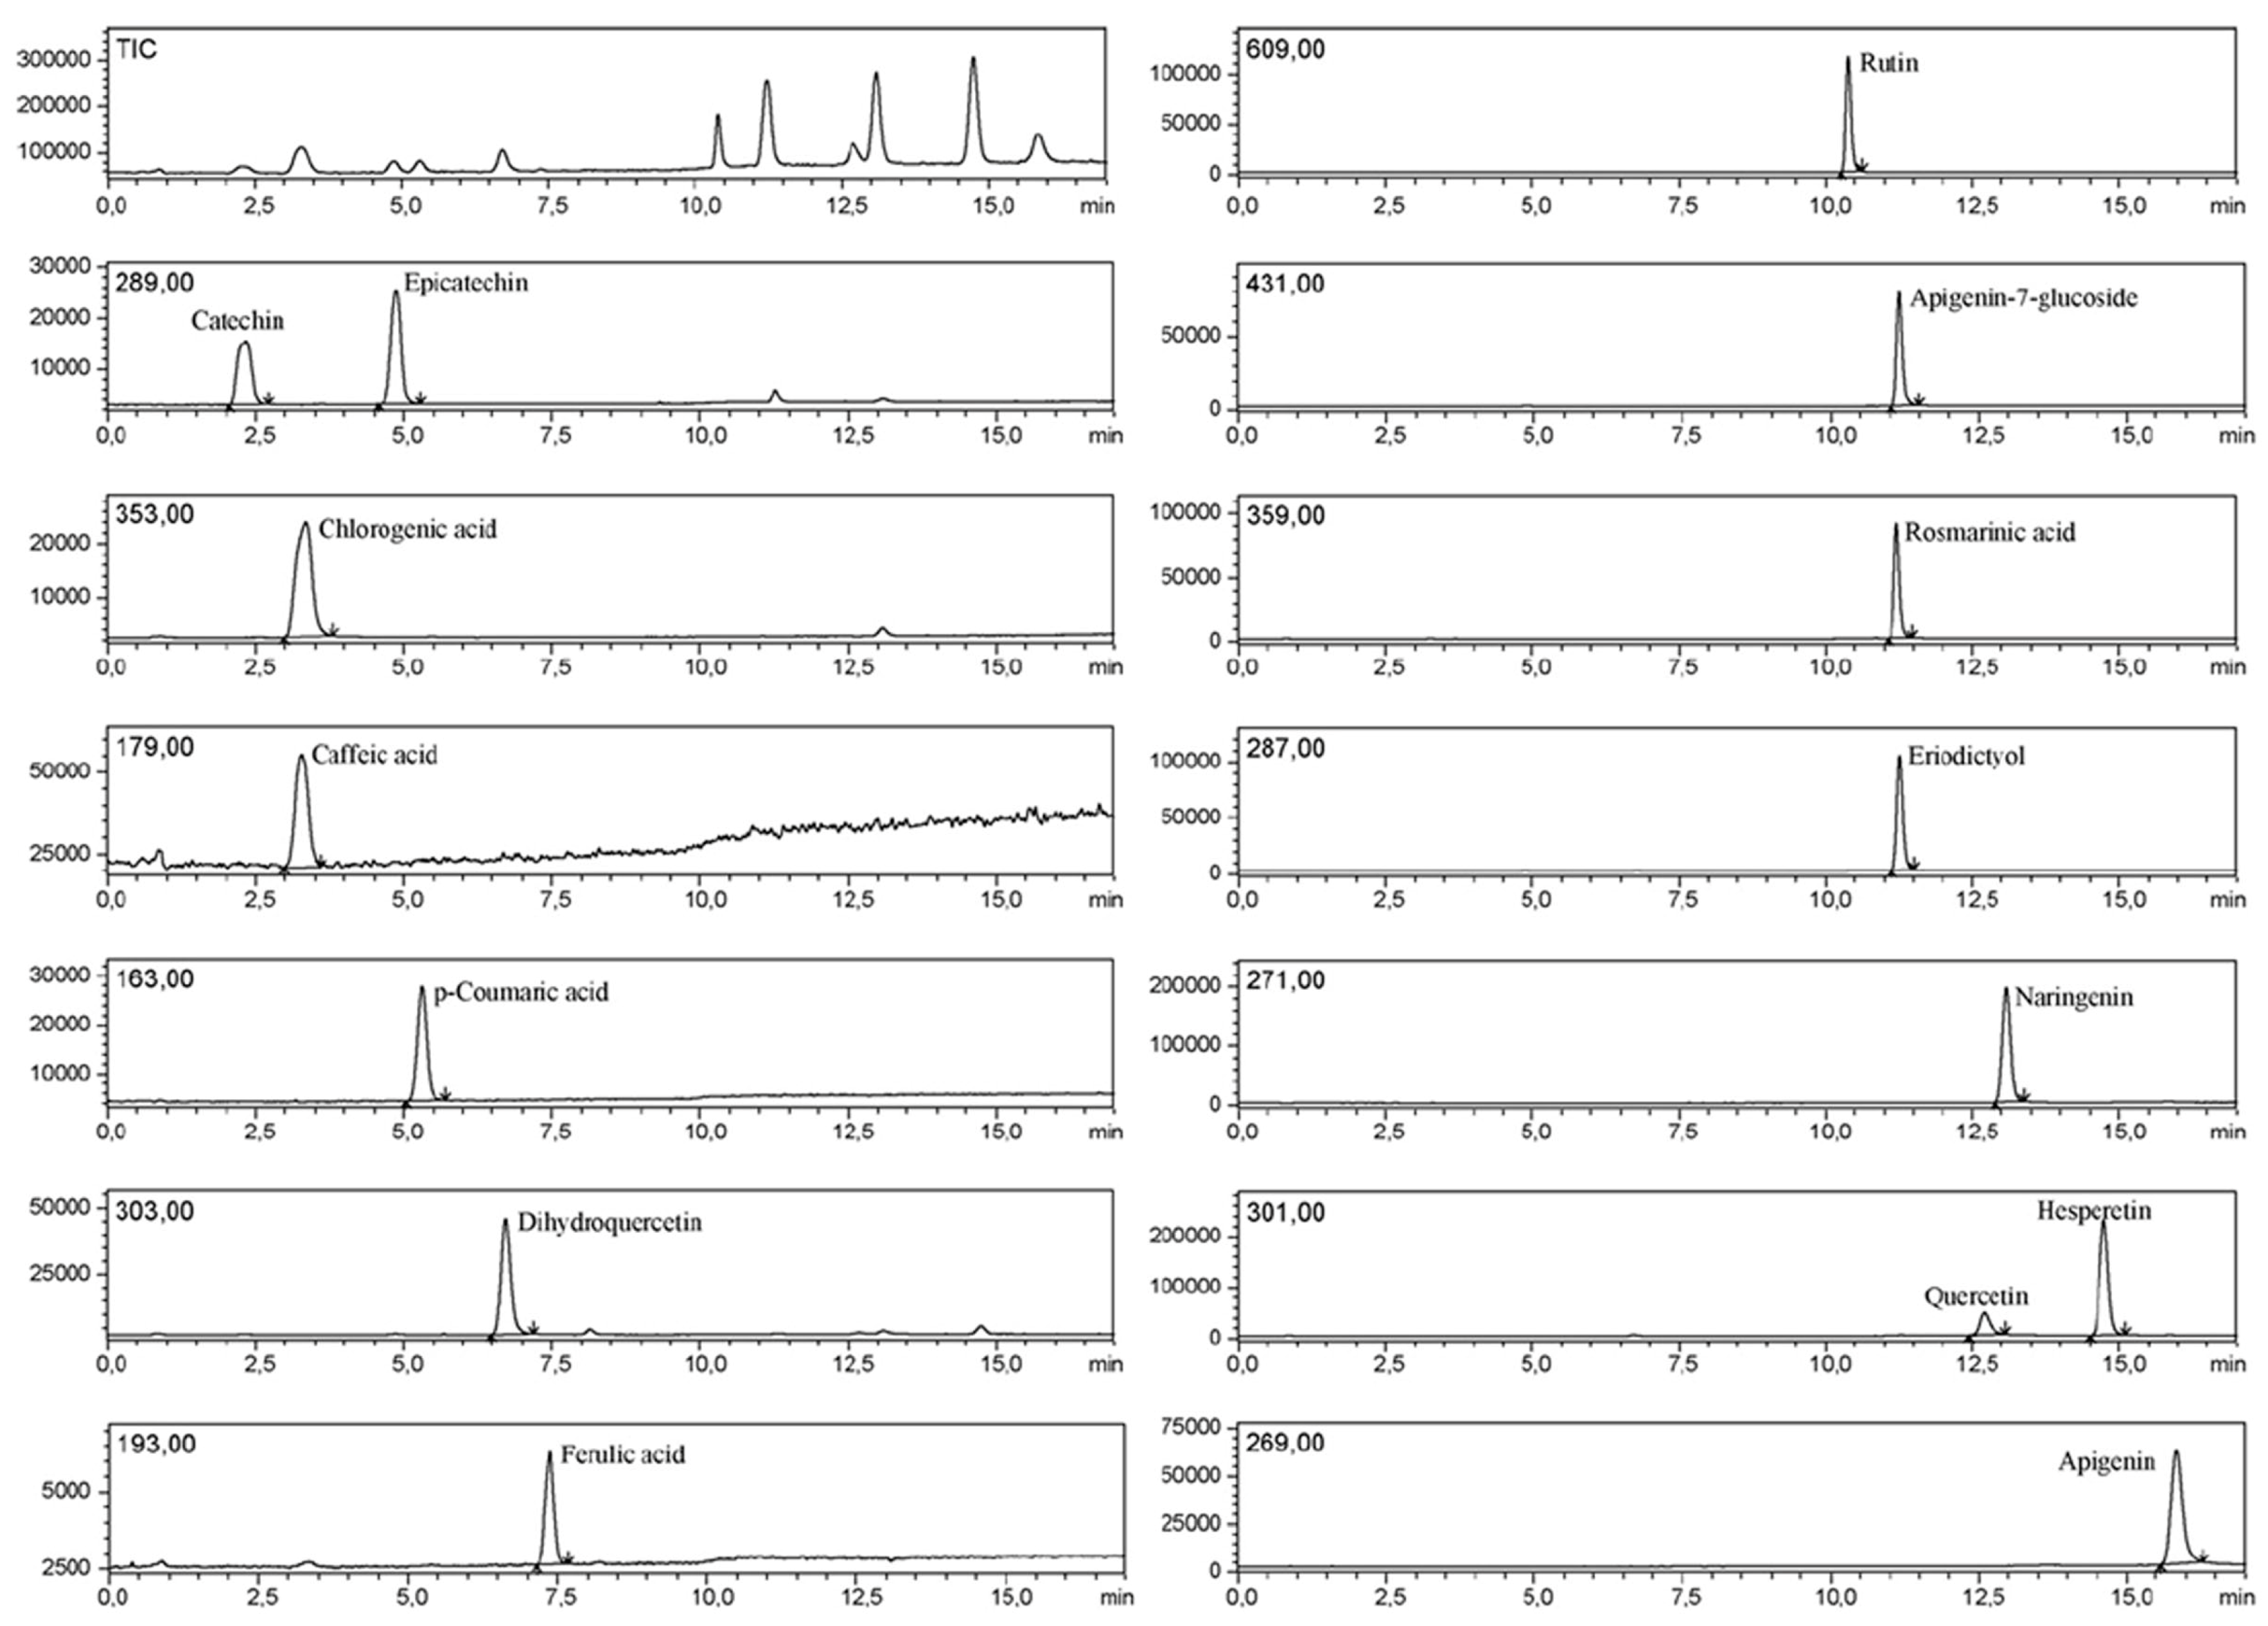
Figure 20, LC-MS chromatograms of standards for 15 phenolic compounds are shown [
64]. These can subsequently be used for the creation of an
Rt,
m/
z database, confirmation of MS data, as well as for subsequent MS/MS experiments. In
Figure 21, classical LC application of spiking of a purified standard is shown. In this case, LC-MS experiment was used, and target compounds were monitored via an MS/MS approach [
65].
Taken together, purified standards are of high value for both qualitative and quantitative MS and LC-MS analyses of various classes of biomolecules. With advances in MS and LC-MS technologies, additional standard compounds are necessary to progress the research in the respective fields. Besides the need for simple standards for routine purposes, more complex standard structures are in high demand for basic research, with emphasis on high molecular weight standards, branched, fucosylated and sialylated HMOs, polyphenol derivatives, etc.
14. MS Separations in the Gas Phase
Finally, a brief overview of some successes with ion mobility MS (IM-MS or IMS), representing an advanced separation technique in the gas phase. Structural isomerism of biomolecules represents a challenge in MS analyses. Sometimes this problem can be solved using alternate MS/MS techniques, such as electronic excitation dissociation (EED [
86] or electron transfer dissociation (ETD) [
87]) for glycans, or ultraviolet photodissociation (UVPD) for lipids [
55,
59]. However, most of the time LC separation prior to MS analysis represents the method of choice for dealing with structural isomerism of biomolecules. Due to practical, as well as technical (particularly bioinformatic) issues related to LC-MS separation of biomolecules, IM-MS has been investigated over the last decade for successful separation of carbohydrate and lipid isomers in the gas phase, inside the mass spectrometer itself. Obviously this would be very fast and efficient separation tool for tandem MS structural analyses of complex mixtures, allowing more MALDI MS analyses, which is advantageous for detailed MS/MS characterization of biomolecular structures. Briefly, the technique is of limited use today, where some isomers can be efficiently separated, while others cannot, often in an unpredictable manner. IM-MS instrumentation is still in the development phase, with different vendors competing with different IM-MS technologies. In general, resolution of IM-MS experiments is still not high enough to be able to readily separate all structural isomers typically encountered in everyday laboratory life. Therefore high level of expertise and experience, as well as separate MS instrumentation is needed to carry out IM-MS experiments efficiently. Here we will briefly mention some successes in the field.
Harvey et al. used travelling-wave ion mobility mass spectroscopy (TWIMS) and have shown that the resolution of TWIMS is not high enough to readily separate
N-glycans. However, when negative ion fragmentation was employed, arrival time distribution (ATD) of diagnostic ions showed different maxima, allowing differentiation of both isomers and conformers (see
Figure 22) [
88]. This observation was found to be true both for high-mannose glycans [
88], as well as complex and hybrid
N-glycans (see
Figure 23) [
89]. TWIMS has been studied in lipidomic applications as well, but in a more general manner. General applicability of IM-MS for distinguishing phospholipid classes has been investigated by Jackson et al. [
63]. Similarly, unsaturated phosphatidylcholines have been investigated by Kim et al. [
61]. Both these studies were carried out almost a decade ago. Only recently, a more detailed study has been carried out by Paglia et al. [
56], where lipid identification based on CCS databases and TWIMS-derived fragmentation information was investigated.


 denotes N-acetylglucosamine,
  galactose and
  glucose. *, * and * denote ions relevant to the explanation in the text. Reproduced from [49]. Copyright MDPI, 2014.


 denotes N-acetylglucosamine,
  galactose,
  glucose and
  fucose. * structures that could be neither confirmed nor excluded. * present in very small amounts. Reproduced from [49]. Copyright MDPI, 2014.


