Separation of Small DNAs by Gel Electrophoresis in a Fused Silica Capillary Coated with a Negatively Charged Copolymer

Abstract
:1. Introduction
2. Materials and Methods
2.1. Capillary Coating Procedure
2.2. Instrumentation
2.3. Chemicals
2.4. EOF Measurements
3. Results and Discussion
4. Conclusions
Acknowledgments
Author Contributions
Conflicts of Interest
References
- Saiki, R.K.; Scharf, S.; Faloona, F.; Mullis, K.B.; Horn, G.T.; Erlich, H.A.; Arnheim, N. Enzymatic amplification of beta-globin genomic sequences and restriction site analysis for diagnosis of sickle cell anemia. Science 1985, 230, 1350–1354. [Google Scholar] [CrossRef] [PubMed]
- Mullis, K.; Faloona, F.; Scharf, S.; Saiki, R.; Horn, G.; Erlich, H. Specific enzymatic amplification of DNA in vitro: The polymerase chain reaction. Cold Spring Harb. Symp. Quant. Biol. 1986, 51, 263–273. [Google Scholar] [CrossRef] [PubMed]
- Higuchi, R.; Dollinger, G.; Walsh, P.S.; Griffith, R. Simultaneous amplification and detection of specific DNA sequences. Nat. Biotechnol. 1992, 10, 413–417. [Google Scholar] [CrossRef]
- Higuchi, R.; Fockler, C.; Dollinger, G.; Watson, R. Kinetic PCR: Real-time monitoring of DNA amplification reactions. Nat. Biotechnol. 1993, 11, 1026–1030. [Google Scholar] [CrossRef]
- Furutani, S.; Naruishi, N.; Saito, M.; Tamiya, E.; Fuchiwaki, Y.; Nagai, H. Rapid and highly sensitive detection by a real-time polymerase chain reaction using a chip coated with its reagents. Anal. Sci. 2014, 30, 569–574. [Google Scholar] [CrossRef] [PubMed]
- Chen, J.; Ni, Y.; Liu, C.; Yamaguchi, Y.; Chen, Q.; Sekine, S.; Zhu, X.; Dou, X. Rapid identification and quantitation for oral bacteria based on short-end capillary electrophoresis. Talanta 2016, 160, 425–430. [Google Scholar] [CrossRef] [PubMed]
- Song, H.-O.; Kim, J.-H.; Ryu, H.-S.; Lee, D.-H.; Kim, S.-J.; Kim, D.-J.; Suh, I.B.; Choi, D.Y.; In, K.-H.; Kim, S.-W.; et al. Polymeric LabChip real-time PCR as a point-of-care-potential diagnostic tool for rapid detection of influenza A/H1N1 virus in human clinical specimens. PLoS ONE 2012, 7, e53325. [Google Scholar] [CrossRef] [PubMed]
- Rodriguez-Gonzalez, F.G.; Mustafa, D.A.M.; Mostert, B.; Sieuwerts, A.M. The challenge of gene expression profiling in heterogeneous clinical samples. Methods 2013, 59, 47–58. [Google Scholar] [CrossRef] [PubMed]
- Kawai, T.; Naruishi, N.; Nagai, H.; Tanaka, Y.; Hagihara, Y.; Yoshida, Y. Rotatable reagent cartridge for high-performance microvalve system on a centrifugal microfluidic device. Anal. Chem. 2013, 85, 6587–6592. [Google Scholar] [CrossRef] [PubMed]
- Botes, M.; de Kwaadsteniet, M.; Cloete, T.E. Application of quantitative PCR for the detection of microorganisms in water. Anal. Bioanal. Chem. 2013, 405, 91–108. [Google Scholar] [CrossRef] [PubMed]
- Postollec, F.; Falentin, H.; Pavan, S.; Combrisson, J.; Sohier, D. Advances in quantitative PCR (qPCR) applications in food microbiology. Food Microbiol. 2011, 28, 848–861. [Google Scholar] [CrossRef] [PubMed]
- Mitchelson, K.R.; Cheng, J. (Eds.) Capillary Electrophoresis of Nucleic Acids; Methods in Molecular Biology, Volume 163; Humana Press: Totowa, NJ, USA, 2001. [Google Scholar]
- Barron, A.E.; Sunada, W.M.; Blanch, H.W. The use of coated and uncoated capillaries for the electrophoretic separation of DNA in dilute polymer solutions. Electrophoresis 1995, 16, 64–74. [Google Scholar] [CrossRef] [PubMed]
- Chiari, M.; Cretich, M.; Horvath, J. A new absorbed coating for DNA fragment analysis by capillary electrophoresis. Electrophoresis 2000, 21, 1521–1526. [Google Scholar] [CrossRef]
- Ban, E.; Song, E.J. Capillary electrophoresis methods for microRNAs assays: A review. Anal. Chim. Acta 2014, 852, 1–7. [Google Scholar] [CrossRef] [PubMed]
- Sumitomo, K.; Yamaguchi, Y.; Tatsuta, K. RNA separation by in-capillary denaturing polymer electrophoresis with 1,2,5-thiadiazole as an additive. J. Sep. Sci. 2011, 34, 2901–2905. [Google Scholar] [CrossRef] [PubMed]
- Liu, C.; Yamaguchi, Y.; Sekine, S.; Ni, Y.; Li, Z.; Zhu, X.; Dou, X. Gene analysis of multiple oral bacteria by the polymerase chain reaction coupled with capillary polymer electrophoresis. J. Sep. Sci. 2016, 39, 986–992. [Google Scholar] [CrossRef] [PubMed]
- Chiari, M.; Dell’Orto, N.; Gelain, A. Synthesis and characterization of capillary columns coated with glycoside-bearing polymer. Anal. Chem. 1996, 68, 2731–2736. [Google Scholar] [CrossRef] [PubMed]
- Jorgenson, J.W.; Lukacs, K.D. Capillary zone electrophoresis. Science 1983, 222, 266–272. [Google Scholar] [CrossRef] [PubMed]
- Hjertén, S. High-performance electrophoresis: Elimination of electroendosmosis and solute adsorption. J. Chromatogr. A 1985, 347, 191–198. [Google Scholar] [CrossRef]
- Sumitomo, K.; Sasaki, M.; Yamaguchi, Y. Acetic acid denaturing for RNA capillary polymer electrophoresis. Electrophoresis 2009, 30, 1538–1543. [Google Scholar] [CrossRef] [PubMed]
- McCormick, R.M. Capillary zone electrophoretic separation of peptides and proteins using low pH buffers in modified silica capillaries. Anal. Chem. 1988, 60, 2322–2328. [Google Scholar] [CrossRef] [PubMed]
- Bruin, G.J.M.; Chang, J.P.; Kuhlman, R.H.; Zegers, K.; Kraak, J.C.; Poppe, H. Capillary zone electrophoretic separations of proteins in polyethylene glycol-modified capillaries. J. Chromatogr. A 1989, 471, 429–436. [Google Scholar] [CrossRef]
- Sumitomo, K.; Mayumi, K.; Minamikawa, H.; Masuda, M.; Asahi, T.; Shimizu, T.; Ito, K.; Yamaguchi, Y. Buffers to suppress sodium dodecyl sulfate adsorption to polyethylene oxide for protein separation on capillary polymer electrophoresis. Electrophoresis 2011, 32, 448–454. [Google Scholar] [CrossRef] [PubMed]
- Cobb, K.A.; Dolnik, V.; Novotny, M. Electrophoretic separations of proteins in capillaries with hydrolytically stable surface structures. Anal. Chem. 1990, 62, 2478–2483. [Google Scholar] [CrossRef] [PubMed]
- Towns, J.K.; Regnier, F.E. Polyethyleneimine-bonded phases in the separation of proteins by capillary electrophoresis. J. Chromatogr. A 1990, 516, 69–78. [Google Scholar] [CrossRef]
- Dougherty, A.M.; Woolley, C.L.; Williams, D.L.; Swaile, D.F.; Cole, R.O.; Sepaniak, M.J. Stable phases for capillary electrophoresis. J. Liq. Chromatogr. 1991, 14, 907–921. [Google Scholar] [CrossRef]
- Fujiwara, S.; Honda, S. Determination of cinnamic acid and its analogues by electrophoresis in a fused silica capillary tube. Anal. Chem. 1986, 58, 1811–1814. [Google Scholar] [CrossRef] [PubMed]
- Fujiwara, S.; Honda, S. Effect of addition of organic solvent on the separation of positional isomers in high-voltage capillary zone electrophoresis. Anal. Chem. 1987, 59, 487–490. [Google Scholar] [CrossRef]
- Lee, C.S.; Blanchard, W.C.; Wu, C.-T. Direct control of the electroosmosis in capillary zone electrophoresis by using an external electric field. Anal. Chem. 1990, 62, 1550–1552. [Google Scholar] [CrossRef]
- Hayes, M.A.; Ewing, A.G. Electroosmotic flow control and monitoring with an applied radial voltage for capillary zone electrophoresis. Anal. Chem. 1992, 64, 512–516. [Google Scholar] [CrossRef] [PubMed]
- Wu, C.-T.; Lopes, T.; Patel, B.; Lee, C.S. Effect of direct control of electroosmosis on peptide and protein separations in capillary electrophoresis. Anal. Chem. 1992, 64, 886–891. [Google Scholar] [CrossRef] [PubMed]
- Sun, P.; Landman, A.; Barker, G.E.; Hartwick, R.A. Synthesis and evaluation of anionic polymer-coated capillaries with pH-independent electroosmotic flows for capillary electrophoresis. J. Chromatogr. A 1994, 685, 303–312. [Google Scholar] [CrossRef]


| Acrylic Acid Monomer (mol %) | Acrylamide Monomer (mol %) | |
|---|---|---|
| 1 | 100.00 | 0.00 |
| 2 | 10.00 | 90.00 |
| 3 | 6.00 | 94.00 |
| 4 | 4.00 | 96.00 |
| 5 | 3.75 | 96.25 |
| 6 | 3.50 | 96.50 |
| 7 | 3.00 | 97.00 |
| 8 | 2.75 | 97.25 |
| 9 | 2.50 | 97.50 |
| 10 | 2.00 | 98.00 |
| 11 | 1.00 | 99.00 |
| 12 | 0.00 | 100.00 |
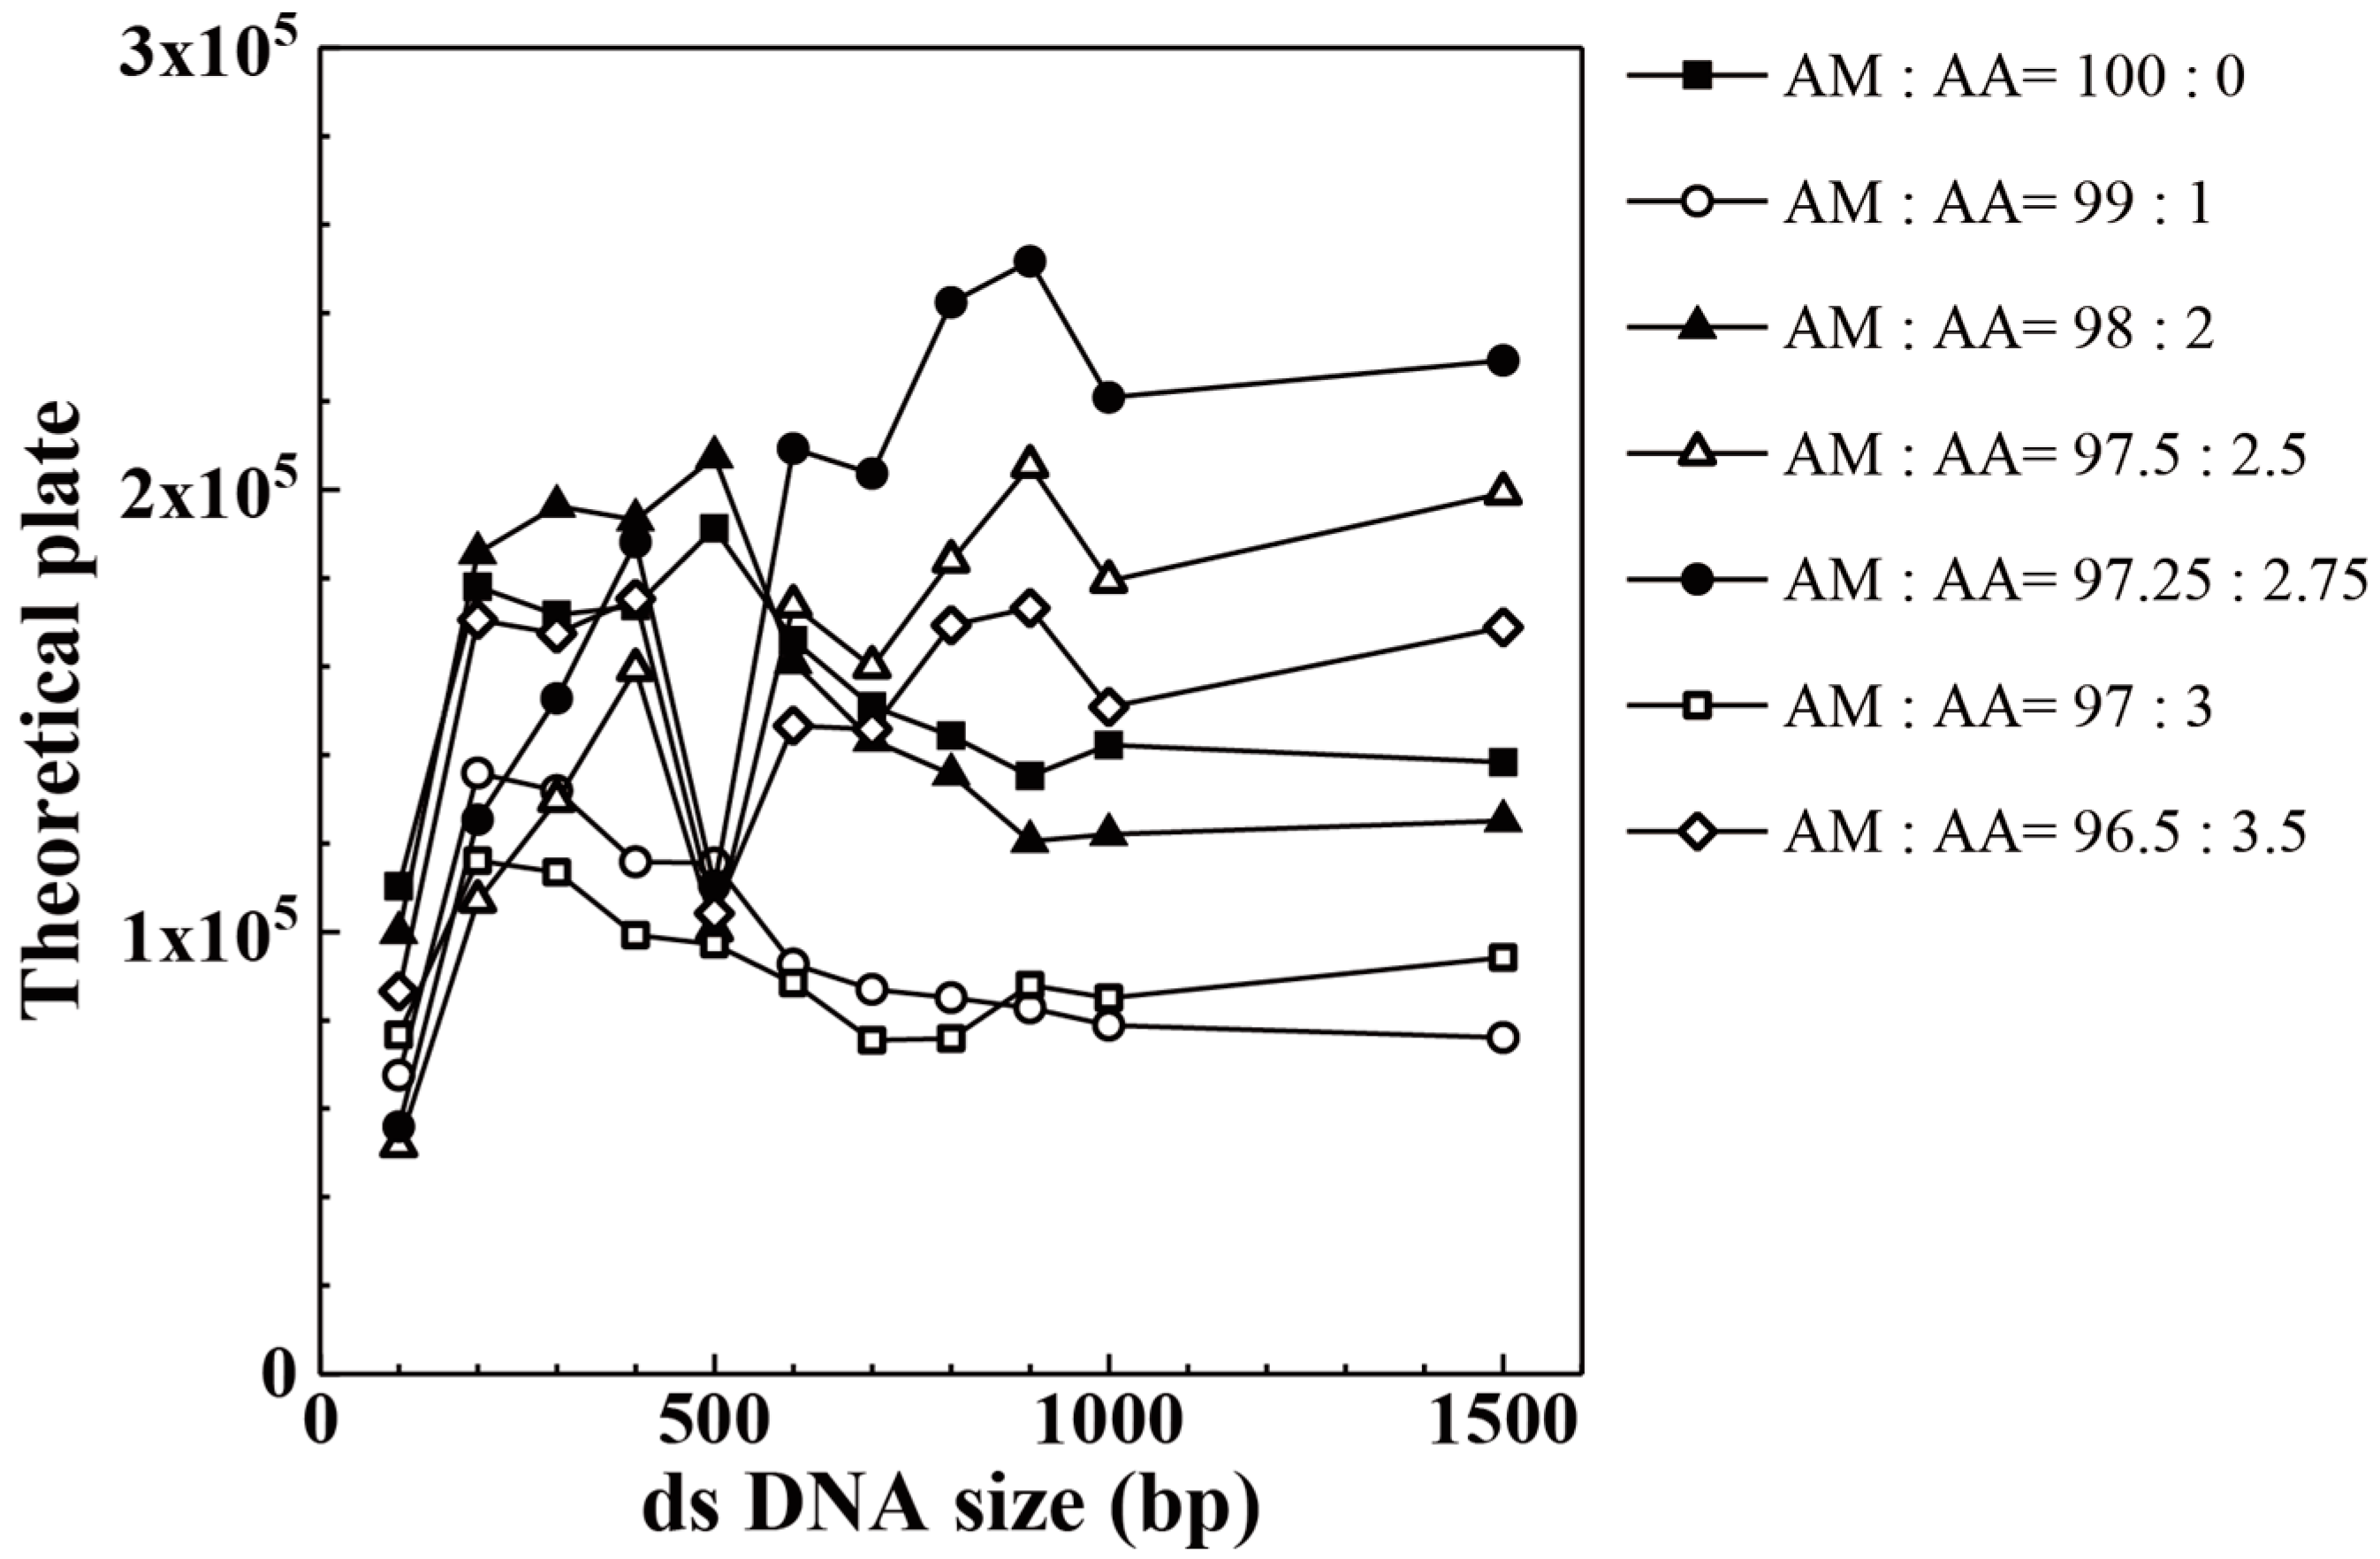
| AM:AA | 100 bp | 200 bp | 300 bp | 400 bp | 500 bp | 600 bp |
| 96.50:3.50 | 86,563 | 170,584 | 167,479 | 175,338 | 104,213 | 146,590 |
| 97.00:3.00 | 76,663 | 116,110 | 113,523 | 99,269 | 97,206 | 88,442 |
| 97.25:2.75 | 55,909 | 125,373 | 152,776 | 188,159 | 110,435 | 209,298 |
| 97.50:2.50 | 51,669 | 107,010 | 129,720 | 159,323 | 100,413 | 173,799 |
| 98.00:2.00 | 99,862 | 185,749 | 196,343 | 193,207 | 207,447 | 160,890 |
| 99.00:1.00 | 67,556 | 135,935 | 131,942 | 115,842 | 115,566 | 92,687 |
| 100.00:0.00 | 110,291 | 178,095 | 171,701 | 173,681 | 191,241 | 166,005 |
| AM:AA | 700 bp | 800 bp | 900 bp | 1000 bp | 1500 bp | |
| 96.50:3.50 | 145,837 | 169,387 | 173,275 | 150,837 | 168,889 | |
| 97.00:3.00 | 75,506 | 75,888 | 87,953 | 85,048 | 94,195 | |
| 97.25:2.75 | 203,659 | 242,351 | 251,685 | 220,883 | 229,262 | |
| 97.50:2.50 | 159,915 | 183,884 | 205,394 | 179,339 | 199,214 | |
| 98.00:2.00 | 143,360 | 135,640 | 120,527 | 122,062 | 125,090 | |
| 99.00:1.00 | 86,982 | 85,101 | 82,764 | 78,894 | 76,054 | |
| 100.00:0.00 | 151,064 | 144,323 | 135,263 | 142,263 | 138,389 |
| AM:AA (mol %) | Migration Time for Neutral Marker (min) | EOF (×10−8 m2·V−1·s−1) |
|---|---|---|
| 0.00:100.00 | 2.69 | 4.65 |
| 90.00:10.00 | 2.69 | 4.65 |
| 94.00:6.00 | 2.80 | 4.46 |
| 96.00:4.00 | 2.89 | 4.33 |
| 96.25:3.75 | 2.76 | 4.53 |
| 96.50:3.50 | 44.20 | 0.28 |
| 97.00:3.00 | 31.29 | 0.40 |
| 97.25:2.75 | 48.73 | 0.26 |
| 97.50:2.50 | 58.34 | 0.21 |
| 98.00:2.00 | 49.96 | 0.25 |
| 99.00:1.00 | 54.55 | 0.23 |
| 100.00:0.00 | 173.51 | 0.07 |
© 2017 by the authors. Licensee MDPI, Basel, Switzerland. This article is an open access article distributed under the terms and conditions of the Creative Commons Attribution (CC BY) license (http://creativecommons.org/licenses/by/4.0/).
Share and Cite
Nakazumi, T.; Hara, Y. Separation of Small DNAs by Gel Electrophoresis in a Fused Silica Capillary Coated with a Negatively Charged Copolymer. Separations 2017, 4, 28. https://doi.org/10.3390/separations4030028
Nakazumi T, Hara Y. Separation of Small DNAs by Gel Electrophoresis in a Fused Silica Capillary Coated with a Negatively Charged Copolymer. Separations. 2017; 4(3):28. https://doi.org/10.3390/separations4030028
Chicago/Turabian StyleNakazumi, Tomoka, and Yusuke Hara. 2017. "Separation of Small DNAs by Gel Electrophoresis in a Fused Silica Capillary Coated with a Negatively Charged Copolymer" Separations 4, no. 3: 28. https://doi.org/10.3390/separations4030028
APA StyleNakazumi, T., & Hara, Y. (2017). Separation of Small DNAs by Gel Electrophoresis in a Fused Silica Capillary Coated with a Negatively Charged Copolymer. Separations, 4(3), 28. https://doi.org/10.3390/separations4030028