Article

Detecting Adulterated Commercial Sweet Sorghum Syrups with Ion Chromatography Oligosaccharide Fingerprint Profiles

USDA-ARS-SRRC, 1100 Robert E. Lee Boulevard, New Orleans, LA 70124, USA
*
Author to whom correspondence should be addressed.
Separations 2016, 3(3), 20; https://doi.org/10.3390/separations3030020
Submission received: 16 February 2016 / Revised: 6 July 2016 / Accepted: 9 July 2016 / Published: 20 July 2016
(This article belongs to the Special Issue Ion Chromatography)

Abstract

:
Some commercial sweet sorghum syrups can be fraudulently or accidently adulterated with inexpensive sugar syrups, particularly high fructose corn syrup (HFCS) or corn syrup, and sold at a relatively low market price or even mis-branded. This undermines the economic stability of the current small-scale producers of food-grade sweet sorghum syrup as well as the developing large-scale bioproduct industry. An analytical method is urgently needed to evaluate adulterated commercial sweet sorghum syrups. Ion chromatography with integrated pulsed amperometric detection (IC-IPAD) has been previously used to differentiate white, refined sugars manufactured from sugarcane and sugar beet. By applying a strong IC-IPAD NaOH/NaOAc gradient method over 45 min, monosaccharides, oligosaccharides and oligosaccharide isomers of at least 2 to 12 dp, as well as sugar alcohols can be detected in multiple commercial sweet sorghum and other sugar syrups. Fingerprint IC oligosaccharide profiles are extremely selective, sensitive, and reliable. By using five characteristic marker chromatography peaks of high fructose corn syrup (HFCS), including isomaltose, maltose and maltotriose, in combination with a low sucrose peak, adulterated and mis-branded syrups were identified. The analysis of 7.0 Brix blind syrup samples, marker peaks allowed the detection of as low as 10% HFCS adulteration, which is within the lower limit of adulteration before action is taken.

Graphical Abstract

1. Introduction

EMA—Economically Motivated Adulteration (EMA) is considered by the Food and Drug Agency of the United States Government [1] as “the fraudulent, intentional substitution or addition of a substance in a product for the purpose of increasing the apparent value of the product and reducing the cost of its production, i.e., for economic gain”. Adulteration also encompasses replacement, concealment, dilution, and even removal of a substance [1]. With the increasing complexity of supply chains, EMA is a very real problem that continues to be an issue globally [2]. Adulteration of sweet sorghum syrups has a strong economic impact on the industry and undeniable nutritional and organoleptic consequences. Furthermore, as sweet sorghum is a very promising feedstock for the production of biofuels and bioproducts [3], the adulteration of syrups with high starch substitutes, such as high fructose corn syrup (HFCS) and corn syrups, could impact bio-yields. This is because starch is more difficult and costly to ferment than soluble sugars, since it requires enzymes. Furthermore, the detection of adulteration is essential to avoid unfair competition that can create a destabilized market and disrupt regional economies. The detection and identification of adulterated and mis-branded sweet sorghum syrups is also of interest to syrup and food manufacturers and their related trade groups (e.g., National Sweet Sorghum Producers and Processors Association, Monteray, TN, USA), consumers, and regulators because of issues of legal compliance. Manufacturers need to ensure that correctly labelled sweet sorghum syrup is available to the consumer and/or buyer. Consumers also have an interest in ensuring the food they purchase is authentic.
The authentication of sweet sorghum syrups is challenging because of their complex nature. The major chemical constituents of sweet sorghum syrup are carbohydrates, mostly soluble glucose (34.6–43.6 g·L−1), fructose (11.9–19.0 g·L−1), and sucrose (797–2934 g·L−1) with values varying with cultivar, maturity, environment, and processing conditions [4]. Syrups also contain soluble and insoluble starch although juice clarification, often utilized during syrup manufacture, should remove a large amount [5]. The starch content of sweet sorghum juice is markedly higher than for sugarcane [4], and sugar beet juice contains no starch.
Generally, chromatographic fingerprinting is regarded as an effective method for authentication of many foodstuffs [5,6,7]. Ion chromatography with integrated pulsed amperometric detection (IC-IPAD, aka high performance anion-exchange chromatography HPAEC) is widely considered as a major tool to detect carbohydrates. IC has high sensitivity and selectivity with no cumbersome and time consuming derivatization or sample clean-up prior to injection. Furthermore, IC-IPAD has been successfully used to differentiate between white, refined sugars manufactured from sugarcane or sugar beets [8], authenticate honey [5,9], maple syrup [10], and orange juices [6]. IC-IPAD can be applied to determine many types of carbohydrates in a large variety of samples from different industries [11]. It is also used to detect and quantitate compounds derived from carbohydrates such as hydroxymethylfurfural (HMF) in honey, high fructose corn syrups, and milk [12]. IC-IPAD has even been used to separate linear glucose polymers with a degree of polymerization (dp) as high as 80 dp [13,14] and detect carbohydrates at low picomole levels [15].
IC-IPAD utilizes alkaline eluents, and at pH values >12 in sodium hydroxide (NaOH) eluents, carbohydrate hydroxyl groups are at least partially ionized to produce weakly acidic oxyanions, which are separated on a strong anion-exchange stationary phase in the form of microbeads packed in a column. Anions interact with the column based on size, composition, and linkage [16]. Separated carbohydrate anions are detected via PAD by measuring the electrical current generated by their oxidation at the surface of a gold electrode over a fixed period of time. The products of this oxidation reaction are cleaned with negative potentials between measurements, otherwise there would be a loss of analyte signal due to gradual poisoning of the electrode surface. The detector sensitivity differs for different carbohydrates, thus calibration curves need to be created for each carbohydrate. When sodium acetate (NaOAc) is added to the carbonate-free NaOH eluent, it accelerates the elution of strongly bound species without compromising selectivity or interfering with pulsed amperometric detection. This is because acetate interacts much more strongly than hydroxide with the anion-exchange sites. Moreover, larger sized oligo- and polysaccharides have greater solubility in NaOH and NaOAc eluents which also aids their separation and detection.
The high-resolving power of IC-IPAD and its ability to determine oligosaccharides of higher dps, has allowed the “fingerprinting” of numerous products manufactured from sugar crops [7]. This includes sugarcane and sugar beet used in the global manufacture of sugar, as well as sweet sorghum, which is used to produce food-grade syrup at the small-scale but is also now being used as a sugar feedstock for the large-scale manufacture of biofuels and bioproducts [5]. The fingerprinting capability of a NaOH/NaOAc gradient IC method utilizing a Thermo Scientific™ (previously Dionex™) CarboPac™ PA1 strong anion-exchange column, combined with the sensitivity of the IPAD, has allowed its application to the authentication of sweet sorghum syrups, which is discussed herein.

2. Experimental Section

2.1. Chemicals and Reagents

HPLC grade NaOH and NaOAc were obtained from Thermo Scientific™ Dionex™ (Sunnyvale, CA, US). Potato starch, maltose, isomaltose, isomaltotriose, maltotriose, maltopentose, and D-panose were analytical grade from Sigma-Aldrich (St. Louis, MO, USA). D-Leucrose and maltohexaose were analytical grade from Santa Cruz Biotechnology (Dallas, TX, USA). Maltotetraose was analytical grade from TCI (Tokyo, Japan). Termamyl 120L™ α-amylase (EC 3.2.1.1) was produced by Novozymes (Franklinton, NC, USA) and obtained from Brenntag (Houston, TX, USA), and had an activity of 400 KRAU/g [17]. De-ionized water (18 MΩ resistivity) was used to prepare eluents and samples. Standard sugars, oligosaccharides, and mannitol were analytical grade. An assortment of commercial syrups was purchased from various local grocery stores and commercial outlets in the USA, and the major ingredients as stated on the label are listed in Table 1. Known sweet sorghum syrups were obtained from direct manufacturers (Delta BioRenewables LLC, Memphis, TN, USA; Heckemeyer Mill, Sikeston, MO, USA; Wittgreve Sorghum Mill, Elkart Lake, WI, USA).

2.2. IC-IPAD Saccharide Analysis

Carbohydrates (mainly oligosaccharides up to 12 dp), including sugar alcohols and ethanol, were separated on a Dionex™ (now Thermo Scientific™, Sunnyvale, CA, USA) BioLC or Dx500 instrument, using a strong NaOH/NaOAc gradient over 40 min [8]. The compounds were separated on Thermo Scientific CarboPac™ PA1 analytical anion exchange (250 mm × 4 mm) and guard columns (50 mm × 4 mm) at 30 °C, using a Dionex LC25 Chromatography Oven. The CarboPac™ PA1 column was designed for the rapid analysis of mono- and oligosaccharides, in particular linear homopolymers [18]. The CarboPac™ PA1 column contains 10 μm substrate of polystyrene 2% crosslinked with divinylbenzene) agglomerated with MicroBead™ quaternary ammonium fuctionalized latex (5% crosslinked). Flow rate = 1.0 mL min−1 and injection volume = 10 μL. Eluent conditions were: carbonate-free 100 mM NaOH (isocratic (0.0–1.1 min; inject 1.0 min), a gradient of 0 to 300 mM NaOAc in 100 mM NaOH (1.1–40.0 min), and return to 100 mM NaOH (40.1 to 45.0 min) to re-equilibrate the column to the starting conditions prior to injection. The re-equilibration is needed for good retention time (RT) reproducibility. The eluents were prepared by diluting a 50% w/w NaOH solution with 18 MΩ deionized water and then degassing them with ultra-high purity helium for 20 min. Once the eluents were prepared they were kept blanketed under helium (20 kPa) at all times. Syrup samples were first adjusted to 7.0 Brix with de-ionized water and filtered through a 0.45 μm PVDF filter to remove particulates. IPAD detection was with a Dionex ED50 detector equipped with Au working and Ag/AgCl reference electrodes. The ED50 detector operated with the following working electrode pulse potentials and durations: E1 = +0.10 V (t0 = 0.00 s), E2 = 0.10 V (t1 = 0.20 s), E3 = +0.10 V (t3 = 0.40 s), E4 = +2.00 V (t4 = 0.41 s), E5 = −2.00 V (t5 = 0.42 s), E6 = +0.60 V (t6 = 0.43 s), E7 = −0.10 V (t7 = 0.44 s), and E8 = −0.10 V (t8 = 0.50 s). The units of detection are either nC or in μC. A Dionex AS refrigerated autoinjector/autosampler was used to prevent degradation of sugars in samples while waiting for injection onto the column. Dionex Chromeleon™ chromatography software (version 6.8, Thermo Scientific, Sunnyvale, CA, USA) was used to accumulate multiple samples and check standards. Monosaccharides and oligosaccharides, mannitol, and ethanol were identified by comparing retention times with standards, standard mixtures, and by spiking with standards.
A representative chromatogram with the gradient method conditions overlaid is shown in Figure 1. To maintain baseline stability, the sodium hydroxide was kept constant during the sodium acetate gradient, because acetate has no buffering capacity at high pH [15]. As the oligosaccharide molecular weight/size (also reflected in the degrees of polymerization dp) increased, retention time increases.

2.3. Brix (% Refractometric Dry Substance) and pH

Brix was measured using an Index Instruments (Kissimmee, FL, USA) TCR 15–30 temperature controlled refractometer, accurate to ±0.01 Brix. Samples were diluted 50:50 in de-ionized water before Brix measurement and results expressed as an average of triplicates. Syrup pH was measured using an Orion 320 pH meter (Thermo Electron Corp., Waltham, MA, USA) with constant mixing with a magnetic stirrer.

2.4. Amylase Activity and Action on Starch

The activity of α-amylase was measured according to ICUMSA GS7-33 (2013) Official method. A 2000 mg L−1 potato starch solution was prepared by first boiling for 5 min to fully solubilize. To the cooled starch solution was added 20 mg L−1 amylase and the starch/enzyme solution was left in a 50 °C water bath for 15, 30 and 60 min with aliquots taken at each time interval. Aliquots were cooled and analyzed undiluted by IC in duplicate.

3. Results and Discussion

Although some highly sophisticated methods exist to differentiate the source sugars in honey and other sugar syrups, i.e., Isotope Ratio Mass Spectrometry (IRMS), Deuterium-NMR, and Differential Scanning Calorimetry (DSC), these were considered as reference techniques [9] since the equipment is expensive and not readily available, and the methods can be time consuming. A general analytical screening method was needed to detect a wide range of compounds in the same run. Suspect samples could then be detected and evaluated by more sophisticated techniques.

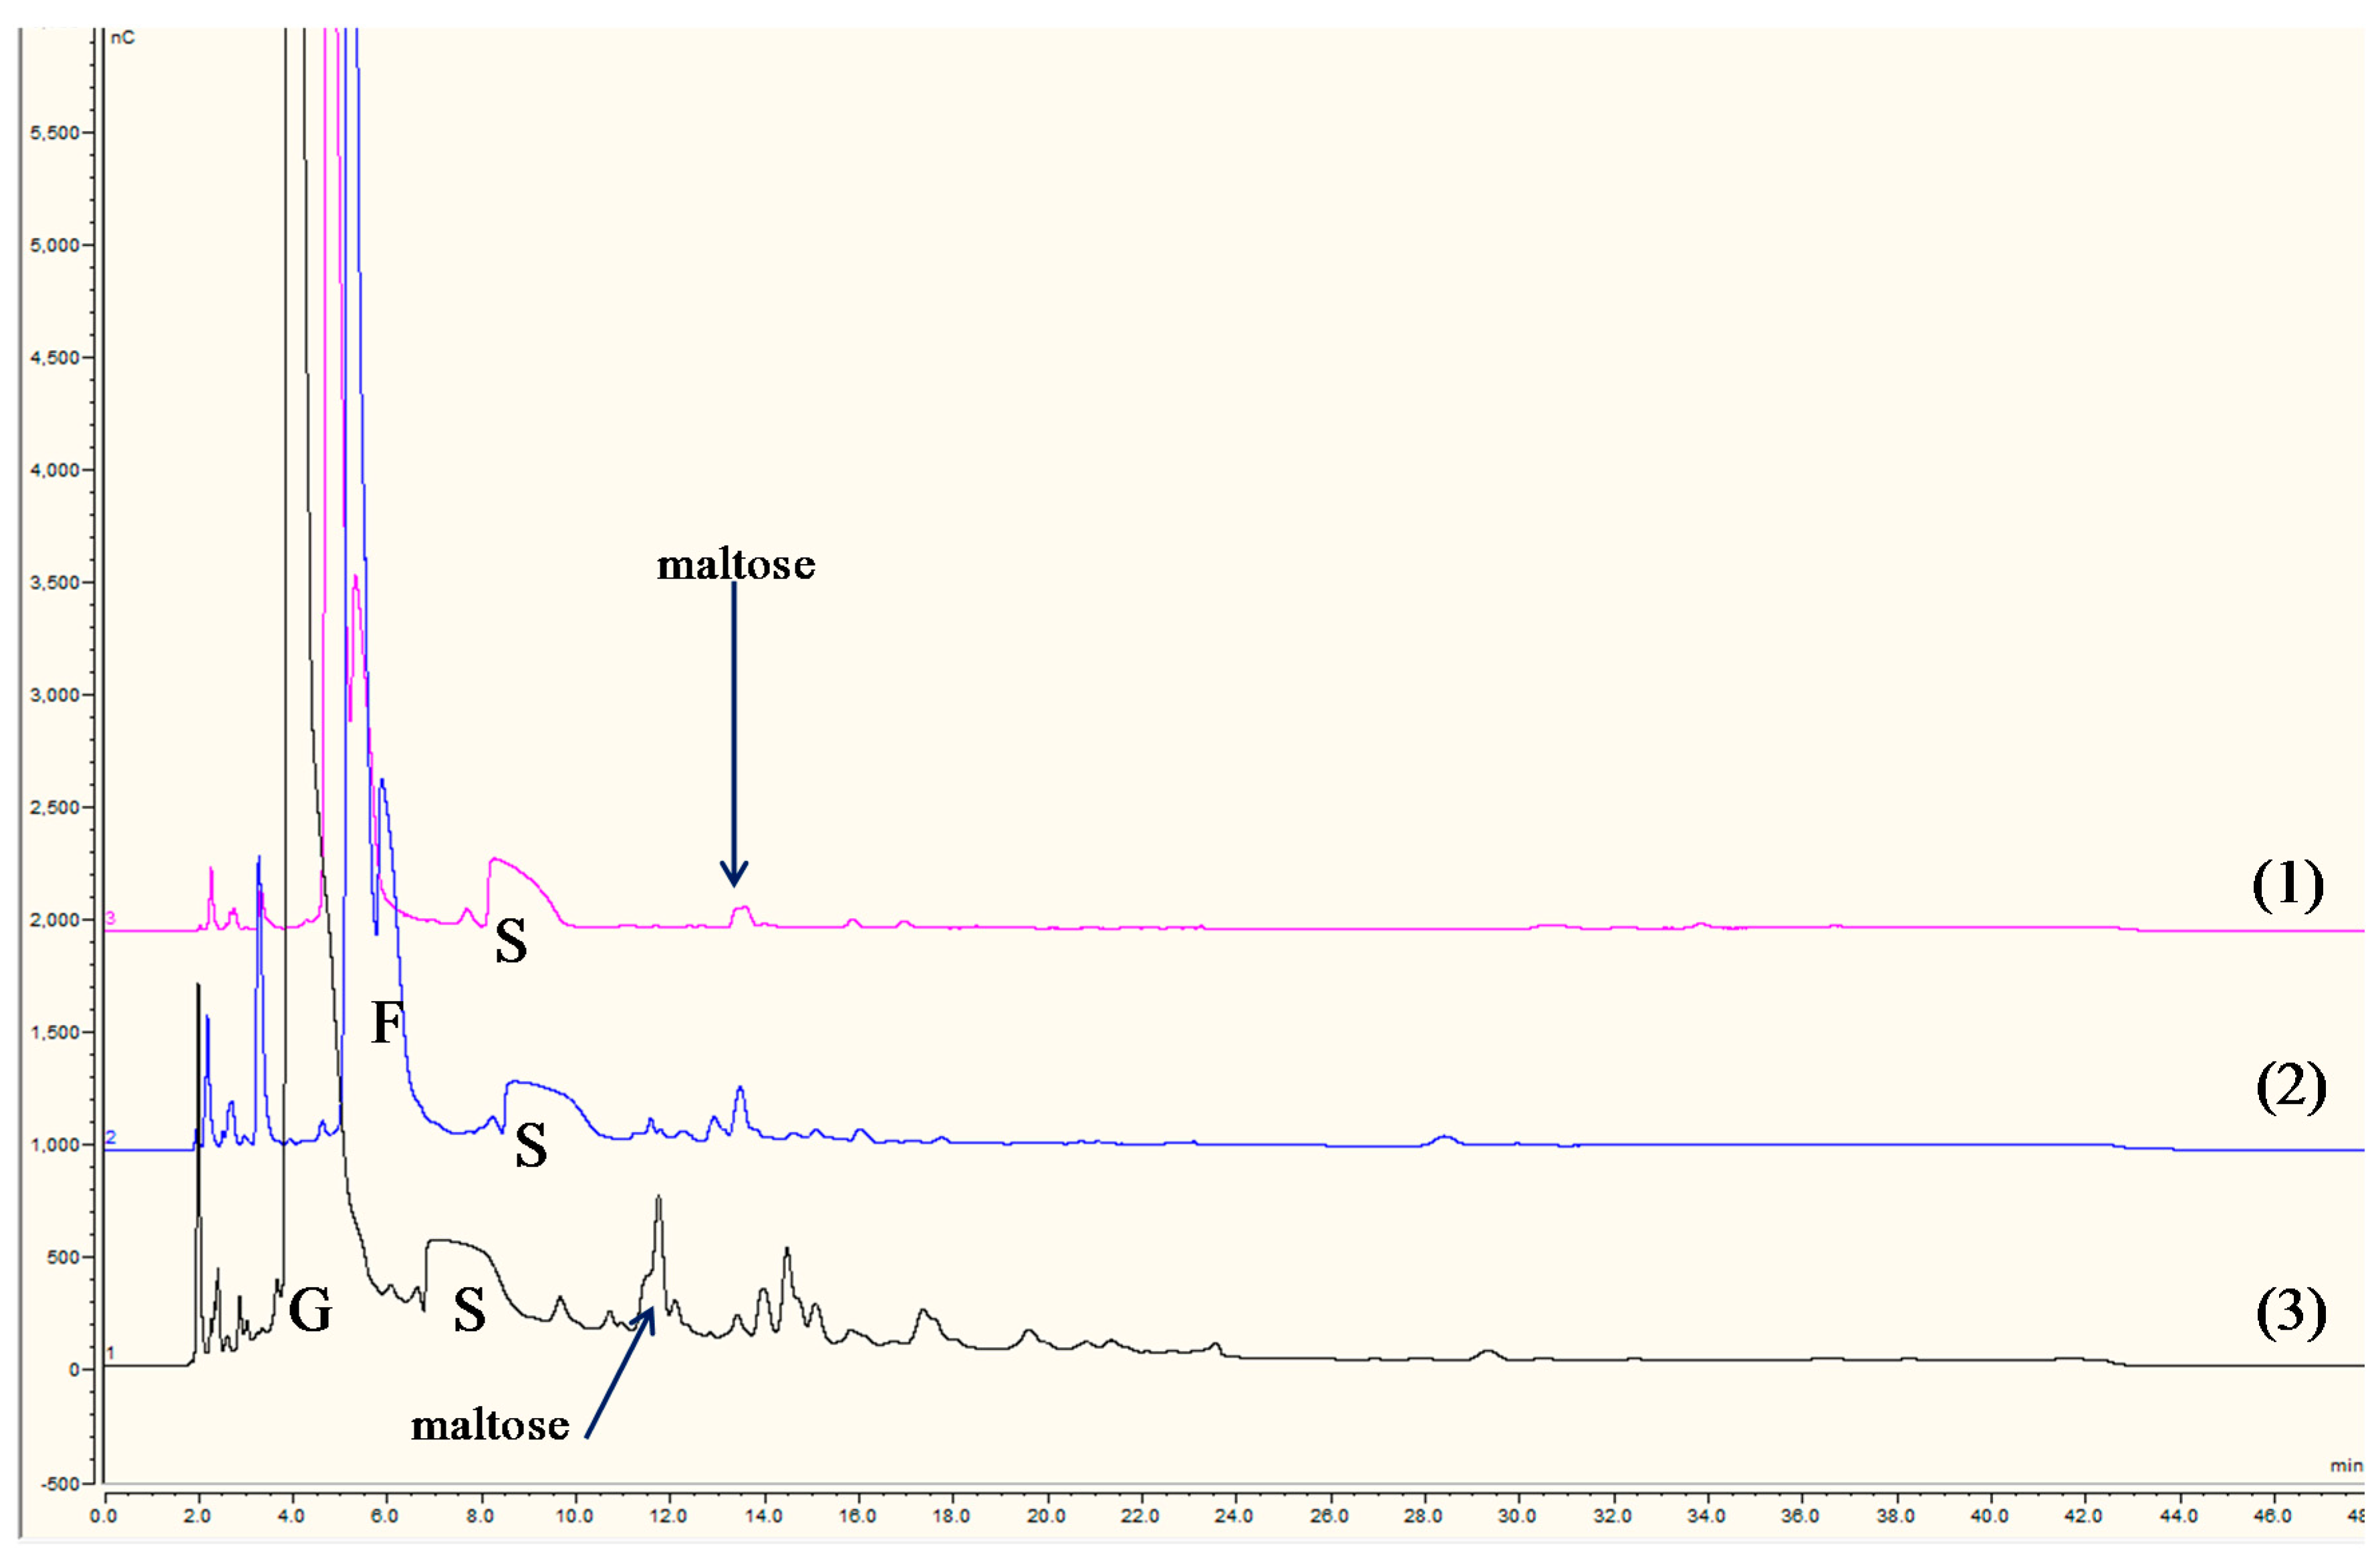
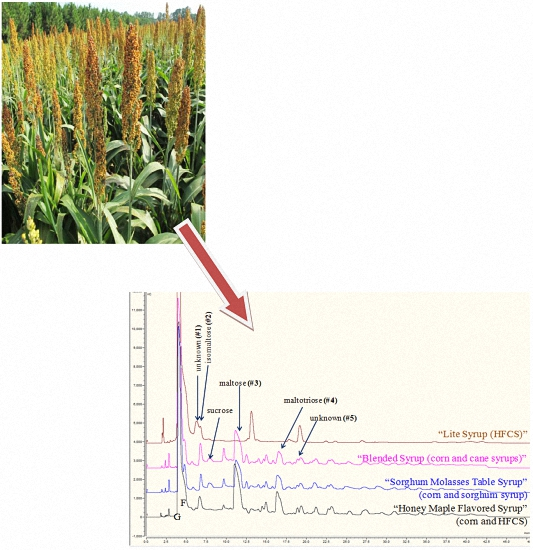
3.1. IC-IPAD Fingerprint Chromatograms of Known Sweet Sorghum Syrups

IC-IPAD oligosaccharide fingerprint profiles have been used to screen, differentiate, and authenticate white, refined sugars manufactured from either sugarcane or sugar beets [8]. The latter is a problem when illegal intermixing of (less expensive to produce) cane white sugar (CWS) with beet white sugar (BWS) occurs. Eggleston et al. [8] developed an IC-IPAD NaOH/NaOAc gradient method over 45 min which could even measure the percentage of CWS in a CWS/BWS mixture. Because IC-IPAD has (i) become a preferred technique for the routine monitoring of sugars in sugar industry products [7]; (ii) been used to detect simple types of adulteration such as the addition of sucrose to honey [6] and addition of HFCS to maple syrup [10]; and (iii) a very high sensitivity that offered the great advantage in detecting very low levels of adulterant compounds, its use to authenticate commercial sweet sorghum syrups was investigated.
IC-IPAD chromatograms of known (authentic) sweet sorghum syrups (all at 7.0 Brix) are illustrated in Figure 2. It was essential that the sweet sorghum syrups used to constitute the reference control set, from which decisions relating to the authenticity of test samples were to be made, were of unimpeachable authenticity. For this reason, the known sweet sorghum samples were obtained directly from manufacturers that had previously undertaken trusted collaborative research with the authors. By overloading the column with high concentrations of glucose, fructose, and sucrose present in the 7.0 Brix solutions of the syrups, the presence of a natural range of mono, di, and oligosaccharides as well as other compounds were detectable (Figure 2). This highlights another marked advantage of this IC-IPAD method in that the anion exchange CarboPac™ PA1 column can tolerate high concentrations of samples (up to 20 Brix [19]), yet still detect low levels of oligosaccharides and other compounds of interest. Moreover, extensive column washings between runs are not required [19]. The very large glucose, fructose, and especially sucrose peaks cannot be quantitated at these high concentrations but are, generally, separated from these other low level oligosaccharides permitting their quantitation.
As illustrated in Figure 2 the IC fingerprint patterns of all the authentic sweet sorghum syrups were generally similar, with slight variations in the amounts of oligosaccharides from 10 to 15 min RT. Eggleston et al. [20] recently reported that IC fingerprint chromatograms of sweet sorghum juices from different cultivars were also similar. In this study, all the sweet sorghum syrups contained relatively low amounts of oligosaccharides. After approximately 22 min column retention time (RT) the oligosaccharide profile became simpler in the samples (Figure 2). Eggleston et al. [8] also showed that IC fingerprint profiles of cane white sugars from different geographical sources showed very similar patterns, with less oligosaccharides peaks after 22 min RT. The general similarity in profiles for the authentic sweet sorghum syrups, however, indicated that it may not be possible to trace the geographical origin of the syrup.
Although few oligosaccharides were found in the authentic sweet sorghum syrups, maltose disaccharide (O-α-d-Glcp-(1→4)-O-β-d-Glcp), occurred in all the samples, and possibly smaller amounts of associated starch oligosaccharides. This is not entirely surprising, as starch is known to vary strongly with sweet sorghum cultivar and physiological maturity stage [4,21]. In particular, sweet sorghum cultivar M81E is highly favored by sweet sorghum growers and processors because of its excellent production yields but, unfortunately, it contains very high starch concentrations of up to 18,000 mg L−1 [21,22]. Furthermore, if clarification of the juice during syrup production is not efficient, some starch may remain in the syrup even in the insoluble, granular form [21]. α-Amylase is typically not used during sweet sorghum syrup manufacture because of the high load of insoluble starch and its relatively high cost [21]; thus, it is not clear why starch hydrolysis products should exist in the syrup. A better explanation is that like sugarcane, another grass, oligosaccharides associated with starch biosynthesis occur in the sweet sorghum plant. The occurrence of maltose in authentic sweet sorghum samples does mean this marker alone cannot be used to identify sweet sorghum syrups adulterated with inexpensive corn syrups.

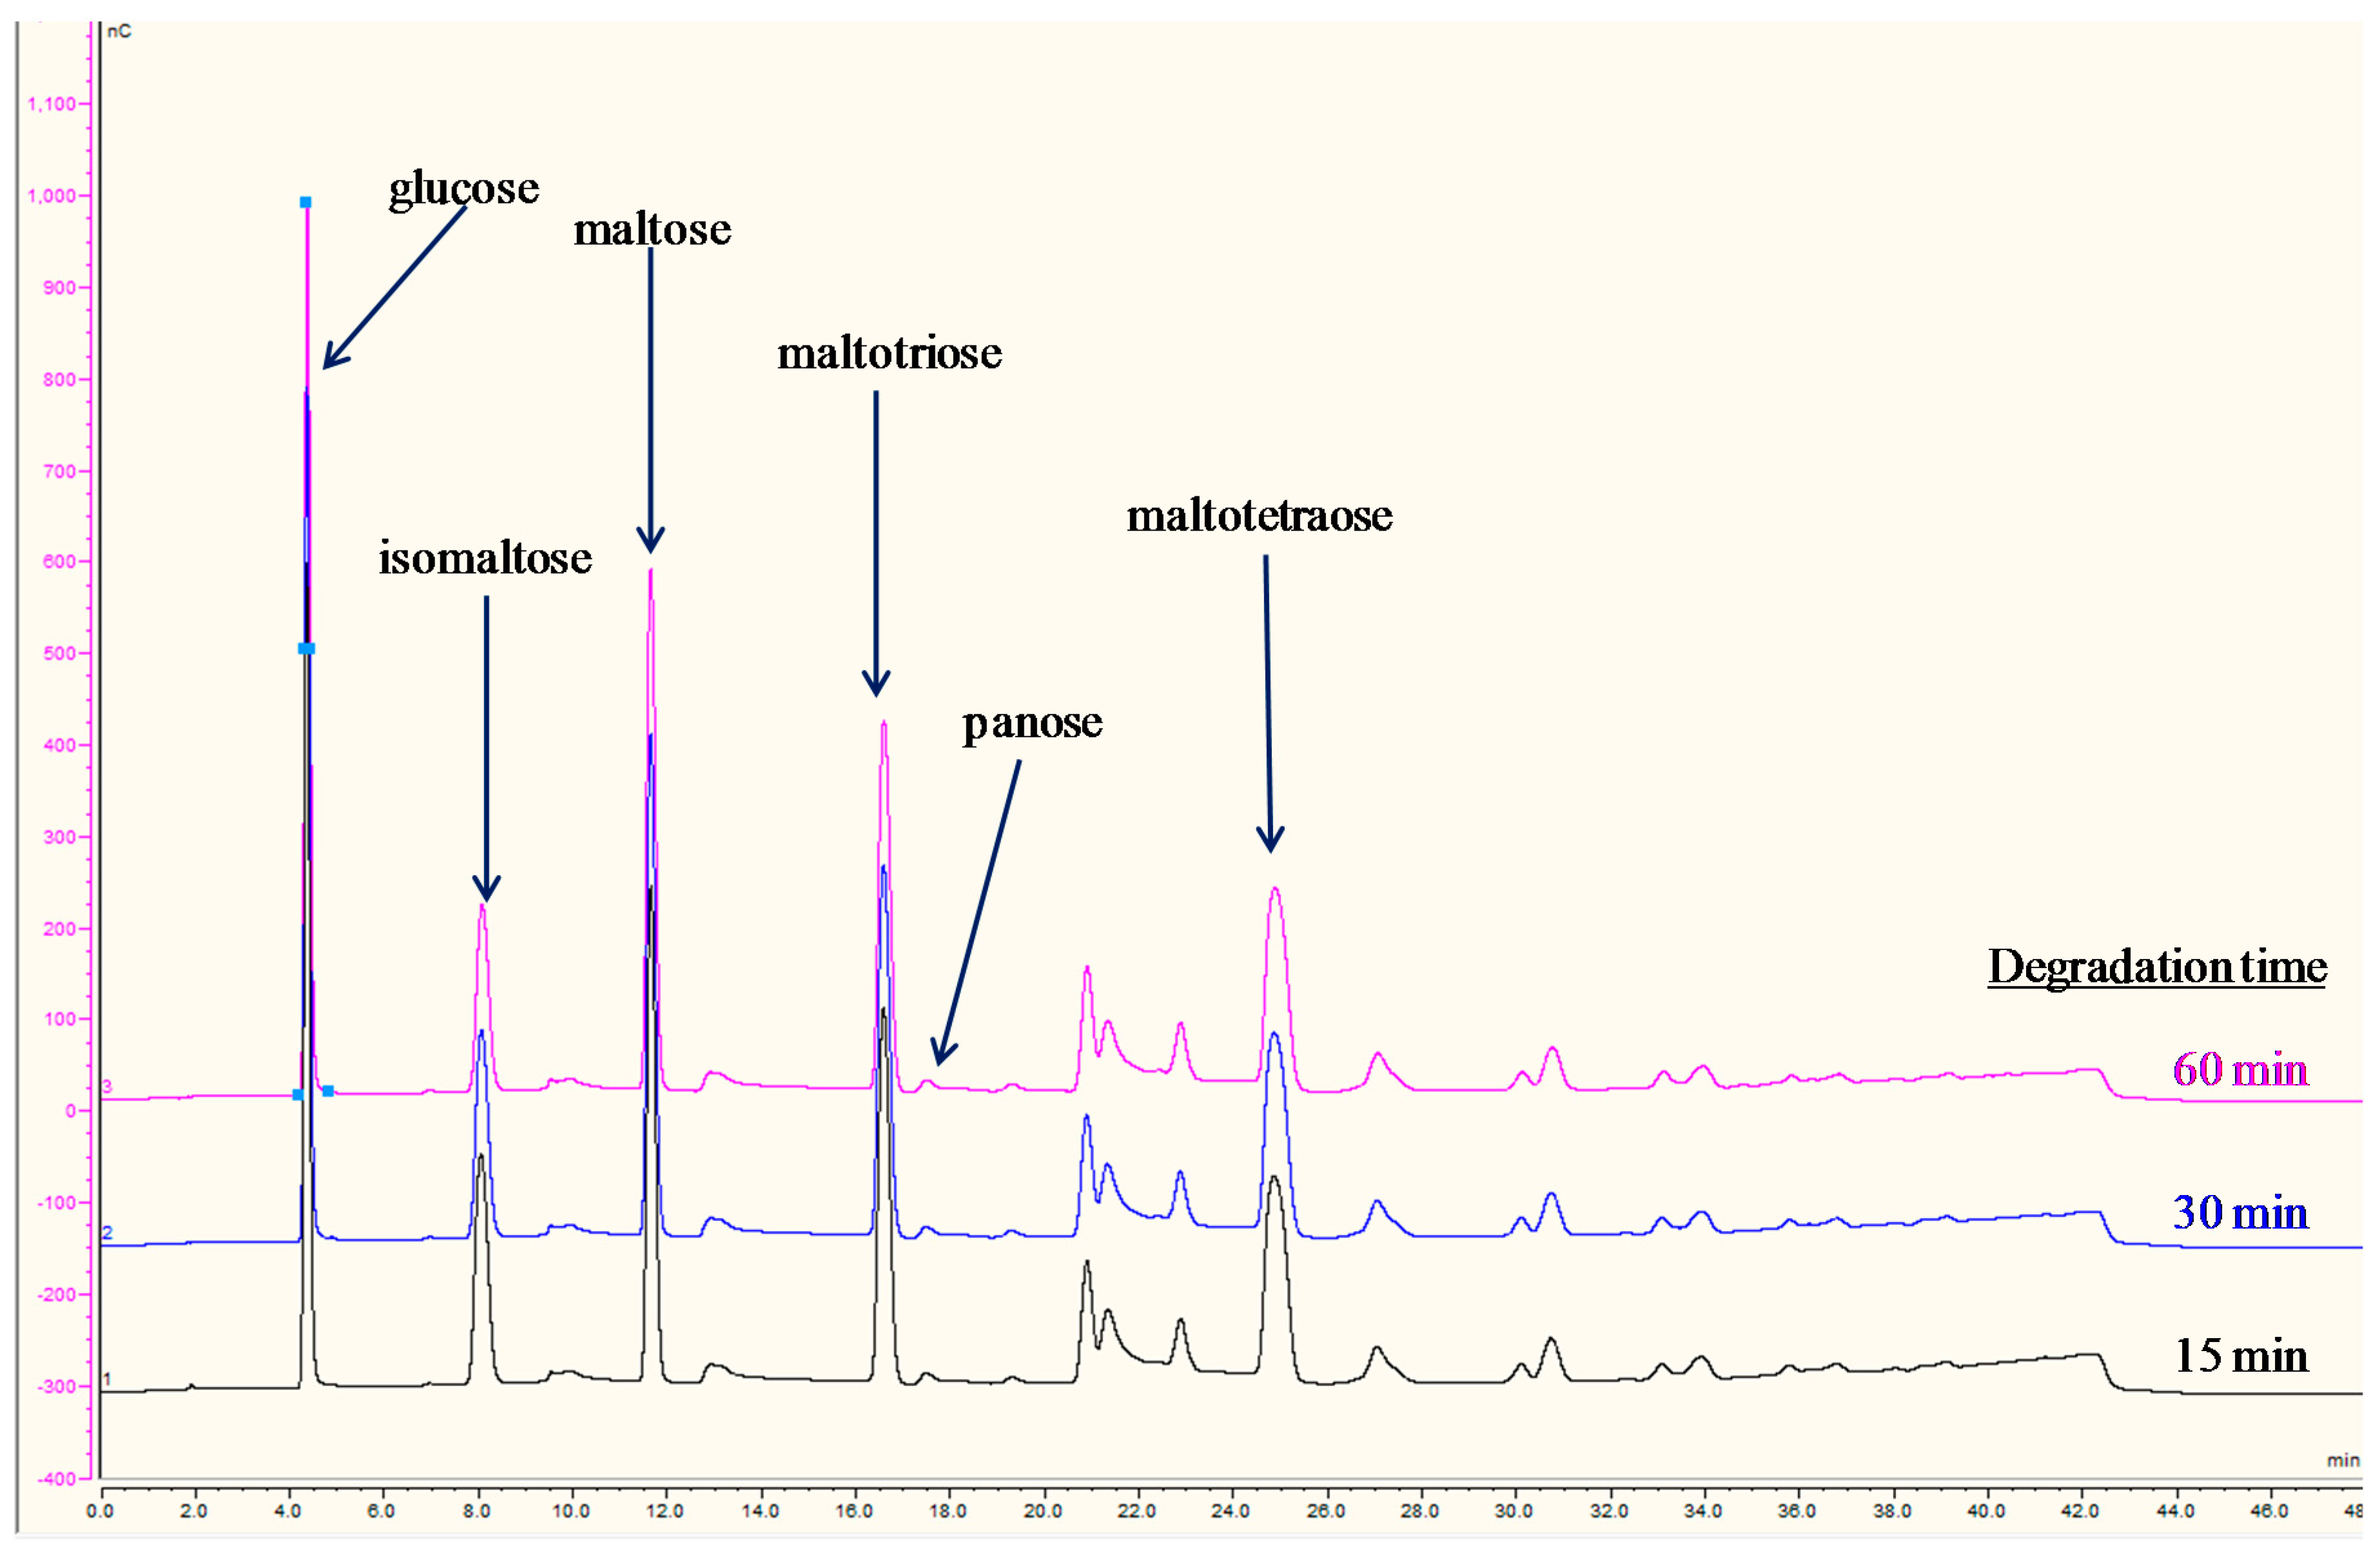
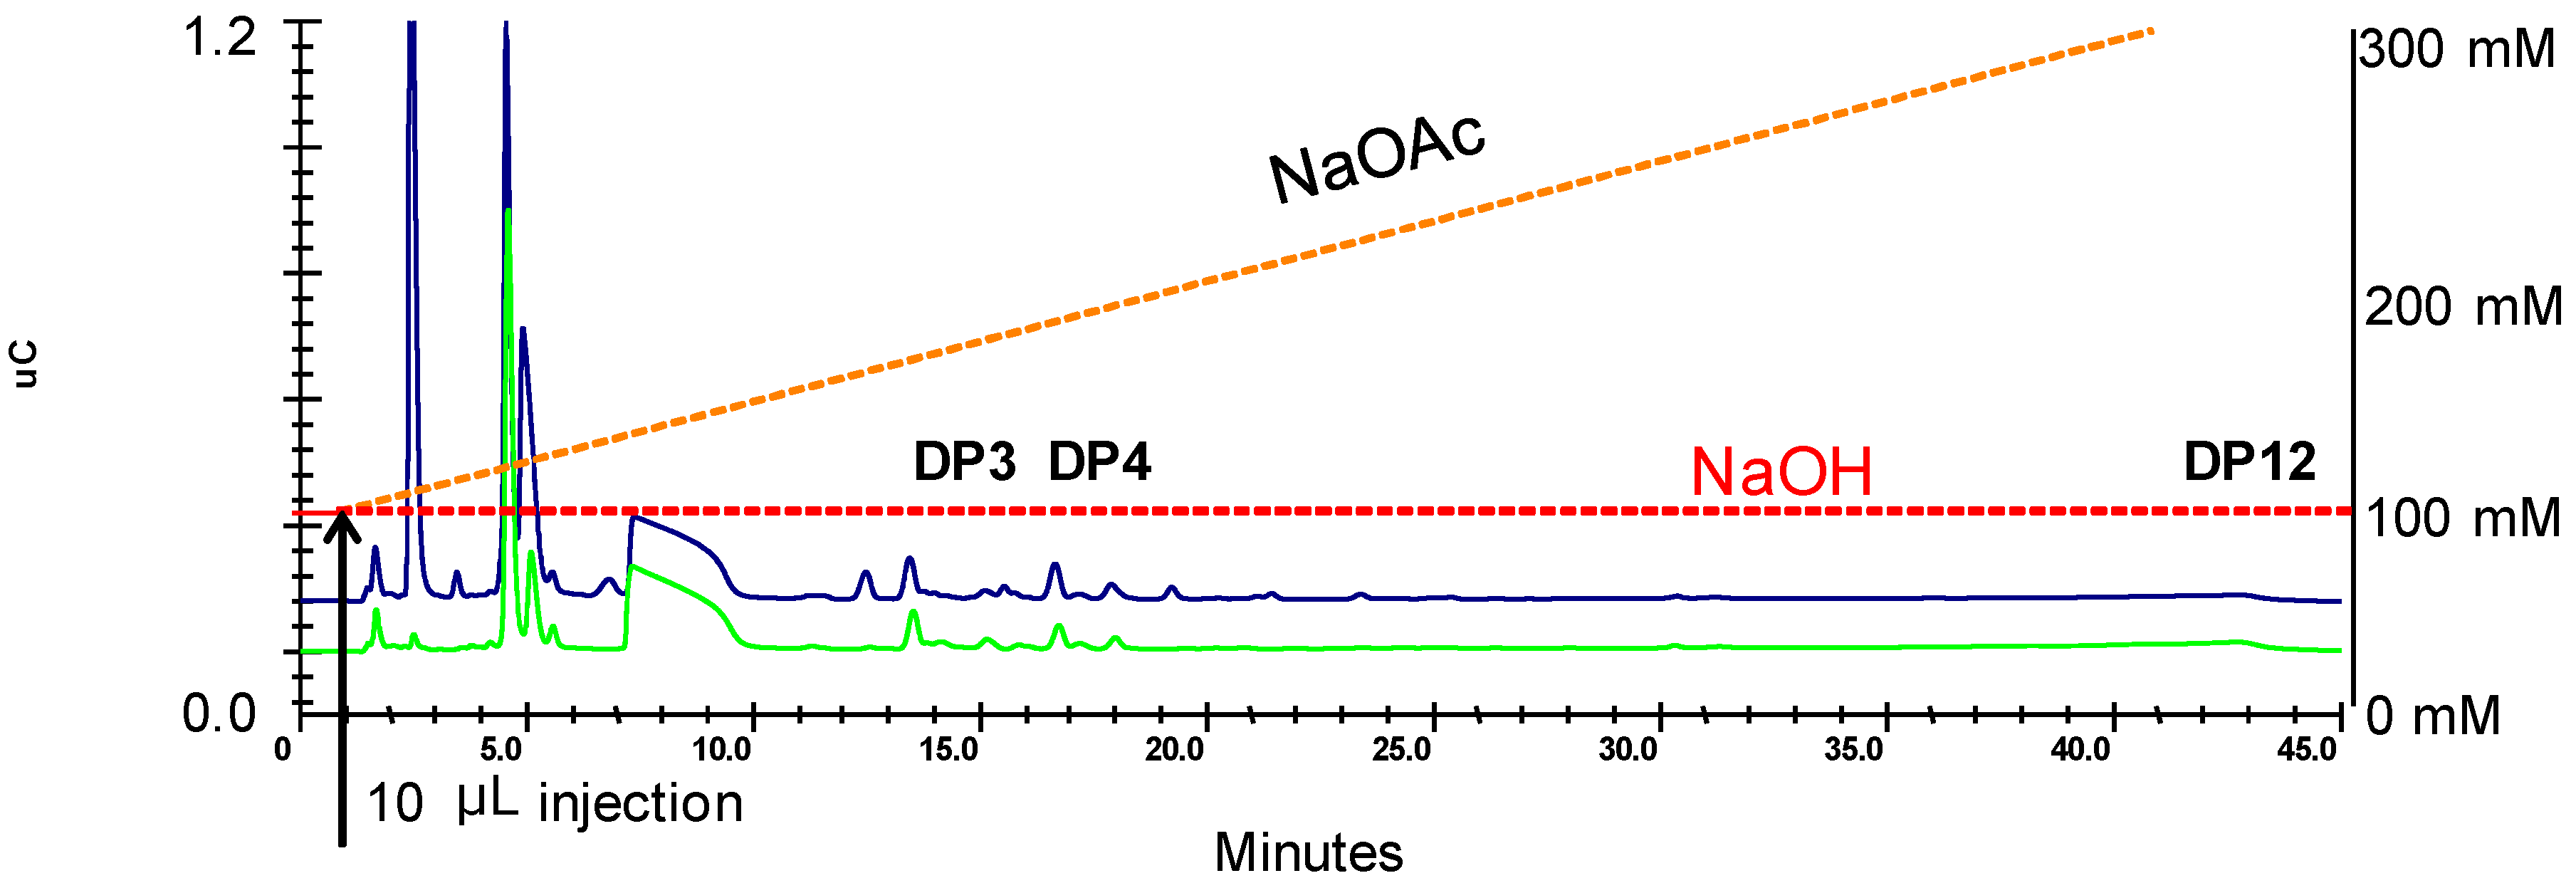
3.2. IC-IPAD Fingerprint Chromatograms of Starch Hydrolysis Products

Figure 3 shows overlaid chromatograms of standards of a starch solution treated with α-amylase to produce starch hydrolysis (maltooligosaccharides and dextrins) products. Such products are expected to occur in inexpensive HFCS and corn syrups [16,23]. Glucose, maltose (O-α-d-Glcp-(1→4)-O-β-d-Glcp), isomaltose (O-α-d-Glcp-(1→6)-O-β-d-Glcp), maltotriose (O-α-d-Glcp-(1→4)-O-β-d-Glcp-(1→4)-O-α-d-Glcp), and maltotetraose (O-α-d-Glcp-(1→4)-O-β-d-Glcp-(1→4)-O-α-d-Glcp-(1→4)-O-α-d-Glcp), were identified as major markers of starch breakdown. These four oligosaccharides have previously been reported as major hydrolysis products of amylopectin and amylase, the constituent polysaccharides of starch [24]. Panose trisaccharide (4-α-isomaltosylglucose) was also identified just after the maltotriose peak. Panose is a minor hydrolysis product synthesized from maltose during the enzymatic hydrolysis of amylose and amylopectin starch polysaccharides [25]. Larger oligosaccharides were also present and tentatively identified as maltopentaose (O-α-d-Glcp-(1→4)-O-β-d-Glcp-(1→4)-O-α-d-Glcp-(1→4)-O-α-d-Glcp-(1→4)-O-α-d-Glcp), and maltohexaose (O-α-d-Glcp-(1→4)-O-β-d-Glcp-(1→4)-O-α-d-Glcp-(1→4)-O-α-d-Glcp-(1→4)-O-α-d-Glcp-(1→4)-O-α-d-Glcp).
Oligosaccharides in sugar crops are either primary or secondary. Primary oligosaccharides are synthesized in vivo from a mono- or oligosaccharide and a glycosyl donor by the action of a glycosyl transferase [26]. The vast majority of primary oligosaccharides are based on sucrose. Examples include theanderose (O-α-d-Glcp-(1→6)-O-α-d-Glcp-(1→2)-β-d-Fruf) in sugarcane [8] and raffinose (O-α-d-Galp-(1→6)-O-α-d-Glcp-(1→2)-β-d-Fruf) which occurs in sugar beet, sugarcane (to a much lower extent), and sweet sorghum [27]. In comparison, secondary oligosaccharides are those formed in vivo or in vitro by hydrolysis of higher MW oligosaccharides, polysaccharides, glycoproteins, and glycolipids [26], and this could occur during processing. Examples of secondary oligosaccharides found in sugar crop juices are those formed on microbial deterioration or starch hydrolysis. The main cause of microbial deterioration of sugar crops including sweet sorghum is from lactic acid bacteria, particularly Leuconostoc mesenteroides [20,28]. The main oligosaccharides produced are glycosyl acceptor (secondary) products, i.e., isomaltooligosaccharides produced from the action of dextransucrase (EC 2.4.1.5) [29]. Other oligosaccharides formed on sugarcane deterioration include kestoses (GF2 trisaccharides), e.g., 1-kestose (O-α-d-Glcp-(1→2)-O-β-d-Fruf-(1→2)-β-d-Fruf) which can be produced from (i) invertase (EC 3.2.1.26) activity during yeast deterioration in more dry environments or (ii) from the acid degradation of sucrose during processing [30]. Kestoses, however, are also primary oligosaccharides that occur naturally in the sugarcane plant, particularly in the leaves and top part of the stalk [31].

3.3. Comparison of Commercial Sugar Syrups

Many commercially available inexpensive sugar syrups could be used to adulterate sweet sorghum syrups including high fructose corn syrup (HFCS), corn syrup, and sugar beet or sugarcane pure or inverted syrups. As a consequence, an assortment of commercial corn, HFCS, and sugarcane syrups were analyzed using the IC-IPAD gradient method, as well as maple and sorbitol syrups for comparison (see Table 1); results are illustrated in Figure 4, Figure 5, Figure 6 and Figure 7. As listed in Table 1, the variations in pH and Brix among the syrups were no indication of the syrup type. Low and Wudrich [23] previously reported that it was impossible to use such parameters to distinguish between adulterated and authentic citrus fruit juices.

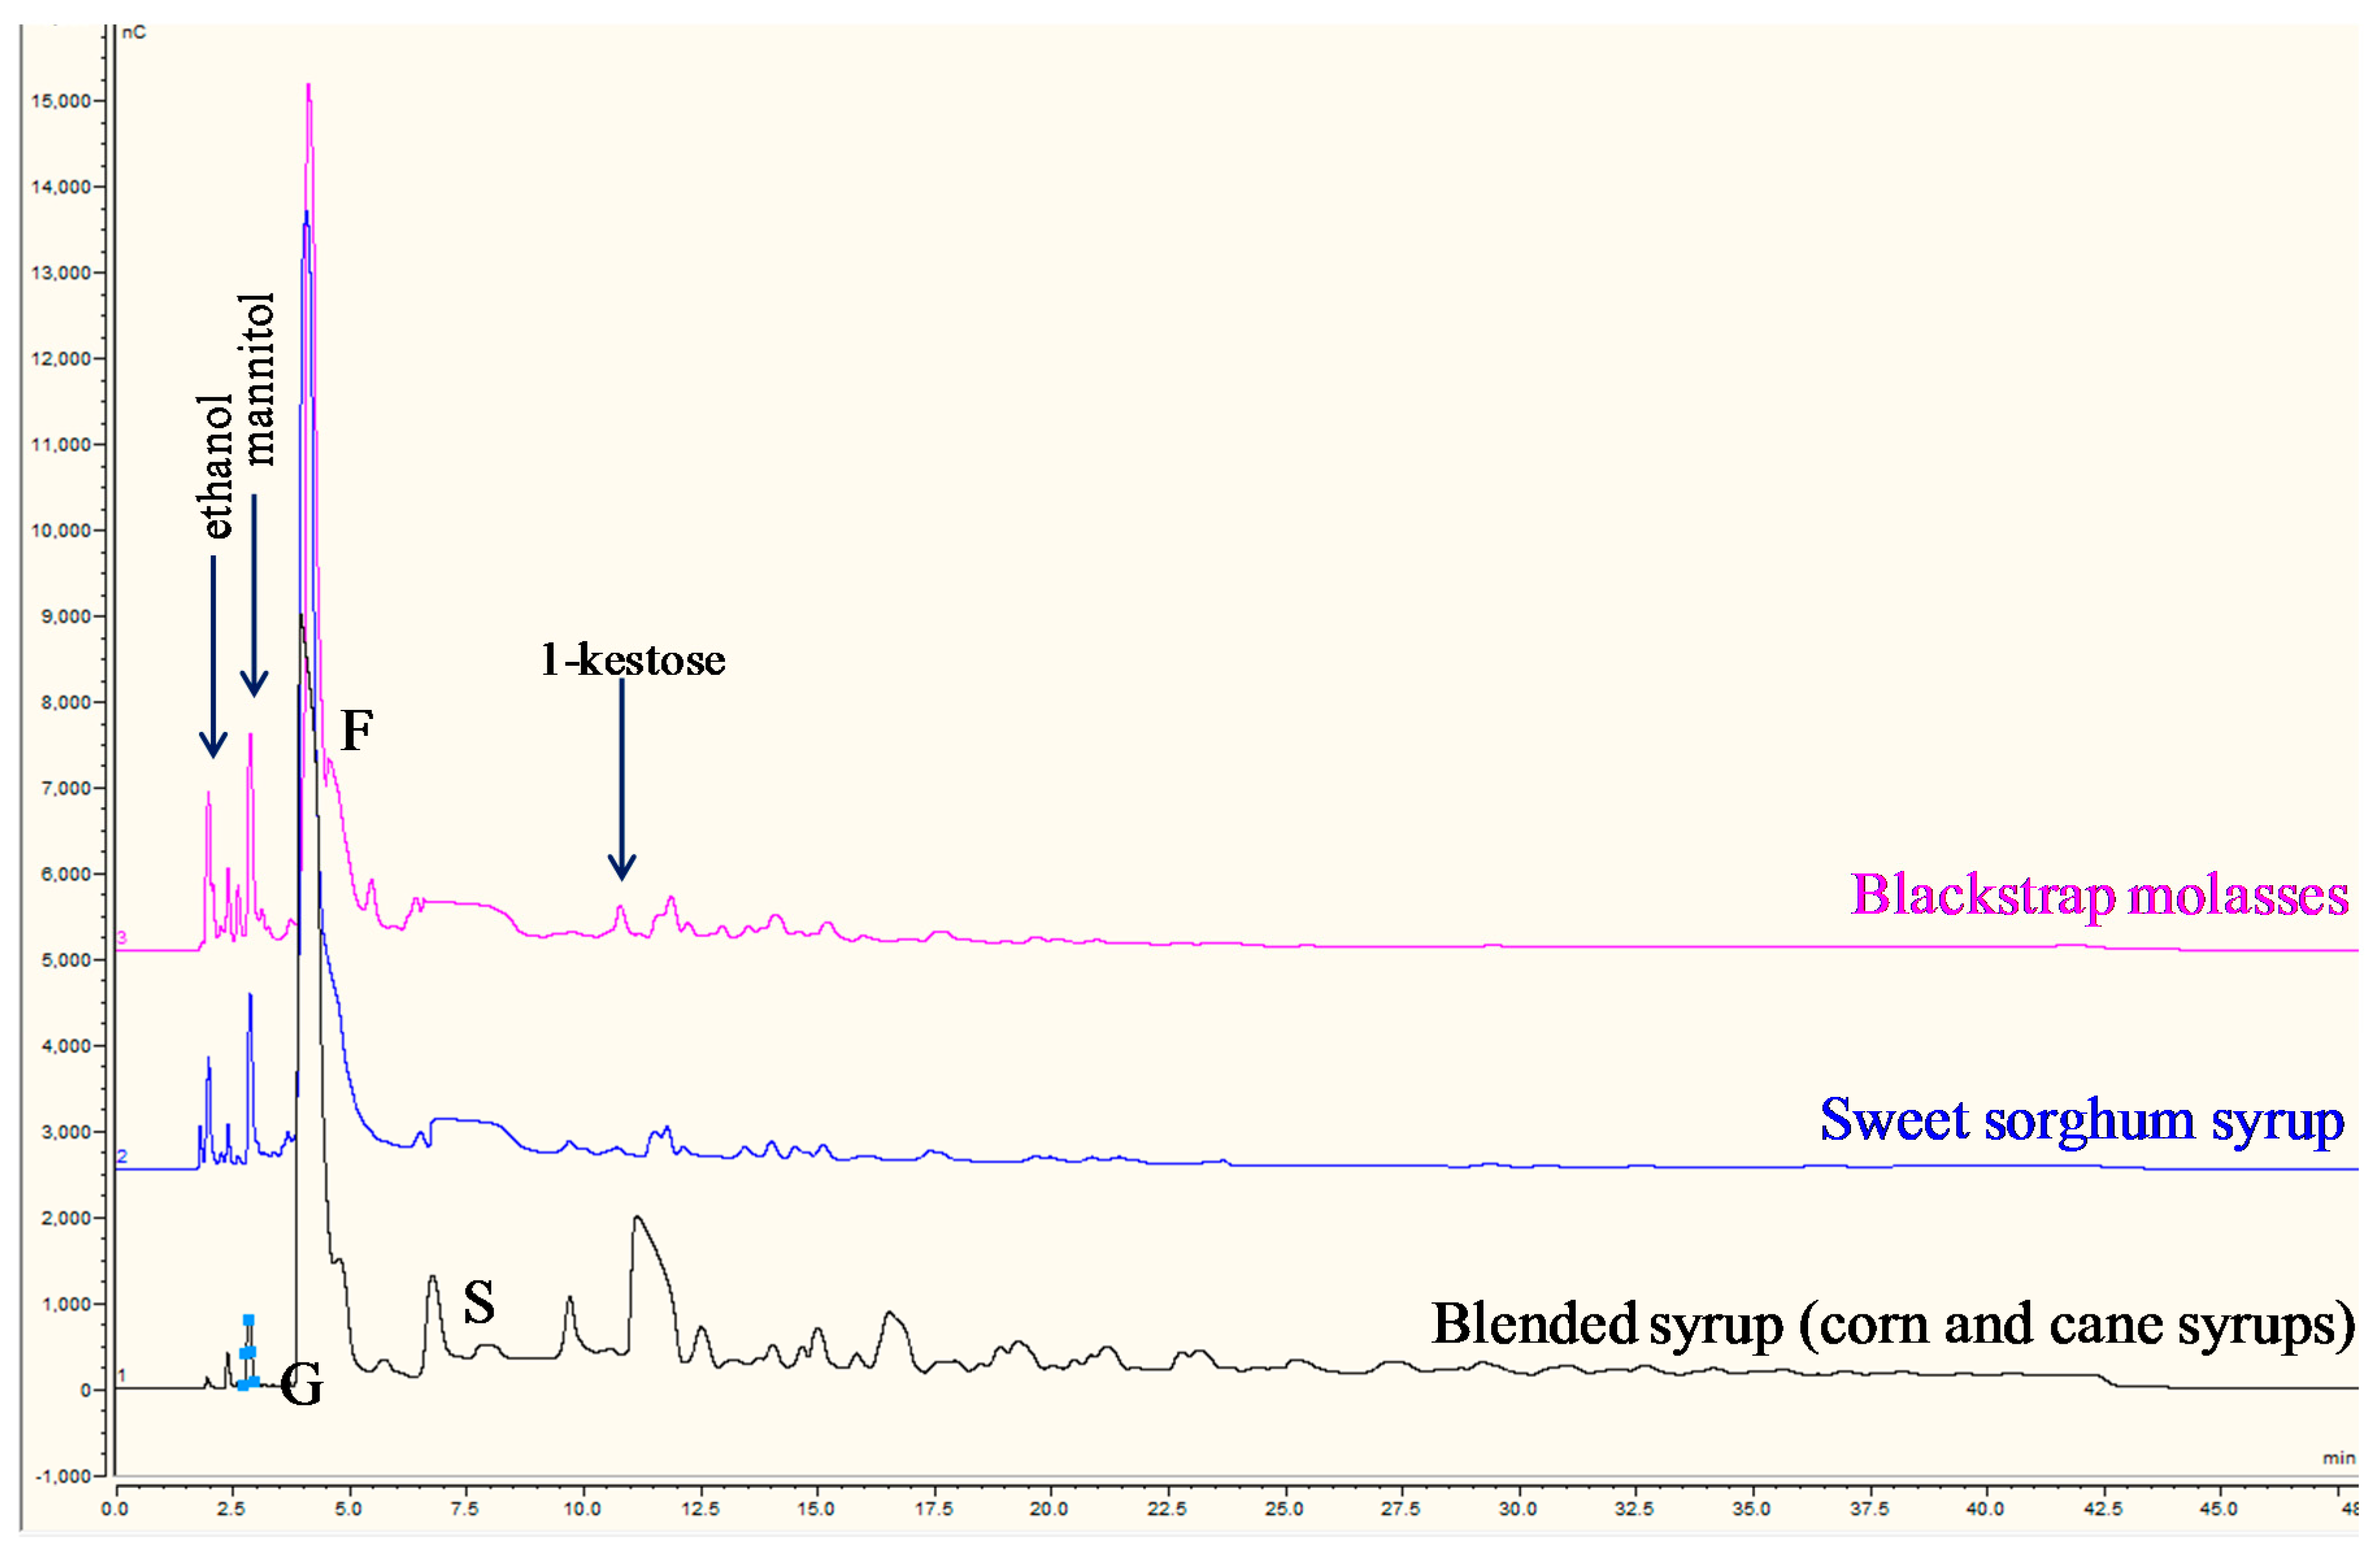
3.3.1. Mannitol Marker

Some of the syrup chromatograms, e.g., the blended syrup containing corn and pure sugarcane syrup, as well as sweet sorghum and all the cane molasses samples, contained mannitol (Figure 4). Mannitol (a sugar alcohol) is a major degradation product of Leuconostoc bacterial deterioration of sugar crops including sweet sorghum [20,28]. Mannitol is, therefore, not a marker for adulteration but rather an indicator that the syrup was manufactured from deteriorated sugar juice, with the size of the mannitol peak indicating the extent of deterioration. Since mannitol is a reduced carbohydrate that is a weaker acid than its non-reduced counterpart mannose, it is poorly retained on the CarboPac™ PA1 column, which explains its early elution at 2.9 min RT (Figure 4). Ethanol is also formed during the Leuconostoc deterioration of sugarcane but is only a minor metabolite of Leuconostoc compared to mannitol and dextran [28]. Similar to mannitol, ethanol elutes very early (~1.99 min RT) due to its weak interaction with the stationary phase in the column. Detection of ethanol by PAD using a gold working electrode has been reported to be less sensitive than for mannitol [7]. As discussed in Section 3.1, 1-kestose was present in the samples containing cane molasses and syrups. 1-Kestose is a primary oligosaccharide found mostly in the leaves and top part of the stalk or formed on deterioration, mostly in dry environments [31]. As mannitol was also present in these products, and this is formed on Leuconostoc bacterial sugarcane deterioration that favors wet and humid conditions, the 1-kestose is more likely to have been a primary oligosaccharide.

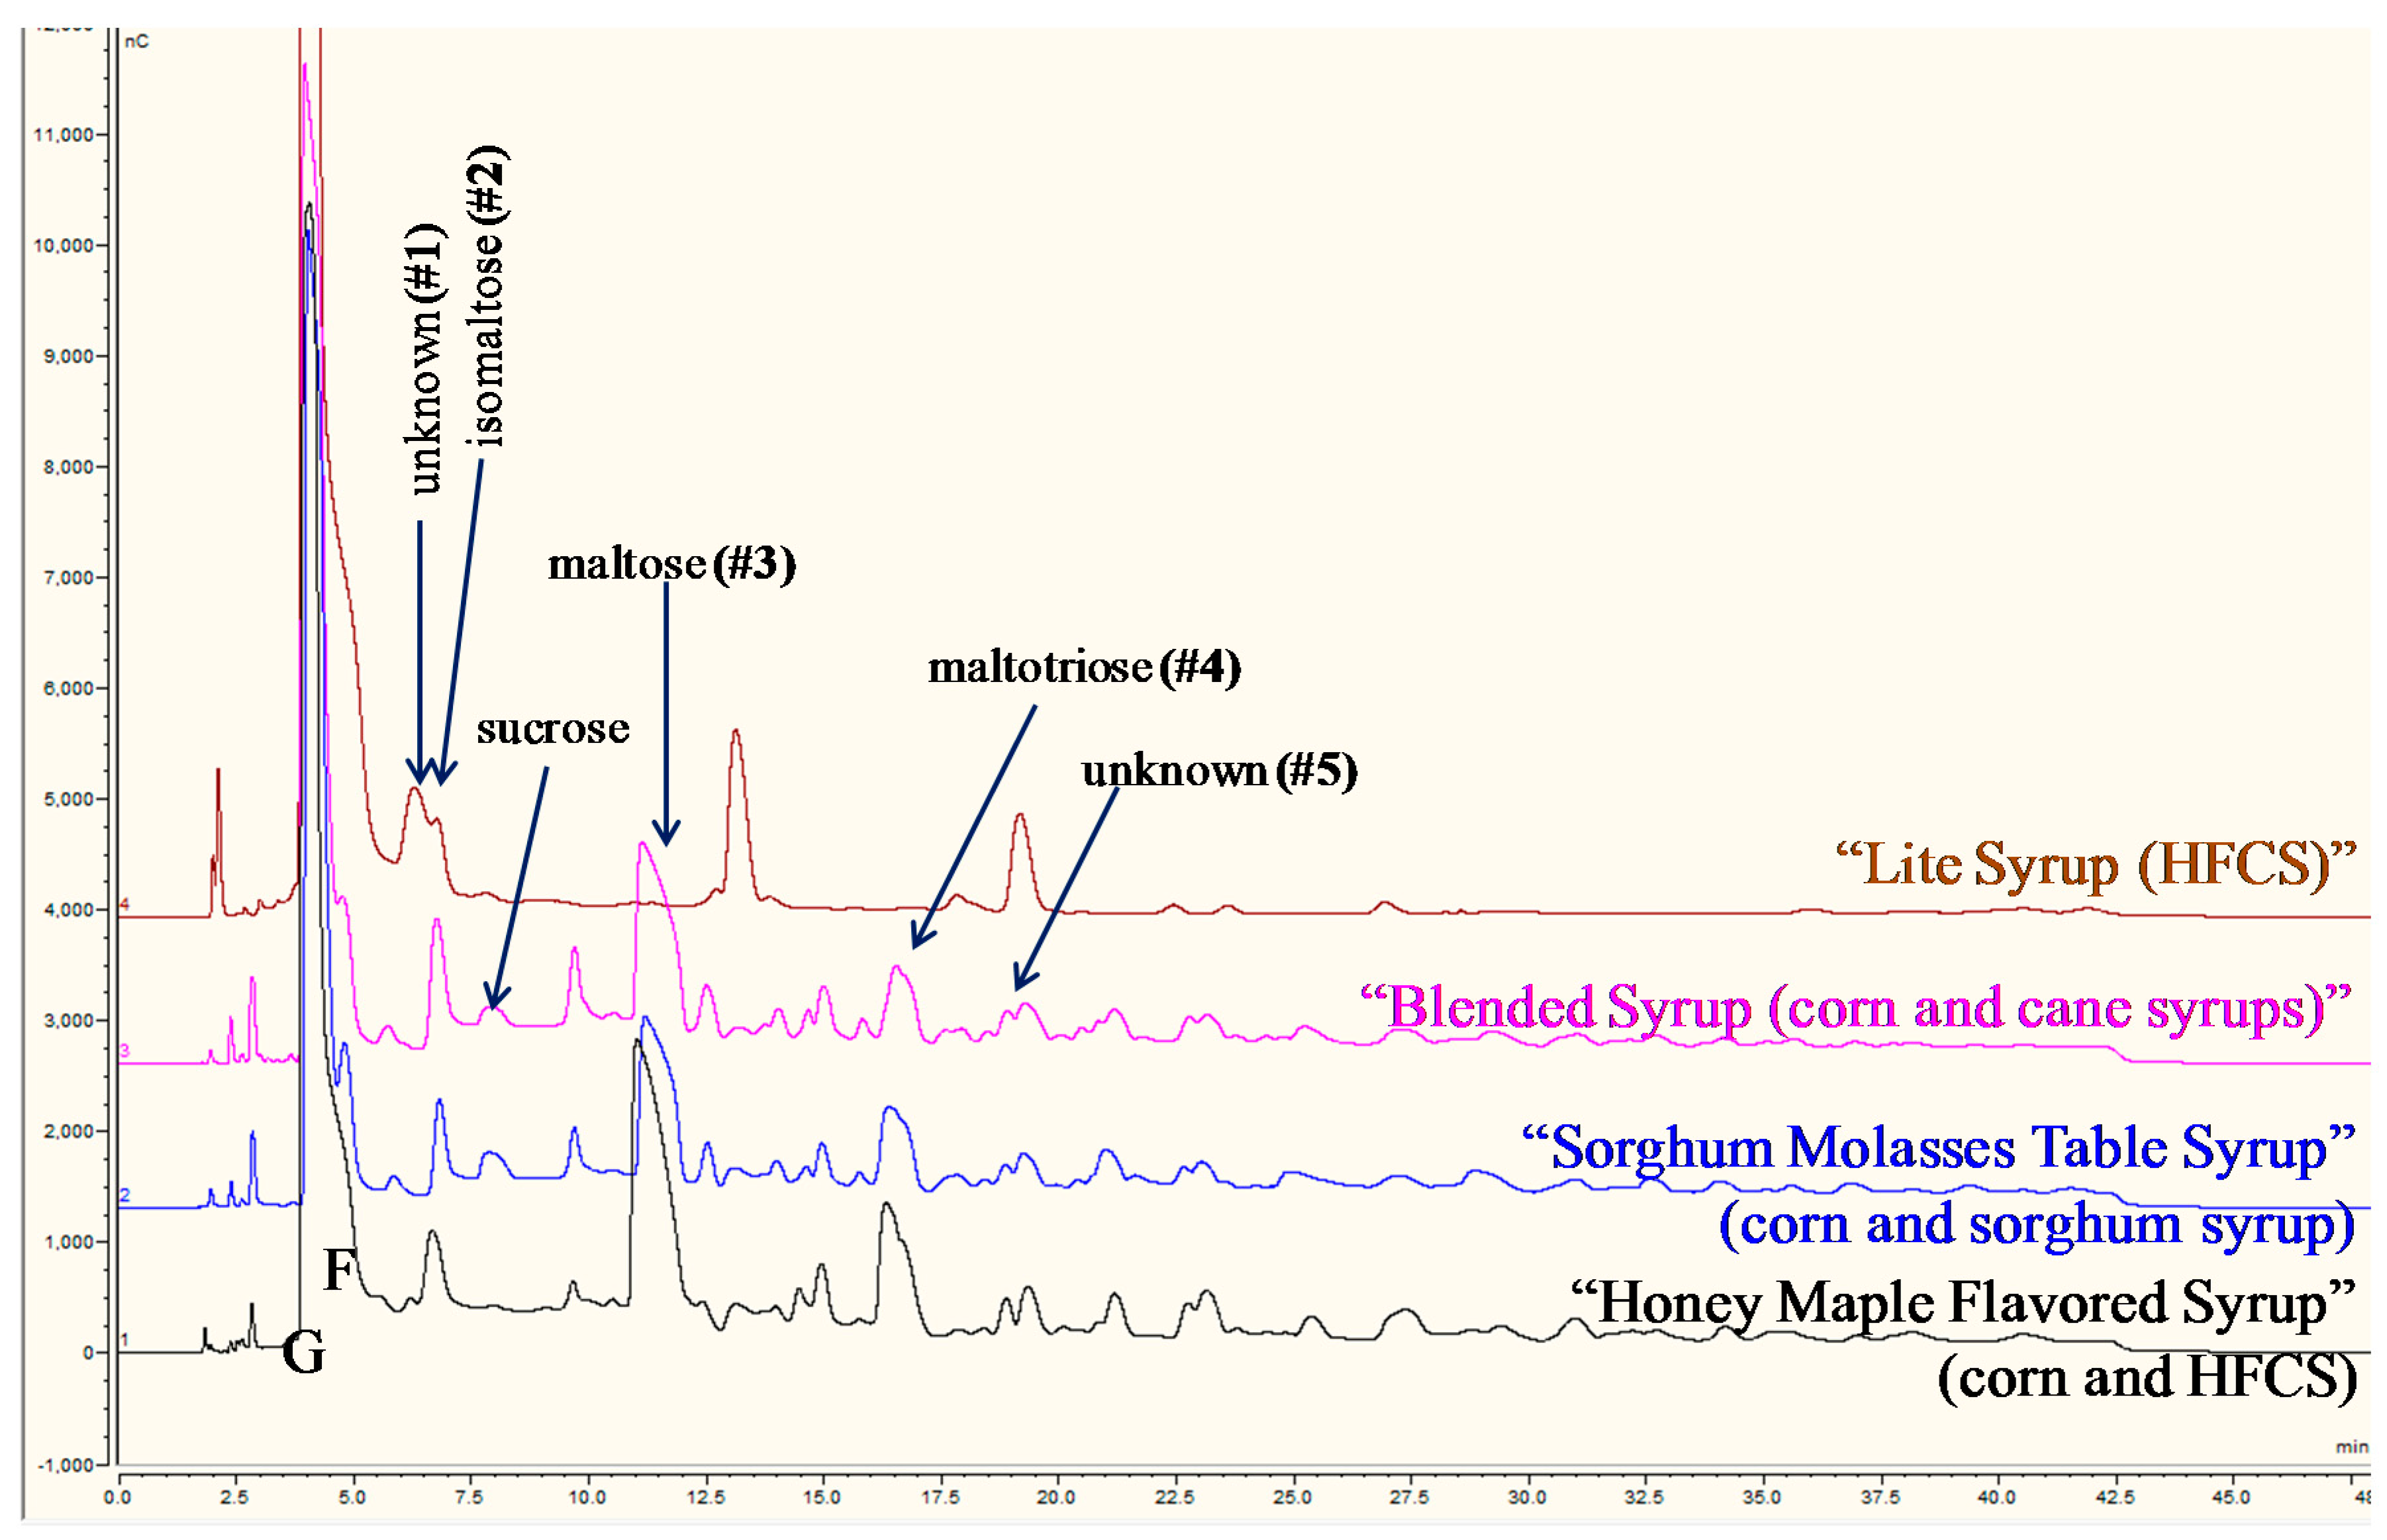
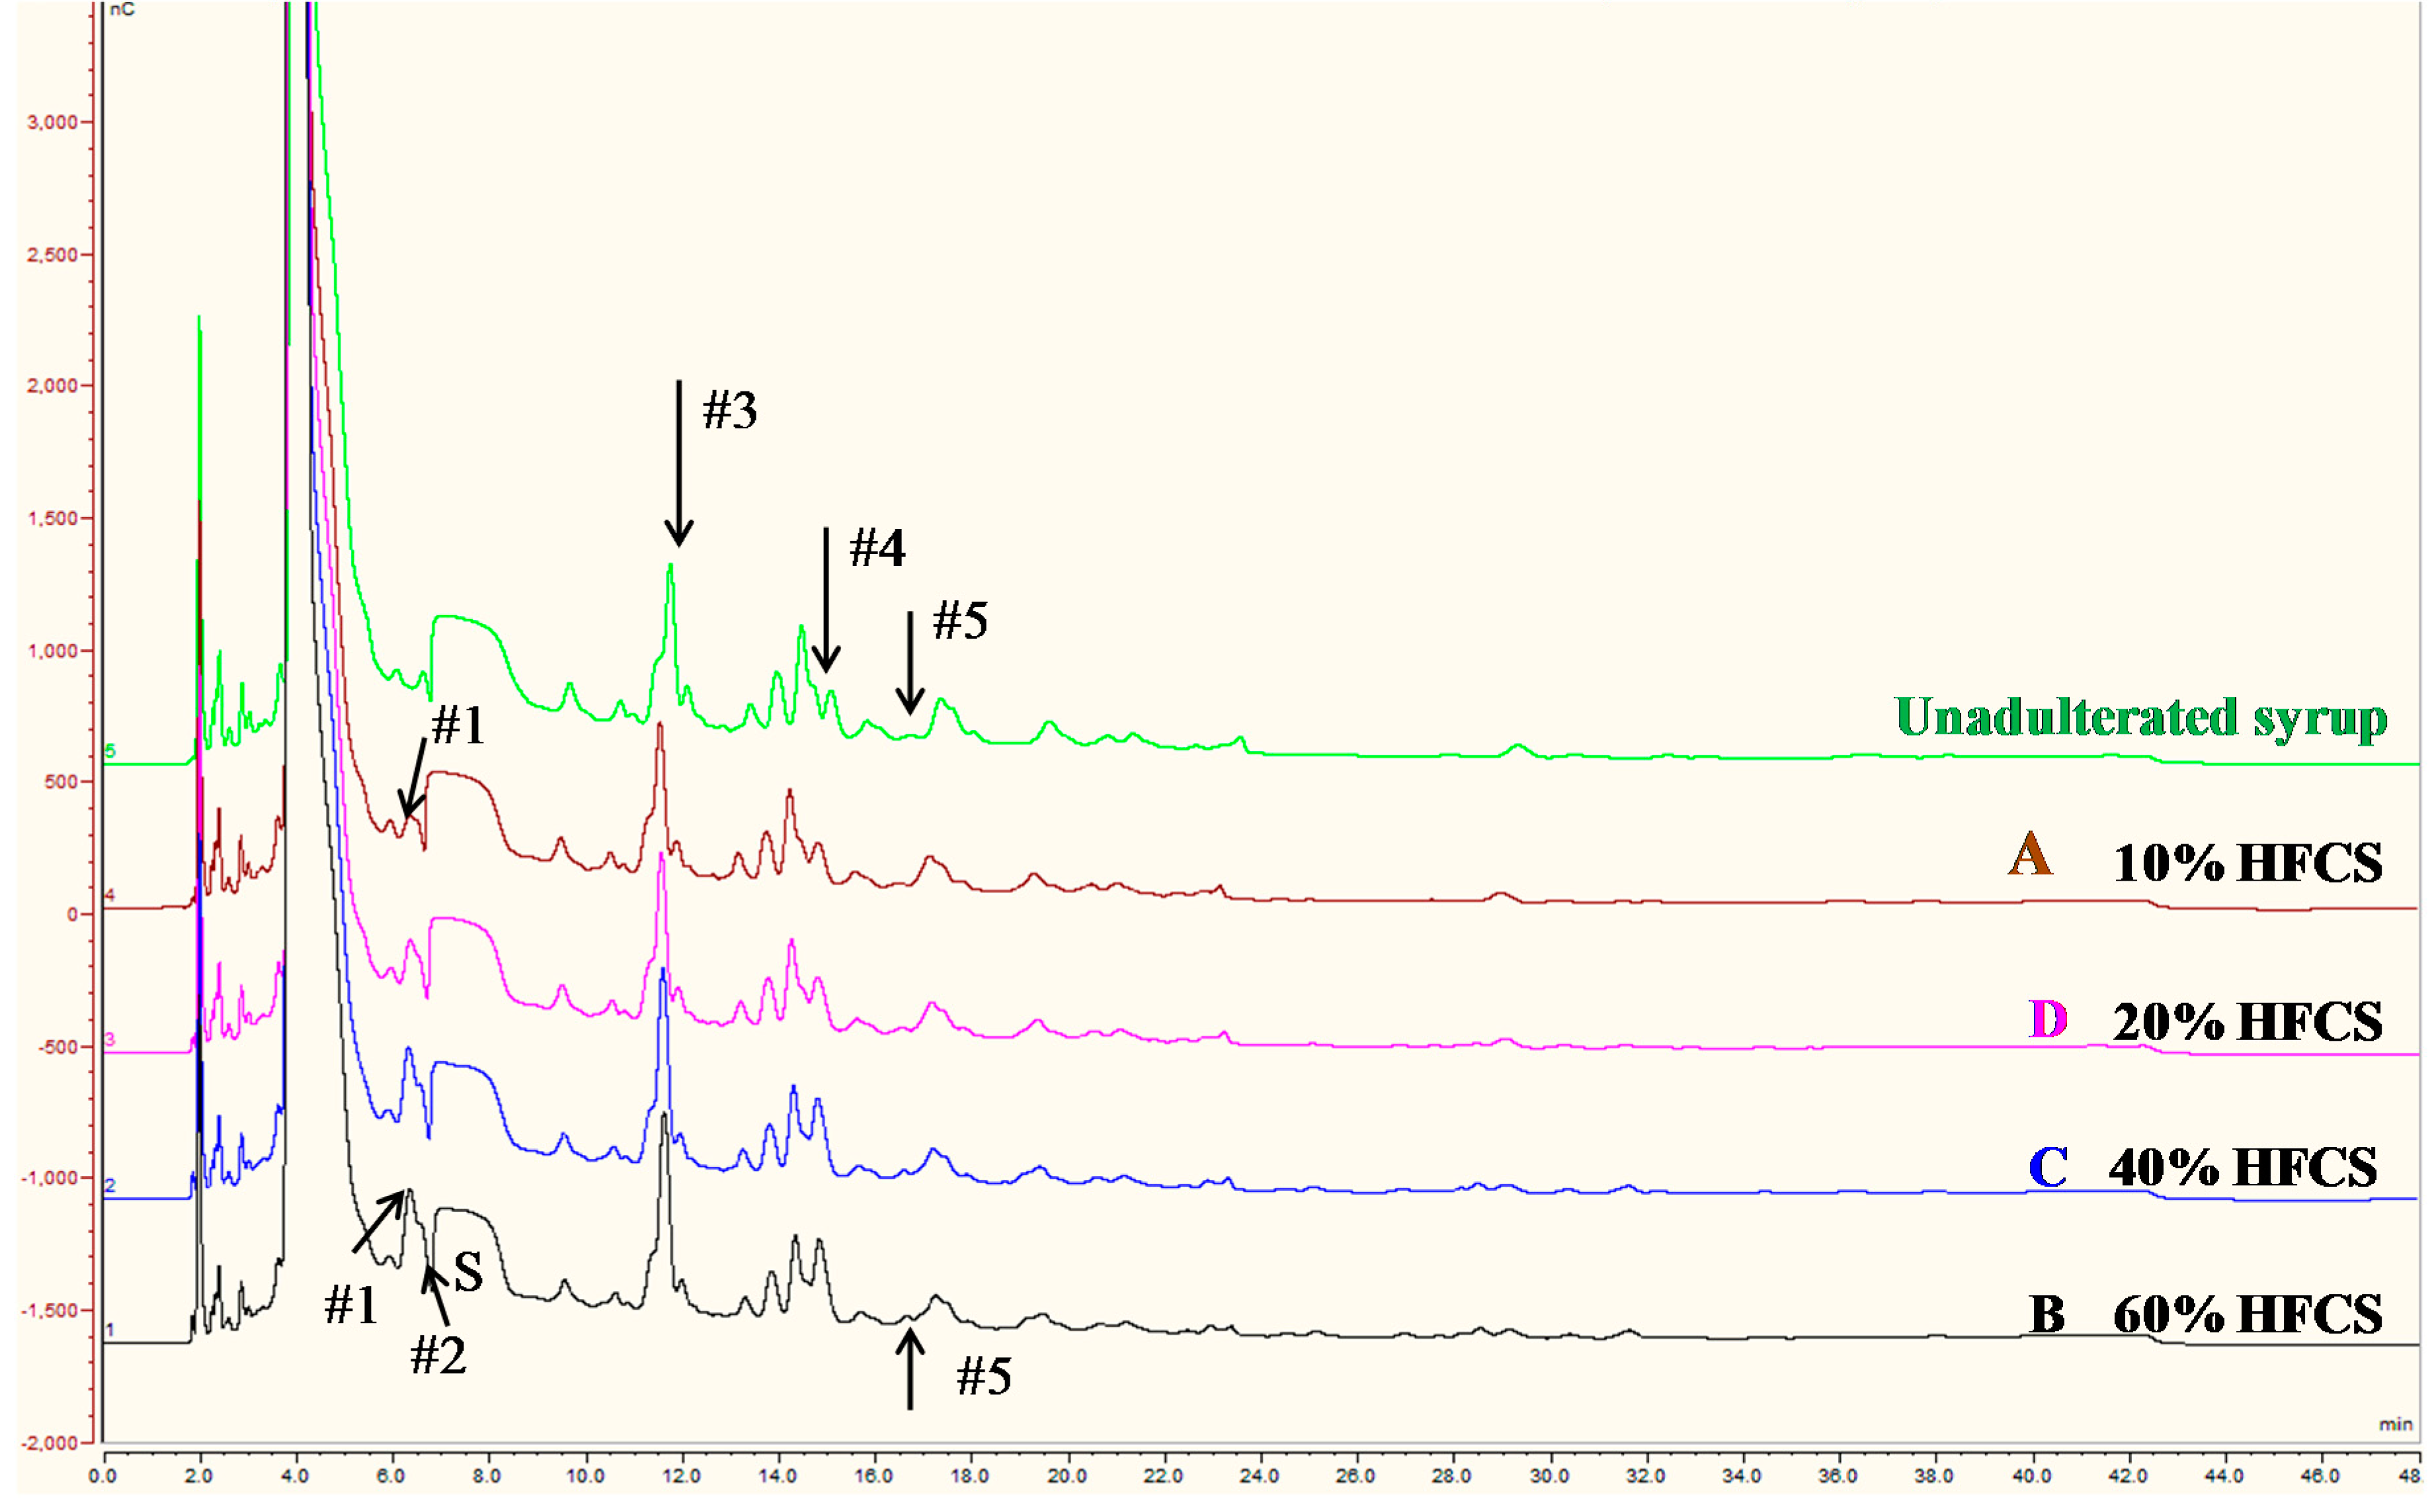
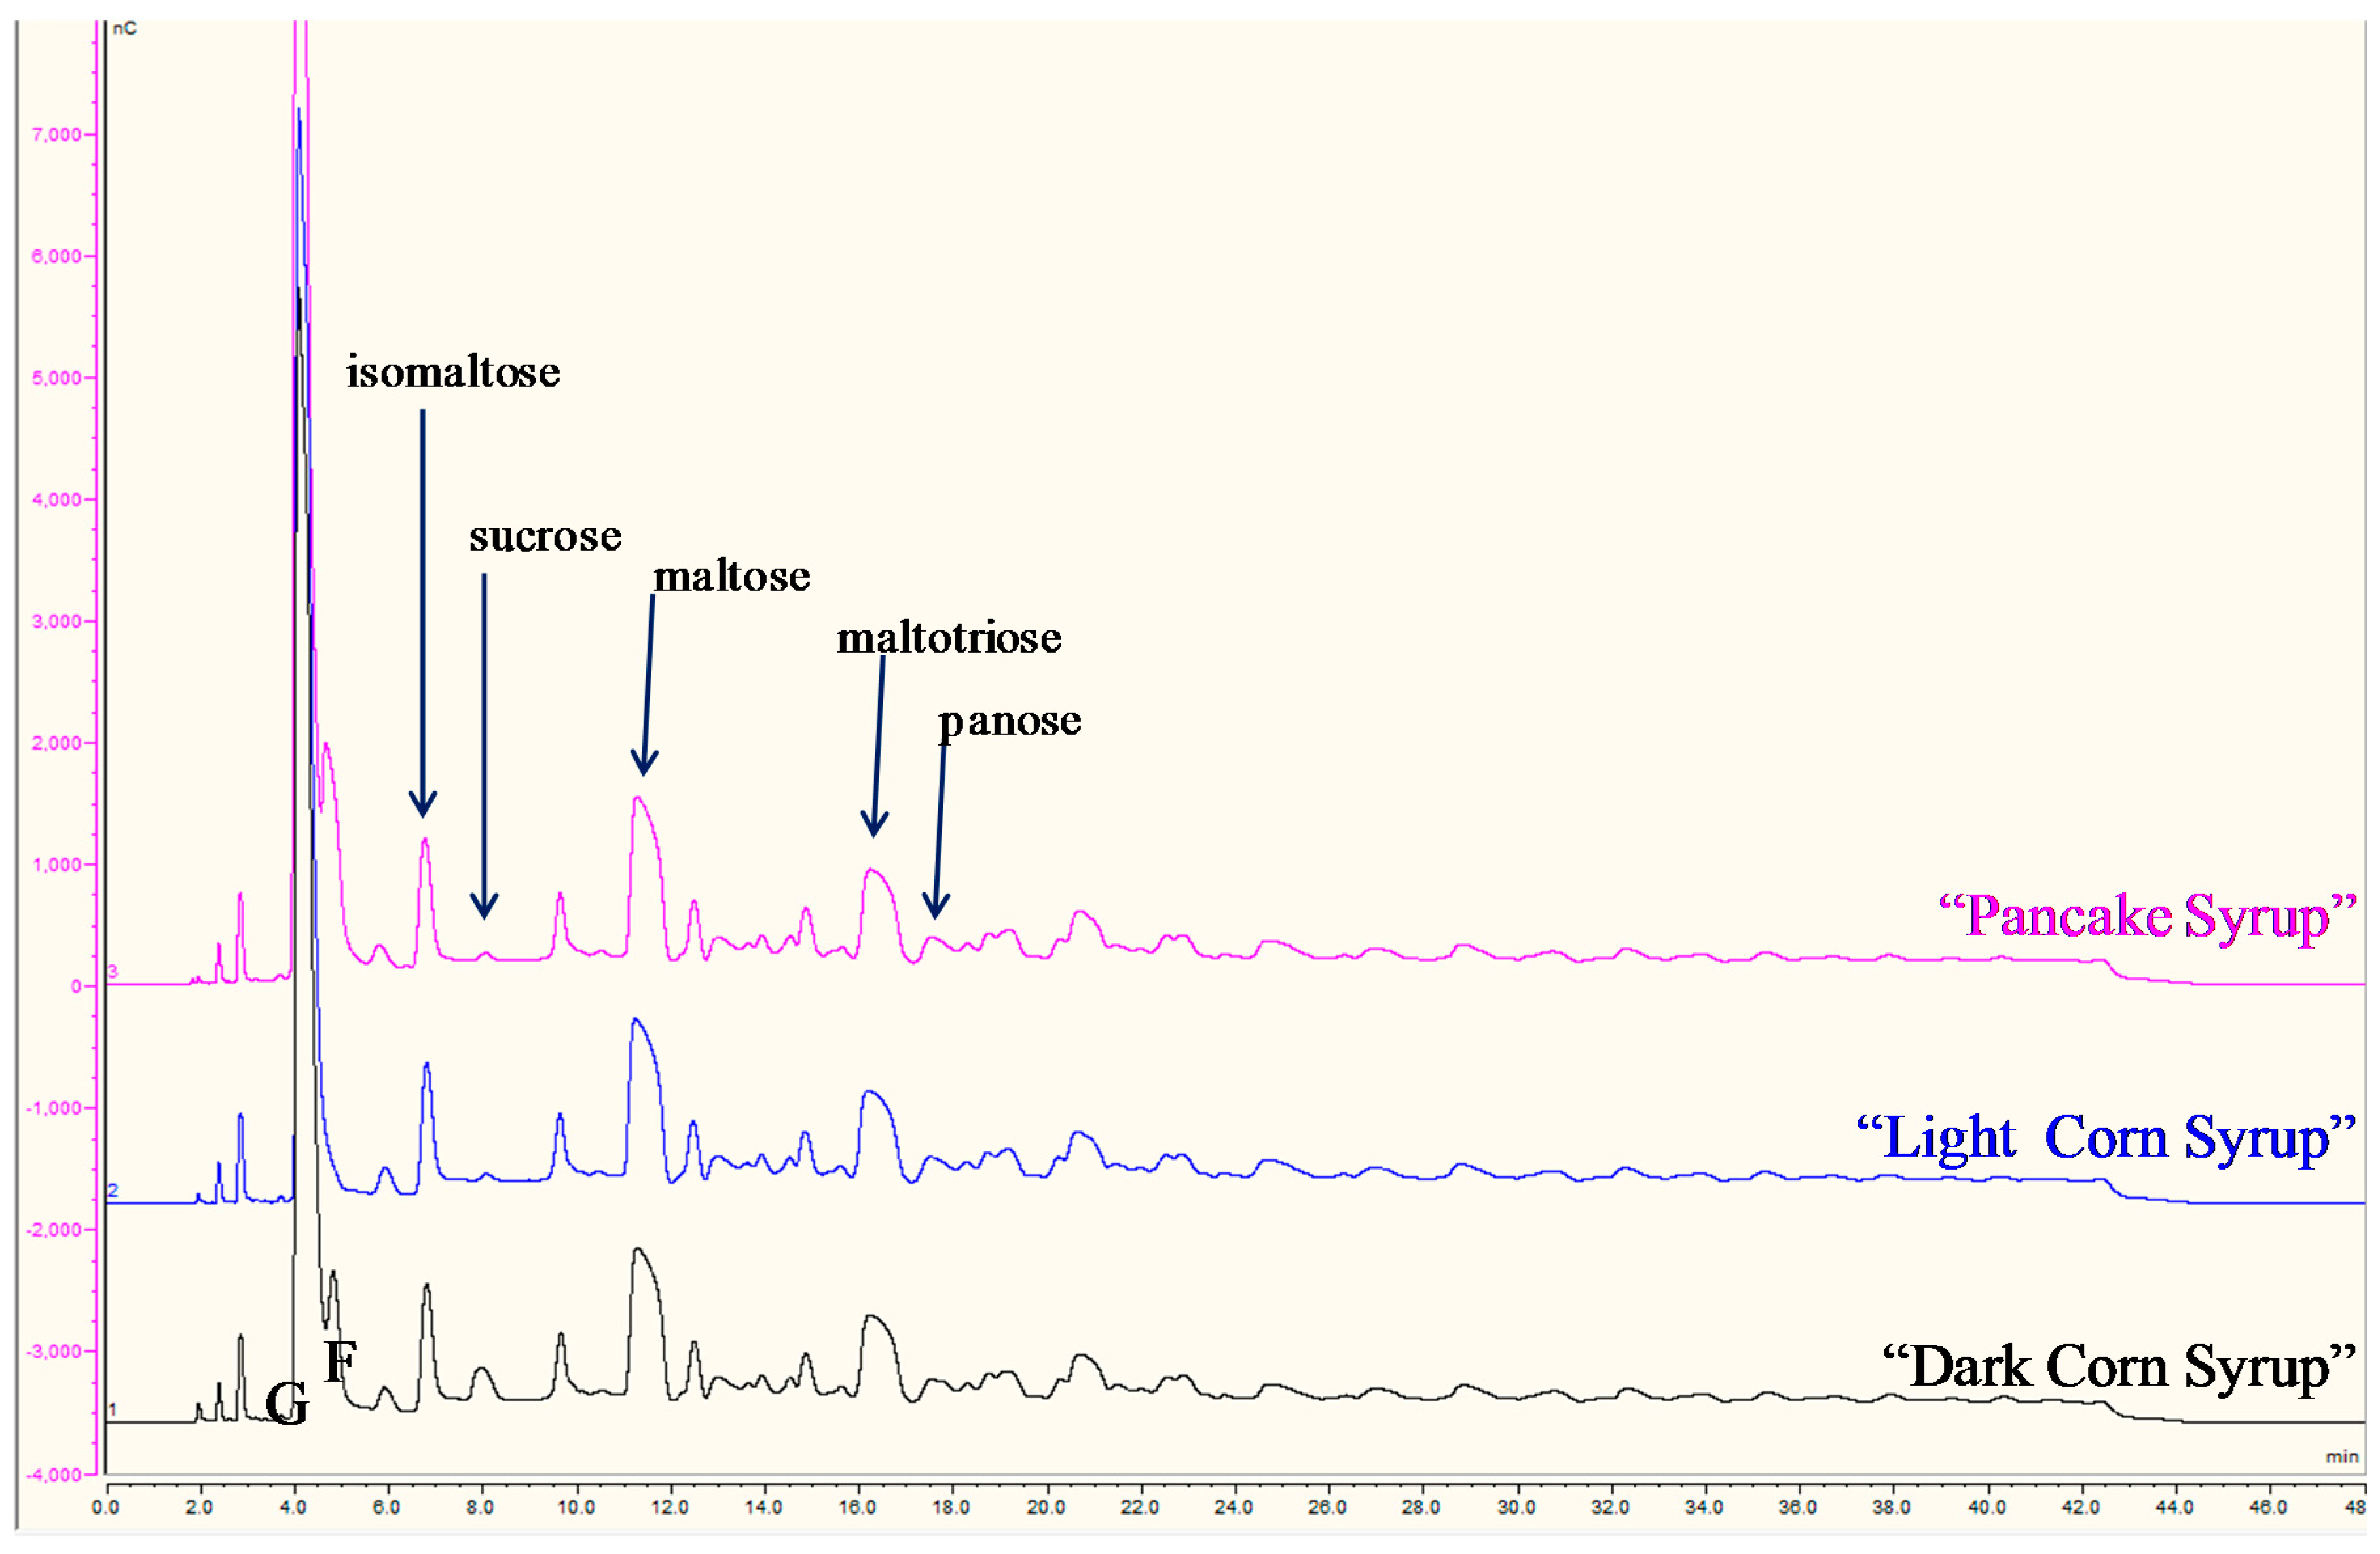
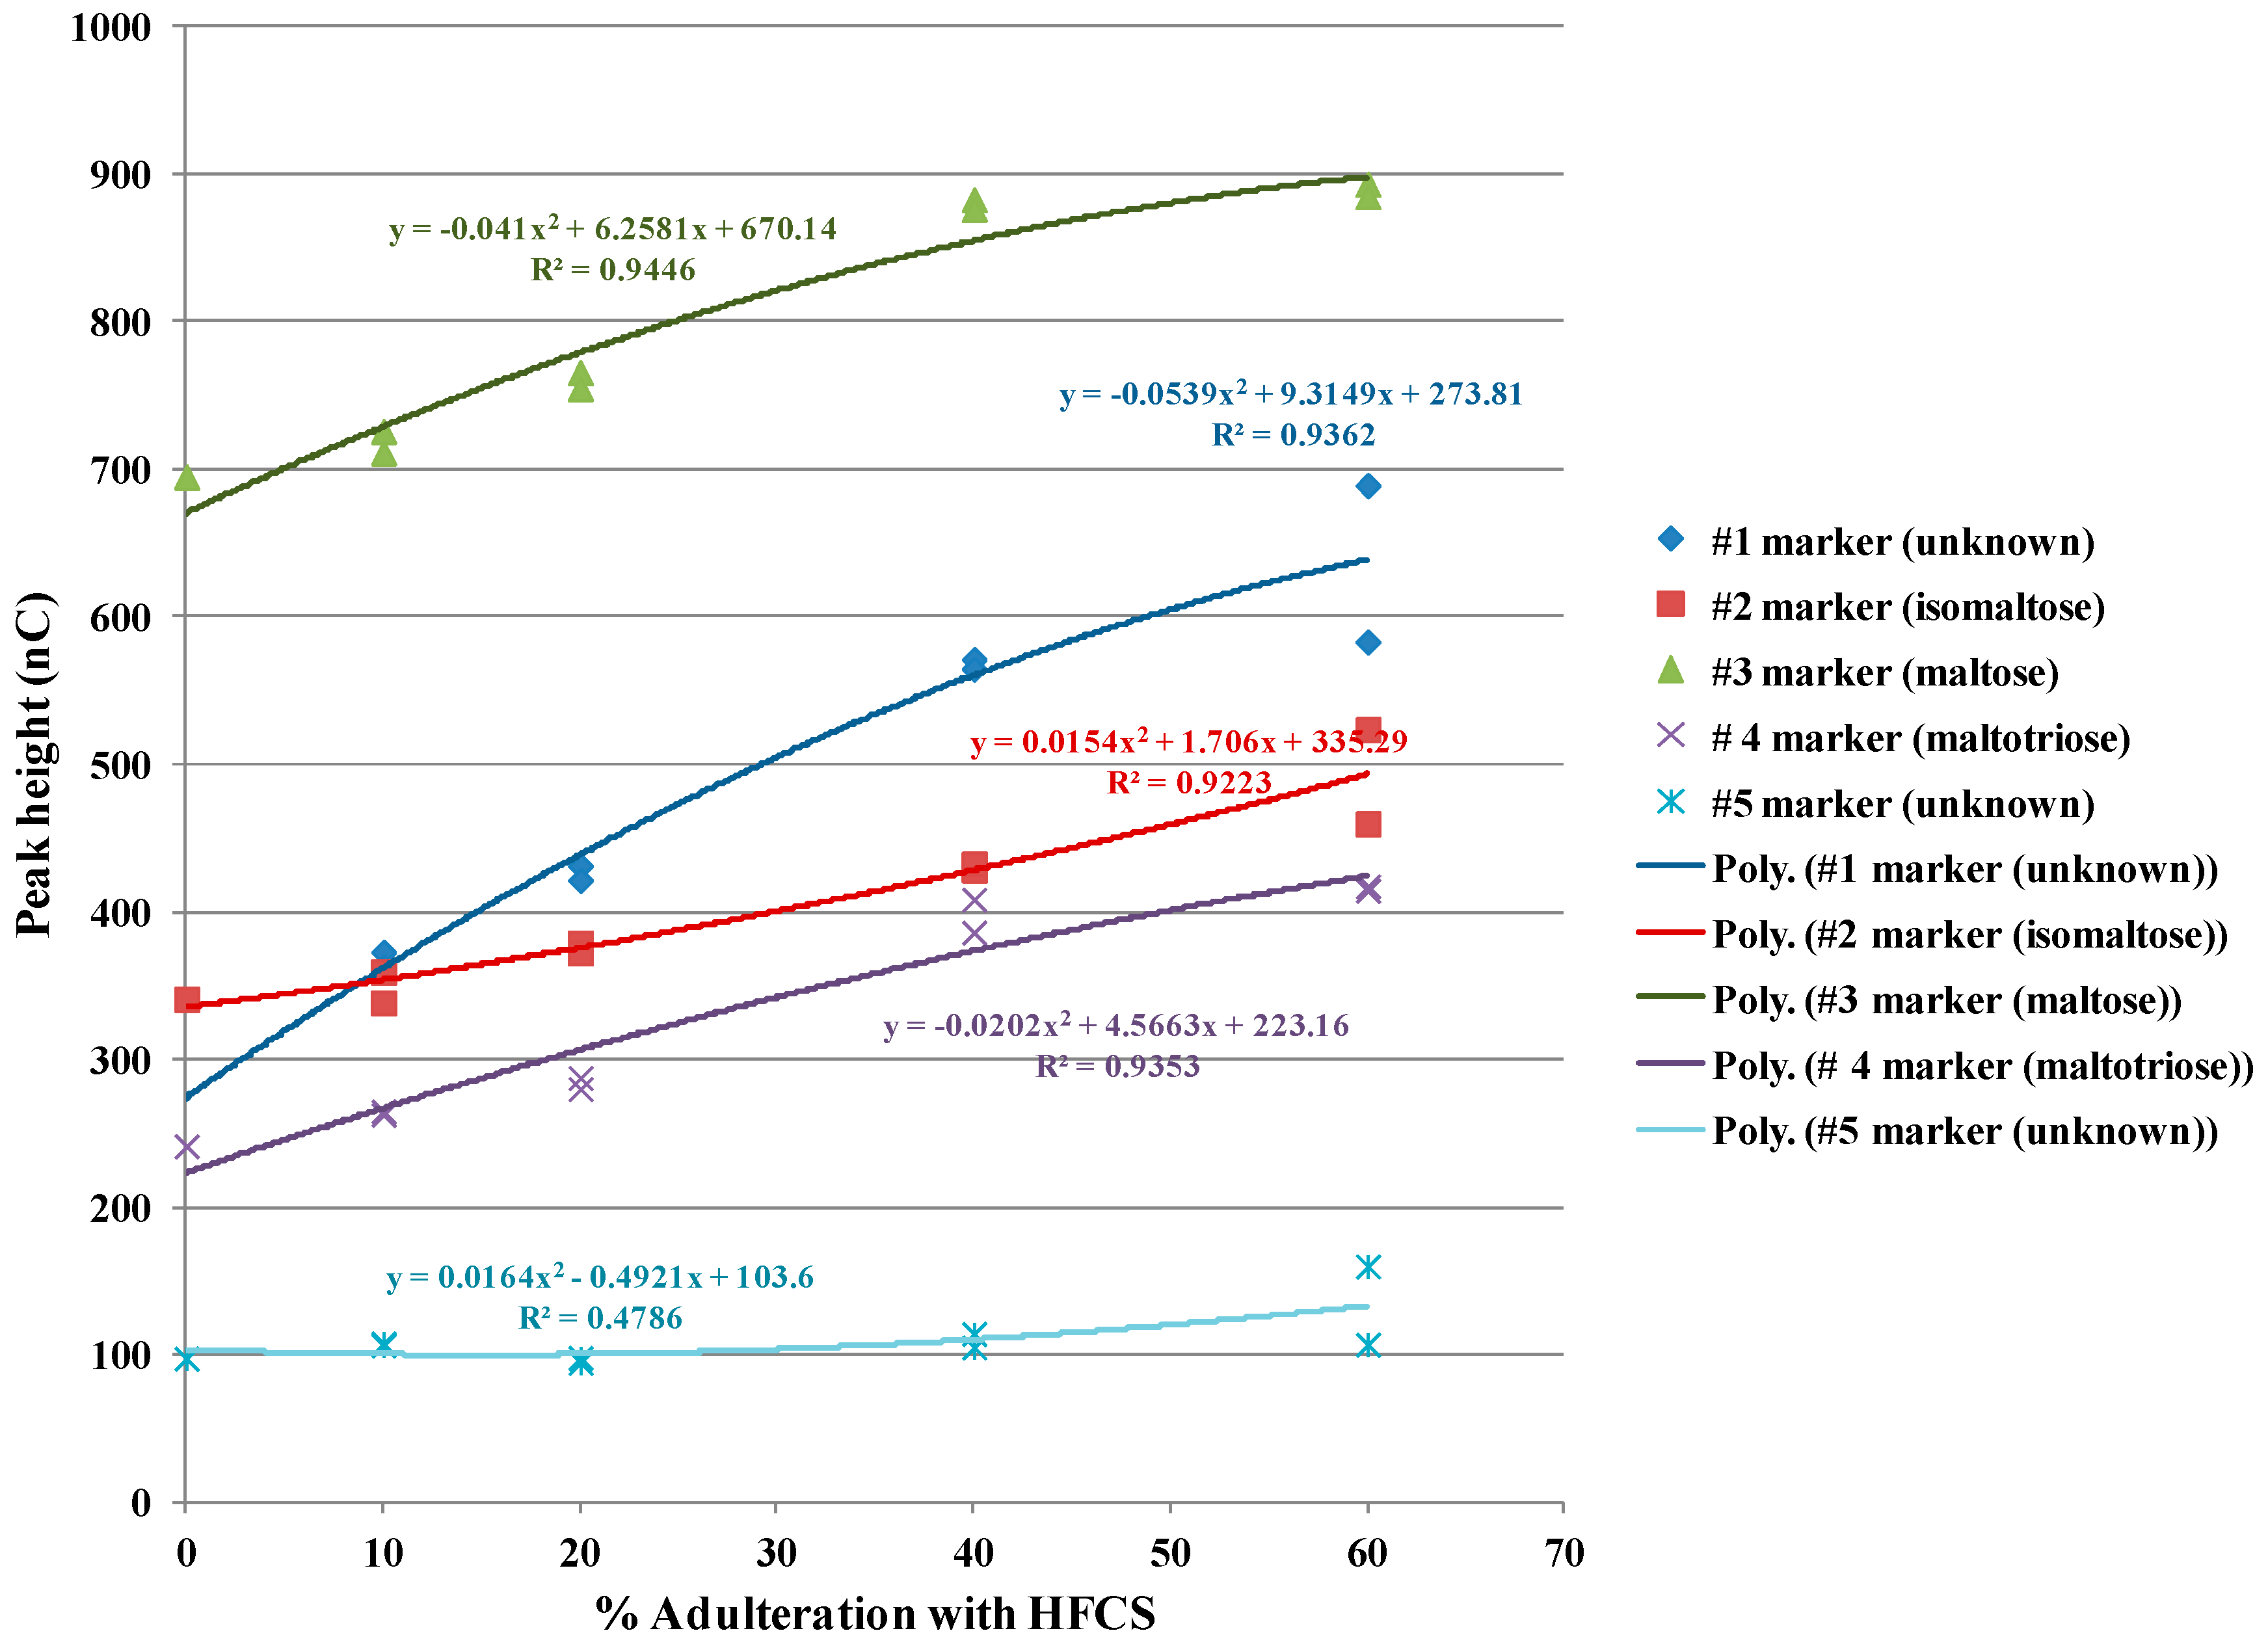
3.3.2. Corn, High Fructose Corn (HFCS), and Cane Syrups

Corn and HFCS syrups are considered inexpensive sweeteners and have often been reported as adulterants of more expensive syrups, sweeteners, and fruit juices [5,23]. Corn syrup and HFCS are produced commercially by the enzymatic hydrolysis of corn starch, with HFCS undergoing a following enzymatic isomerization of a portion of the resulting glucose to fructose. Typically, commercial HFCS include HFCS 42 (42% fructose with the remainder glucose) and HFCS 55 (55% fructose).
Three commercial corn syrups produced and marketed by the same manufacturer are shown in Figure 5. The Pancake and Light corn syrups did not contain any cane syrup, whereas the dark corn syrup did (possibly to add color); this was evidenced by the existence of only a very minor sucrose peak in these two samples, that may even be another disaccharide. Thus, if HFCS or corn syrups are used to dilute other more expensive syrups such as sweet sorghum or maple syrups, the sucrose peak would decrease in relation to the amount of dilutant added. As shown in Figure 5, distinct isomaltose, maltose and maltotriose peaks were detected as expected, because they are hydrolysis products of starch breakdown (see Figure 3). As expected, the HFCS “Pancake Syrup” contained a larger amount of fructose than the “Light Corn Syrup” whose main ingredient was corn syrup (Figure 5), otherwise, the HFCS peaks were very similar to the corn syrup peaks.
Other commercial Corn, HFCS, and blended (corn with cane syrup) syrups are shown in Figure 6. These plus cane and authentic sweet sorghum syrups (compare with Figure 2 and Figure 4), all contained maltose at RT ~11.8 min. In strong contrast, however, the maltose peak in samples containing either corn or HFCS syrups was distinctly overloaded as indicated by the large size and shape of the peak as well as the shift in the RT to the left. Because authentic sweet sorghum and cane syrups can contain small amounts of maltose, which is most likely linked to starch metabolism in these crops, it cannot be used as a lone marker to indicate adulteration. Fortunately, numerous other marker peaks were present in the corn and HFCS syrups that could, in combination with maltose and a lower sucrose peak, be used as markers to detect adulteration with these syrups.

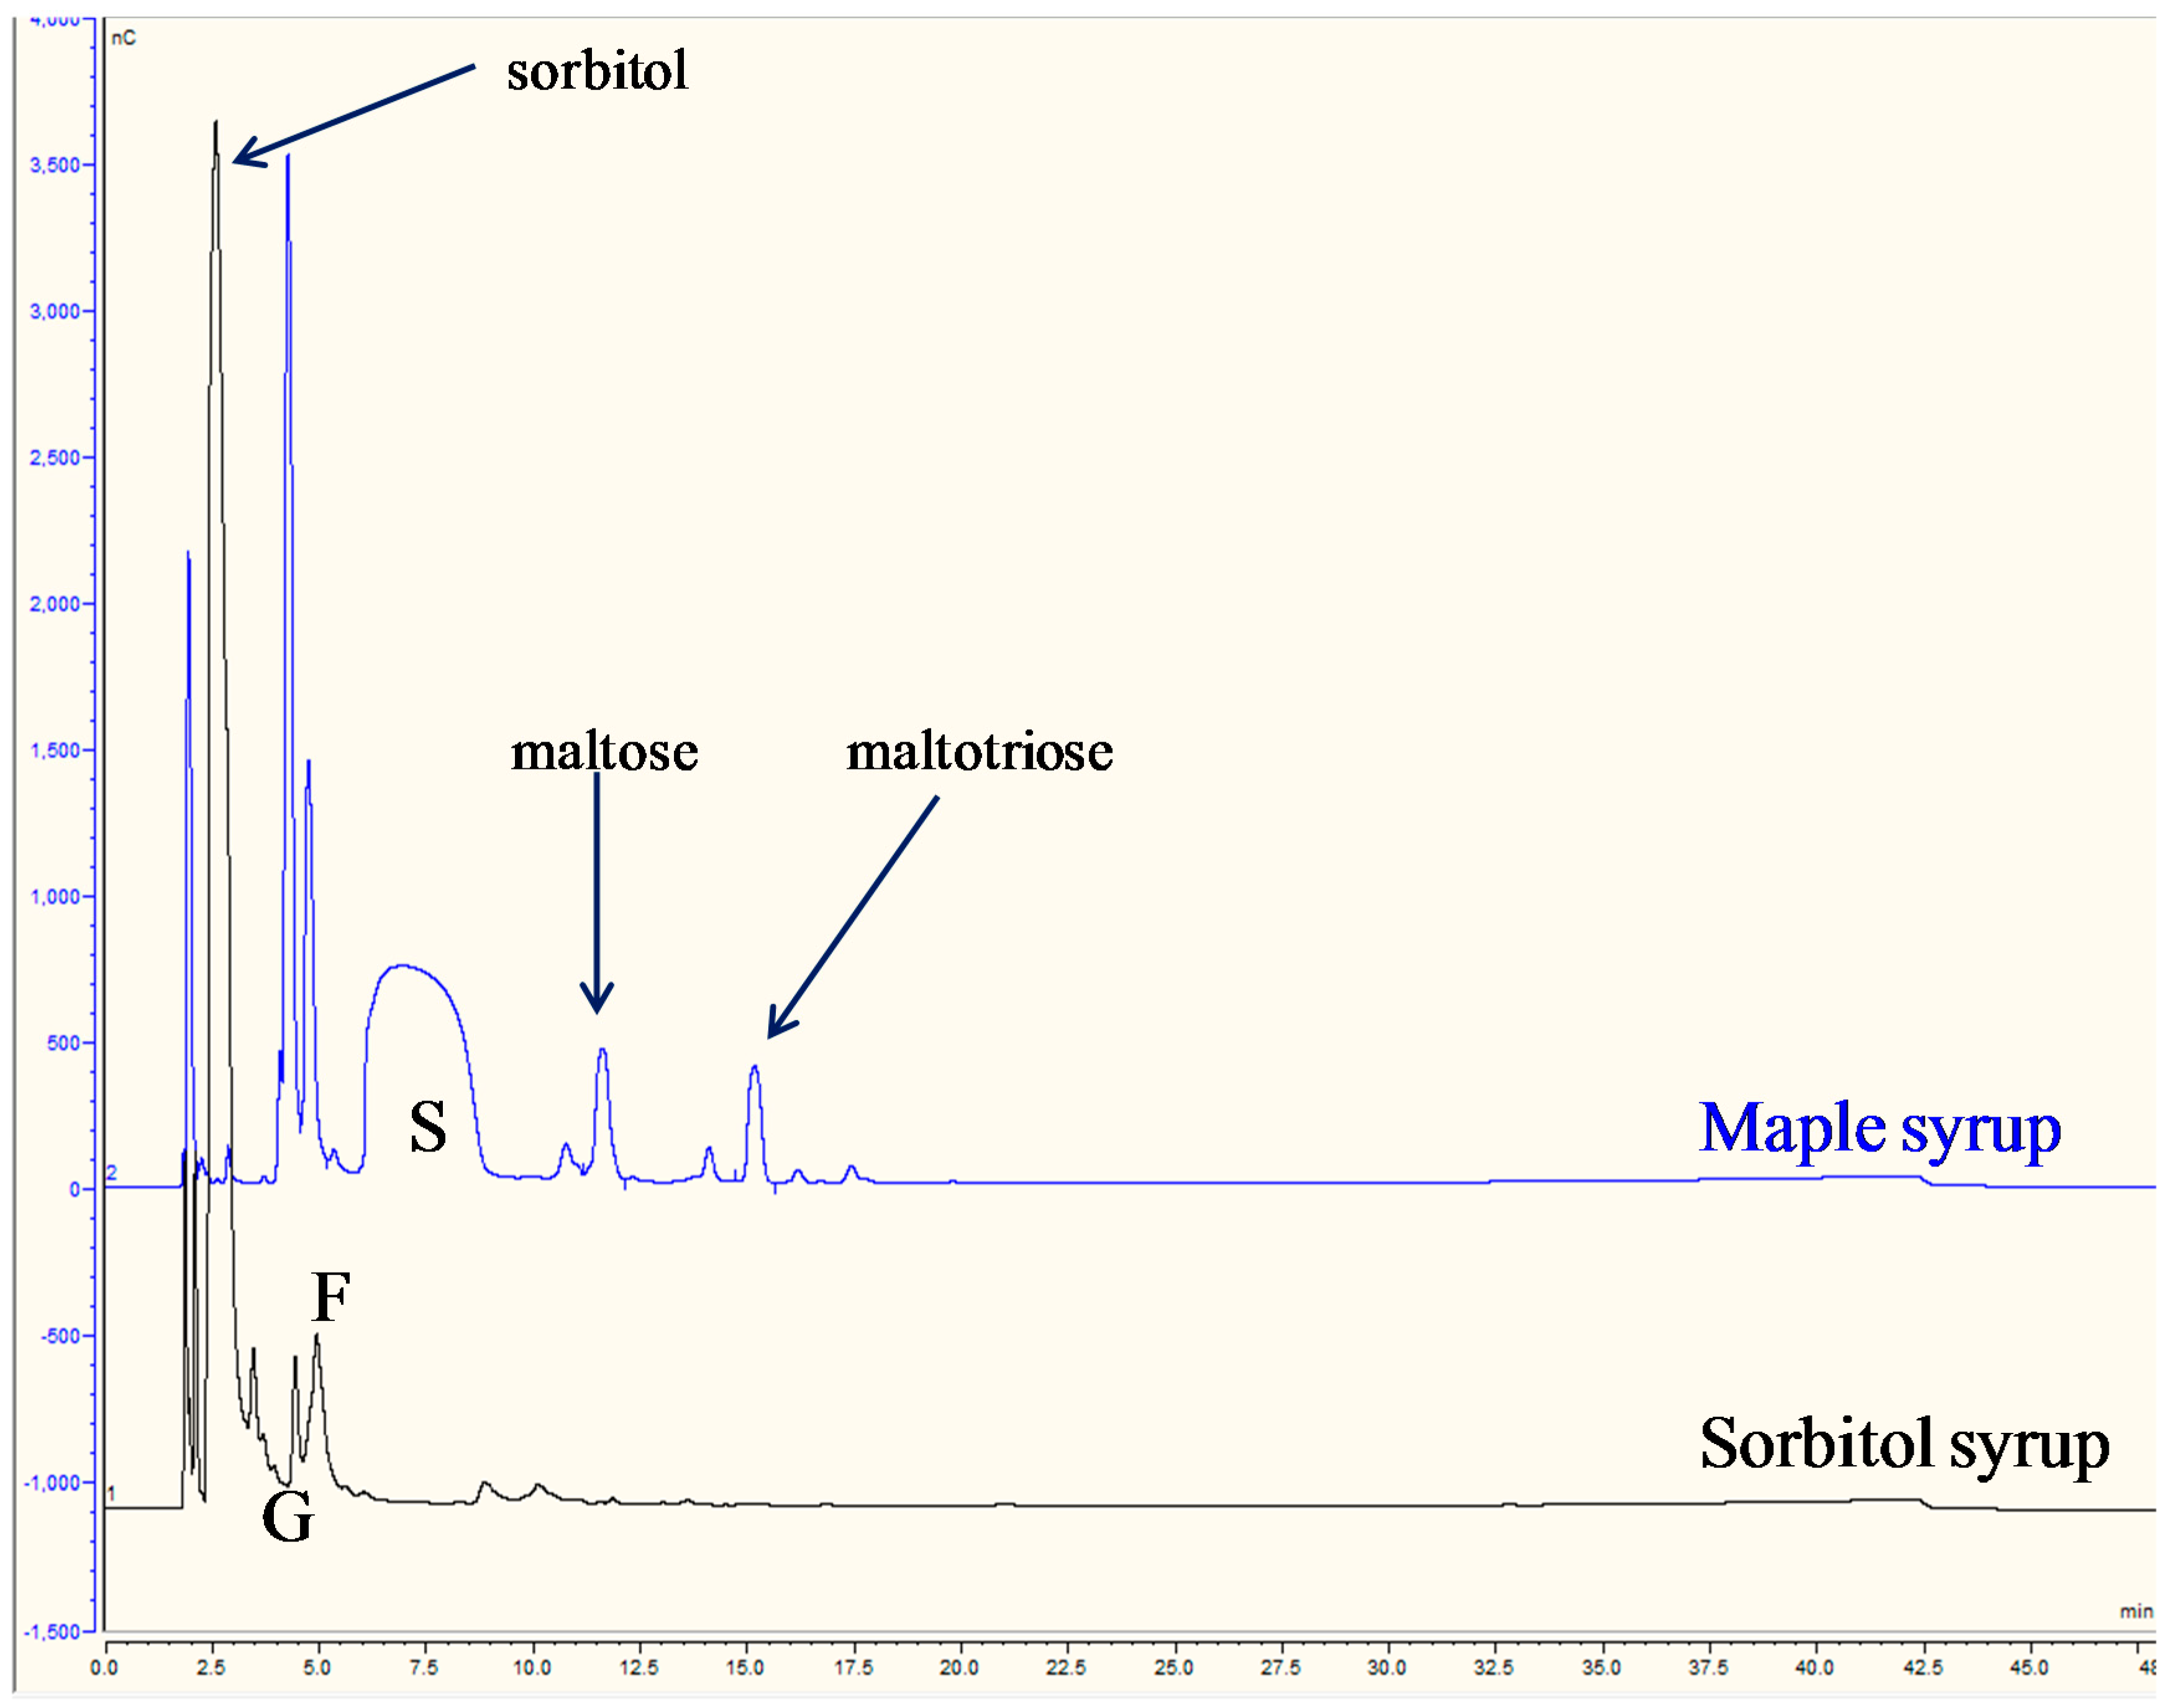
3.3.3. Maple and Sorbitol Syrups

The maple and sorbitol syrups (Figure 7) had dramatically different IC chromatogram profiles compared to cane, corn, HFCS, and sweet sorghum syrups (compare with Figure 2, Figure 4, Figure 5 and Figure 6). As expected the sorbitol “low calorie” syrup (“Sugar Free Low Calorie Syrup” No. 13 in Table 1) had a large sorbitol peak that eluted early at ~2.5 min RT. Like mannitol, sorbitol is a reduced carbohydrate that is weakly acidic and is, therefore, poorly retained on the CarboPac™ PA1 column and elutes very early (Figure 7). The sorbitol syrup contained small amounts of glucose and fructose, but only trace amounts of oligosaccharides. Maple syrup (“Maple Syrup Premium” No. 14 in Table 1), on the other hand, contained an extremely high amount of sucrose as expected. Stuckel and Low [10] reported that maple syrups contain between 88% and 100% sucrose with <11%–12% glucose and fructose, and small amounts of oligosaccharides. A few oligosaccharides were identified, particularly maltose and maltotriose (Figure 6).

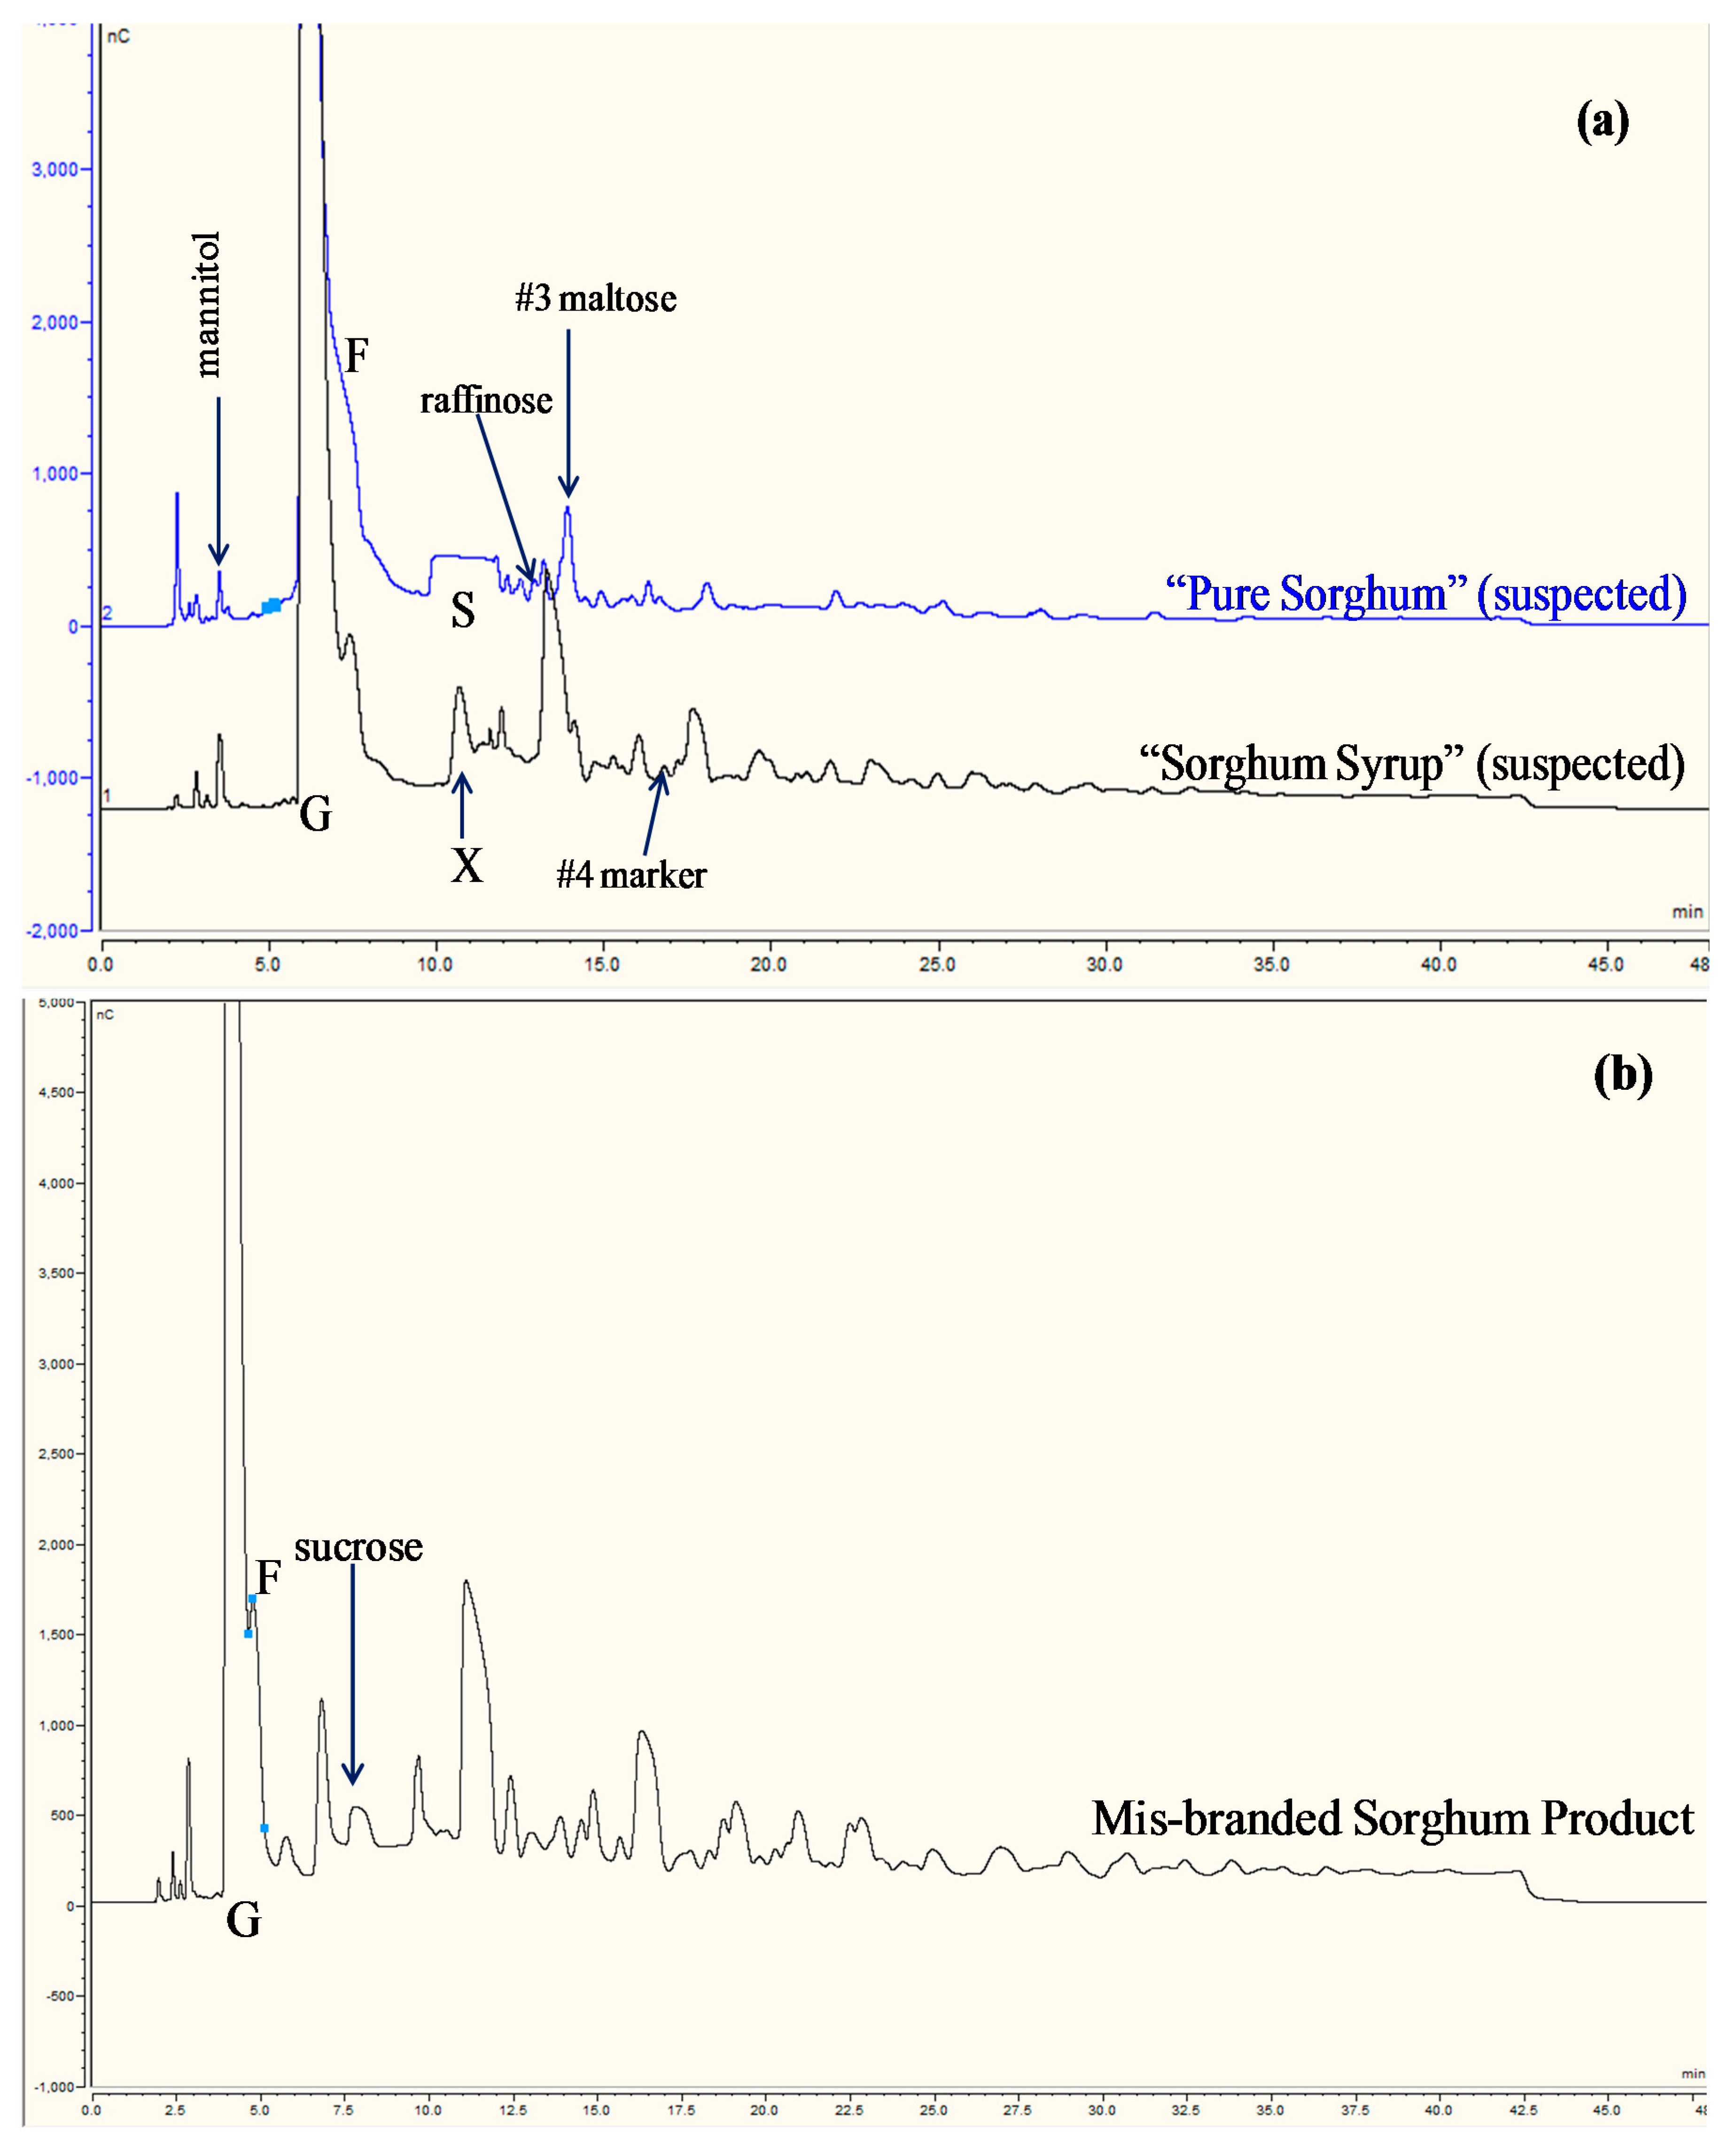
3.4. Use of Blind Samples

With the identification of five marker peaks to evaluate the adulteration of syrups by HFCS and/or corn syrup (see Figure 4, Figure 5 and Figure 6), the use of IC fingerprint profiles were tested in four blind samples (7.0 Brix) only. The blind samples had been adulterated with different percentage levels of HFCS, and results are illustrated in Figure 8, along side the authentic sweet sorghum syrup for comparison. By overloading the CarboPac™ PA1 column with the 7.0 Brix blind samples and running the IC-IPAD NaOH/NaOAc 45 min gradient method, the five marker peaks and low sucrose peak, were successfully used to detect up to 60% adulteration (Figure 8). Moreover, 10% HFCS adulteration was even detected (Figure 8). In general, United State Food and Drug Administration (FDA) does not consider legal action unless 20% is detected, so this result was very encouraging.
The peak height of the five marker peaks in the blind samples shown in Figure 8, were plotted against the per cent HFCS adulteration, and this is illustrated in Figure 9. Polynomial curve fits were found to be slightly better than linear fits which may be due to the increased peak concentrations not being within the linear range of the PAD detector. Another explanation may be that, as the sweet sorghum syrup has an approximate 80 Brix value and the adulterant syrup a much lesser value at ~39 Brix (Table 1), some variation may occur on increased dilution with the adulterant. The addition of an internal standard could, however, compensate for the latter. Except for marker #5 (unknown) which had the highest RT (see Figure 8), the curve R2 values were strong at >0.92. Marker #1 (unknown) was not detected in the unadulterated syrup (0% HFCS) and increased the most from 0% or 10% HFCS adulteration to 60% HFCS adulteration (Figure 9), indicating it was the best adulteration marker. In contrast, the maltose #3 marker, increased the least from 0% or 10% to 60% HFCS adulteration, i.e., approximately 22%, which is further evidence that this marker alone cannot be used authenticate sweet sorghum syrups.

3.5. Practical Use of IC-IPAD Method for Authentication Purposes

With the initial success of detecting adulteration in the blind samples (Section 3.4), two suspected adulterated sweet sorghum samples manufactured in the USA were sent to our laboratory for IC analysis (after dilution to 7.0 Brix), and results are shown in Figure 10a. One syrup produced by a very large-scale manufacturer was labeled as “Sorghum Syrup” with sorghum juice stated as the major ingredient. It was suspected as adulterated because of its much lower price than typical sweet sorghum syrups. The other suspect syrup was “Pure Sorghum” with no ingredients stated on the label. The “Pure Sorghum” had a large sucrose peak as expected for sweet sorghum, and had an IC profile similar to authentic sweet sorghum syrups (Figure 2). In dramatic contrast, the “Sorghum Syrup” had a sucrose peak much lower than normally expected for a sweet sorghum syrup, no raffinose peak, very large #3 (maltose) and #4 (maltotriose) markers. It was not clear either if #1 and 2 markers were in this “Sorghum Syrup” sample, but they may have been under the peak marked X. As the marker peaks were so large it was qualitatively estimated that considerably more than 50% of the syrup contained either corn or HFCS.
Another commercial syrup (number 16 in Table 1) labeled as “Sorghum Molasses with Cane Syrup Blend” had main ingredients stated as corn syrup, cane syrup, and sorghum molasses (in that order). This syrup was also analyzed and resulting IC chromatograms are also shown in Figure 10b. The low sucrose peak first suggested that the neither cane nor sweet sorghum syrup were the main ingredients of this syrup. No detectable raffinose and the existence of very large maltose, maltotriose and other corn syrup marker peaks, further strongly indicated that the majority of this syrup was constituted of corn syrup. The chromatogram profile was also very similar to the blended corn and cane syrup shown in Figure 4, further strongly suggesting that this syrup was a blend. In this case, the syrup was identified as mis-branded.

4. Conclusions

The findings reported in this paper have provided experimental proof that adulteration and mis-branding can be detected in commercial sweet sorghum syrups using a strong IC-IPAD NaOH/NaOAc gradient method over 45 min. On the other hand, the geographical source of the sweet sorghum syrup cannot be currently identified with this method. It was unequivocally shown that maltose disaccharide cannot be used as a lone marker to indicate adulteration with HFCS or corn syrups. Instead, maltose in combination with four other markers and a low sucrose peak, can be used to detect adulteration. Chromatography libraries of authentic sweet sorghum syrups for direct comparisons would aid adulterant detection, as would pattern recognition chemometric techniques [9,32]. Artificial neural network (ANN) methods have been used for food authenticity and classification. ANN analysis can be rapid, automated, quantitative, relatively inexpensive, and significantly faster than conventional library searches [33,34]. The use of an internal standard such as lactose would greatly help in the standardization of chromatographic patterns and pattern recognition analysis. Although most modern chromatography systems now utilize ovens that stabilize retention times, the additional use of a refrigerated auto-sampler will also help stability. Overall, at the least, the use of IC fingerprint profiles can be used as a screening method before the further verification and quantitation with more sophisticated techniques.

Acknowledgments

Mention of trade names or commercial products in this article is solely for the purpose of providing specific information and does not imply recommendation or endorsement by the U.S. Department of Agriculture. USDA is an equal opportunity provider and employer.

Author Contributions

Gillian Eggleston conceived and led all the experiments and interpreted most of the results. Lynda Wartelle prepared the samples and ran the chromatography experiments. Eldwin St. Cyr also helped to prepare the samples as well as collect and purchase them, and analyzed the samples for pH and Brix.

Conflicts of Interest

The authors declare no conflict of interest.

References

  1. Johnson, R. Food Fraud and “Economically Motivated Adulteration” of Food and Food Ingredients; Congressional Research Service Report 7-5700; Library of Congress: Washington, DC, USA, 2014; pp. 1–40. [Google Scholar]
  2. Vosloo, N. Identifying Whiskey Counterfeits. Novel Application of Molecular Spectroscopic Techniques to Ensure Authenticity of Whiskies; Food Quality Safety: Hoboken, NJ, USA, 2015; pp. 40–42. [Google Scholar]
  3. Eggleston, G.; Cole, M.; Andrzejewski, B. New commercially viable processing technologies for the production of sugar feedstocks from sweet sorghum (Sorghum bicolor L. Moench) for biofuel and bioproducts manufacture. Sugar Tech 2013, 15, 232–249. [Google Scholar] [CrossRef]
  4. Andrzejewski, B.; Eggleston, G.; Powell, R. Pilot plant clarification of sweet sorghum juice and evaporation of raw and clarified juices. Ind. Crop. Prod. 2013, 49, 648–658. [Google Scholar] [CrossRef]
  5. Swallow, K.W.; Low, N.H. Analysis and quantitation of the carbohydrates in honey using high performance liquid chromatography. J. Agric. Food Chem. 1990, 38, 1828–1832. [Google Scholar] [CrossRef]
  6. Hammond, D.A. Synergy between liquid chromatography-pulsed amperometric detection and capillary-gas chromatographic methods for the detection of juice adulteration. JAOAC Int. 2001, 83, 964–975. [Google Scholar]
  7. Eggleston, G; Borges, E. The multiple applications of ion chromatography oligosaccharide fingerprint profiles to solve a variety of sugar and sugar-biofuel industry problems. J. Agric. Food Chem. 2015, 63, 2841–2851. [Google Scholar] [CrossRef] [PubMed]
  8. Eggleston, G.; Pollach, G.; Triche, R. The use of ion chromatography profiles as screening tool to differentiate cane white sugar from beet white sugar. Zuckerind 2005, 130, 611–616. [Google Scholar]
  9. Cordella, C.; Millit, J.; Clement, M.-C.; Drajnudel, P.; Cabrol-Bass, D. Detection and quantitation of honey adulteration via direct incorporation of sugar syrups or bee-feeding: preliminary study using high-performance anion exchange chromatography (HPAEC-PAD) and chemometrics. Anal. Chem. Acta 2005, 531, 239–248. [Google Scholar] [CrossRef]
  10. Stuckel, J.G.; Low, N.H. Maple syrup authenticity analysis by anion-exchange liquid chromatography with pulsed amperometric detection. J. Agric. Food Chem. 1995, 43, 3046–3051. [Google Scholar] [CrossRef]
  11. Lee, Y.C. Carbohydrate analyses with high-performance anion-exchange chromatography. J. Chromatogr. A 1996, 720, 137–149. [Google Scholar] [CrossRef]
  12. Basumallik, L.; Rohrer, J. Determination of Hydroxymethylfurfural in Honey and Biomass; Thermo Scientific Dionex Application Note Update 270; Thermo Fisher Scientific: Sunnyvale, CA, USA, 2011; pp. 1–6. [Google Scholar]
  13. Koizumi, K.; Kubota, Y.; Tanimoto, T.; Okada, Y. High-performance anion-exchange chromatography of homogenous d-gluco-oligosaccharides and polysaccharides polymerization degree 50 with pulsed amperometric detection. J. Chromatogr. 1989, 464, 365–373. [Google Scholar] [CrossRef]
  14. Hanashiro, I.; Abe, J.; Hizukuri, S. A periodic distribution of the chain length of amylopectin as revealed by high-performance anion-exchange chromatography. Carbohydr. Res. 1996, 283, 151–159. [Google Scholar] [CrossRef]
  15. Anon. Determination of Plant-Derived Neutral Oligo-and Polysaccharides; Thermo Scientific Dionex Application Note Update 67; Thermo Fisher Scientific: Sunnyvale, CA, USA, 1993; pp. 1–11. [Google Scholar]
  16. Cataldi, T.R.I.; Campa, C.; de Benedetto, G.E. Carbohydrate analysis by high-performance anion-exchange chromatography with pulsed amperometric detection: The potential is still growing. Fresenius J. Anal. Chem. 2000, 368, 739–758. [Google Scholar] [CrossRef] [PubMed]
  17. Eggleston, G. Determination of the Relative Activity of Commercial α-Amylase as Used in Sugar Cane Processing and Refining. ICUMSA GS7-33 Official Method; ICUMSA Methods Book; Bartens publisher: Berlin, Germany, 2013; pp. 1–4. [Google Scholar]
  18. Anon. Determination of plant-derived neutral oligo- and polysaccharides using the CarboPac™ PA200; Thermo Scientific Application Note Update 150; Thermo Fisher Scientific: Sunnyvale, CA, USA, 2005; pp. 1–6. [Google Scholar]
  19. Eggleston, G.; Clarke, M.A. Applications of HPAE-PAD in the sugar industry. Semin. Food Anal. 1997, 2, 119–127. [Google Scholar]
  20. Eggleston, G.; DeLucca, A.; Sklanka, S.; Dalley, C.; St. Cyr, E.; Powell, R. Investigation of the stabilization and preservation of sweet sorghum juices. Ind. Crop. Prod. 2015, 64, 258–270. [Google Scholar] [CrossRef]
  21. Eggleston, G.; Heckemeyer, M.; St. Cyr, E.; Wartelle, L. Case study: Commercialization of sweet sorghum juice clarification for large-scale syrup manufacture. Sugar Tech 2016, 18, 249–257. [Google Scholar] [CrossRef]
  22. Broadhead, D.M.; Freeman, K.C.; Zummo, N. “M81 E”-A New Variety of Sweet Sorghum; Mississippi Agricultural & Forestry Experimental Station: Meridian, MS, USA, 1981; Volume 1309, pp. 1–4. [Google Scholar]
  23. Low, N.H.; Wudrich, G.G. Detection of inexpensive sweetener addition to grapefruit juice by HPLC-PAD. J. Agric. Food Chem. 1993, 41, 902–909. [Google Scholar] [CrossRef]
  24. French, D.; Taylor, P.M.; Whelan, W.J. The mechanism of carbohydrase action. 10. Enzymic synthesis and properties of 6-α-maltosylglucose. Biochem. J. 1964, 90, 616–620. [Google Scholar] [CrossRef] [PubMed]
  25. Pazur, J.H.; French, D. The action of transglucosidase of Aspergillus oryzae on maltose. J. Biol. Chem. 1952, 196, 265–272. [Google Scholar] [PubMed]
  26. Kandler, O.; Knopf, H. The Biochemistry of Plants; Preiss, J., Ed.; Academic Press: San Diego, CA, USA, 1981; Volume 3, pp. 221–270. [Google Scholar]
  27. Anglani, C. Sorghum carbohydrates—A review. Plant Foods Hum. Nutr. 1998, 52, 77–83. [Google Scholar] [CrossRef] [PubMed]
  28. Eggleston, G. Deterioration of cane juice—Sources and indicators. Food Chem. 2002, 78, 99–107. [Google Scholar] [CrossRef]
  29. Robyt, J.F.; Eklund, S.H. Stereochemistry involved in the mechanism of action of dextransucrase in the synthesis of dextran and the formation of acceptor products. Bioorg. Chem. 1982, 11, 115–132. [Google Scholar] [CrossRef]
  30. Richards, G.N. Initial steps in thermal degradation of sucrose. Intern. Sugar J. 1986, 88, 145–148. [Google Scholar]
  31. Eggleston, G.; Grisham, M. Oligosaccharides in cane and their formation on cane deterioration. In Oligosaccharides in Food and Agriculture; Eggleston, G., Côté, G.L., Eds.; ACS Symposium Series 849; Oxford University Press: Washington, DC, USA, 2003; Chapter 16; pp. 211–232. [Google Scholar]
  32. Kowalski, B.R.; Bender, C.F. Pattern recognition a powerful approach to interpreting chemical data. J. Am. Chem. Soc. 1972, 94, 5632–5639. [Google Scholar] [CrossRef]
  33. Irudayaraj, J.; Xu, F.; Tewari, J. Rapid determination of invert cane adulteration in honey using FTIR spectroscopy and multivariate analysis. J. Food Sci. 2006, 68, 2040–2045. [Google Scholar] [CrossRef]
  34. Salvator, R.A.; Angelino, D.; Maria, L.G.; Guiseppe, L. Classification and quantification of H1 NMR spectra of alditols binary mixtures using artificial neural networks. Anal. Chem. 1998, 70, 1249–1254. [Google Scholar]
Figure 1. Gradient separation of fresh (green line) and deteriorated (blue line) sugarcane juice on a Thermo Scientific CarboPac™ PA1 column (samples were standardized to the same Brix value). DP = degree of polymerization. Modified from [15] with permission.
Separations 03 00020 g001
Figure 2. Ion chromatography fingerprint profiles of three authentic sweet sorghup syrups. All syrups were loaded onto the column as 7.0 Brix solutions. S = sucrose, G = glucose, and F = fructose. Note: The chromatograms were run at slightly different times and the retentions times shifted slightly.
Separations 03 00020 g002
Figure 3. Ion chromatography fingerprint profiles of soluble potato starch that was hydrolyzed at various reactions times by α-amylase. See Experimental Section 2.4 for details of the reactions.
Separations 03 00020 g003
Figure 4. Ion chromatography fingerprint profiles of commercial blackstrap (cane) molasses, sweet sorghum syrup, and blended syrup, which are listed as No. 15, 5, and 3 in Table 1. All syrups were loaded onto the column as 7.0 Brix solutions. S = sucrose, G = glucose, and F = fructose.
Separations 03 00020 g004
Figure 5. Ion chromatography fingerprint profiles of various commercial corn syrups made from the same manufacturer. The “Pancake Syrup” is listed as No. 7 in Table 1 and the main ingredients stated on the label were corn syrup and HFCS. The “Light Corn Syrup” is listed as No. 9 in Table 1 and the main ingredient was corn syrup. The “Dark Corn Syrup” is listed as No. 8 in Table 1 and the main ingredients were corn syrup and refiners [cane] syrup. All syrups were 7.0 Brix; G = glucose, and F = fructose.
Separations 03 00020 g005
Figure 6. Ion chromatography fingerprint profiles of various commercial corn and blended syrups. The “Lite Syrup”, “Blended Syrup”, “Sorghum Molasses Table Syrup”, and “Honey Maple Flavored Syrup” are listed as No. 10, 3, 17, and 11, respectively, in Table 1. All syrups were 7.0 Brix; G = glucose, and F = fructose.
Separations 03 00020 g006
Figure 7. Ion chromatography fingerprint profiles of commercial maple and sorbitol syrups at 7.0 Brix. The maple syrup was listed as No. 14 in Table 1, and the sorbitol syrup was listed as No. 13. S = sucrose, G = glucose, and F = fructose.
Separations 03 00020 g007
Figure 8. Ion chromatography fingerprint profiles of blind samples of sweet sorghum syrup adulterated with 10% to 60% HFCS syrup. All samples were standardized to 7.0 Brix. S = sucrose. Identification of peaks: 1 (unknown), 2 (isomaltose), 3 (maltose), 4 (maltotriose), and 5 (unknown). The authentic sweet sorghum syrup (0% HFCS) was from Delta BioRenewables, Memphis, TN, (see number 3 chromatogram in Figure 2) and the HFCS used to blindly adulterate the syrup was the “Lite Syrup” listed as No. 10 in Table 1 and shown in Figure 6.
Separations 03 00020 g008
Figure 9. Increase in peak height of five markers used to detect various per cent levels of HFCS adulteration in an authentic (0% HFCS) sweet sorghum syrup as shown in Figure 8.
Separations 03 00020 g009
Figure 10. Ion chromatography fingerprint profiles of (a) suspected adulterated samples of sweet sorghum syrup, and (b) an identified mis-branded sweet sorghum product. All samples were standardized to 7.0 Brix. G = glucose, F = fructose, and S = sucrose, and X = unknown. Note: the chromatogram in (b) was run much later than those in (a) and the retention times had shifted.
Separations 03 00020 g010
Table 1. Assortment of commercial sugar syrups used in study.
Syrup No.Syrup Title on Label *Major Ingredients on Label Syrup Brix %pH
1Organic MolassesOrganic blackstrap molasses79.264.81
2100% Pure Cane SyrupPure sugarcane syrup80.344.97
3Blended SyrupCorn Syrup, pure cane syrup79.205.22
4Sorghum SyrupSorghum syrup81.064.92
5Sorghum Sorghum74.405.02
6Sorghum (Unblended) Sorghum83.224.92
7Pancake SyrupCorn syrup, high fructose corn syrup77.624.55
8Dark Corn Syrup *Corn syrup, refiners syrup77.064.80
9Light Corn Syrup *Corn syrup76.544.84
10Lite SyrupHigh fructose corn syrup38.974.64
11Honey Maple Flavored SyrupCorn syrup, high fructose corn syrup67.724.65
12Golden SyrupCane sugar syrup80.555.24
13Sugar Free Low Calorie SyrupSorbitol19.975.22
14Maple Syrup Premium100% pure maple syrup67.746.39
15Blackstrap MolassesMolasses79.305.12
16Sorghum Molasses With Cane Syrup BlendCorn syrup, cane syrup, sorghum molasses82.644.81
17Sorghum Molasses Table Syrup Corn syrup, sorghum syrup82.724.71
* Commercial names have been removed; the order of ingredients on the label is stated; small-scale producer.

