Article

Chiral Separation of Menthol Enantiomers by Simulated Moving Bed Chromatography: Mathematical Modeling and Experimental Study

1
National Engineering Research Center for Integrated Utilization of Salt Lake Resources, East China University of Science and Technology, 130 Meilong Road, Shanghai 200237, China
2
Engineering Research Center of Resources Process Engineering, Ministry of Education, East China University of Science and Technology, 130 Meilong Road, Shanghai 200237, China
*
Authors to whom correspondence should be addressed.
Separations 2026, 13(2), 67; https://doi.org/10.3390/separations13020067
Submission received: 22 January 2026 / Revised: 5 February 2026 / Accepted: 7 February 2026 / Published: 14 February 2026

Abstract

l-menthol is one of the most popular flavors in the world. The separation of menthol enantiomers is crucial because of the unpleasant taste of d-menthol. This work presents the chiral separation of racemic menthol by simulated moving bed chromatography for the first time. Six preparative columns packed with amylose 3,5-dimethylphenylcarbamate coated on silica gel were used for separation, and a mixture of n-hexane/isopropanol was selected as the mobile phase. The hydrodynamic properties of the SMB columns were studied to minimize the packing asymmetry in the SMB experiment. The binary adsorption isotherm of menthol enantiomers was measured by the adsorption–desorption method. Fixed-bed batch chromatography was carried out to evaluate the adsorption kinetic behavior. Mathematical models, considering the mass transfer resistance and axial dispersion, were applied to describe the dynamics of the chromatographic separation process. The SMB process for chiral separation of racemic menthol was designed by evaluating the separation region using simulations. Reasonable agreements were achieved between the predicted results and the experimental results. Purities for both the extract and raffinate were above 99.0%, and a productivity of 0.267 gracemate/(LCSP∙min) and a solvent consumption of 0.431 L/gracemate were achieved.

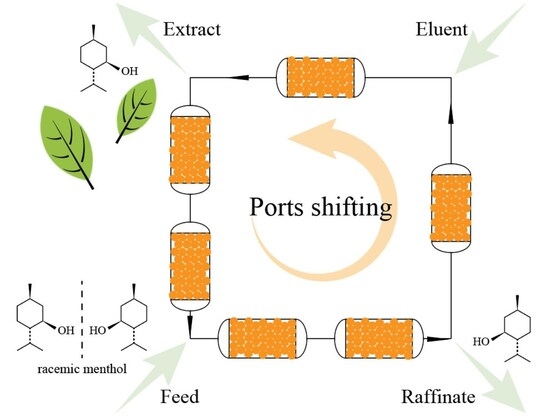
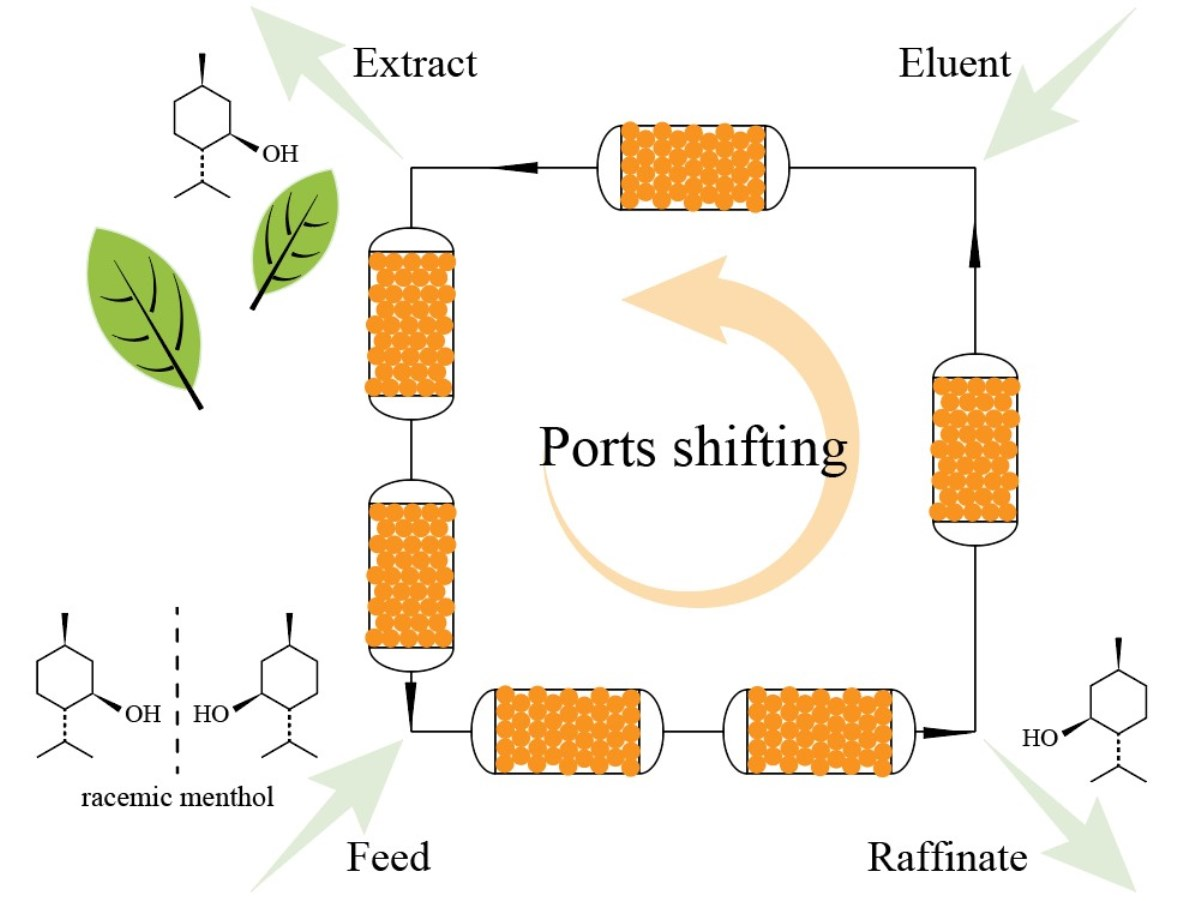
Graphical Abstract

1. Introduction

l-menthol is one of the most popular flavors in the world due to its pleasant odor and unique cooling effect on the body’s skin [1]. It is widely used in toothpaste, chewing gums, candies, tobacco, and pharmaceuticals. With three chiral centers, the menthol molecule has eight stereoisomers, containing d,l-menthol, d,l-isomenthol, d,l-neomenthol, and d,l-neoisomenthol. Apart from l-menthol, the other isomers have an undesirable dusty taste and less cooling effect [1,2]. l-menthol can be extracted from mint oil by crystallization; however, the supply of natural l-menthol is subject to the weather and planting area and cannot satisfy the growing need. Thus, the synthesis of l-menthol with high optical purity is gaining more attention. Three major synthesis routes, the Symrise (formerly Haarmann & Reimer) process, the Takasago process, and the BASF process, are used to produce l-menthol [2].
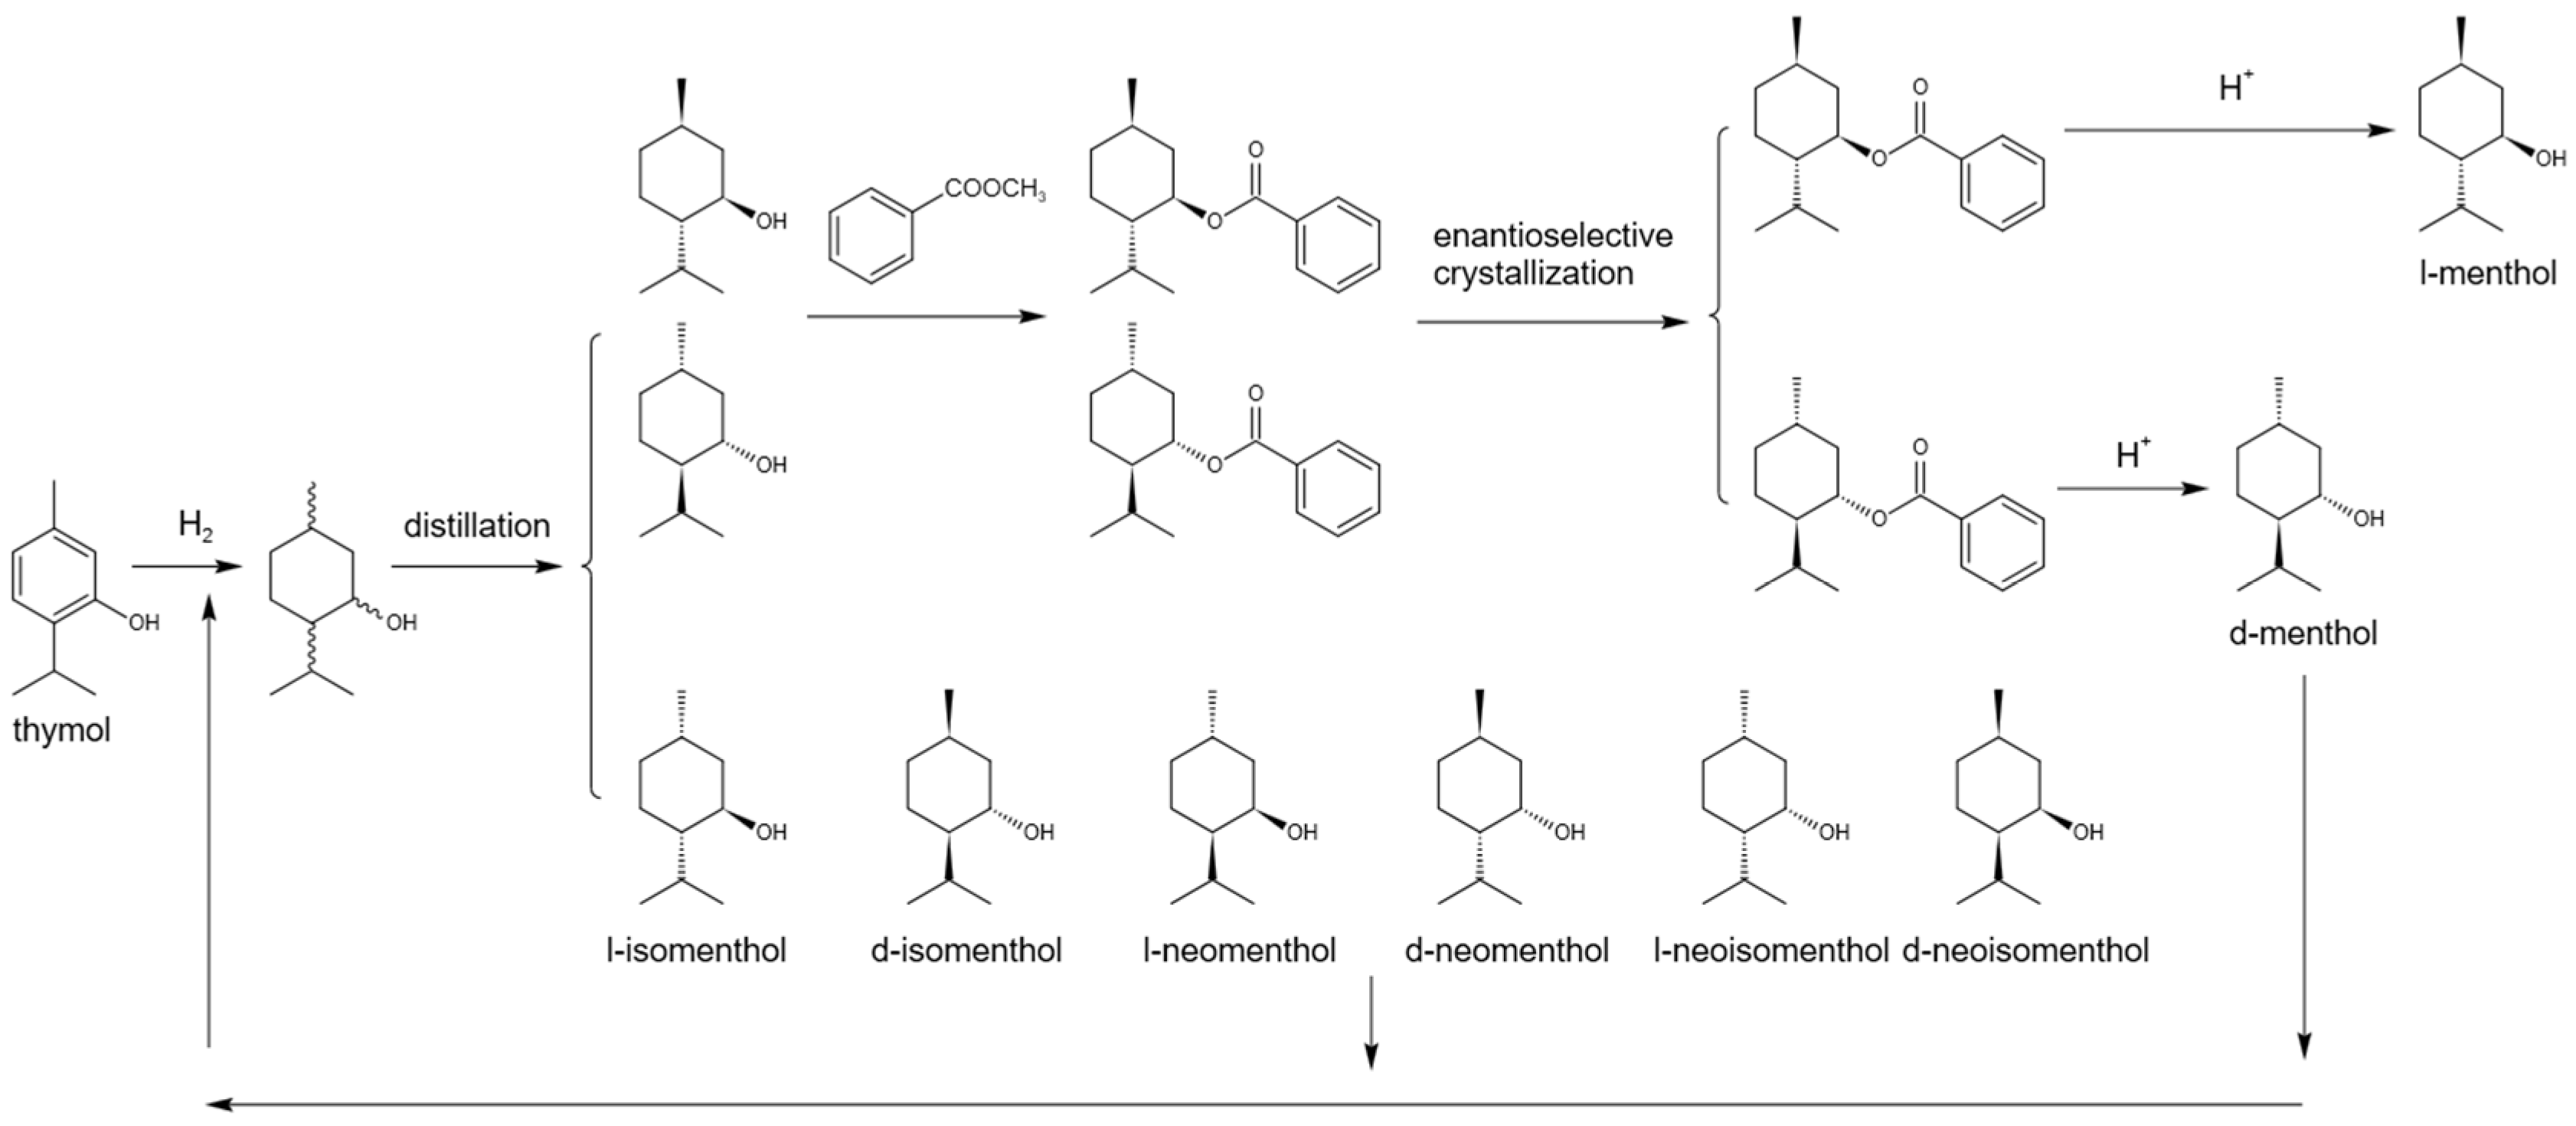
Figure 1 illustrates the Symrise process for production of menthol. Hydrogenation of thymol gives a mixture of the eight menthol stereoisomers [3]. Then, racemic menthol is separated from the mixture by distillation, followed by a transesterification step to transfer the menthol enantiomers to esters. Finally, l-menthol is obtained via preferential crystallization and hydrolysis [4], while the other seven isomers were recycled to the hydrogenation section [3]. The Symrise process has a main drawback of complexity in the resolution of menthol enantiomers. Moreover, the temperature should be strictly controlled during enantioselective crystallization [2]. The enzymatic catalysis method was explored for resolution of racemic menthol in published papers [5,6,7,8].
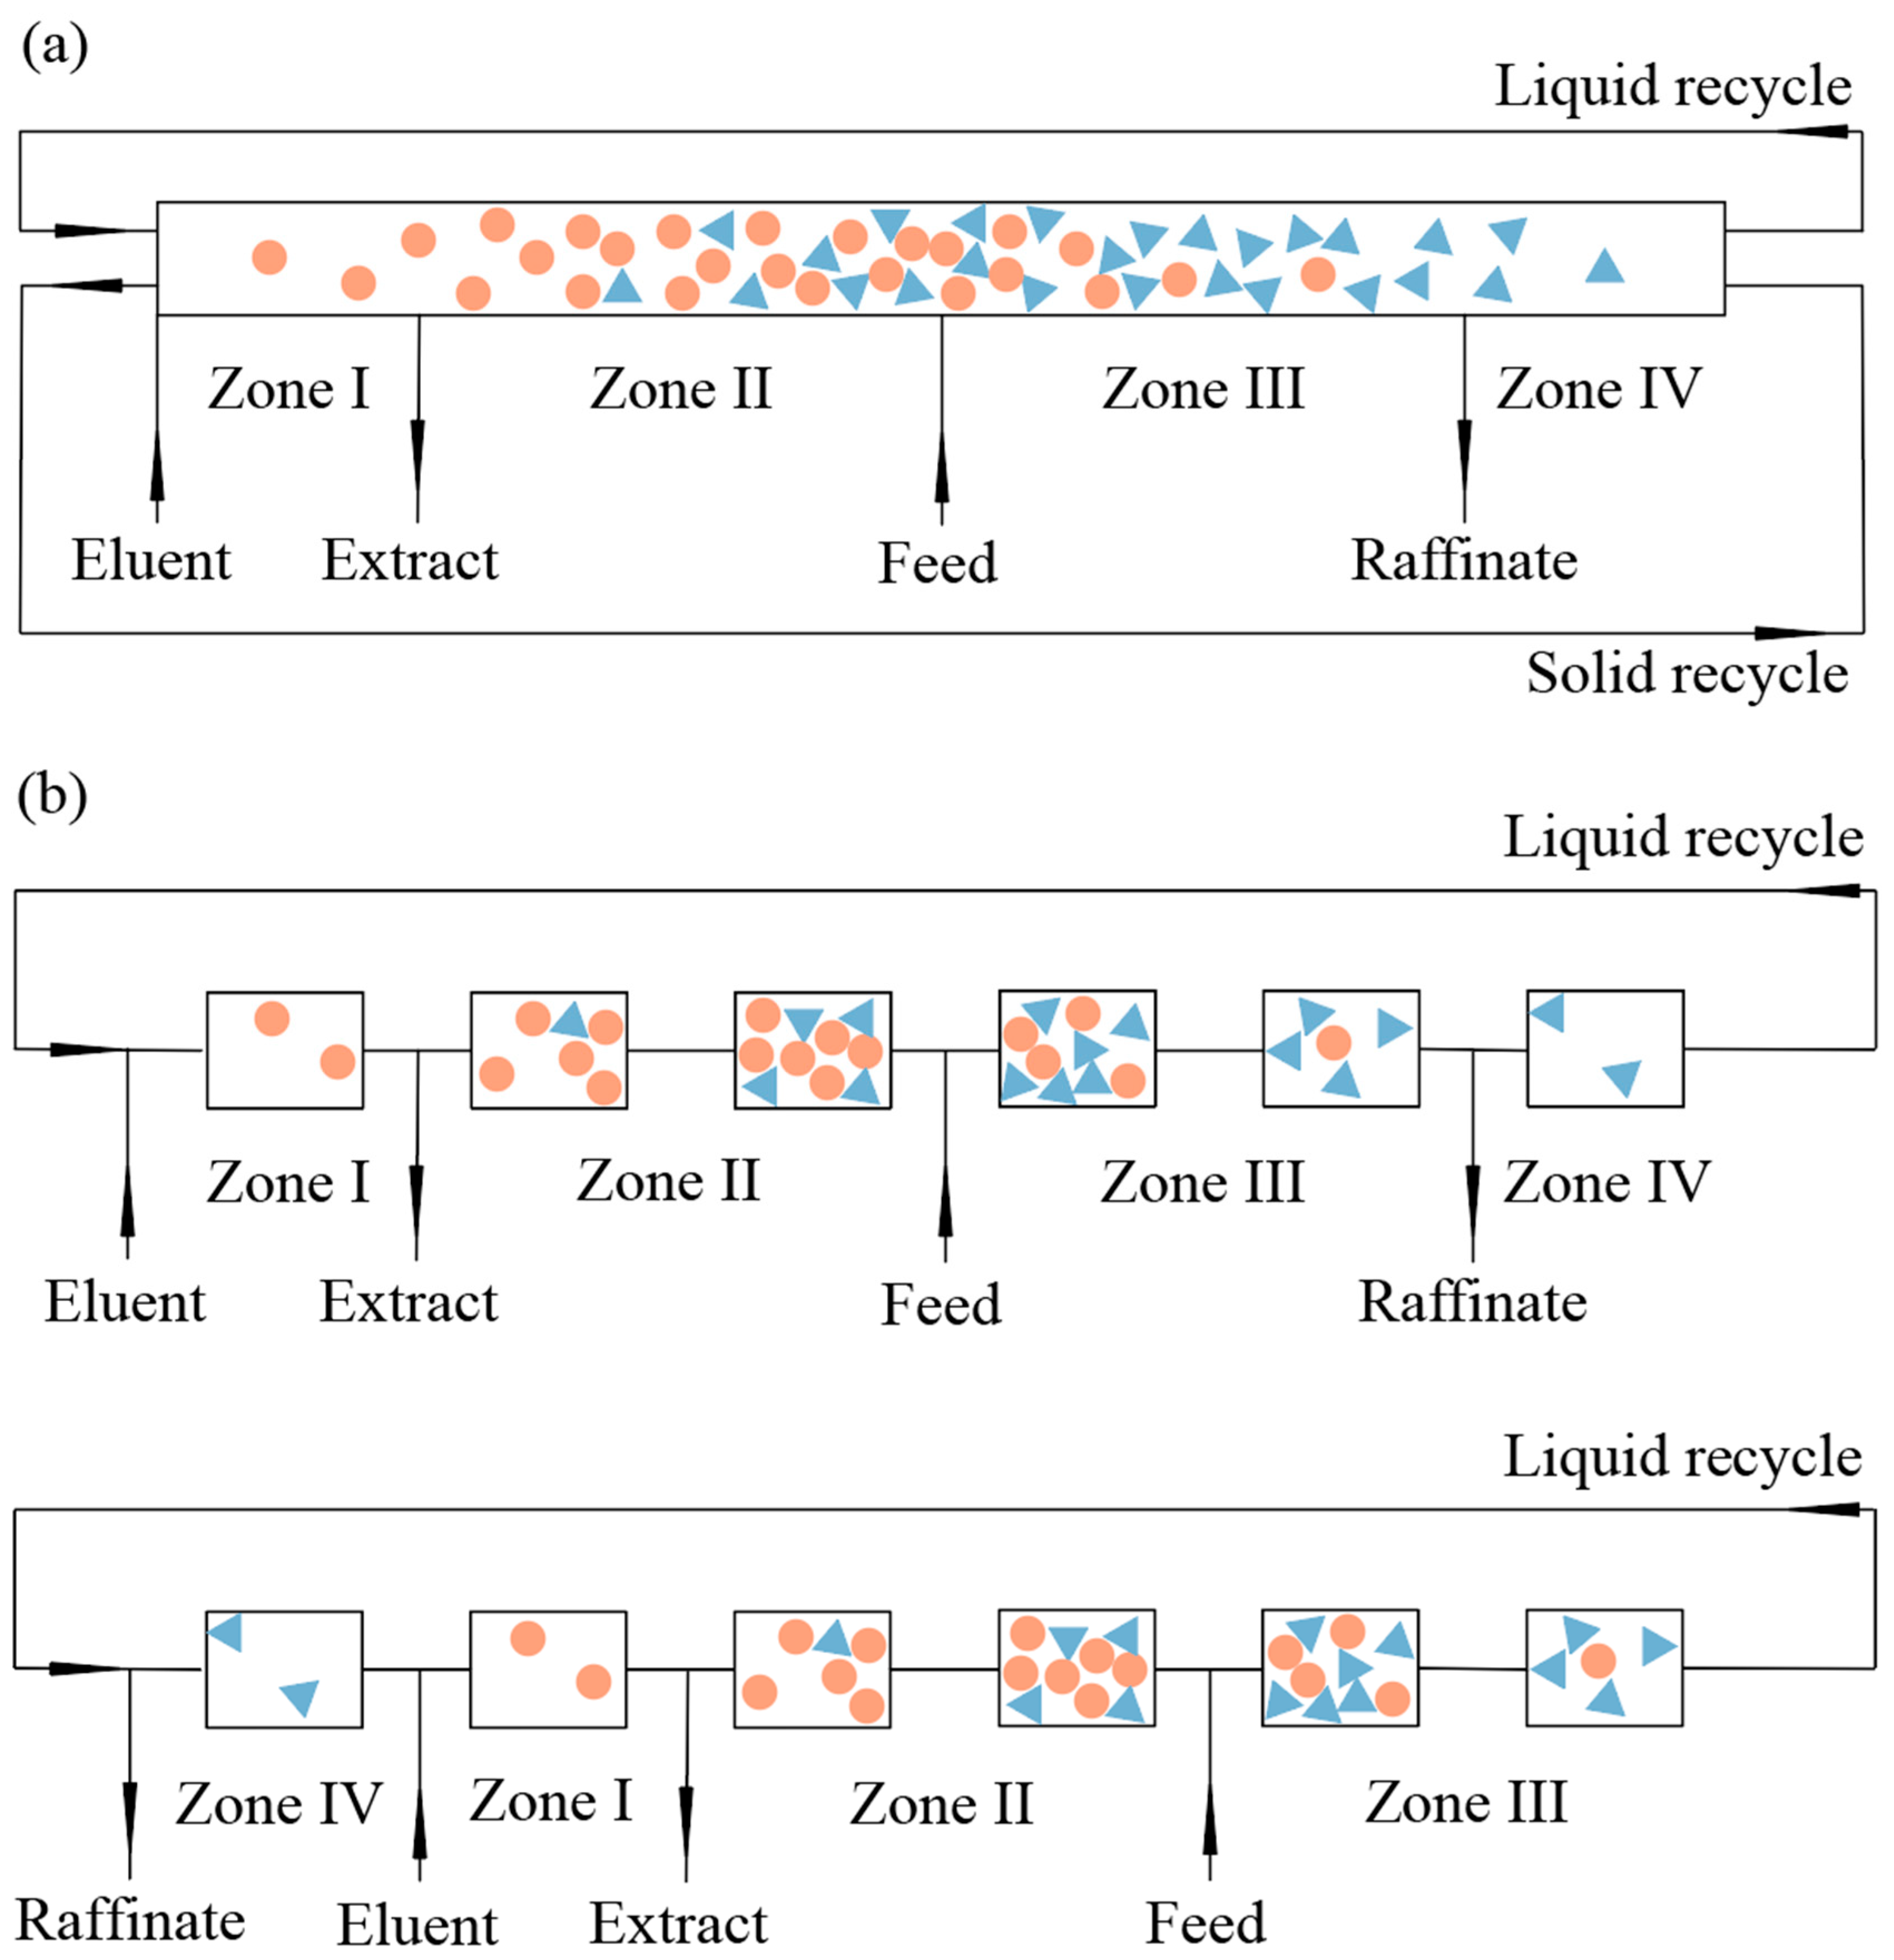
Simulated moving bed (SMB) is an adsorptive separation technique invented by Universal Oil Products (UOP) for p-xylene separation from C8 aromatic hydrocarbon mixtures [9,10]. Over the past few decades, it has been applied increasingly in the production of sugar [11,12], biochemicals [13,14], fine chemicals [15,16], and pharmaceuticals [17,18,19]. The conventional SMB process adopts a strategy of periodically switching the inlet and outlet ports simultaneously to simulate the movement of the solid phase. This strategy avoids serious damage to the adsorbent while maintaining the concept of countercurrent movement of the liquid phase and the solid phase in True Moving Bed (TMB). Figure 2 illustrates the operation of the TMB and SMB processes. In a SMB unit, several packed columns are connected in series. The unit also contains two inlet stream lines, feed and eluent, and two outlet stream lines, extract and raffinate. The feed solution contains the mixture subjected to separation, while the extract and raffinate contain higher proportions of the more-retained component and the less-retained component, respectively. The feed and eluent are continuously introduced to the unit, and extract and raffinate are continuously withdrawn from the unit. A classic SMB unit with closed-loop configurations can be divided into four zones by the inlet and outlet lines. Zone I and Zone IV are responsible for regeneration of the stationary phase and mobile phase, respectively, and Zone II and Zone III are responsible for purification of the more-retained component and the less-retained component, respectively. Compared to conventional batch chromatography, SMB has significant advantages of continuous operation, reduced solvent consumption, and higher productivity.
SMB chromatography is an effective method for chiral separation thanks to the development of the chiral stationary phase (CSP). Considerable efforts have been devoted to the synthesis of novel CSPs. To date, saccharide-based, macrocycle-based, and porous-organic-material-based CSPs have been developed for the separation of different enantiomers [20]. Among them, saccharide-based CSPs—including cyclodextrin-based, cellulose-based, amylose-based, and chitosan-based CSPs—were the first to be invented and are currently the most commonly used [21]. Macrocyclic glycopeptide antibiotics have a cavity molecular structure, which can interact with enantiomers. The carbohydrate, peptide, and carboxylic acid or amine groups in its molecular structure provide active sites for modification [22,23]. Porous organic materials, including metal–organic frameworks, covalent–organic frameworks, and porous organic cages, possess high porosity with uniform pore size and can be readily modified. The development of porous-organic-material-based CSPs is still ongoing at present.
Separation of menthol enantiomers by chromatographic methods, including gas chromatography (GC) [24,25], reverse-phase high-performance liquid chromatography (HPLC) with pre-column derivation [26,27], and normal-phase HPLC without pre-column derivation [28], can be found in published works. However, for large-scale preparative separation, the conventional GC method is not suitable. Moreover, liquid chromatography with derivation is less desired than direct liquid chromatographic separation because it is more complex. Therefore, among these chromatographic separation methods, direct liquid chromatography was chosen in this work. To the best of our knowledge, few papers have reported the direct separation of menthol enantiomers by analytical HPLC, and enantioseparation of racemic menthol by preparative chromatography has not been reported in the published literature. Previous research shows that, among the CSPs of amylose tris(3,5-dimethylphenylcarbamate)-coated silica gel, cellulose tris(3,5-dimethylphenylcarbamate)-coated silica gel, and cellulose tris(4-methylbenzoate)-coated silica gel, only amylose tris(3,5-dimethylphenylcarbamate)-coated silica gel can effectively separate menthol enantiomers when n-hexane/isopropanol is used as the mobile phase. n-hexane/isopropanol (95/5) displays appropriate retention and a selectivity factor of 1.22 at 25 °C in analytical HPLC, demonstrating prospects for preparative chromatographic separation.
In this work, the SMB technique was employed to separate menthol enantiomers. Amylose 3,5-dimethylphenylcarbamate coated on silica gel was used as the chiral stationary phase, and n-hexane/isopropanol (95/5) was selected as the mobile phase. The competitive adsorption isotherm of racemic menthol on the stationary phase was measured. Batch chromatography, including frontal chromatography and elution chromatography, for resolution of racemic menthol was carried out, and a linear driving force model was developed to describe the chromatographic separation process. The SMB process for enantioseparation of racemic menthol was designed and conducted. The model predictions were compared with experimental results. We believe this work provides an alternative strategy to the current menthol enantiomer resolution method, including transesterification, enantioselective crystallization and hydrolysis, which may considerably simplify the manufacturing process of synthetic l-menthol. The experimental basic data and mathematical model could be expected to give clear guidance for the design, scaling-up, and optimization of enantioseparation of racemic menthol via the SMB technique.

2. Theoretical Background

2.1. Competitive Adsorption Isotherm

The adsorption isotherm is the relationship between the equilibrium adsorbate concentration in solution and adsorbent. To facilitate the modeling of the preparative chromatography, various isotherm equations have been proposed to describe the equilibrium isotherm for multi-component systems. The multi-component Langmuir (LG) isotherm model has frequently been used in published papers for non-linear adsorption behavior [19,29].
The binary Langmuir isotherm equation is given by
q 1 * = Q m a x b 1 c 1 1 + b 1 c 1 + b 2 c 2
q 2 * = Q m a x b 2 c 2 1 + b 1 c 1 + b 2 c 2
where ci is the concentration of menthol enantiomers in the liquid phase; qi* is the solid-phase concentration in equilibrium with the liquid-phase concentration; subscript i (i = 1, 2) represents the component in the racemate, where subscript 1 represents the less-retained enantiomer, and subscript 2 represents the more-retained enantiomer; and Qmax and bi are the Langmuir adsorption parameters.
The model equations of the multi-component Langmuir isotherm predict constant selectivity factors. However, the adsorption selectivity of enantiomers on CSPs usually decreases with higher racemate concentration. Therefore, the Langmuir isotherm may not be suitable for the competitive adsorption of enantiomers. To better describe the adsorption behavior of enantiomers, a linear + Langmuir (LLG) model [18,30], a modified linear + Langmuir (MLLG) model [31,32], and a bi-Langmuir (BLG) model [33] have been developed by modifying the Langmuir model.
The LLG model classifies the adsorption sites into two types: a non-selective type with linear behavior and a selective type with Langmuir behavior.
q 1 * = H c 1 + Q m a x b 1 c 1 1 + b 1 c 1 + b 2 c 2
q 2 * = H c 2 + Q m a x b 2 c 2 1 + b 1 c 1 + b 2 c 2
where H is the Henry parameter of the linear adsorption site.
The MLLG model assumes two types of selective adsorption sites, which have linear and Langmuir behavior, respectively.
q 1 * = H 1 c 1 + Q m a x b 1 c 1 1 + b 1 c 1 + b 2 c 2
q 2 * = H 2 c 2 + Q m a x b 2 c 2 1 + b 1 c 1 + b 2 c 2
where Hi is the Henry parameter of the linear adsorption site for the enantiomers.
The BLG model assumes two types of selective adsorption sites with Langmuir behavior.
q 1 * = Q m a x , A b A , 1 c 1 1 + b A , 1 c 1 + b A , 2 c 2 + Q m a x , B b B , 1 c 1 1 + b B , 1 c 1 + b B , 2 c 2
q 2 * = Q m a x , A b A , 2 c 2 1 + b A , 1 c 1 + b A , 2 c 2 + Q m a x , B b B , 2 c 2 1 + b B , 1 c 1 + b B , 2 c 2
where Qmax,A, bA,i are the Langmuir parameters of one adsorption site, and Qmax,B, bB,i are the Langmuir parameters of the other adsorption site.
The parameters in the four isotherm models were obtained by non-linear fitting using experimental data via the Levenberg–Marquardt method. The evaluation criteria for non-linear fitting are as follows,
S Q = l   =   1 M i   =   1 2 q i , l , M * q i , l , E * 2
S D = S Q 2   M N
where SQ is the sum of square of the residues; SD represents the standard deviations; subscript l represents the experimental concentration level of single enantiomer; M is the total concentration level of single enantiomer measured for competitive isotherm; N is the parameter number in different adsorption isotherm models; q*i,l,E and q*i,l,M are the experimental and model-predicted equilibrium solid-phase concentrations of species i, respectively.

2.2. Modeling of the Single-Column Batch Chromatography

The transport-dispersive model was used in this work to predict the dynamics of the chromatography process [34,35]. It was developed according to the following assumptions: axial-dispersed plug-flow model for liquid flow; linear-driving-force model for the overall mass transfer; uniform bed porosity and adsorbent particle diameter; isothermal operation; constant liquid-flow velocity.
For species i, mass balance of the liquid phase and solid phase in a volume element can be written as the following equations, respectively.
c i t + u ε c i z + 1 - ε ε 6 d p K q i * q i = D a x 2 c i z 2
q i t = 6 d p K q i * q i
where qi is the average concentration of menthol enantiomers in the solid phase; ε is the bed porosity; u is the superficial velocity; Dax is the axial dispersion coefficient; K is the overall mass-transfer coefficient; dp is the particle diameter of the chiral stationary phase; z is the axial position of the preparative column; and t is time. Distributed variables ci, qi, and qi* vary with time during the separation process, and therefore, are functions of both axial position and time.
The relationship between superficial velocity and the fluid flow rate within the column is
u = Q π 4 d C 2
where Q is the liquid flow rate, and dC is the column diameter.
Multi-component adsorption isotherm
q i * = f i c 1 , c 2
Initial conditions
c i t = 0 , z = q i t = 0 , z = 0
Danckwerts’ boundary conditions were applied,
D a x c i z t , z = 0 = u ε c i t , z = 0 c i , i n
c i z t , z = L = 0
where L is the length of the column, and ci,in is the inlet concentration.
For both frontal chromatography and elution chromatography,
t t F , c i , i n = c i , F
t > t F , c i , i n = 0
where tF is the feeding time of the chromatography process.

2.3. Modeling of the Multi-Column SMB Chromatography

The SMB process was modeled according to the mathematical model of single-column batch chromatography, considering the periodical shifting of the inlet and outlet ports in the mass balance between columns.
Within column k (k = 1, 2, …, NC), the mass balance for component i in the two phases can be written as the following equations, respectively.
c i , k t + u k ε c i , k z + 1 - ε ε 6 d p K q i , k * q i , k = D a x , k 2 c i , k z 2
q i , k t = 6 d p K q i , k * q i , k
Multi-component adsorption isotherm
q i * = f i c 1 , c 2
Initial conditions
c i , k t = 0 , z = q i , k t = 0 , z = 0
Boundary conditions
D a x , k c i , k z t , z = 0 = u k ε c i , k t , z = 0 c i , k , i n
c i , k z t , z = L = 0
Mass balance at each node is given by
At the eluent node,
c i , k + 1 , i n = Q IV Q I c i , k t , z = L
At the feed node
c i , k + 1 , i n = Q I I Q I I I c i , k t , z = L + Q F Q I I I c i , F
At the other nodes
c i , k + 1 , i n = c i , k t , z = L
Global mass balance
Q I = Q I V + Q D
Q I I = Q I Q X
Q I I I = Q I I + Q F
Q I V = Q I I I Q R
where QI, QII, QIII, and QIV are the flow rates of SMB in Zone I, II, III, and IV, respectively; QD, QX, QF, and QR are the flow rates of desorbent, extract, feed, and raffinate, respectively; NC is the column number.
gPROMS 4.0.0 software was employed to numerically solve the model equations containing partial differential equations and algebraic equations. The partial differential equations were transferred to ordinary differential equations by discretization of the axial domain using the Orthogonal Collocation on Finite Elements method (OCFEM). The ordinary differential equations were then solved by the Runge–Kutta method using the SRADAU solver.

2.4. SMB Performance Parameters

Parameters, including purity, productivity, and solvent consumption, were used to evaluate the separation performance.
The purity of the extract is defined as the ratio of the mass of the more-retained compound to the total mass of the enantiomers contained in the extract stream over a SMB cycle during cyclic steady state. The purity of the raffinate is defined as the ratio of the mass of the less-retained compound to the total mass of the enantiomers contained in the extract stream over a SMB cycle during cyclic steady state.
P U R = c 1 , R ¯ c 1 , R ¯ + c 2 , R ¯
P U X = c 2 , X ¯ c 1 , X ¯ + c 2 , X ¯
The productivity of the process is defined as the amount of racemic menthol fed to the SMB system per volume of the chiral stationary phase per unit of time.
P R = Q F c T , F 1 ε N C V C
The solvent consumption is defined as total volume of solvent used in the eluent and feed per amount of racemic menthol treated.
S C = Q D + Q F Q F c T , F
where c 1 , R ¯ and c 2 , R ¯ are the average concentration of the less-retained component and more-retained component in raffinate stream over a cycle, respectively; c 1 , X ¯ and c 2 , X ¯ are the average concentration of the less-retained component and more-retained component in raffinate stream over a cycle, respectively; VC is the volume of the column; cT,F is the total feed concentration.

2.5. Design of SMB Separation Process

To obtain high-purity extract and raffinate, the flow rates in each zone and the switching time of SMB should be selected appropriately. Standing wave theory [36,37], genetic algorithm [38,39], and triangle theory [40] are used for the design and optimization of the SMB separation process in published works. The triangle theory is a convenient method for both linear and non-linear systems when the axial dispersion and mass transfer resistance are negligible, because it can provide the constraints of the flow rate ratio of the liquid and solid phases in the corresponding TMB process for complete separation [41]. However, this theory is not effective for the determination of operating condition boundaries in the presence of axial dispersion and mass transfer resistance. In this study, the SMB process was designed by estimation of the separation region considering the transport effect [42,43,44].
The parameter mj is defined as the ratio of the liquid-phase flow rate and the solid-phase flow rate in zone j of the corresponding TMB process.
m j = Q j T M B Q s
where QjTMB and Qs are the flow rate of liquid phase and solid phase in zone j of the corresponding TMB process, respectively.
The relationship between the SMB process and the corresponding TMB process is shown in
Q j = Q j T M B + ε 1 ε Q s
Q s = 1 ε V C t s
where Qj is the flow rate of liquid phase in zone j of the SMB process, and ts is the switching time of the SMB process.
To ensure the complete regeneration of the chiral stationary phase in Zone I and eluent in Zone IV, the values of mI and mIV were selected using
m I = H 2 + Q m a x b 2 β
m I V = H 1 + Q m a x b 1 / β
where H1, H2, Qmax, b1, and b2 are the adsorption isotherm parameters in the modified linear + Langmuir model; β is the safety margin, and is considered as 1.25 here [45,46].
After selecting the switching time and total feed concentration, the separation region for both outlet streams with purities above 99.0% was obtained by screening different pairs of (mII × mIII) using simulations. In practical operation, the performance of a SMB unit can be influenced by several factors that are not taken into account in the common mathematical model, including uncertainty in adsorption equilibrium and kinetics, packing and tubing asymmetries, back-mixing in extra-column dead volumes, and flow rate variation in the four zones [9]. Considering these factors, a pair of (mII × mIII) was selected inside the separation region for the SMB operation to ensure that the outlet purities are above the purity requirements. The flow rates of each zone in the SMB unit were determined by Equations (37)–(39), and the inlet and outlet flow rates were determined by Equations (29)–(32).

3. Experimental Section

3.1. Materials and Equipment

Racemic menthol (>98%, GC grade) and 1,3,5-tri-tert-butylbenzene (TTBB, >98%) were purchased from Tokyo Chemical Industry Ltd., Tokyo, Japan. l-menthol (>99%) was purchased from Shanghai Macklin Biochemical Ltd., Shanghai, China. n-hexane (>99.9%, HPLC grade) and isopropanol (>99.9%, HPLC grade) were obtained from Fischer Scientific Inc., Waltham, MA, USA. It should be noted that all solutions containing menthol and TTBB were freshly prepared using the mixture of n-hexane/isopropanol with a volumetric ratio of 95/5 as the solvent. n-hexane/isopropanol (95/5, v/v) was used in all experiments related to preparative chromatography, including the hydrodynamic study, isotherm measurements, single-column batch chromatography, and multi-column continuous SMB chromatography, and n-hexane/isopropanol (99/1, v/v) was only used for concentration determination of menthol enantiomers in analytical HPLC. For the 20 μm preparative chiral stationary phase, Amylose 3,5-dimethylphenylcarbamate coated on silica gel—commercially named Chiralpak AD—was purchased from Tokyo Daicel Chemical Industry, Ltd., Tokyo, Japan. Six preparative chromatographic columns (10 mm ID × 150 mm L) were packed with 20 μm Chiralpak AD by slurry method, and were used for the SMB experiment. One of these preparative columns was used for the adsorption equilibrium and kinetic study. An analytical column (4.6 mm ID × 150 mm L), Chiralpak AD-H, was purchased from Tokyo Daicel Chemical Industry, Ltd., Tokyo, Japan, and used for measurement of menthol enantiomer concentration.
A semi-preparative HPLC, Ultimate 3000, purchased from Thermo Fischer Scientific Inc., Waltham, USA, was used for the single-column studies, including the hydrodynamic study, adsorption equilibrium measurement, and kinetic study. The equipment consists of a binary pump, column oven, UV detector, and fraction collector, and the software Chromeleon 7.2 was used for device control. The binary pump was used to feed the menthol solution and eluent to the column in adsorption equilibrium measurement and kinetic studies. The column oven was used to control the temperature of the preparative column. The fraction collector was used to collect the outlet samples in the kinetic studies.
An analytical HPLC, Ultimate 3000, equipped with quaternary pump, autosampler, column oven, and refractive index detector, was also purchased from Thermo Fischer Scientific Inc., Waltham, USA. Chromeleon 7.1 software was used for device control and data acquisition. The concentrations of menthol enantiomers in samples were determined by the external standard method using analytical column Chiralpak AD-H. The temperature of the column was set at 25 °C. n-hexane/isopropanol (99/1, v/v) was used as the mobile phase for a higher resolution, and the flow rate was 1 mL/min.
The SMB device, VARICOL-micro, was purchased from NOVASEP, Pompey, France. Five double-piston pumps (ARMEN, Paris, France) were responsible for the injection of the two inlet streams, withdrawal of the two outlet streams, and circulation for the recycling streams, respectively. The SMB columns were installed in a chamber equipped with air circulation and a heat exchanger. The thermostatic bath was connected to the heat exchanger to control the operating temperature. The two inlet streams, feed and eluent, were preheated to the operating temperature by a heat exchanger as well. Each external stream was distributed to the transfer lines between every two adjacent columns by branch lines. Pneumatic valves were connected to each branch line, and the external line positions were shifted by independently opening and closing these valves, which were controlled by software iFIX 4.5. A UV detector (KNAUER, Berlin, Germany) and polar detector (IBZ, Hanover, Germany) were connected to the recycling line to online monitor the enantiomer concentrations. A six-port valve with a 250 μL loop was also installed in the recycling lines to facilitate the sample collections and obtain the internal concentration profiles.

3.2. Hydrodynamic Study of the SMB Columns

Because of the same shifting times for individual external lines passing through all fixed beds, packing symmetry was always required for the SMB columns to achieve cyclic steady-state operation and high outlet-product purity. Therefore, hydrodynamic characterizations of the SMB columns, including pressure drop and pulse injection of the non-retained compound solution, were performed to ensure that all columns have equal CSP packing density.

3.2.1. Pressure-Drop Measurement

The bulk porosities of all columns were determined by pressure drop measurements [31,43]. The eluent, n-hexane/isopropanol (95/5, v/v), was pumped into the semi-preparative HPLC system. The pressure drops in SMB columns were obtained by comparing the operating pressures of the pump when the SMB column was connected and disconnected, respectively. The temperature of the column was maintained at 25 °C. The pressure drops in the SMB column at different flow rates in the range of 1–10 mL/min were measured, and the bulk porosities of the columns were determined by Kozeny’s correlation [47].
Δ p L = 150 1 ε 2 ε 3 d p 2 μ u
where Δp is the pressure drop in the column; μ represents the viscosity of the eluent, which was calculated by the correlations proposed in reference [48].

3.2.2. Total Porosities and Axial Dispersion Estimation

Total porosity and axial dispersion were estimated by tracer experiments [35,42,49]. A total of 5 g/L solution of TTBB, a non-retained compound [45,46], was injected into each SMB column using a 20 μL loop. The mobile phase used was n-hexane/isopropanol (95/5, v/v), and the flow rate of the mobile phase was 3 mL/min. The temperature of the SMB column was maintained at 25 °C. A UV detector was connected after the column, and the wavelength was set at 270 nm to online measure the outlet concentration.
The residence-time distribution curve can be obtained by
E t r = c T T B B , o u t 0 c T T B B , o u t d t r
where tr is the residence time; E(tr) is the residence-time distribution density function; c T T B B , o u t is the outlet concentration of TTBB.
The mean residence time and the variance of the residence-time distribution can be calculated by the first and second statistical moments of the residence-time distribution curve using
t r ¯ = 0 t r E t r d t r
σ 2 = 0 t r t r ¯ 2 E t r d t r
where t r ¯ is the mean residence time, and σ2 is the variance of the residence-time distribution.
The Peclet number is a dimensionless number describing the back-mixing degree in a packed column, and is defined by
P e = u L ε D a x
The total porosity and the Peclet number of the SMB columns were estimated according to the mean residence time and the variance of the residence-time distribution.
ε T = t r ¯ Q D V C
P e = 2 σ 2 t r ¯ 2
where εT is the total porosity of the SMB column, and Pe is the Peclet number.

3.3. Measurements of Adsorption Isotherm

The adsorption–desorption method was applied to measure the adsorption isotherm [50,51]. The temperature of the column was controlled at 25 °C during the experiment process. The preparative column was first saturated with the eluent, n-hexane/isopropanol (95/5, v/v). Then, menthol solution was continuously fed to the chromatographic column with a flow rate of 3 mL/min. After reaching adsorption equilibrium, eluent was pumped to the column at a flow rate of 3 mL/min to regenerate the chiral stationary phase completely. All of the outlet solution in the desorption step was collected, and the concentration of this solution was analyzed. Measurements were conducted using solutions with single enantiomer concentrations ranging from 1 to 50 g/L to obtain the adsorption isotherm. The adsorption capacity for each concentration was determined by
ε c i , F + 1 ε q i * V C = c i , d V d
where ci,d is the concentration of component i in the outlet solution, and Vd is the volume of the outlet solution.

3.4. Batch Chromatography

The preparative column was saturated with the eluent prior to the chromatography experiment. Racemic menthol solution was pumped to the chromatographic column, followed by the desorption step using the eluent n-hexane/isopropanol (95/5, v/v). The temperature of the column oven was set at 25 °C during the experiment process. For both frontal chromatography and elution chromatography, the total feed concentration was 5 g/L, and the flow rate was 3 mL/min. The feed injection times were 12 min and 1 min in the frontal chromatography and elution chromatography experiment, respectively. Outlet samples were collected every 30 s and analyzed to obtain the experimental response curve.

3.5. SMB Chromatography

The flow rate of the five pumps,—eluent pump, extract pump, feed pump, raffinate pump, and recycling pump—were calibrated prior to the experiment. The designed operating conditions, including switching time and flow rates of inlet, outlet, and recycling streams, were set on the control software. The temperature of the SMB columns and the two inlet streams were set at 25 °C. The cyclic steady state was identified through the signals of the polar monitor. After cyclic steady state was reached, the outlet solutions of extract and raffinate in an entire cycle were collected in order to evaluate the separation performance. Samples were collected at one-quarter, one-half, three-quarters, and at the complete switching time using the six-port valve during cyclic steady state. Concentrations of menthol enantiomers in these samples were measured by analytical HPLC for the evaluation of the internal concentration distribution.
It should be noted that the recycling pump located at the circulation loop contains an extra-column dead volume, leading to a delay of the internal concentration profile before it enters the first column. Considering this asymmetry, the Novasep unit adopts an asynchronous correction strategy. The dead time caused by the recycling pump is estimated by
t E D = V E D Q j ¯
where VED is the extra-column dead volume, measured and recommended as 4 mL by the equipment producer, and Q j ¯ is the average flow rate of the four sections in the SMB process. Shifting of all the inlet and outlet ports that pass through the recycling lines is compensated for with this extra time delay [43,52].

4. Results and Discussion

4.1. Hydrodynamics of the Preparative Columns

The hydrodynamic characteristics of the SMB columns were studied by the measurements of the bed porosity, total porosity, and axial dispersion.
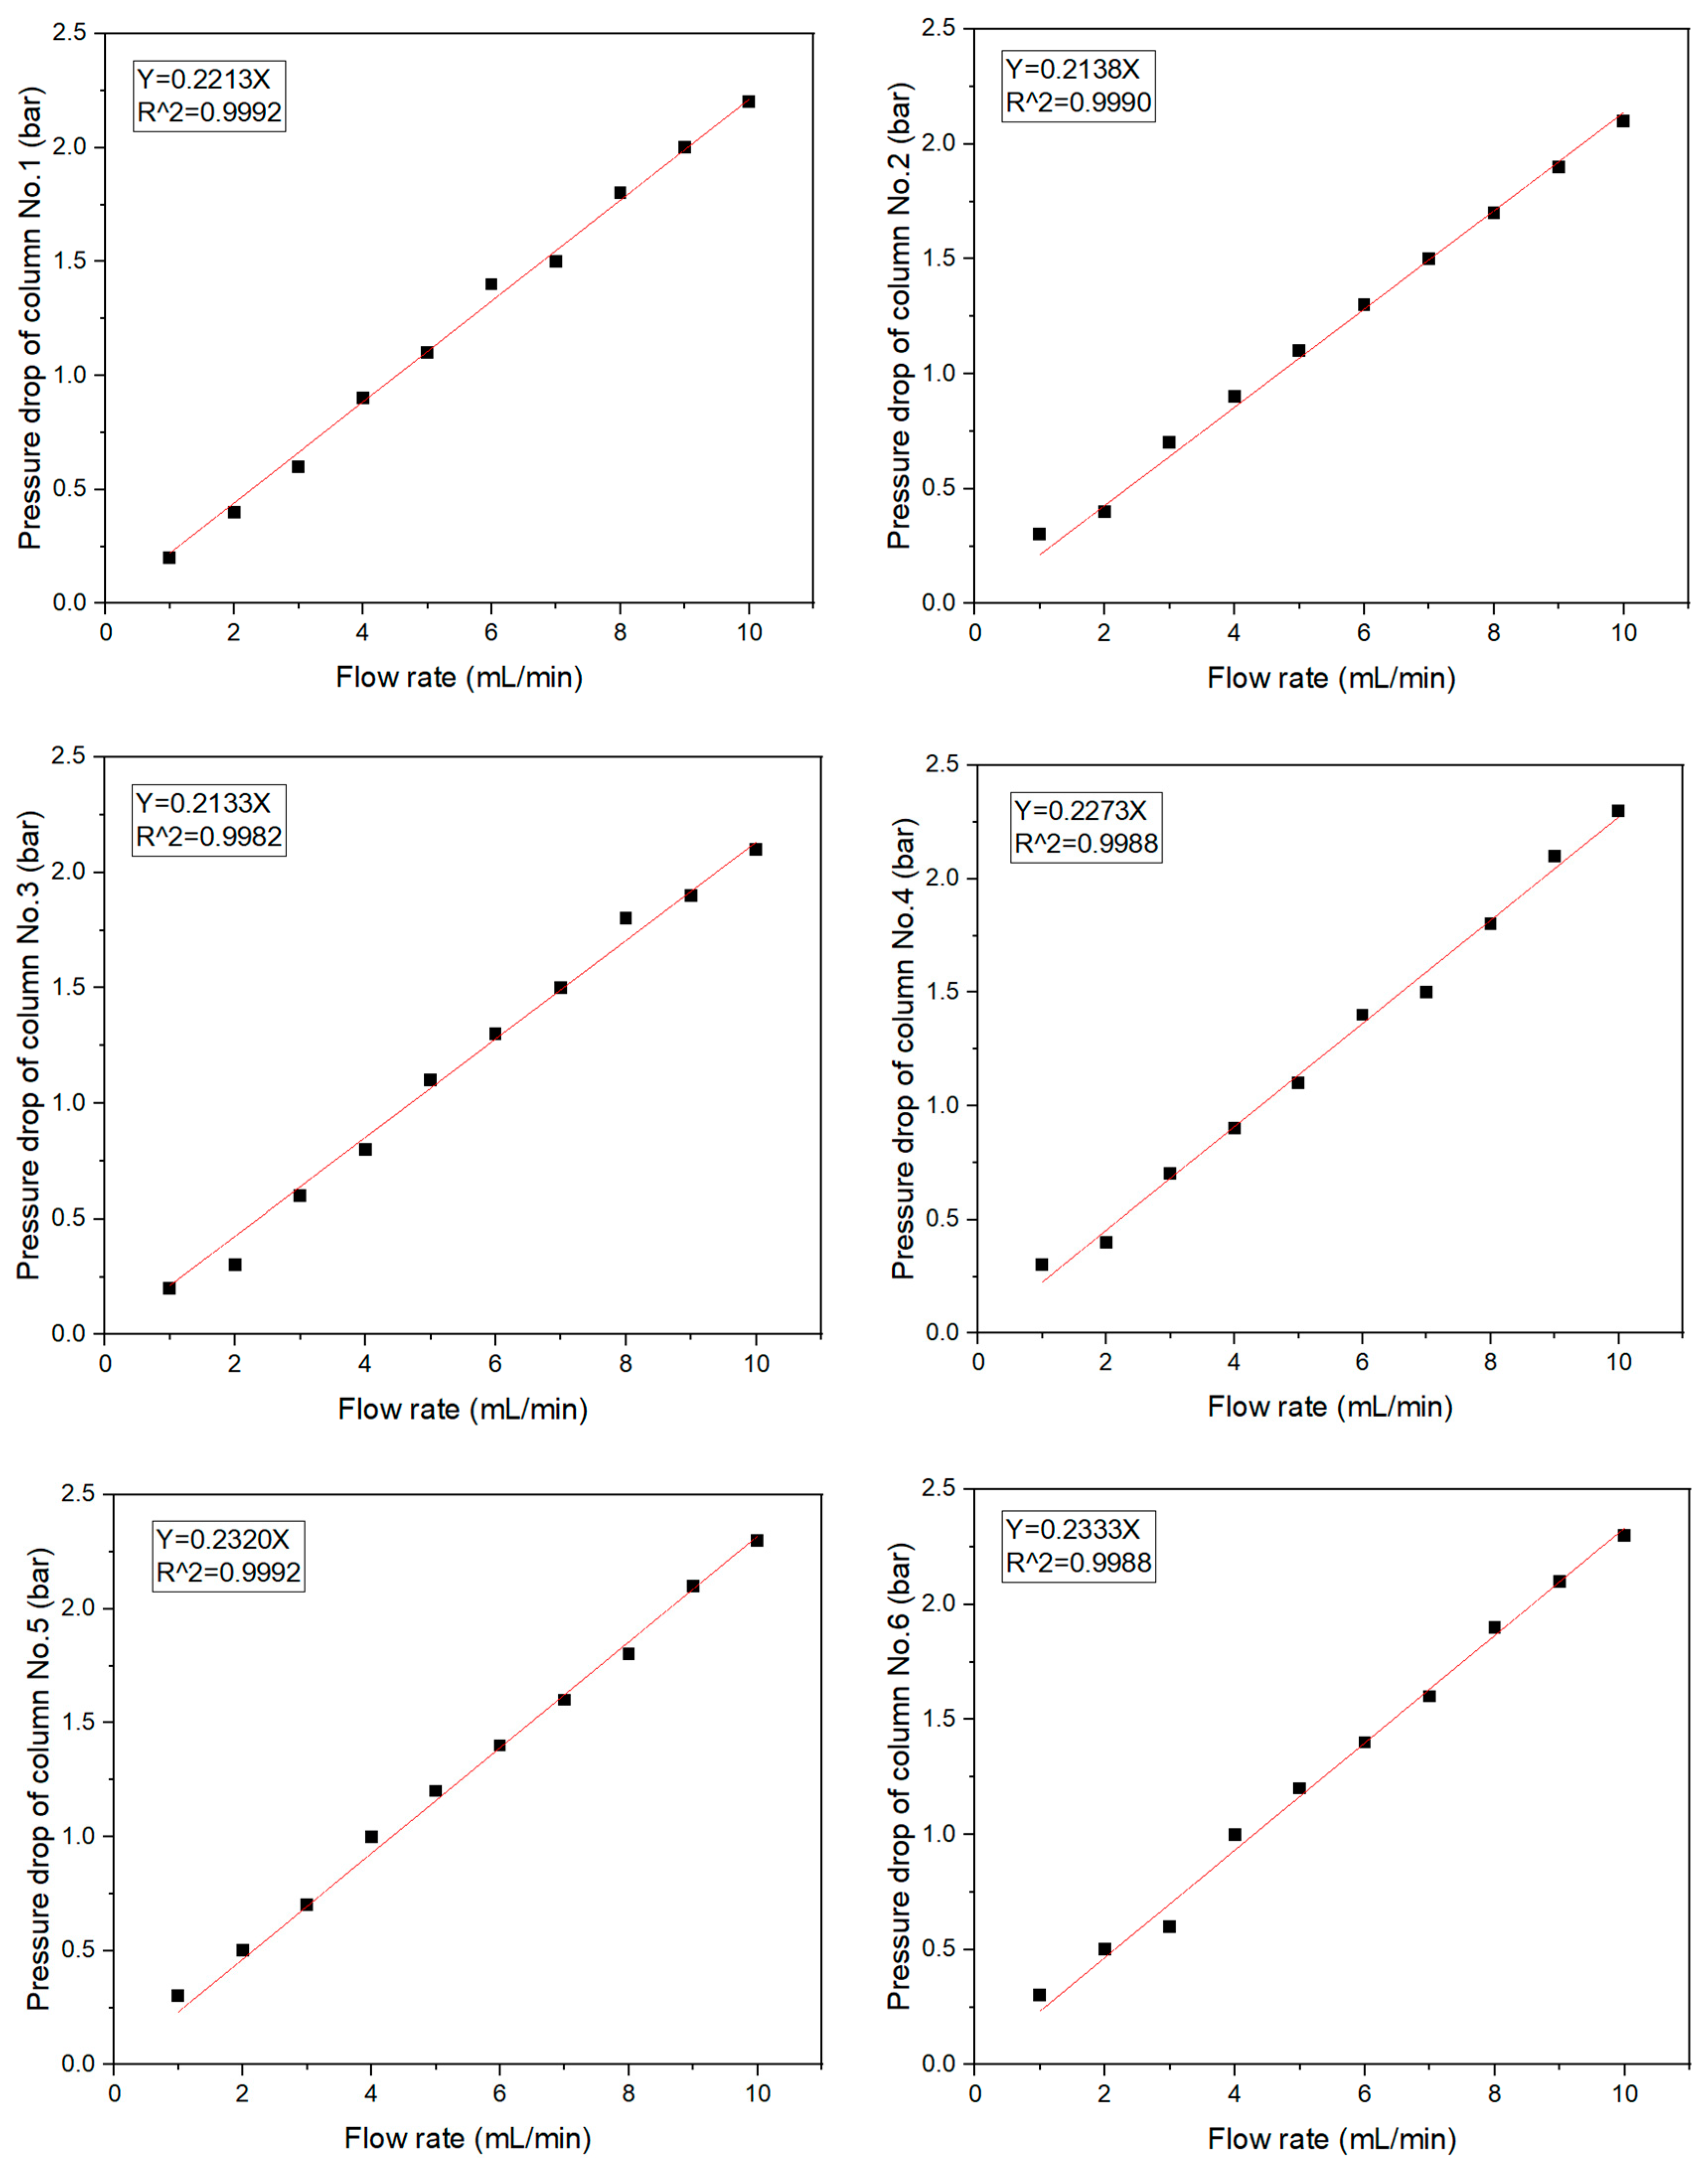
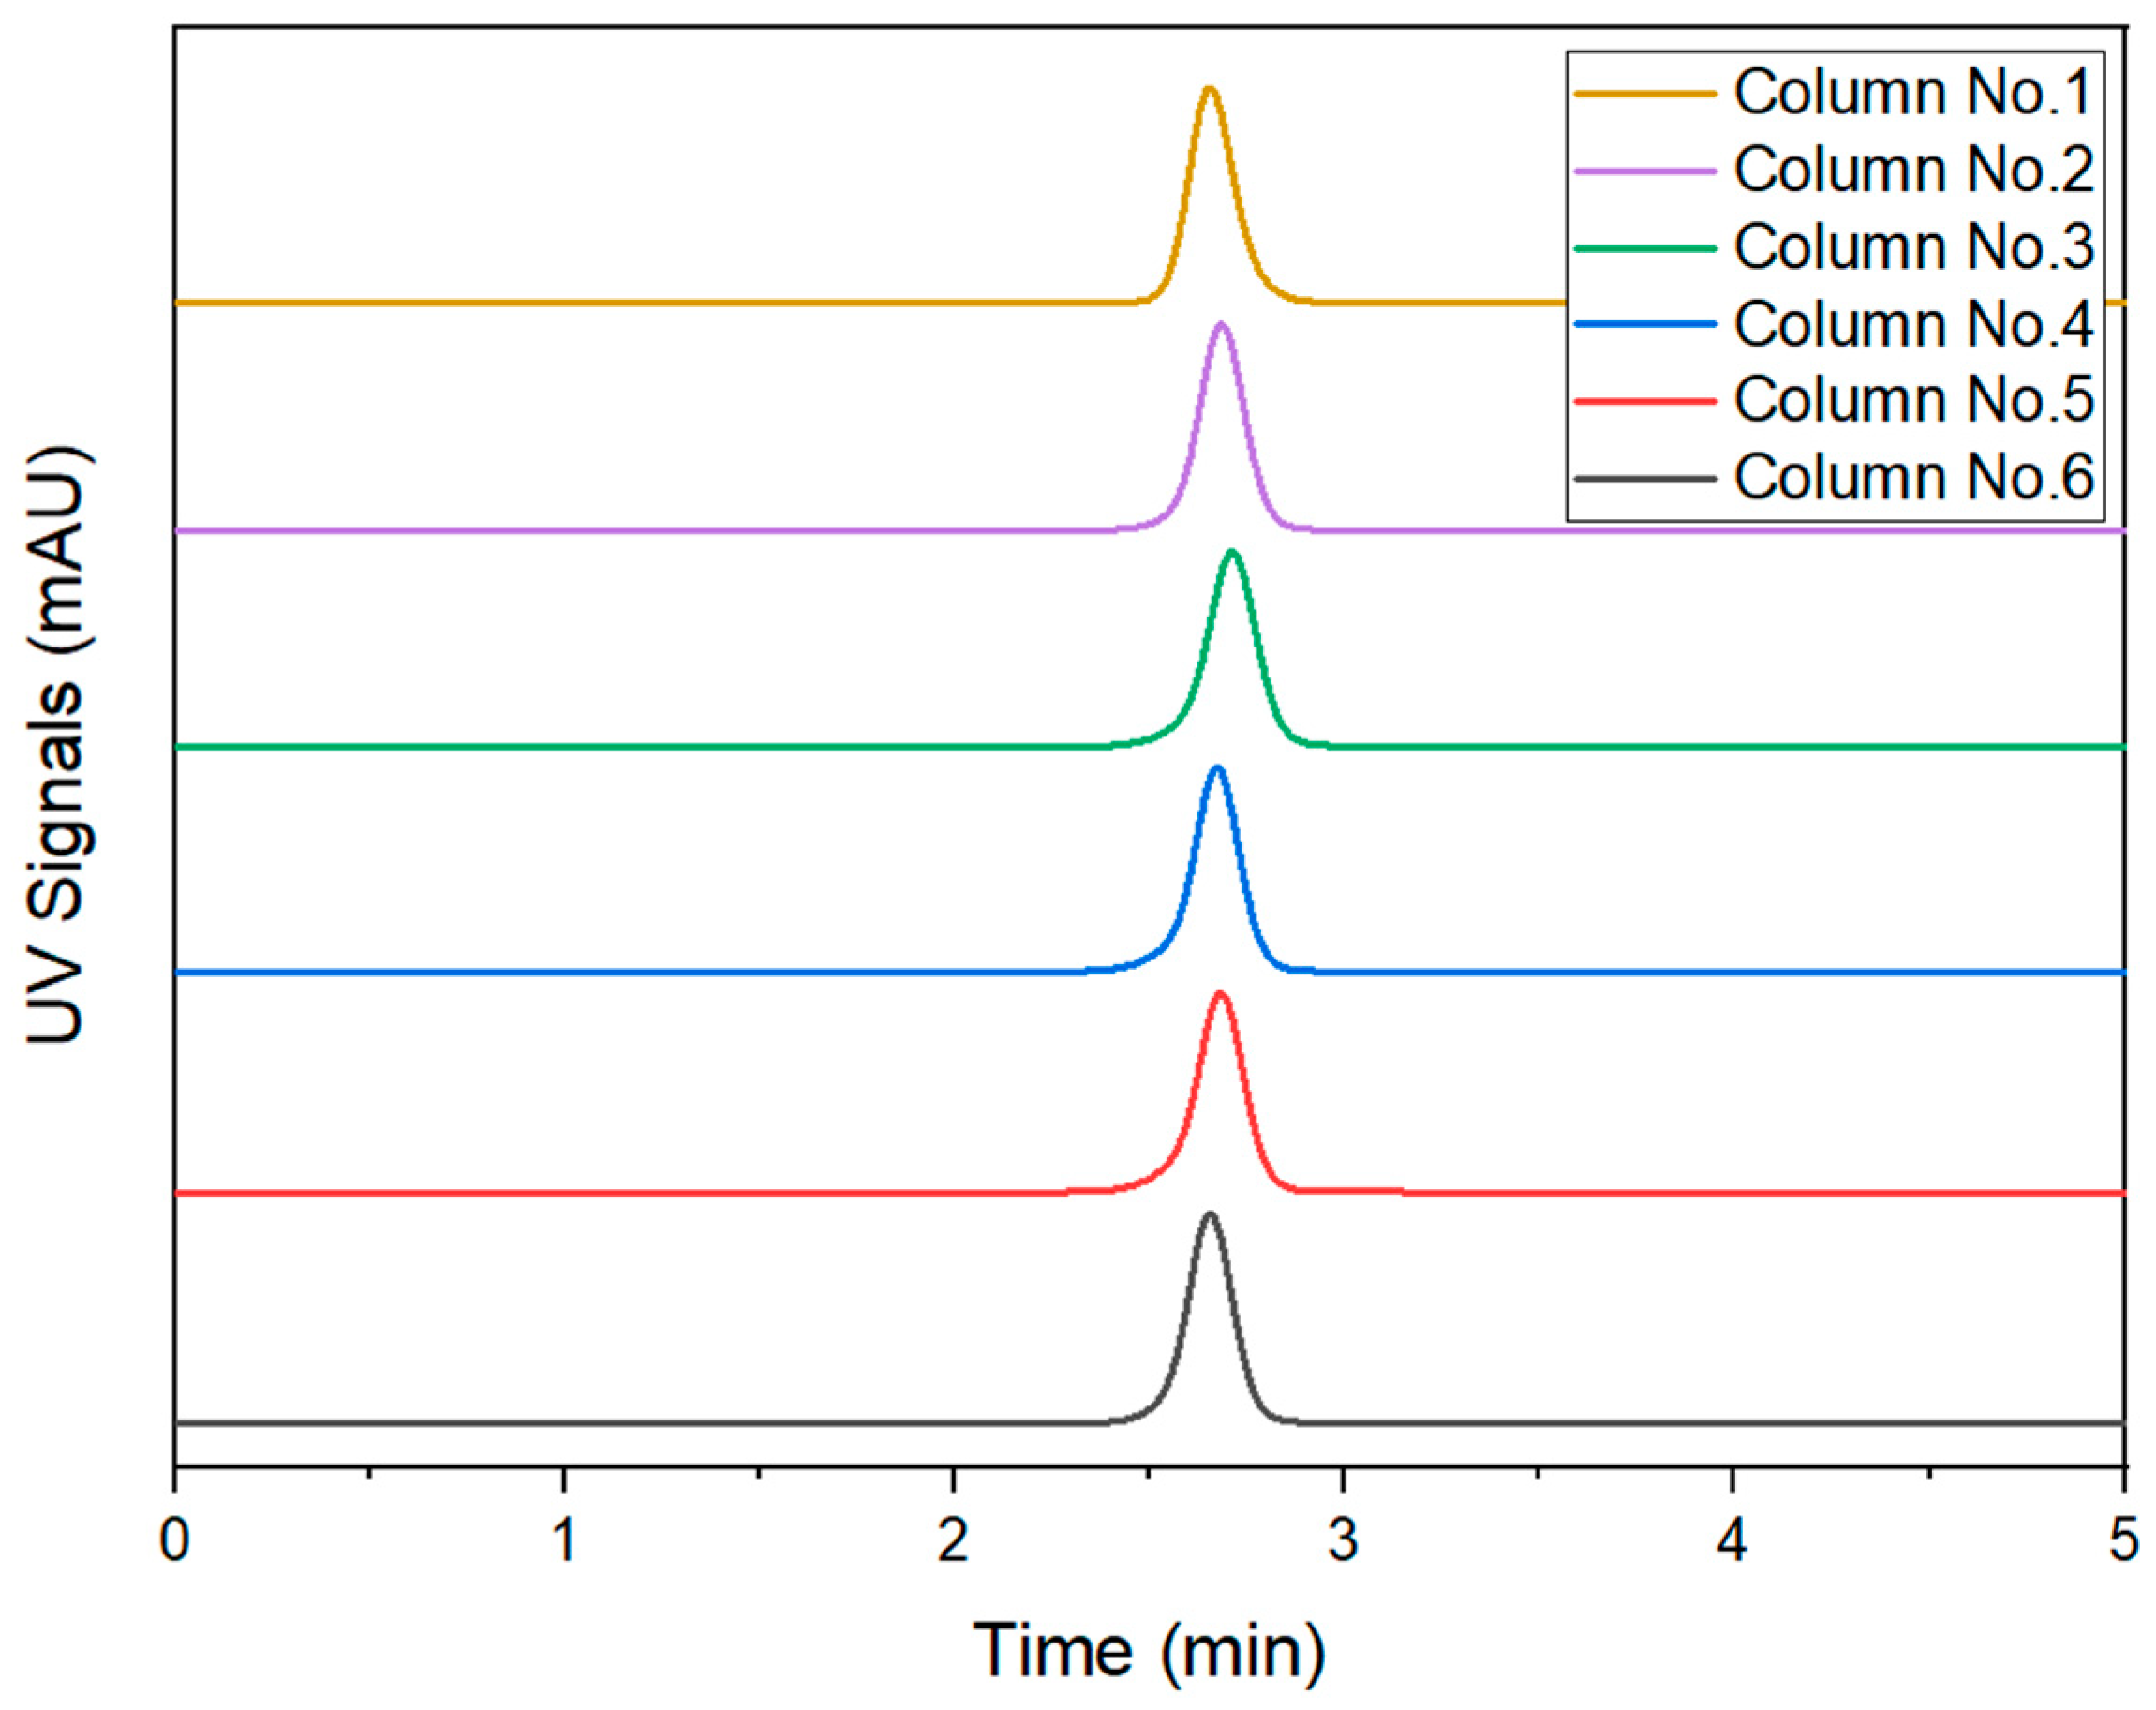
The pressure drops in each SMB column at different flow rates were measured, and Figure 3 shows the relationship between the pressure drop and the flow rate of the eluent. The bed porosities of each preparative column were obtained by linear fitting the experimental data using Kozeny’s correlation, and are listed in Table 1. The pulse injection of non-retained compound, TTBB, was carried out to determine the total porosity and axial dispersion of the packed bed. The elution profiles are shown in Figure 4, and the total porosity and Peclet number are also summarized in Table 1. The relative errors of bed porosity for all columns are less than 3.0%, which shows a good reproductivity of the packing procedure.

4.2. Competitive Adsorption Isotherms

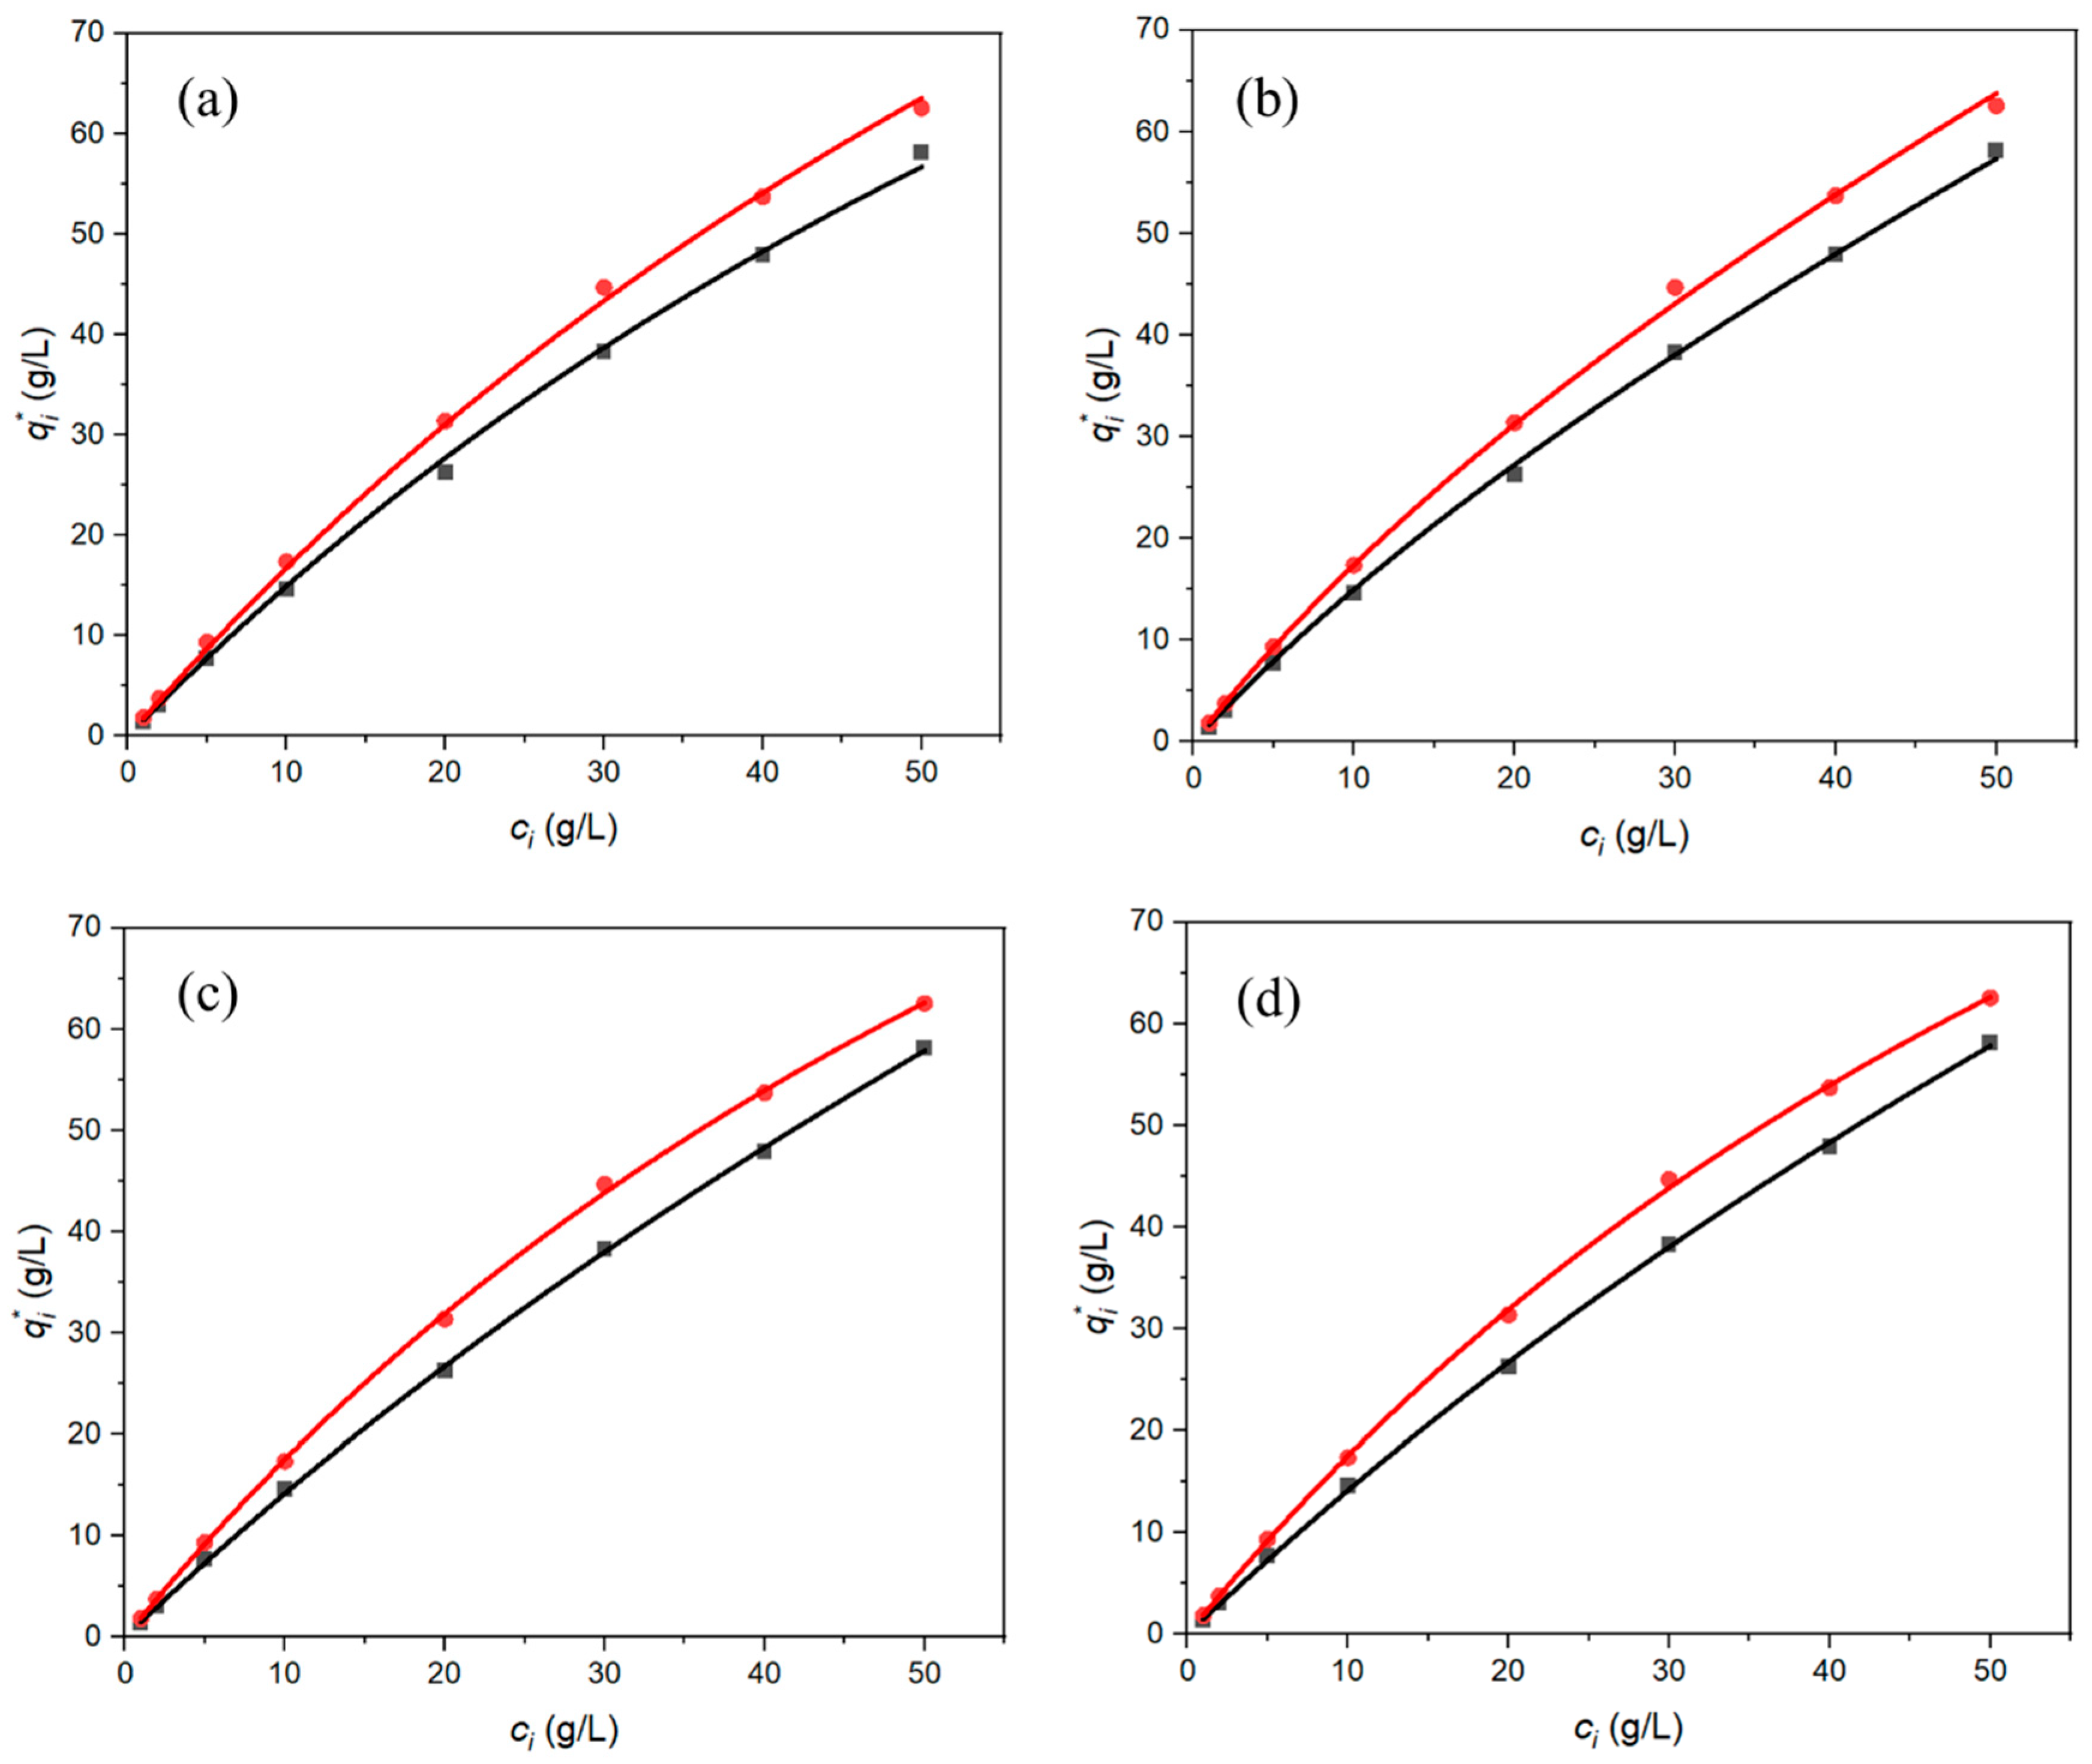
The competitive adsorption isotherm of menthol enantiomers on chiral-stationary-phase Chiralpak AD with n-hexane/isopropanol (95/5) as solvent at 25 °C was measured. Four isotherm models were used for fitting. The obtained model parameters and fitting performance criteria are summarized in Table 2, and the fitting curve is compared with the experimental data in Figure 5. As can be seen, d-menthol is the less-retained component, while l-menthol is the more-retained component. Moreover, both enantiomers present favorable adsorption behavior, so the slope of the adsorption isotherm at infinite diluted concentrations is associated with the fastest propagation velocity of enantiomers. For this reason, these slopes are used for the design of mI and mIV values, as shown in Equations (40) and (41). Among the four competitive adsorption isotherms adopted, the MLLG model achieves the best agreement with the experimental data, although good agreements are also obtained with the other three models. The binary adsorption isotherms of menthol enantiomers in racemic menthol using the MLLG model can be expressed by
q 1 * = 0.504 c 1 + 265.94 × 3.83 × 10 3 c 1 1 + 3.83 × 10 3 c 1 + 7.35 × 10 3 c 2
q 2 * = 265.94 × 7.35 × 10 3 c 2 1 + 3.83 × 10 3 c 1 + 7.35 × 10 3 c 2
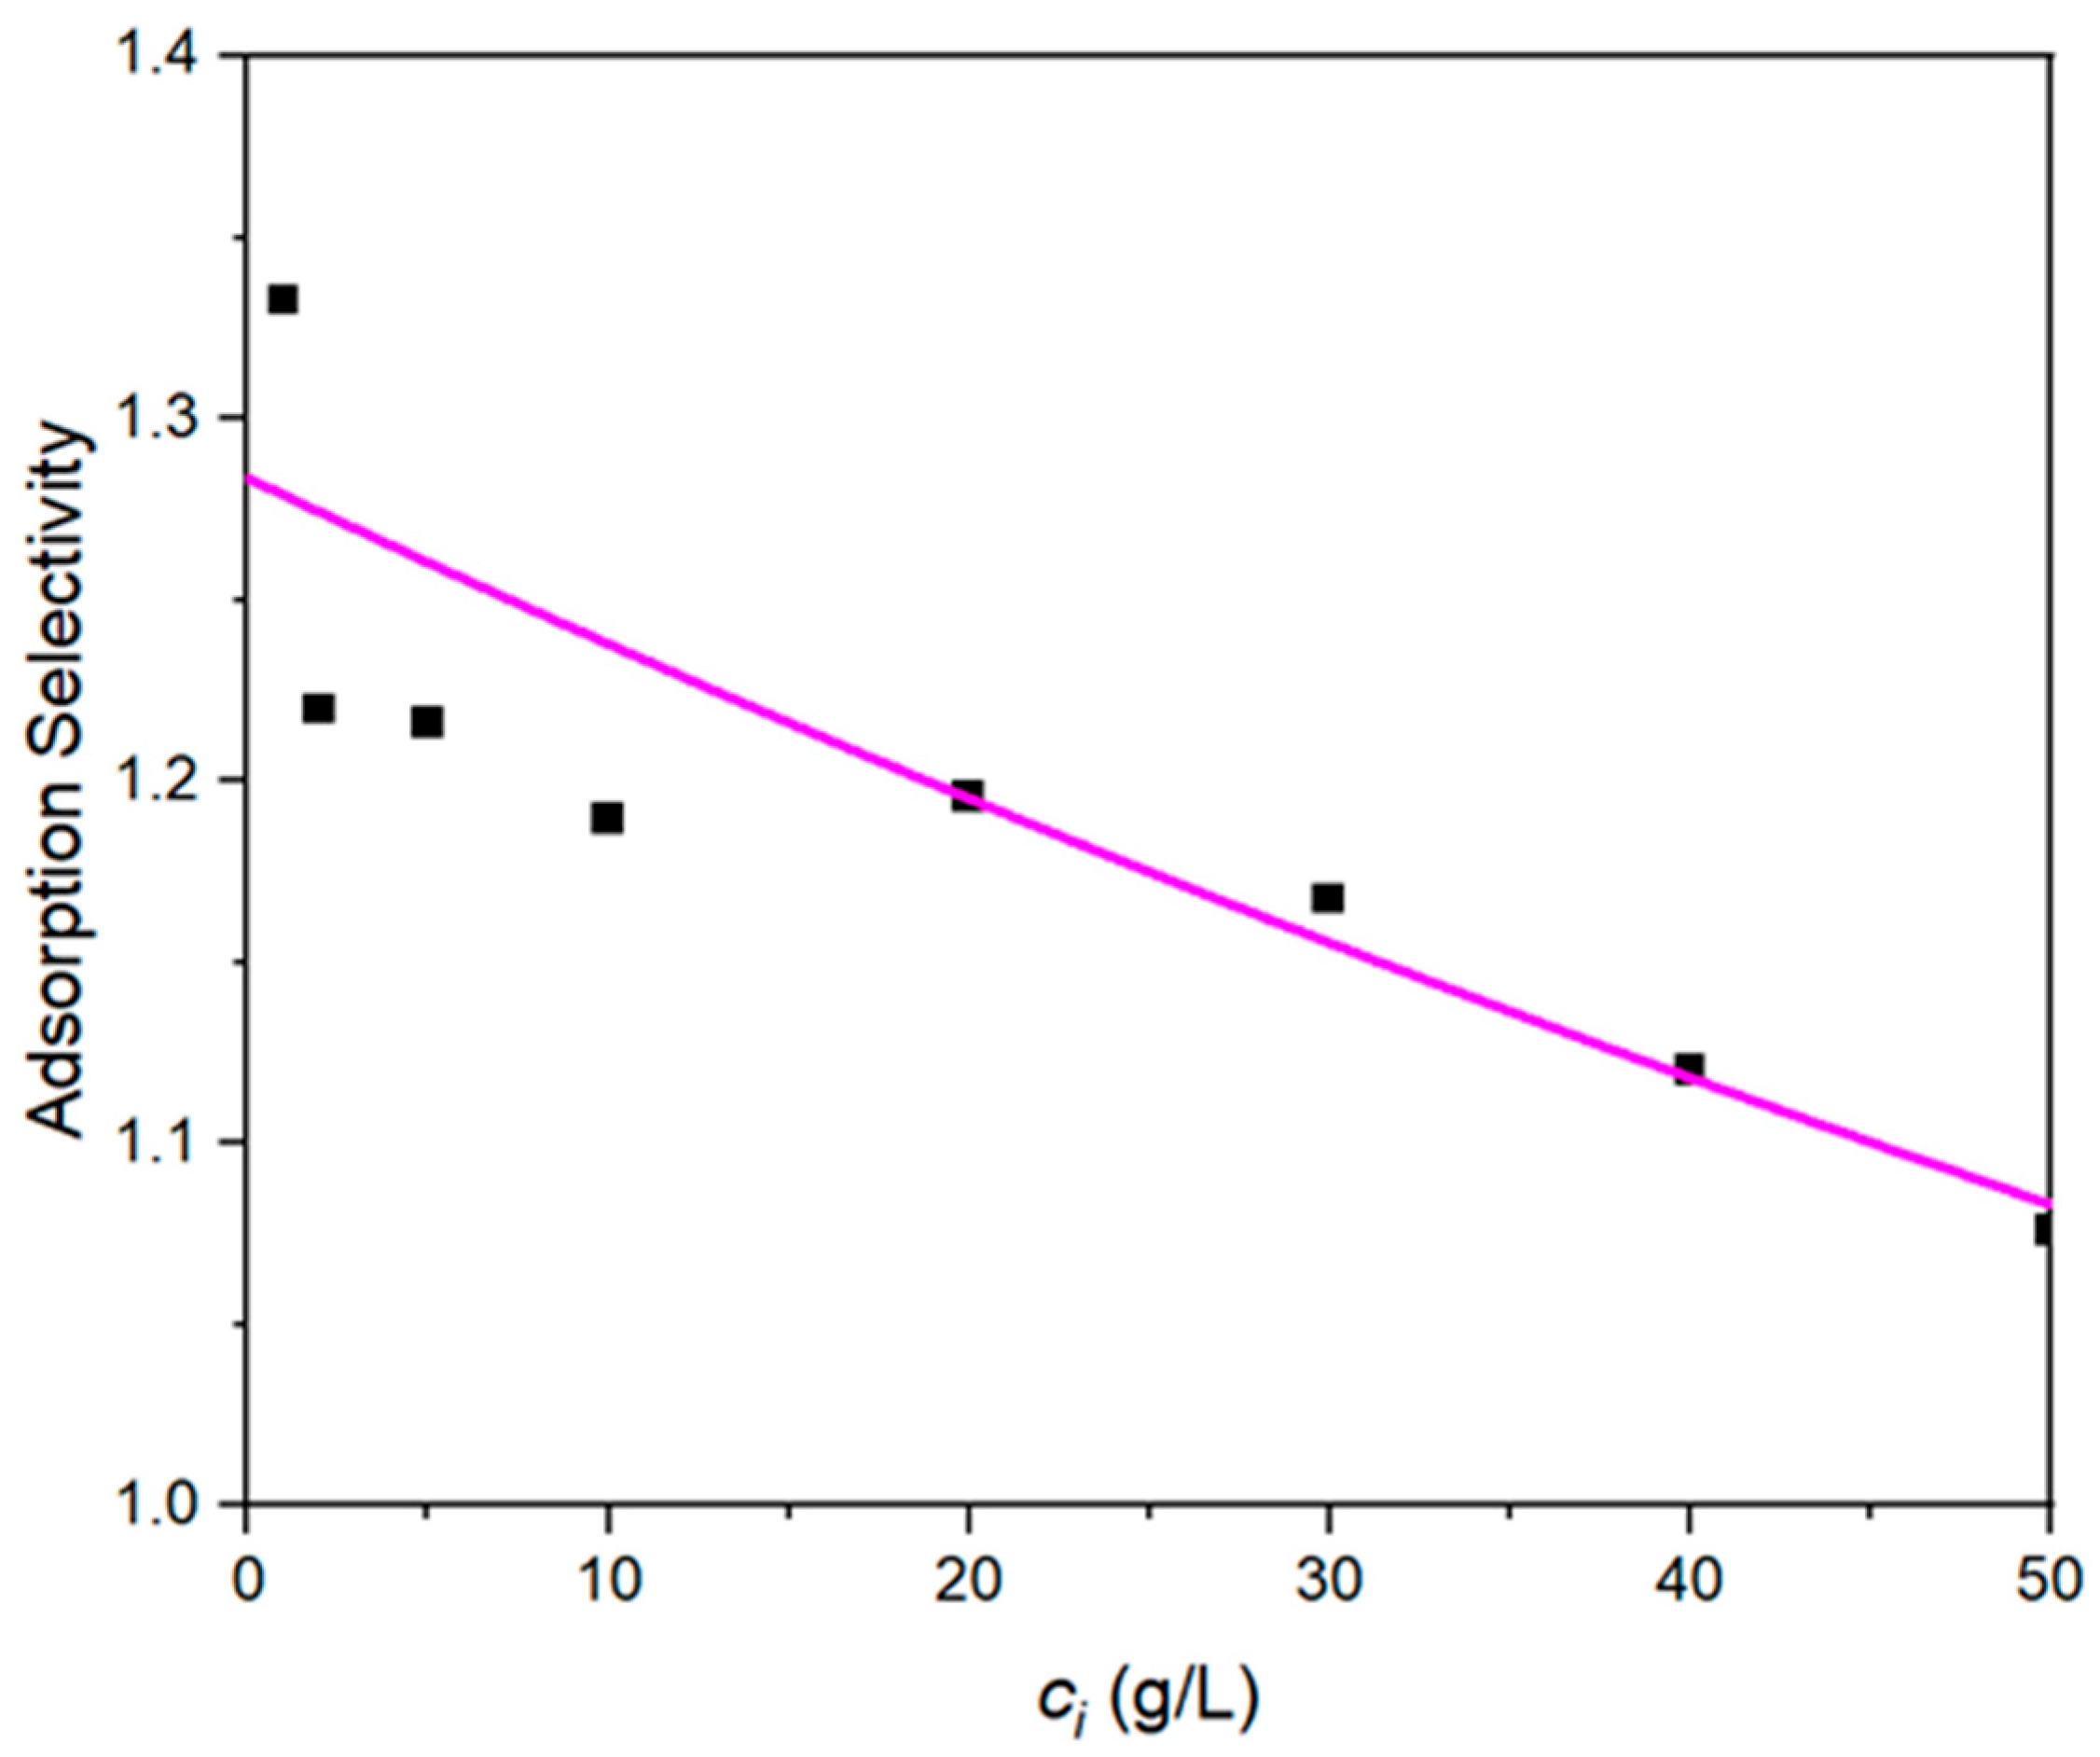
The predicted adsorption selectivity between the menthol enantiomers by the MLLG model at different concentrations was calculated, and compared with the experimental results in Figure 6. A decreasing trend of the selectivity with greater enantiomer concentrations can be observed, demonstrating the necessity of choosing the modified Langmuir isotherm to more accurately predict the adsorption capacity.
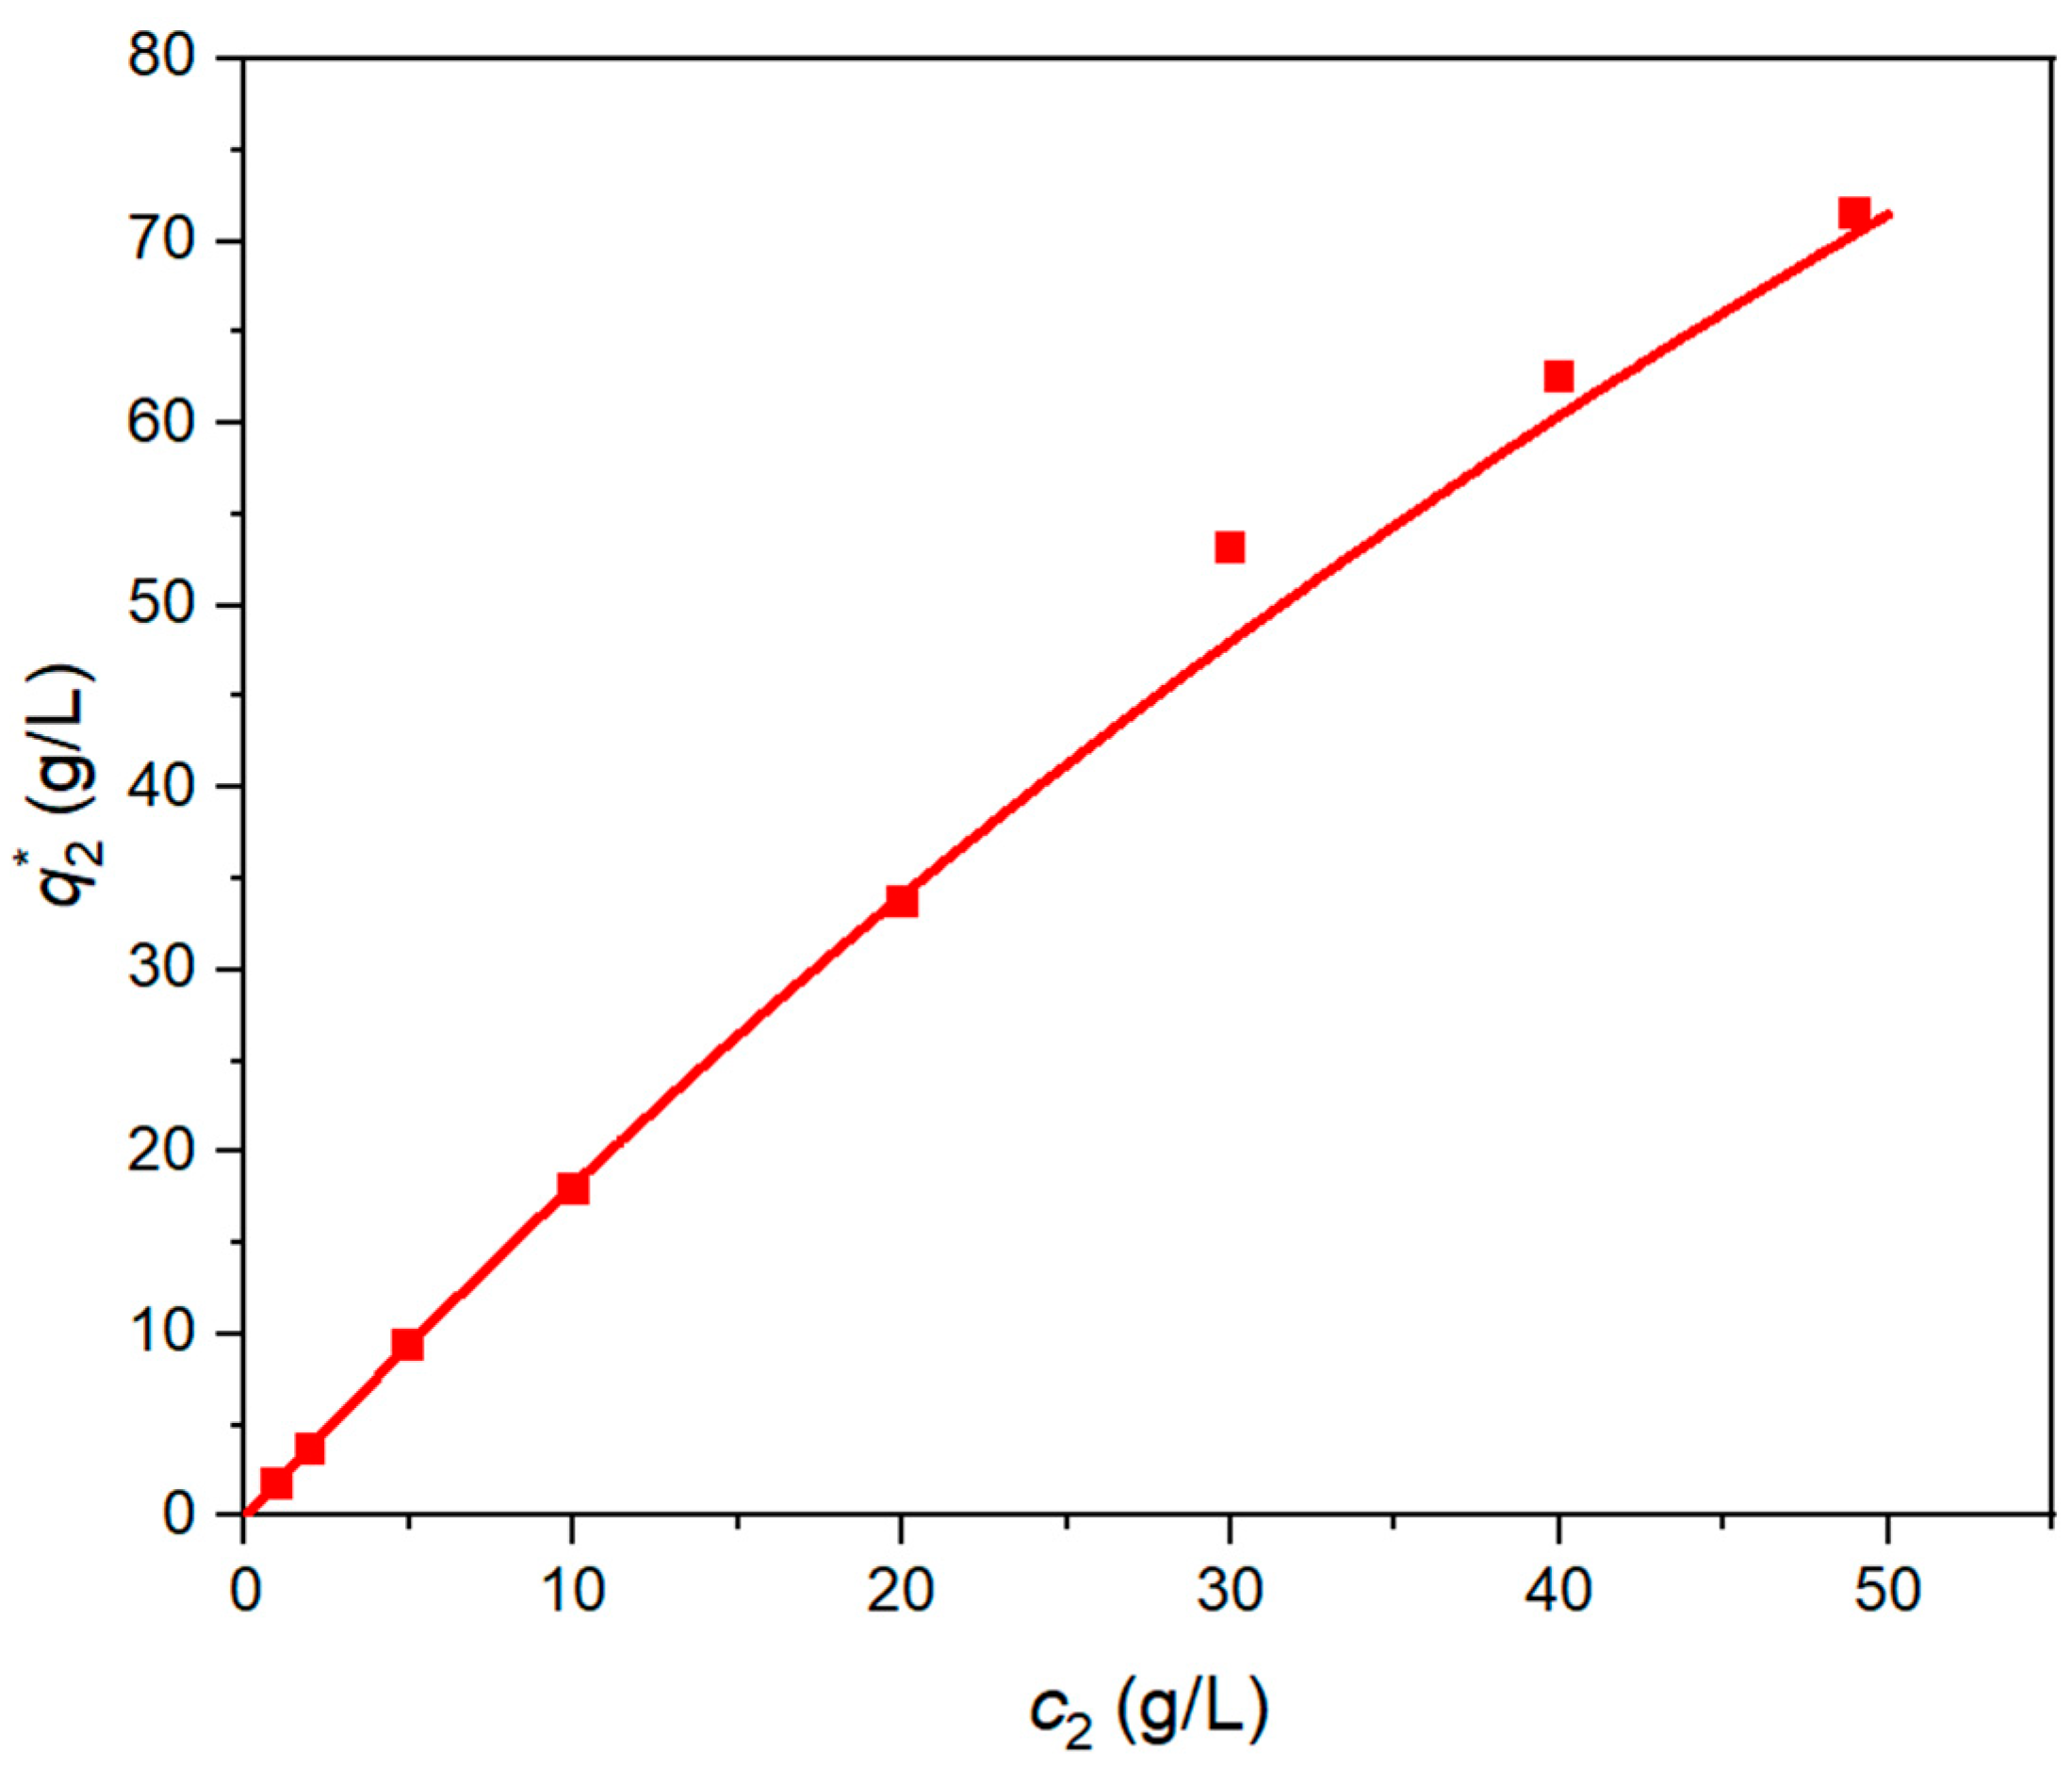
The effectiveness of the MLLG binary isotherm equations in prediction of adsorption capacities without the constraint of equal equilibrium enantiomer concentrations in solution was further verified. The single-component adsorption isotherm of the easily available enantiomer, l-menthol, at 25 °C can be predicted according to Equation (52) simply by assigning the equilibrium d-menthol concentration as 0, as described in Equation (53). The single-component adsorption isotherm of l-menthol was measured and compared with the predicted curve of Equation (53), as shown in Figure 7. Good agreement between the experimental data and predicted values can also be observed in Figure 7. After this validation, the MLLG Equations (51) and (52) for competitive adsorption isotherms of menthol enantiomers are used in the simulations of the following sections.
q 2 * = 265.94 × 7.35 × 10 3 c 2 1 + 7.35 × 10 3 c 2

4.3. Single-Column Chromatography

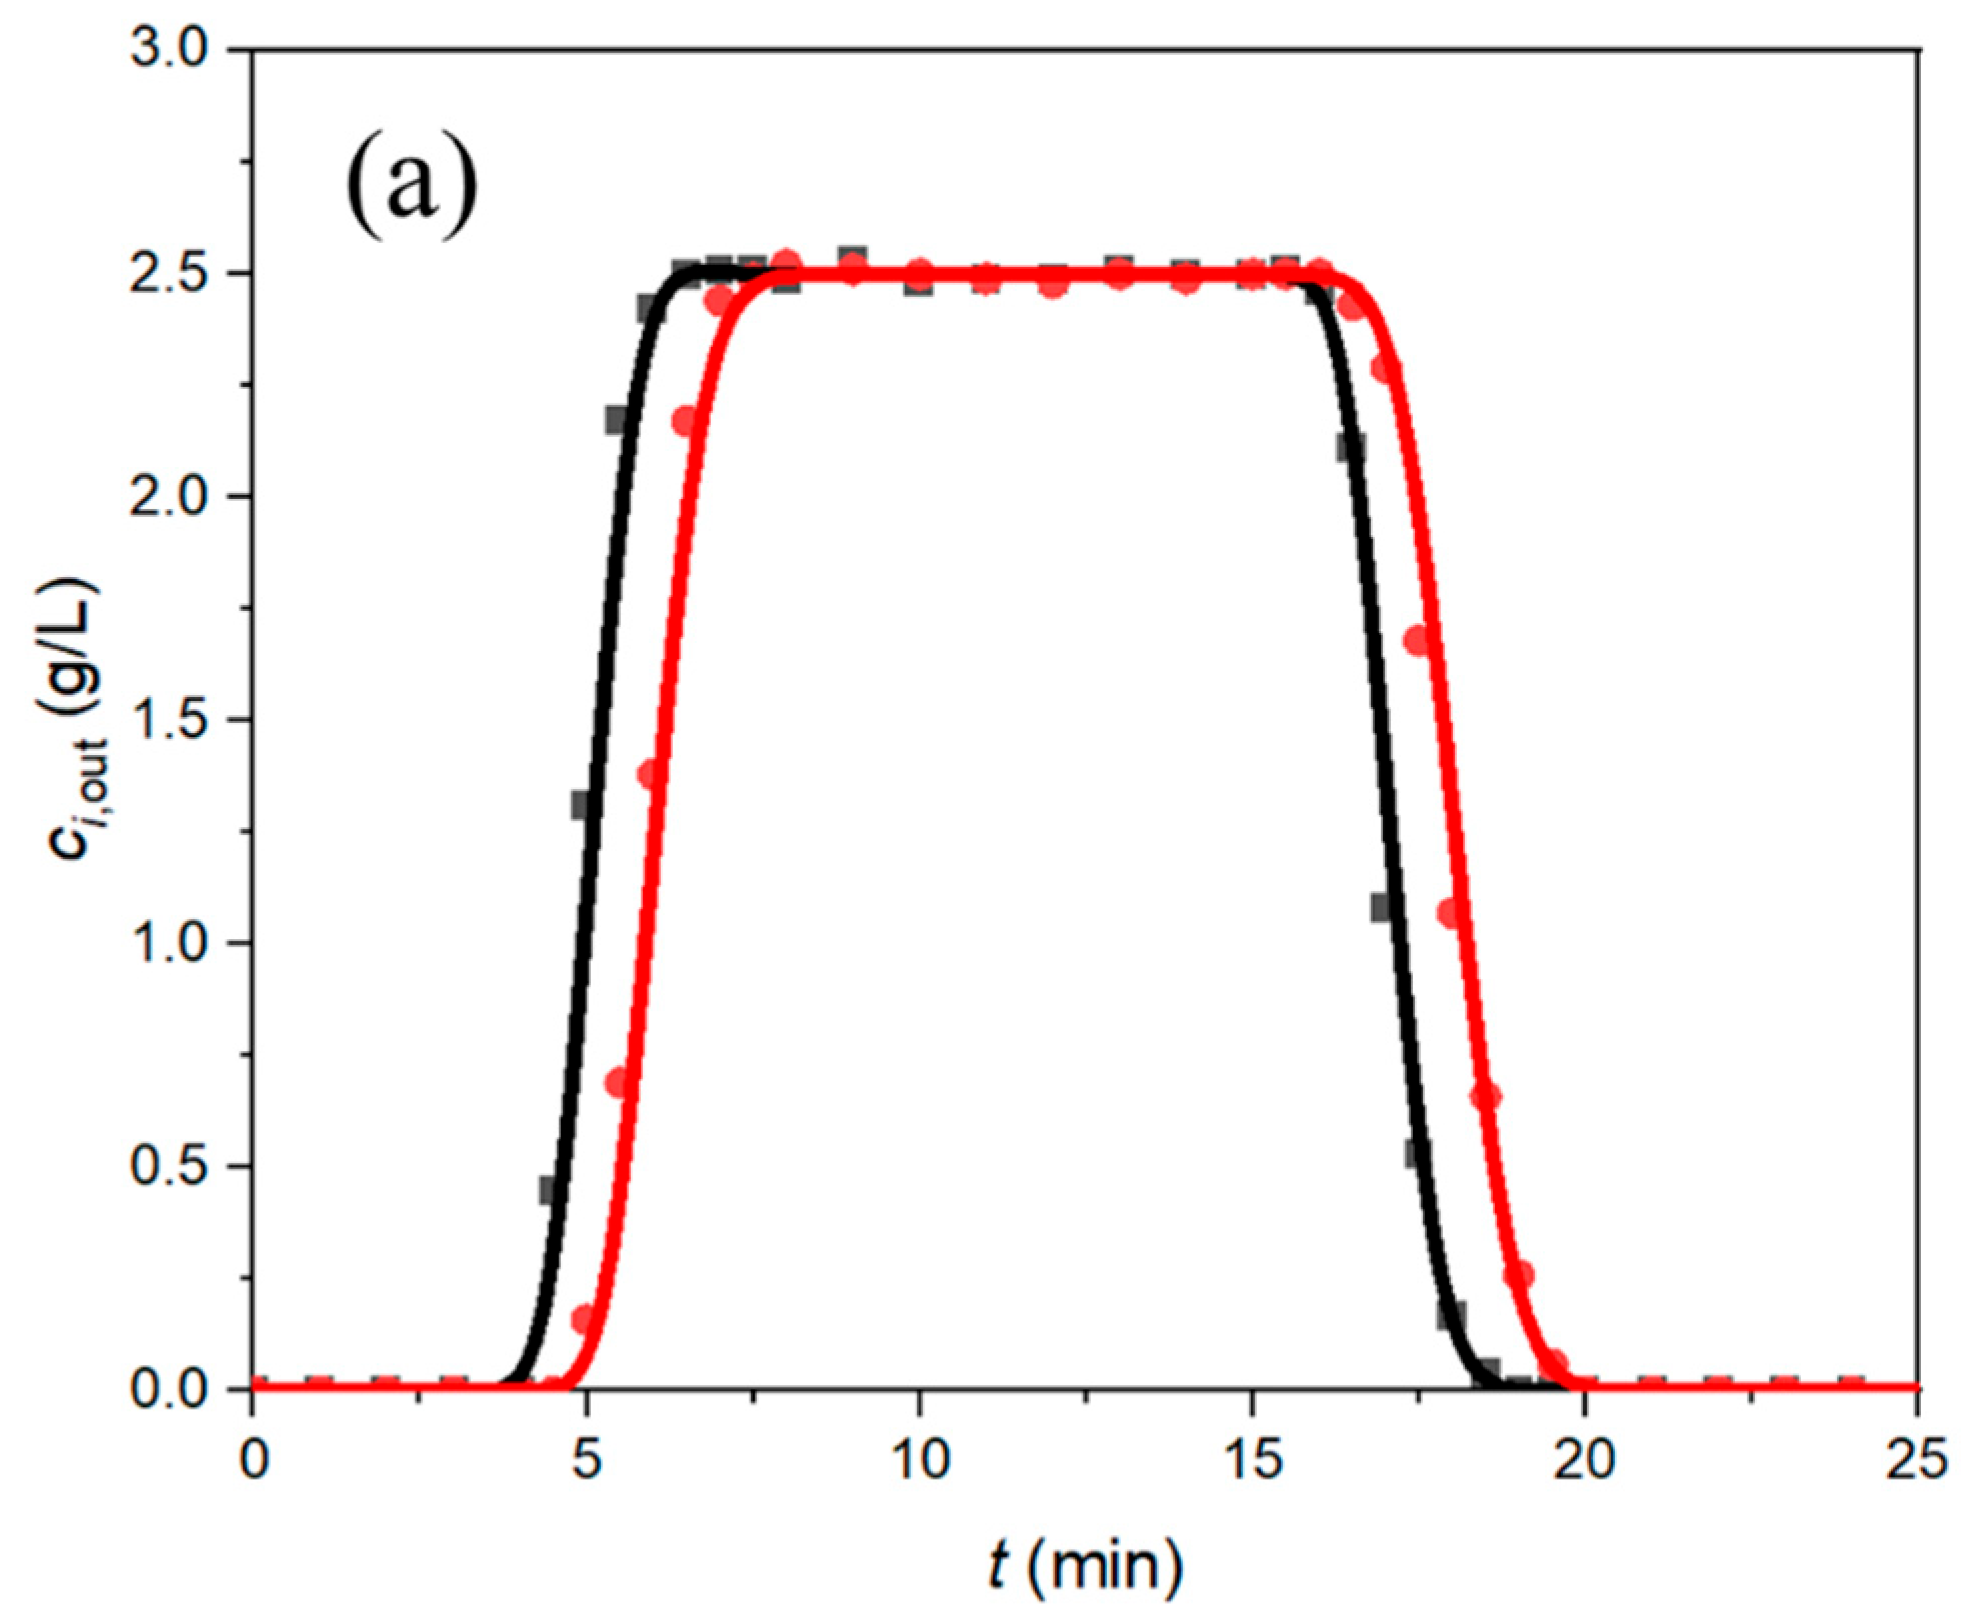
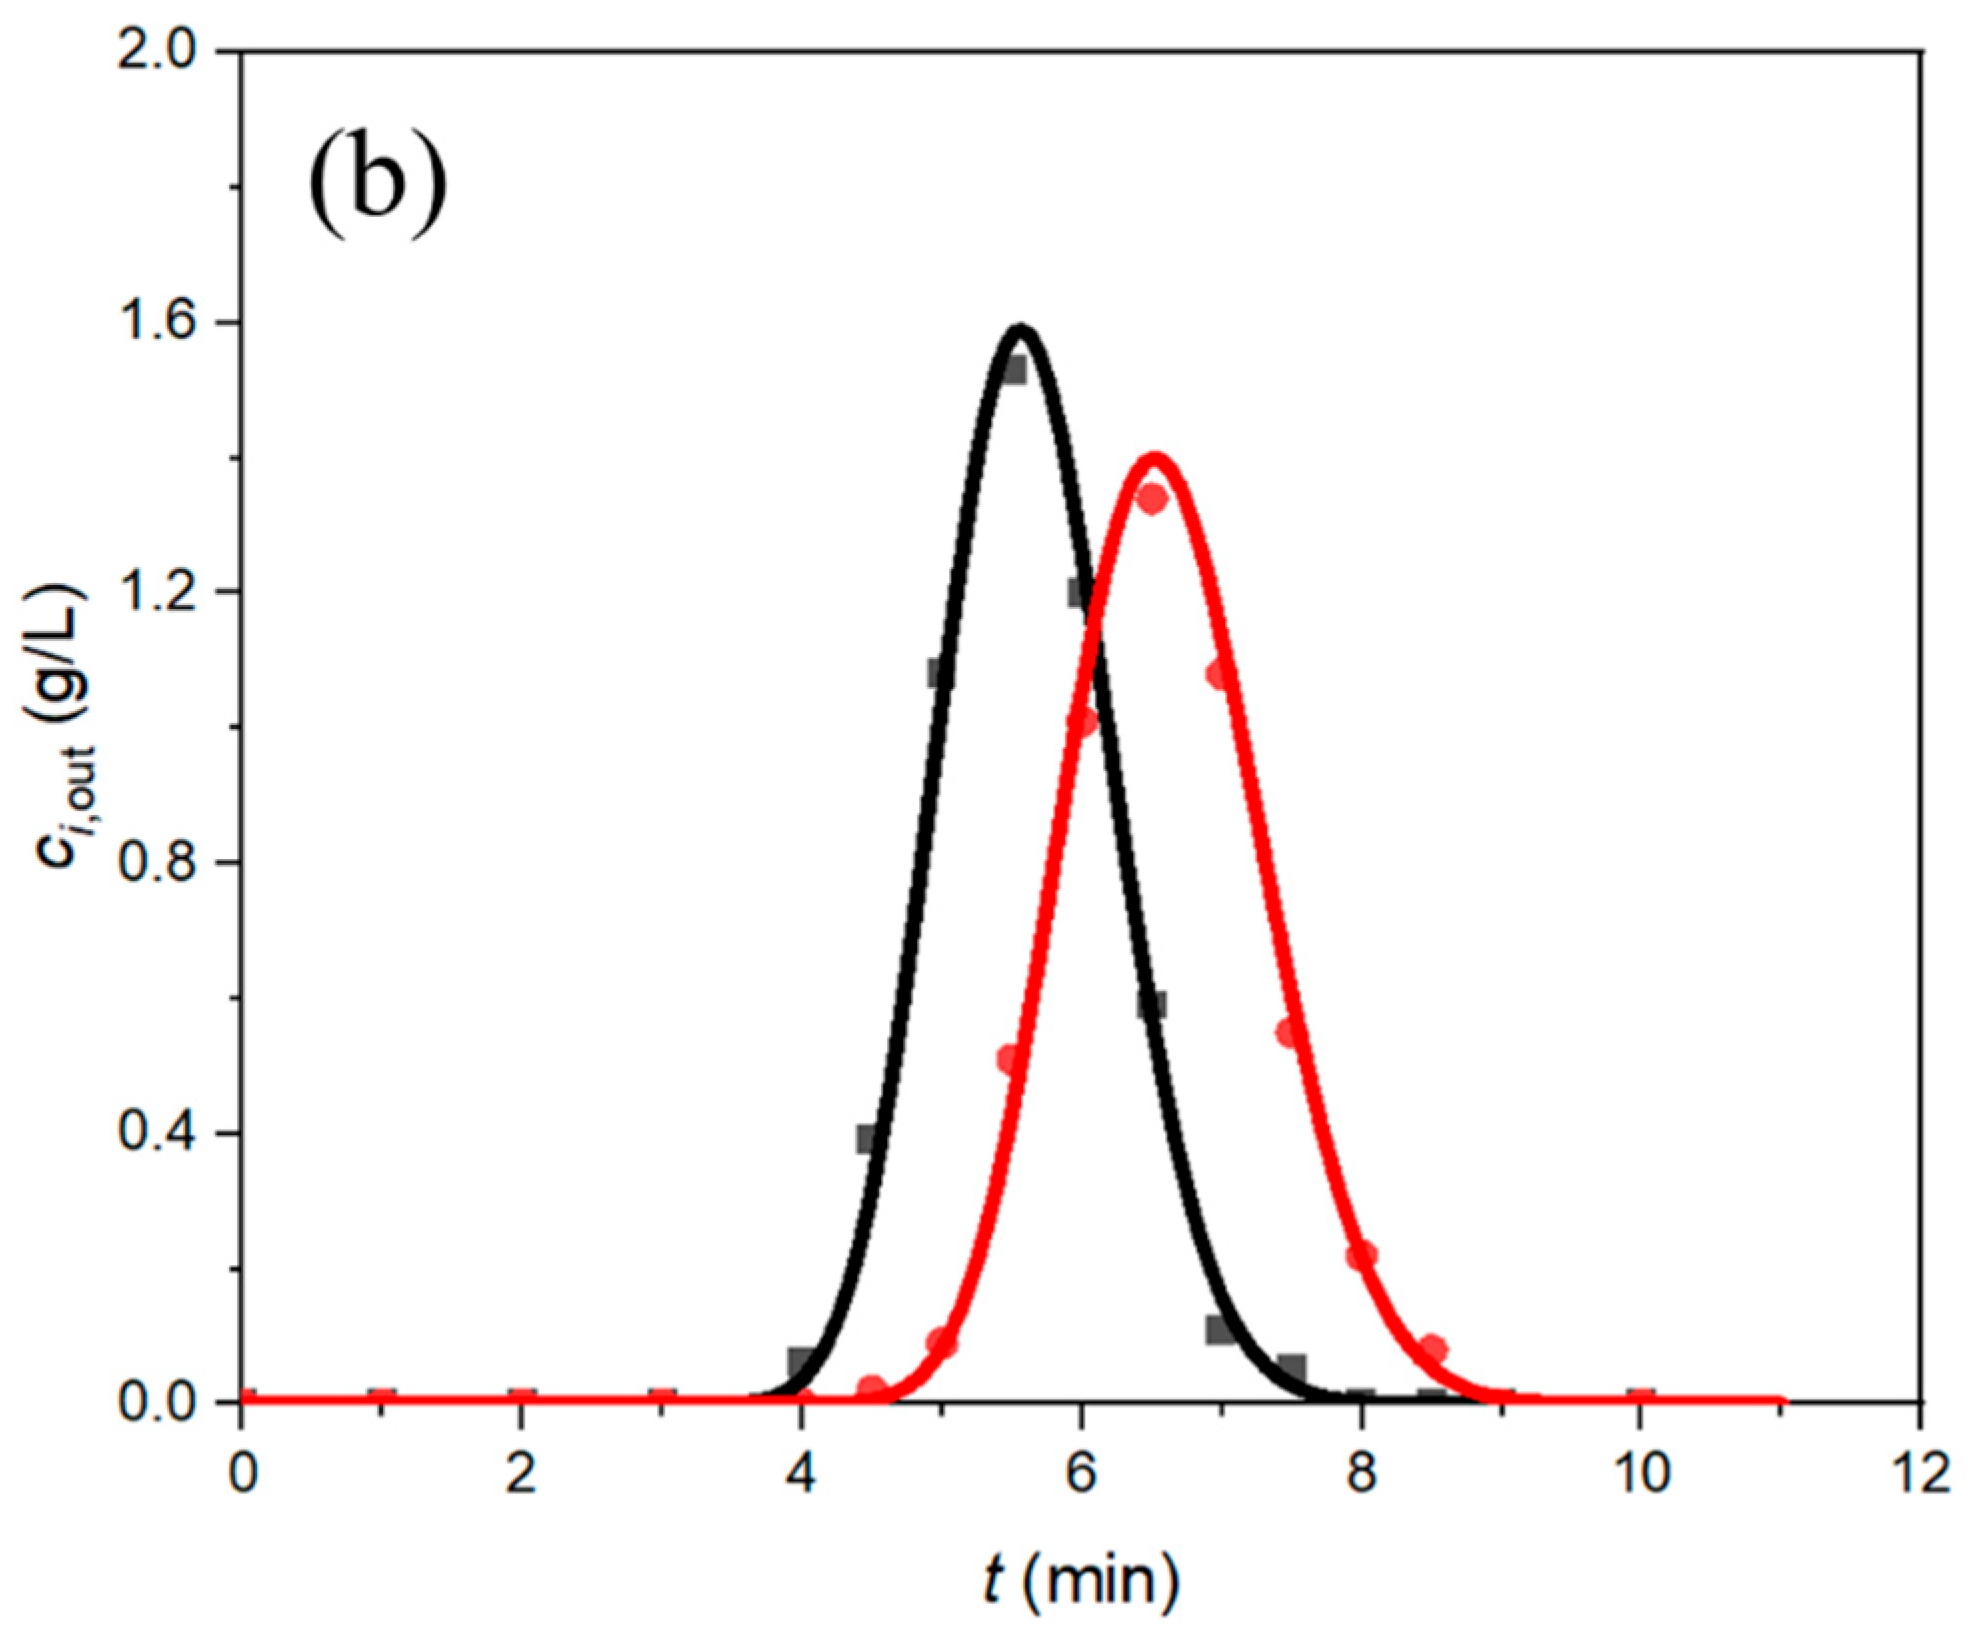
Single-column batch chromatography experiments, including frontal chromatography and elution chromatography, were performed to validate the mathematical model of the chromatographic process. The simulation results and experimental data of single-column chromatography are presented in Figure 8, demonstrating reasonable agreement between the mathematical model and the experimental curve. The overall mass transfer coefficient in the model was estimated to be 1.3 × 10⁻⁴ cm/s, since the predicted curve with this value can best fit the experimental data.
Pure d-menthol and l-menthol solutions can be obtained during 4.0–4.5 min and 19.0–19.5 min, respectively, in the frontal chromatography experiment, and can also be obtained during 4.0–4.5 min and 8.0–8.5 min, respectively, in the elution chromatography experiment. The results of the single-column batch chromatography experiments, including frontal chromatography and elution chromatography, reflect the potential of developing the SMB separation process for separation of menthol enantiomers by Chiralpak AD as the stationary phase.

4.4. SMB Design and Operation

4.4.1. SMB Design

The mathematical model was applied to design and optimize the SMB separation operating conditions. The parameters estimated in the previous sections—including competitive adsorption isotherm, adsorption kinetics, and hydrodynamics of the packed columns, as summarized in Table 3—were used to predict the separation performance. The values of mI and mIV were fixed at 2.44 and 1.22, respectively, as described previously. Column configuration of 1-2-2-1 was adopted. The effect of switching time, total feed concentration, and outlet purity requirement on the separation region was investigated.
Effect of Switching Time
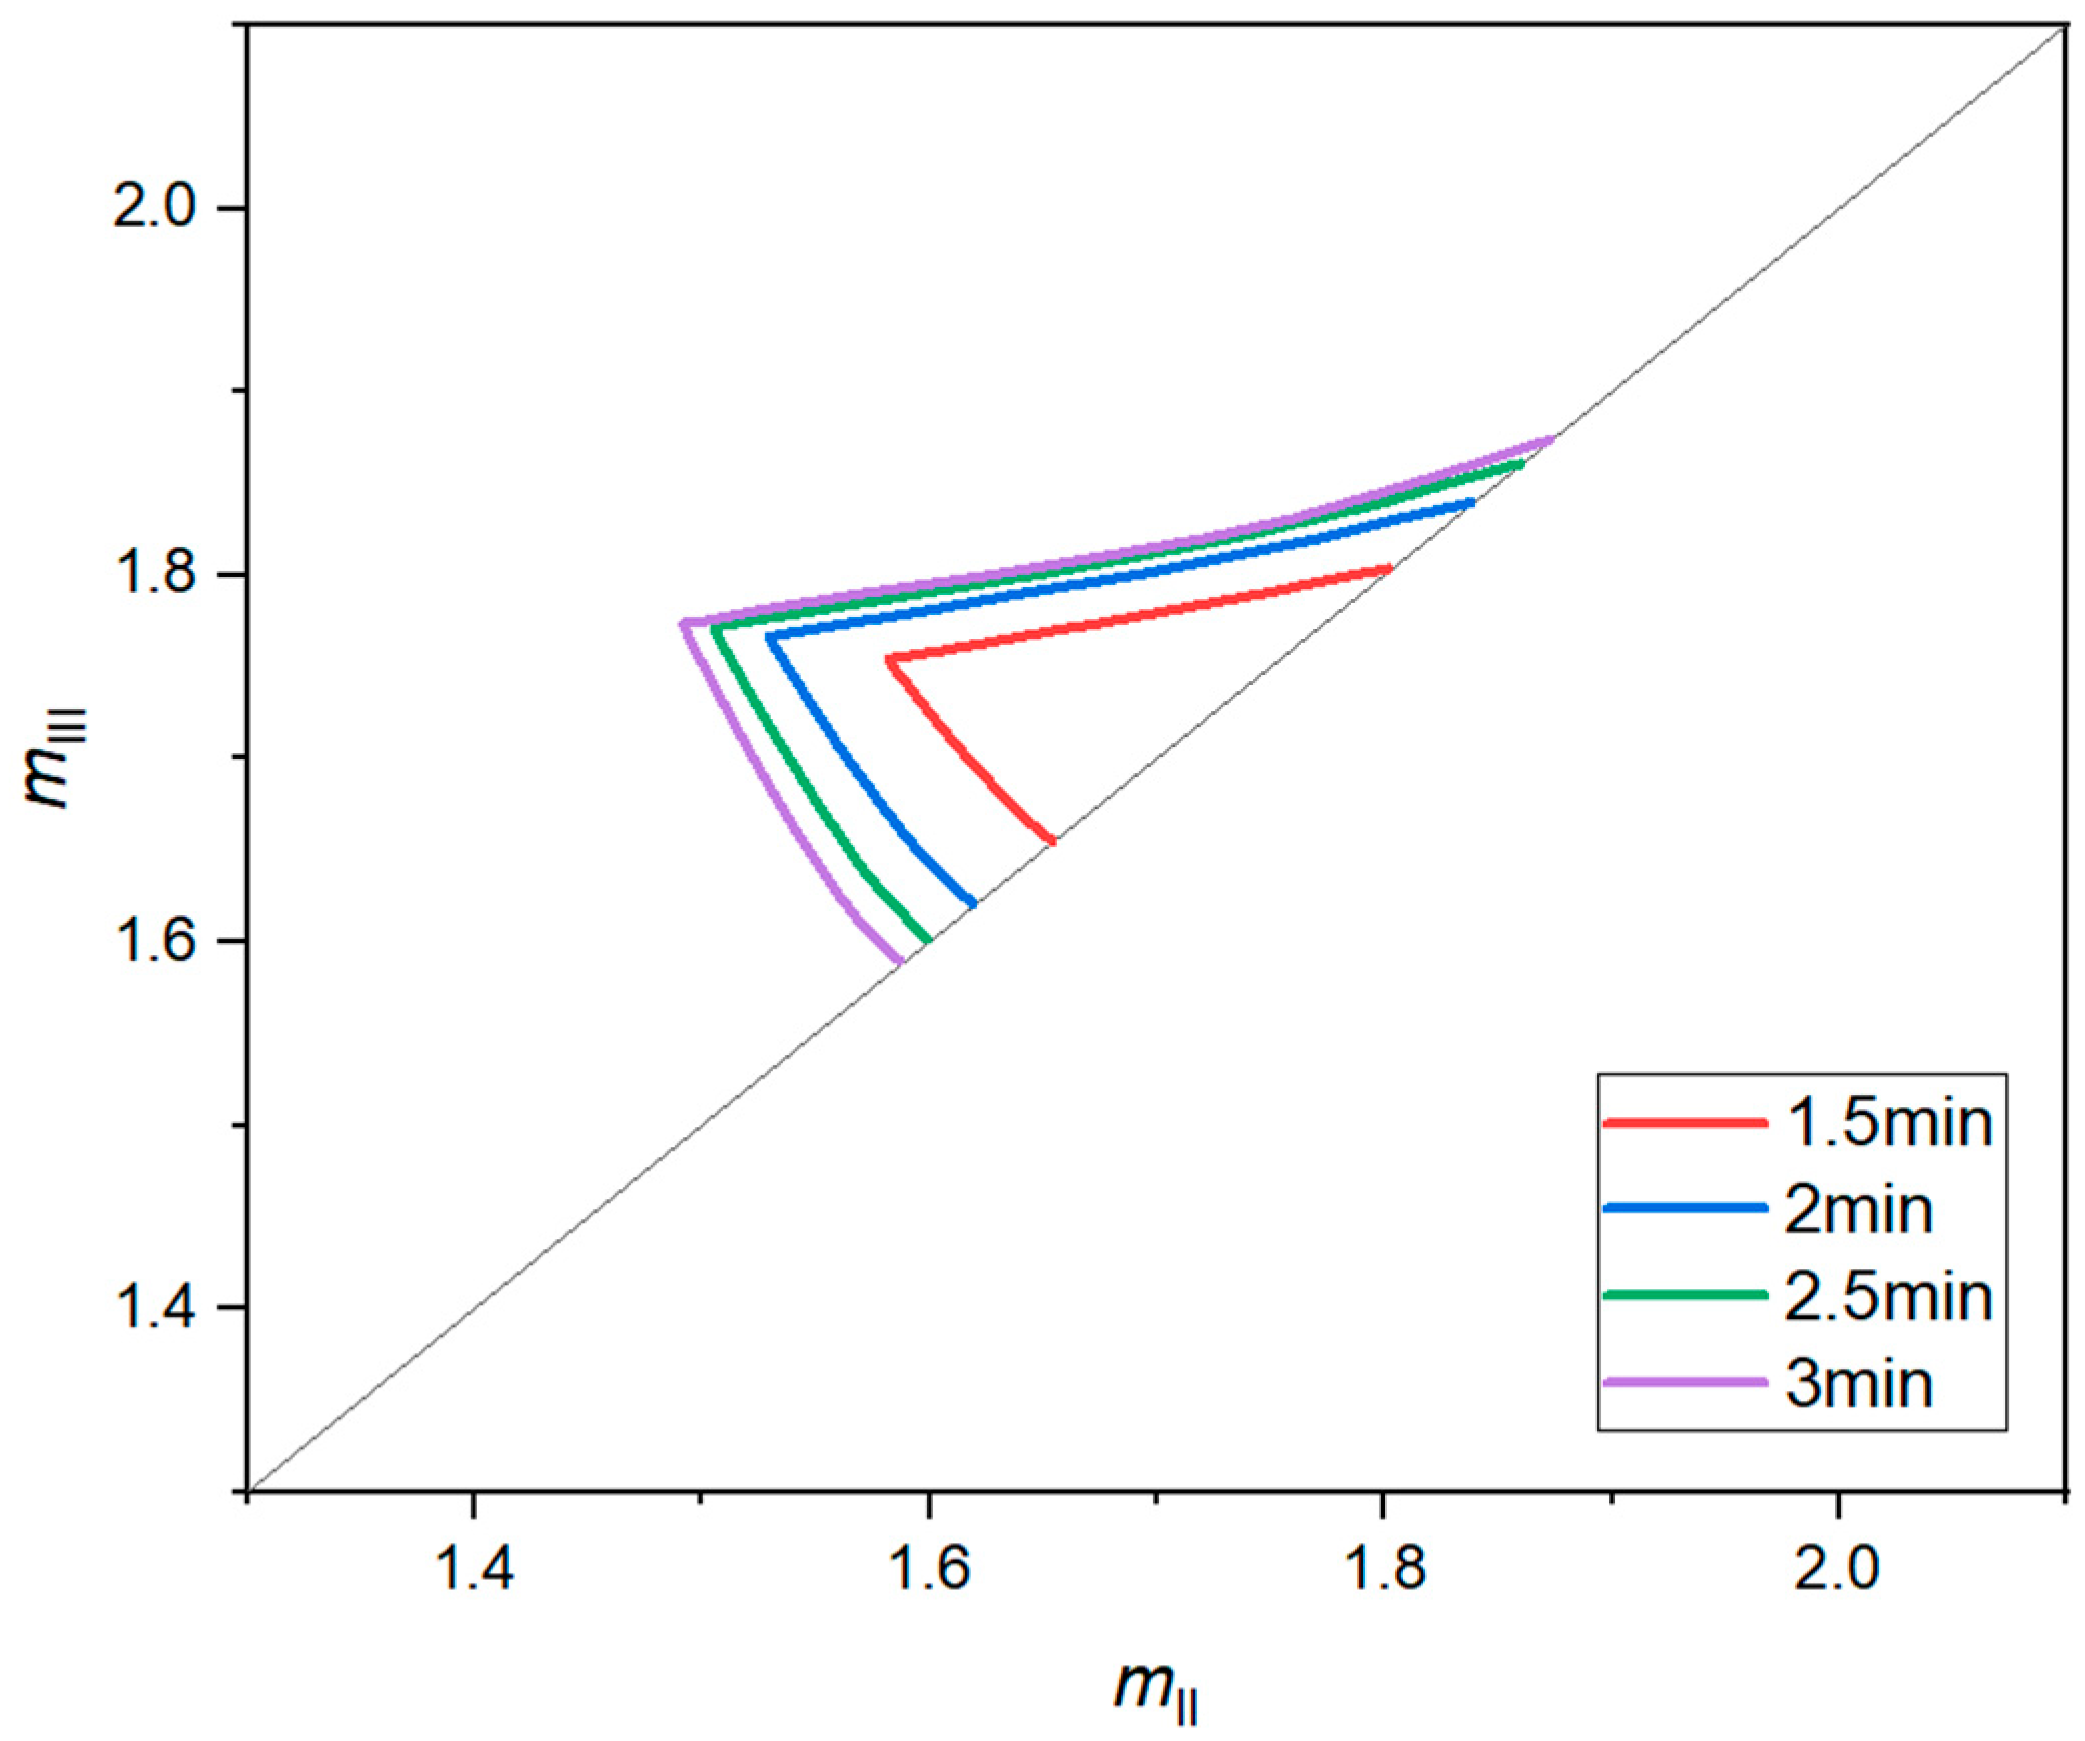
The total feed concentration was fixed at 20 g/L, and the separation region with different switching times was estimated by simulation, as illustrated in Figure 9.
The theoretical optimal operating point is located at the vertex of the operating region, because it allows the highest feed flow rate, and therefore, the highest productivity and lowest solvent consumption. To better compare the performance of the SMB process with different switching times, the productivity and solvent consumption at the theoretical optimal operating points were calculated, as listed in Table 4.
The simulation results show that with increased switching time, the solvent consumption at the theoretical optimized operating point decreases. When the switching time increases from 1.5 min to 2 min, the feed flow rate and productivity at the theoretical optimized operating point increase. These can be explained by the short retention time and, therefore, the low separation efficiency observed with frequent switching. However, when the switching time further increases to 3 min, the feed flow rate and productivity at the theoretical optimized operating point drop gradually, mainly due to the decreased flow rates in each zone. Considering both productivity and solvent consumption, 2 min was selected as the switching time in this work.
Effect of Total Feed Concentrations
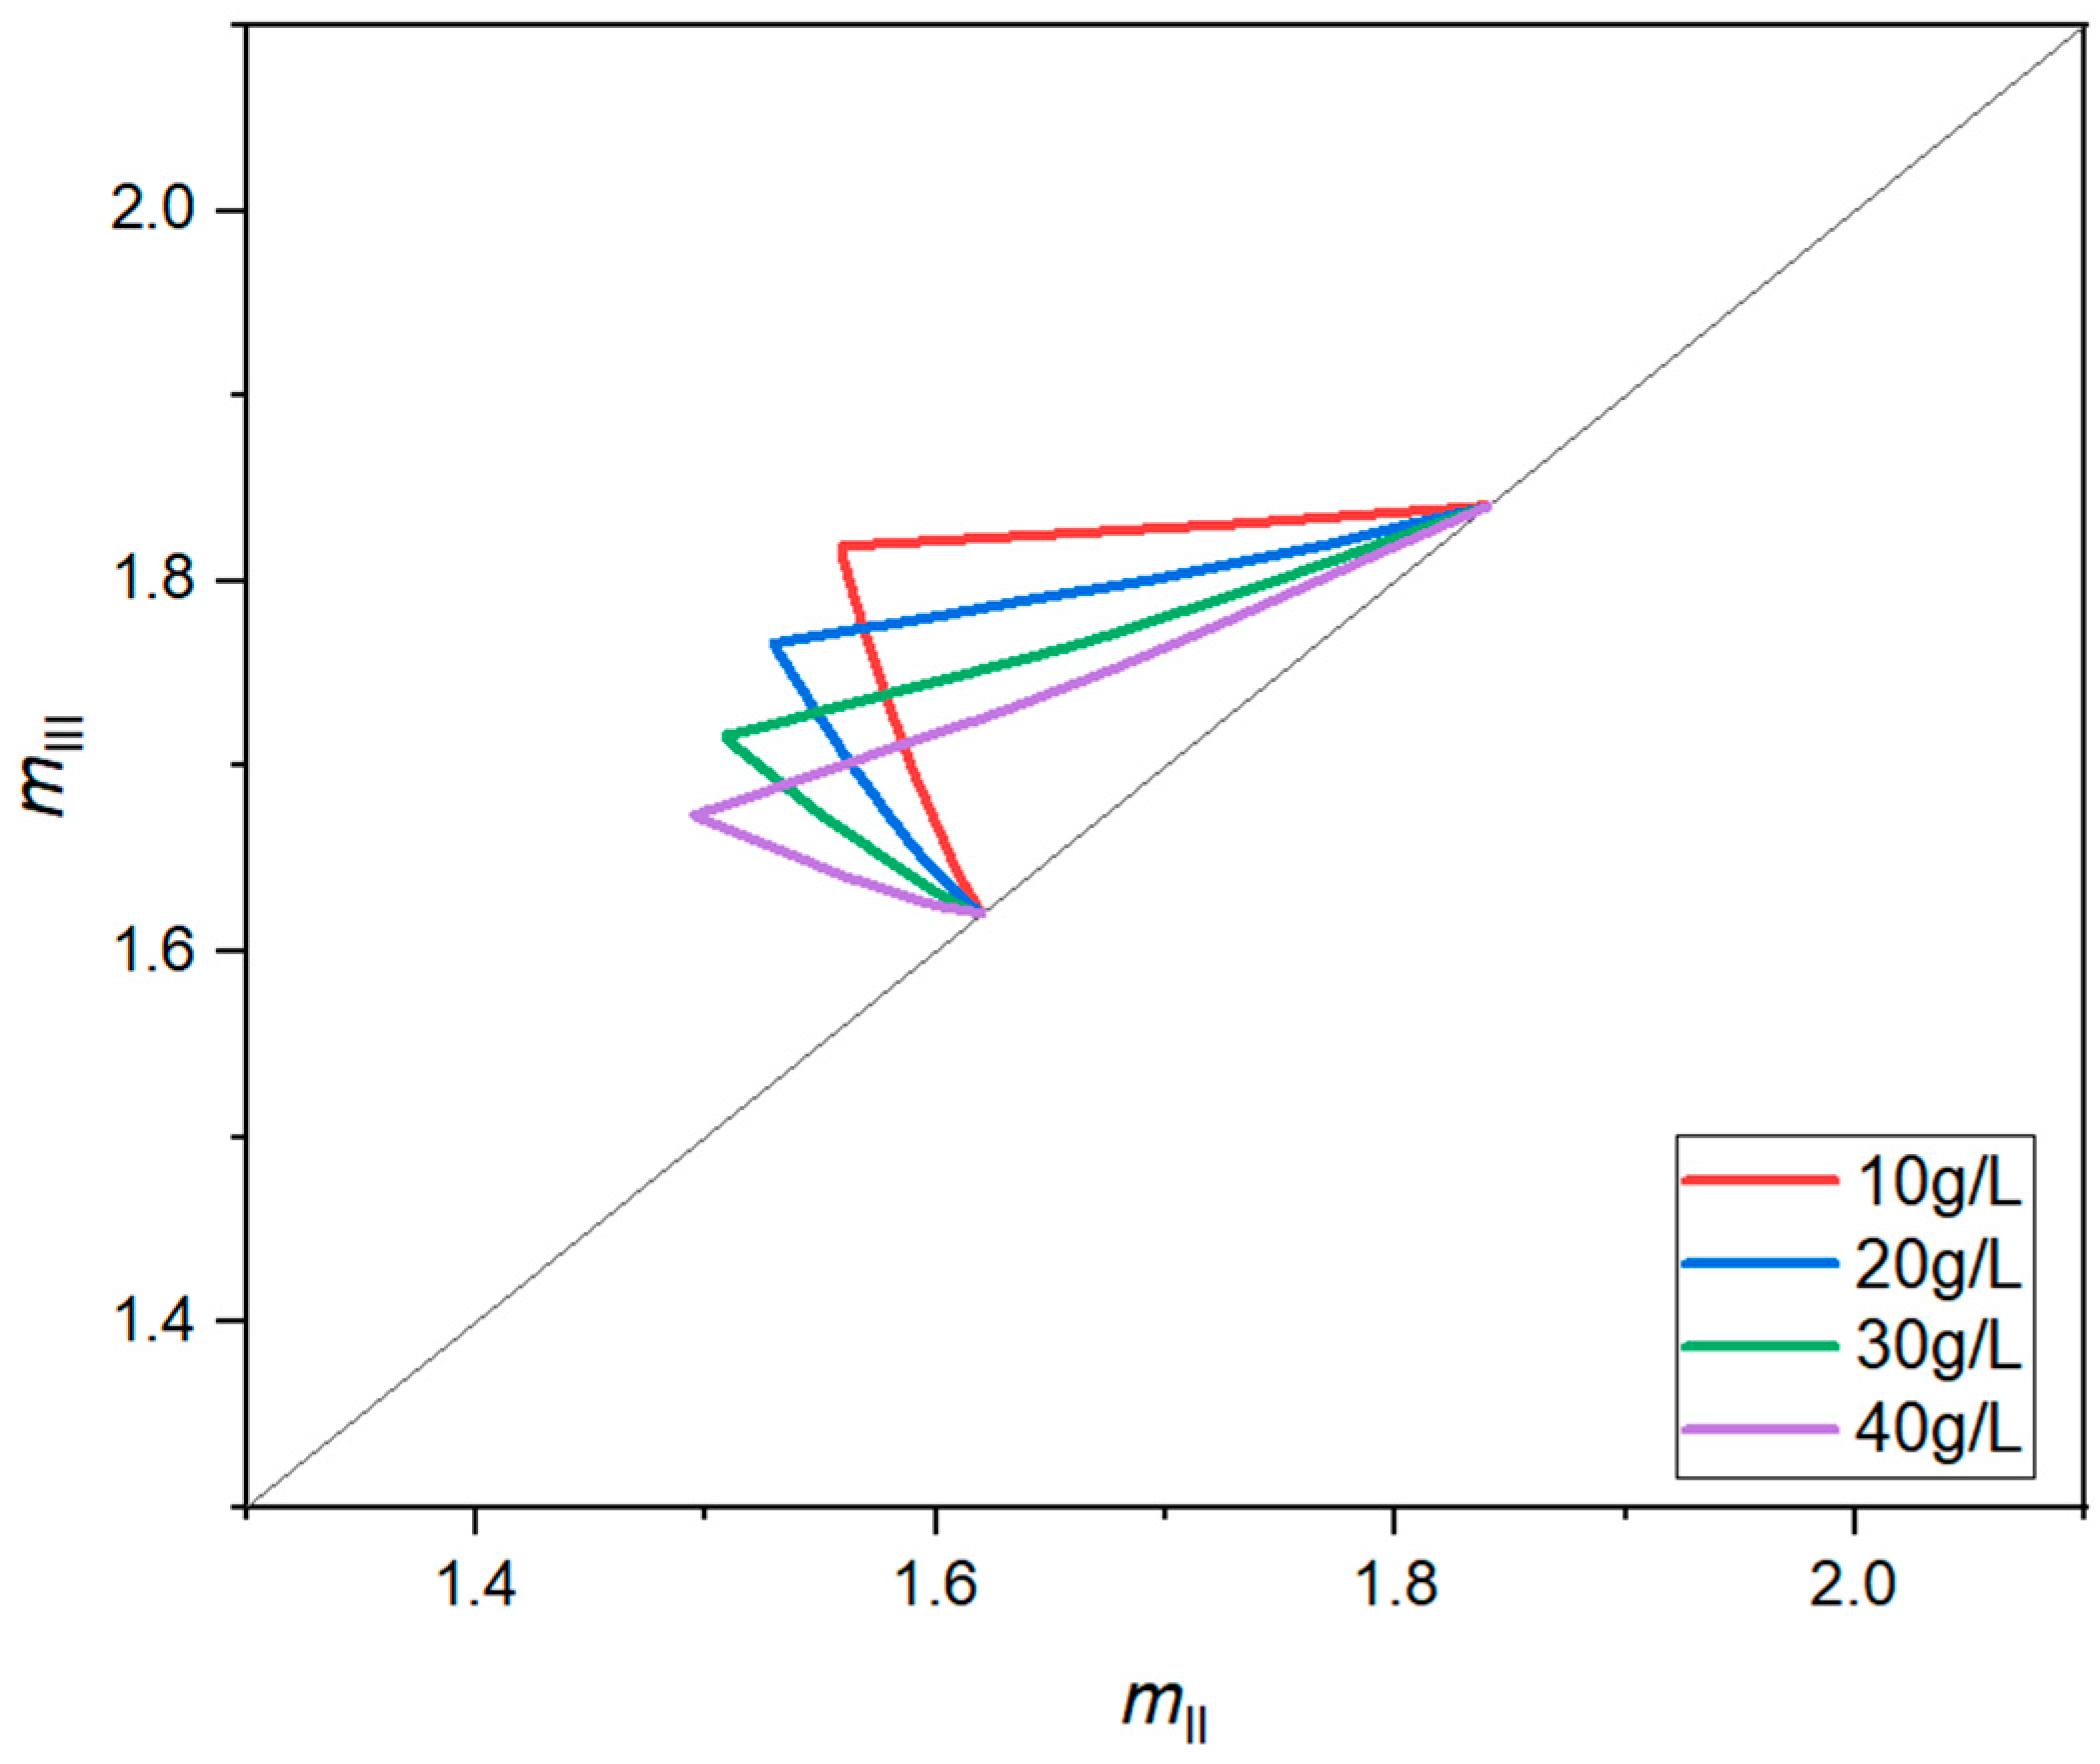
The separation region under purity requirements of 99.0% for both outlets with different total feed concentrations was estimated by simulation, as shown in Figure 10. The vertex point of the separation region moves to the lower-left corner as the feed concentration increases, which can be explained by the increased enantiomer propagation velocity with higher enantiomer concentrations due to the favorable adsorption characteristics [41]. The shifting of the vertex point, as well as the decrease in the adsorption selectivity, are responsible for the shrinkage of the separation region area of higher feed concentrations.
The productivity and solvent consumption of the theoretical optimal operating points with different total feed concentrations were calculated, as listed in Table 5. As the total feed concentrations increase at the theoretical optimized operating point, the productivity of the SMB unit rises gradually, and the solvent consumption decreases. However, with higher total feed concentrations, the feed flow rates decrease mainly due to the non-linear isotherm characteristic. Noting the possible fluctuation in the feed flow rate when the flow rate of the feed stream is low, 10 g/L–30 g/L is considered appropriate total feed concentrations. An amount of 20 g/L was selected as the total feed concentration in the SMB experiment.
Effect of Outlet Purity Requirements
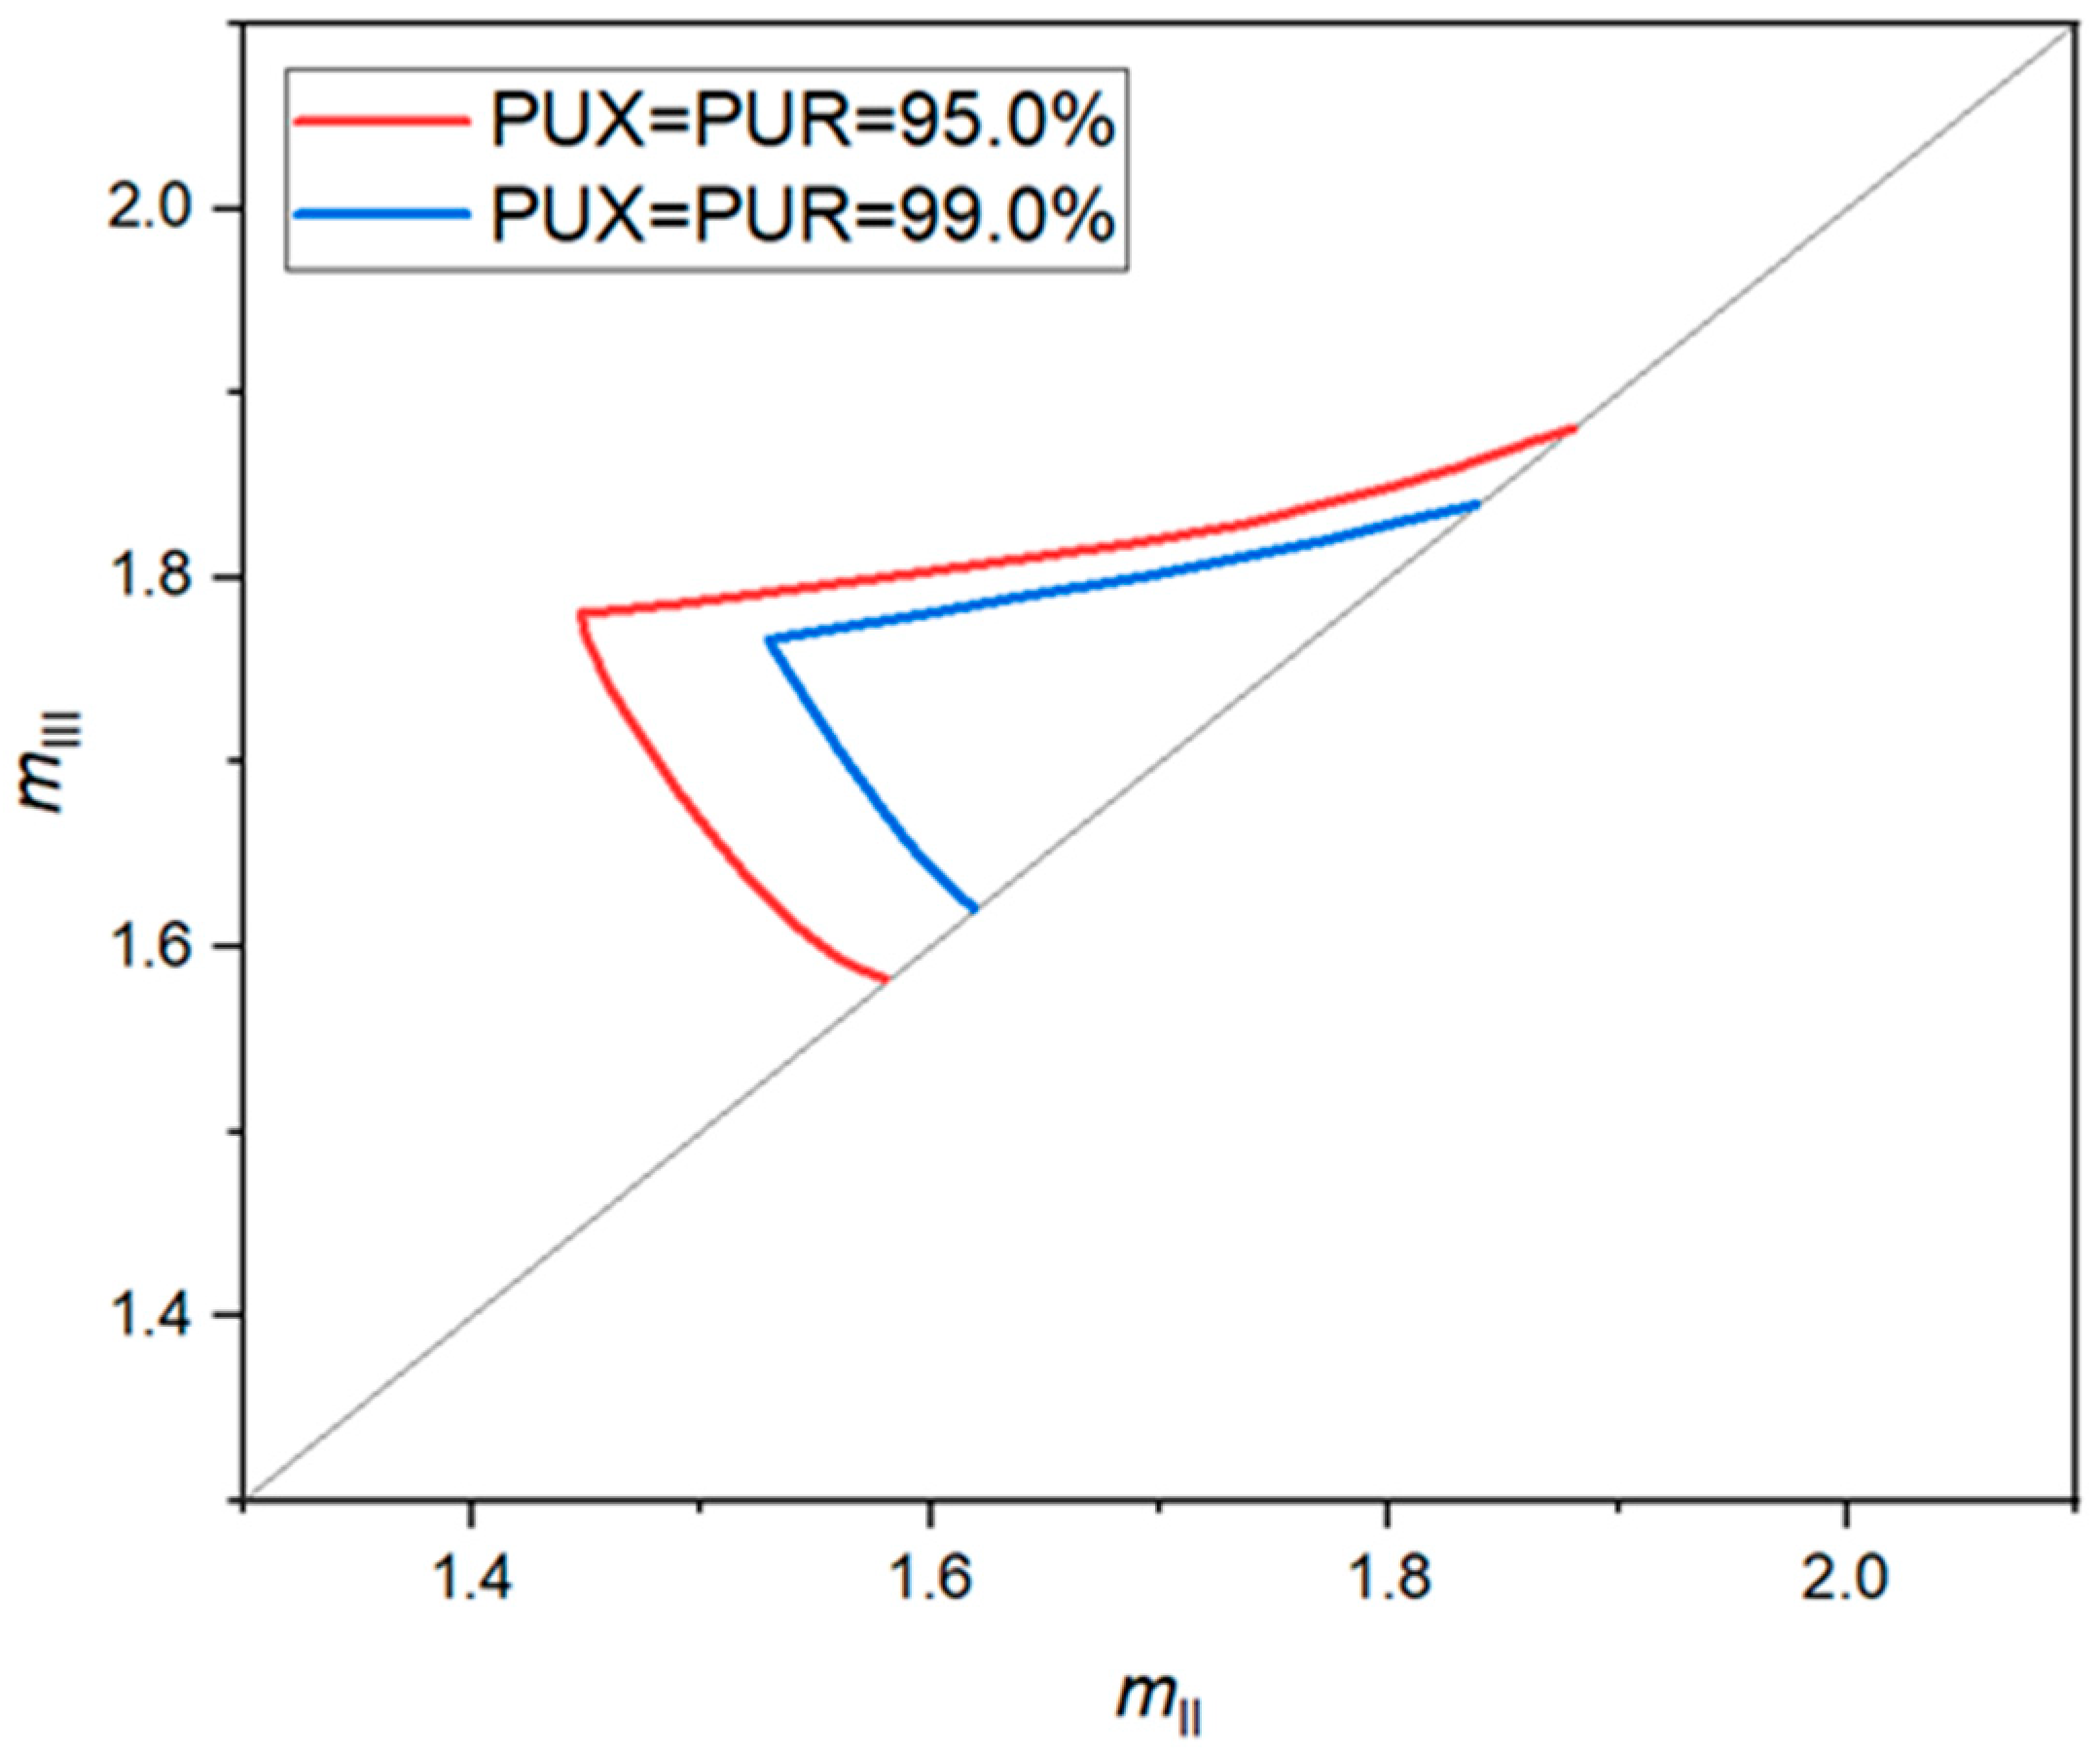
The separation region under different outlet purity requirements was estimated by simulation, as shown in Figure 11. The separation region area of 95.0% purity for both extract and raffinate is greater than the separation region area of 99.0% purity, since separation becomes harder with a more stringent purity target. The productivity and solvent consumption of the theoretical optimal operating points with different outlet purity requirements were calculated, as listed in Table 6, demonstrating higher productivity and lower solvent consumption for the 95.0% purity requirement. The purity requirement for both extract and raffinate were set at 99.0% in the SMB experiment, according to the typical purity of synthetic l-menthol product.

4.4.2. SMB Experiment

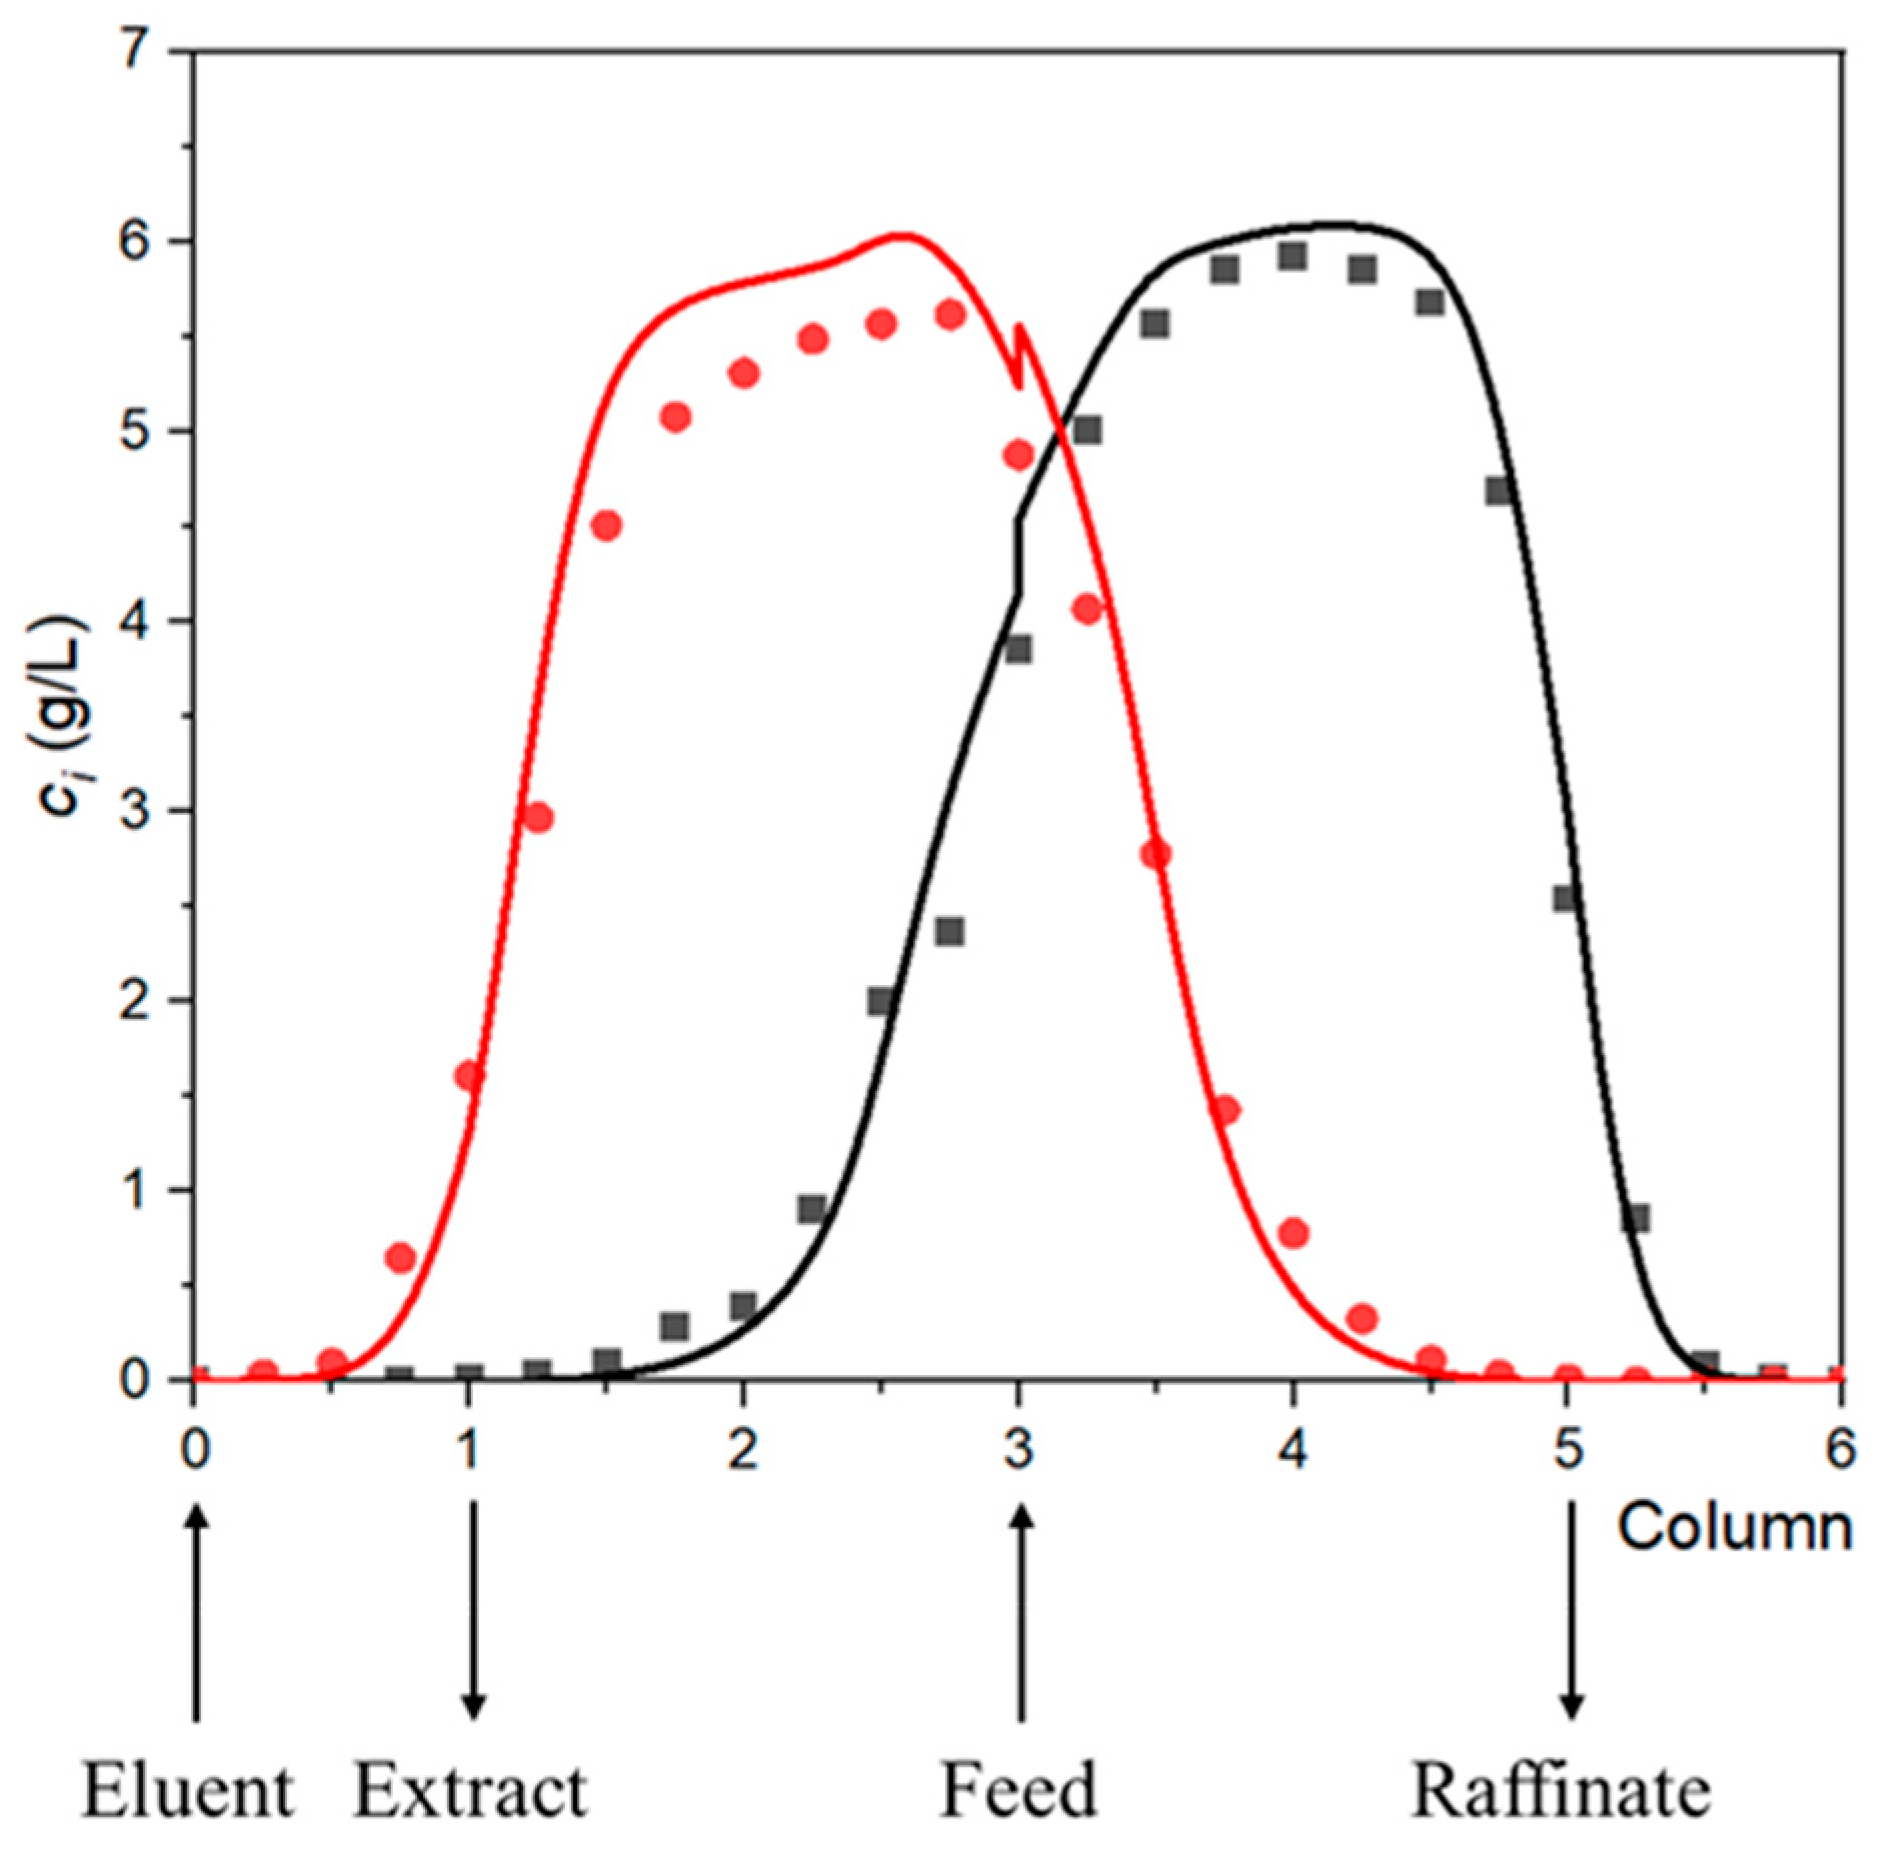
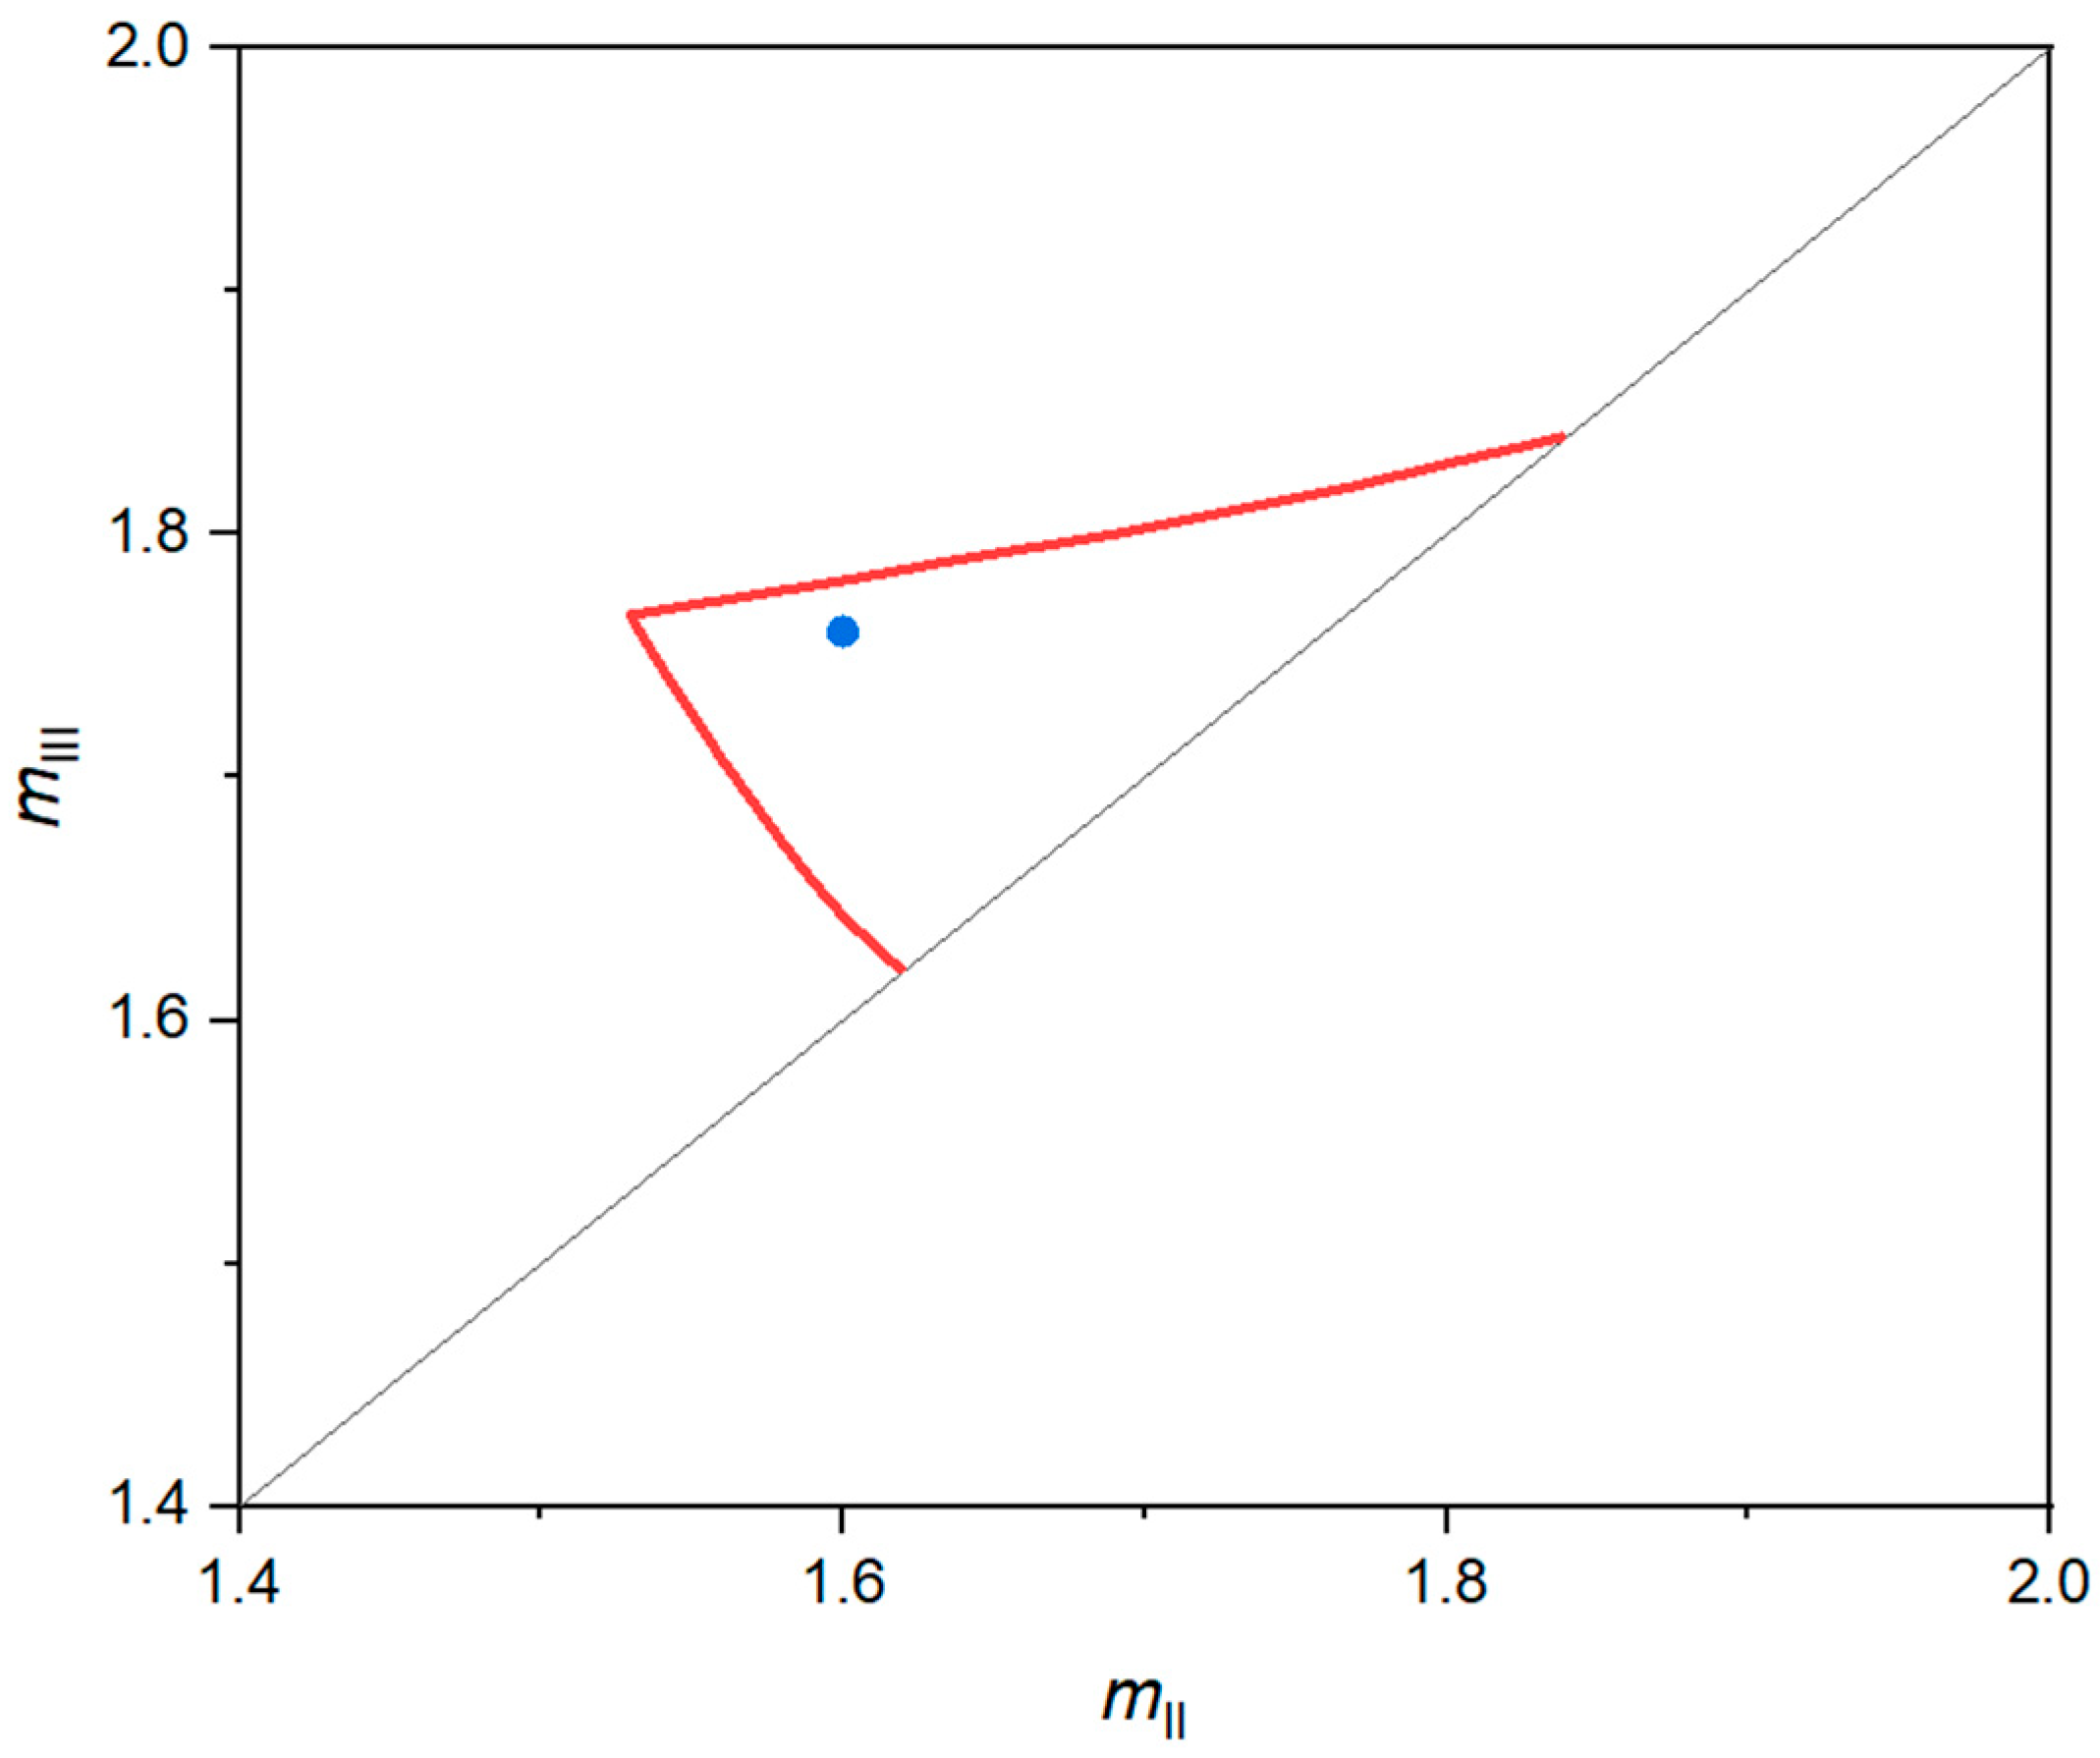
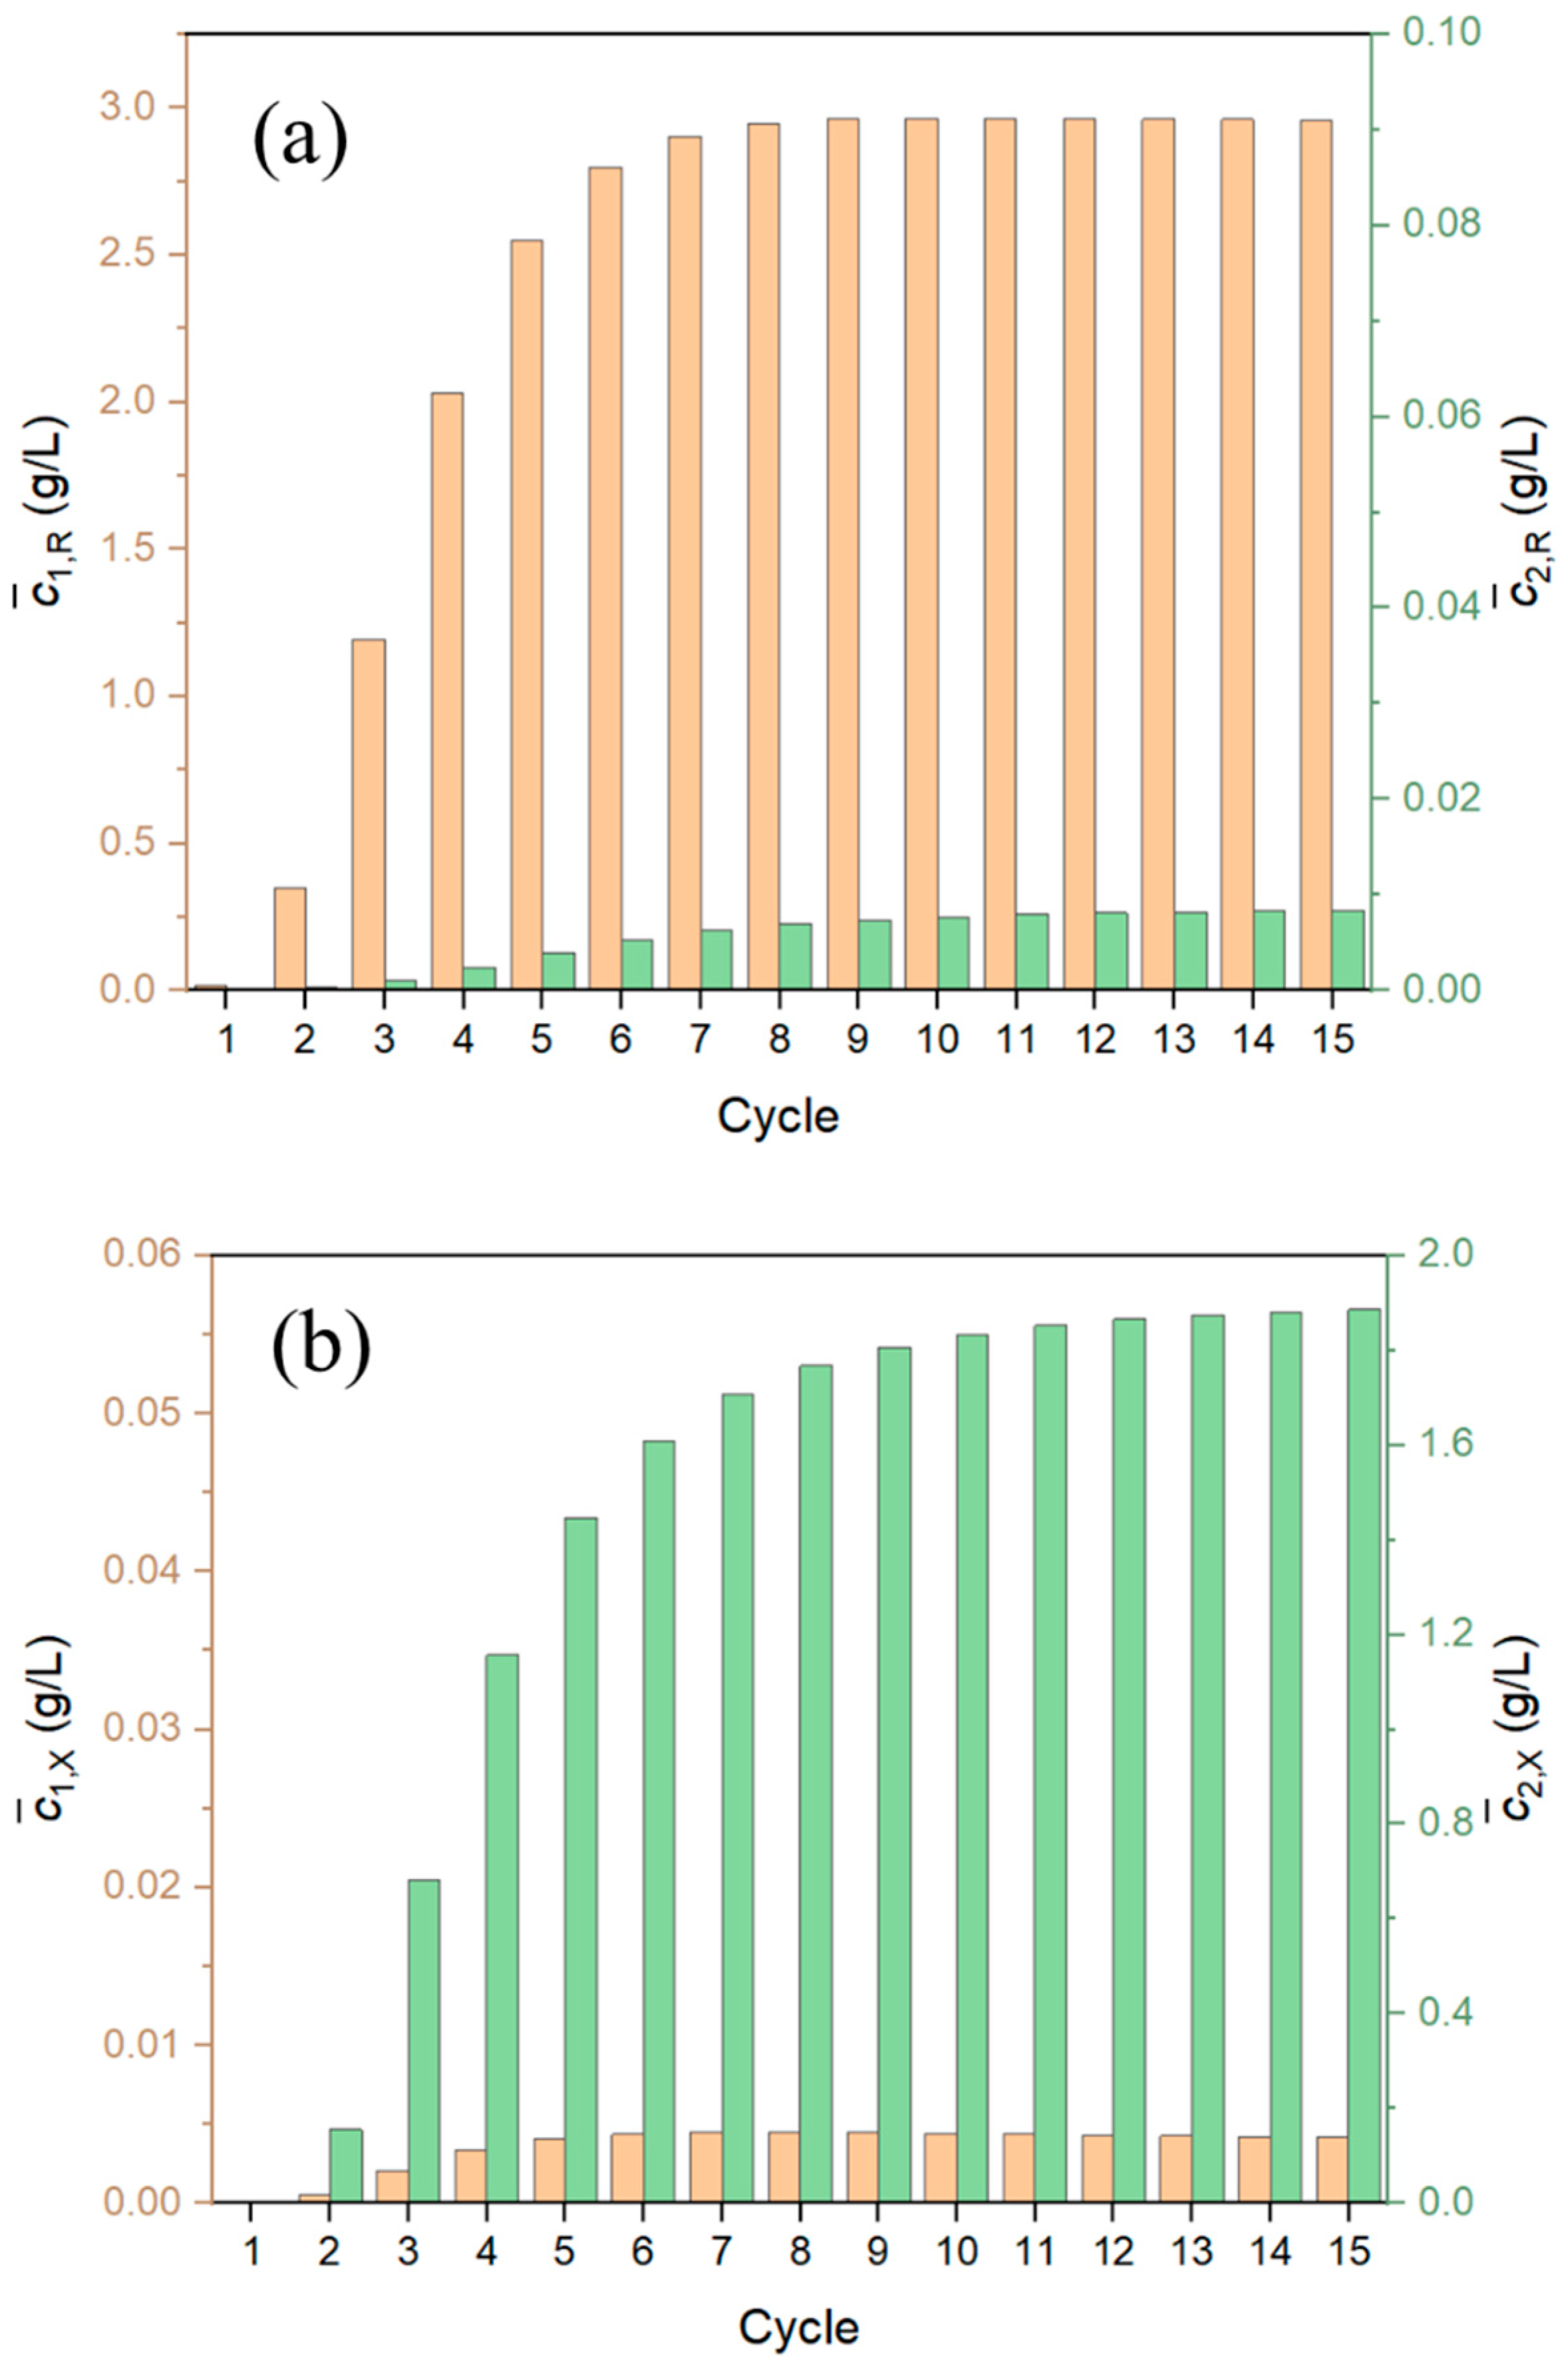
The SMB experiment for resolution of racemic menthol was performed using a VARICOL-Micro unit. A pair of (mII × mIII), located inside the separation region, was chosen as the operating conditions, as shown in Figure 12. The operating conditions are listed in Table 7. Cyclic steady state was reached after 15 SMB cycles of operation, and Figure 13 shows the evolution of simulated outlet-stream concentrations. Samples were taken every one-quarter of the switching time, with the six-way valve located at the recycling lines after the 15th cycle to obtain the internal concentration profile, and the time delay caused by the extra-column dead volume in the connecting lines was considered in the sampling time. Figure 14 shows the experimental and predicted internal concentration profiles at one-half of the switching time during cyclic steady state of the SMB experiment. Table 8 lists the experimental and simulated separation performances in the cyclic steady state. The simulated results match well with the experimental results. Purities for both the extract and raffinate are above 99.0%, and a productivity of 0.267 gracemate/(LCSP∙min) and a solvent consumption of 0.431 L/gracemate were achieved. Considering the possible ageing of the CSP, the long-term separation performance of the SMB unit will be evaluated based on a pilot device in our future work.

5. Conclusions

This work aims to develop a SMB separation process for the resolution of racemic menthol. Amylose 3,5-dimethylphenylcarbamate coated on silica gel was used as the chiral stationary phase, and n-hexane/isopropanol (95/5) was selected as the mobile phase. The hydrodynamic properties of the SMB columns were studied to minimize the packing asymmetry in the SMB experiment and estimate the bulk porosity and Peclet number. The binary adsorption isotherm of menthol enantiomers on the stationary phase was measured by the adsorption–desorption method and fitted to a Modified linear + Langmuir Model, and the mass transfer coefficient was evaluated by fixed-bed batch chromatography. Mathematical models were developed using these parameters to describe the dynamics of the chromatographic separation process. The SMB process for chiral separation of racemic menthol was designed by evaluating the separation region using simulations. Reasonable agreements are achieved between the predicted results and the experimental results in the SMB experiment. Purities for both the extract and raffinate are above 99.0%, and a productivity of 0.267 gracemate/(LCSP∙min) and a solvent consumption of 0.431 L/gracemate were achieved. This work provides an alternative approach for chiral separation of menthol enantiomers, and the mathematical model offers reliable foundations for the future design, scaling-up, and optimization of the SMB process.

Author Contributions

Conceptualization, L.S. and J.Y.; Methodology, L.S.; Software, L.S.; Validation, L.S. and Y.Y.; Formal Analysis, L.S.; Investigation, L.S.; Resources, Y.Y. and J.Y.; Data Curation, L.S.; Writing—Original Draft Preparation, L.S.; Writing—Review and Editing, Y.Y. and J.Y.; Visualization, L.S.; Supervision, Y.Y. and J.Y.; Project Administration, J.Y.; Funding Acquisition, J.Y. All authors have read and agreed to the published version of the manuscript.

Funding

This work was funded by the National Key R&D Program of China [2023YFB4104000], the Key Research and Development Program of Jiang-xi Province [20223BBG74008], and ECUST-Jinghao Salt Chemical Carbon and Calcium Cycles Joint Research Centre.

Data Availability Statement

Data is contained within the article.

Conflicts of Interest

The authors declare no conflicts of interest.

Nomenclature

b Langmuir parameter (L/g)
c Liquid-phase concentration (g/L)
c d Desorption solution concentration (g/L)
d C Column diameter
d p Particle diameter of the chiral stationary phase (μm)
D a x Axial dispersion coefficient (cm2/s)
E t r Residence-time distribution density function
f c 1 , c 2 Adsorption equilibrium function
H Henry constant (dimensionless)
K Overall mass transfer coefficient (cm/s)
L Column length (cm)
m Flow rate ratio of the liquid phase and solid phase in TMB process (dimensionless)
M Total concentration level of single enantiomer measured for competitive isotherm (dimensionless)
N Parameter number in adsorption isotherm models (dimensionless)
N C Total column number (dimensionless)
p Pressure (bar)
P e Peclet number (dimensionless)
P R Productivity (gracemate/(LCSP∙min))
P U R Purity in raffinate stream (dimensionless)
P U X Purity in extract stream (dimensionless)
q Solid-phase concentration (g/L)
q * Solid-phase concentration equilibrium with the liquid-phase concentration (g/L)
Q Liquid flow rate in SMB columns (mL/min)
Q m a x Langmuir parameter (g/L)
Q s Solid-phase flow rate in TMB process (mL/min)
Q T M B Liquid-phase flow rate in TMB process (mL/min)
S C Solvent consumption (L/gracemate)
S D Standard deviations (g/L)
S Q Sum of square of the residues (g2/L2)
t Time (min)
t E D Extra-column dead time (min)
t r Retention time (min)
t s Switching time in SMB process (min)
u Superficial velocity (cm/s)
V C Column volume (mL)
V d Volume of the desorption solution (mL)
V E D Extra-column dead volume (mL)
z Axial position (cm)
Subscripts
DEluent stream
EExperimental value
FFeed stream
i Component in the racemate ( i = 1, 2)
i n Inlet position
j Zone number ( j = I, II, III, IV)
k Column number ( k   =   1 ,   2 ,   ,   N C )
l Concentration level in measurement of binary adsorption isotherm
M Model predicted value
outOutlet position
RRaffinate stream
TTotal solute or total void
TTBB1,3,5-tri-tert-butylbenzene
XExtract stream
Greek Symbols
β Safety factor (dimensionless)
ε Bed porosity (dimensionless)
μ Viscosity (mPa∙s)
σ 2 Variance of the residence-time distribution (min2)

References

  1. Hughes, P. Flavors (Bittering Agents, Astringent Flavors, Pungency, Menthol). In Encyclopedia of Food Chemistry; Elsevier: Amsterdam, The Netherlands, 2019; pp. 104–108. ISBN 978-0-12-814045-1. [Google Scholar]
  2. Dylong, D.; Hausoul, P.J.C.; Palkovits, R.; Eisenacher, M. Synthesis of (−)-menthol: Industrial Synthesis Routes and Recent Development. Flavour Frag. J. 2022, 37, 195–209. [Google Scholar] [CrossRef]
  3. Kuhn, W.; Funk, H.-U.; Senft, G.; Korber, K.A. Method for Producing Menthol. U.S. Patent US2006167322A1, 27 July 2006. [Google Scholar]
  4. Fleischer, J.; Bauer, K.; Hopp, R. Separating Optically Pure d- and l- Isomers of Menthol, Neomenthol and Isomenthol. U.S. Patent US3943181A, 9 March 1976. [Google Scholar]
  5. Yu, L.J.; Xu, Y.; Wang, X.Q.; Yu, X.W. Highly Enantioselective Hydrolysis of Dl-Menthyl Acetate to l-Menthol by Whole-Cell Lipase from Burkholderia Cepacia ATCC 25416. J. Mol. Catal. B—Enzym. 2007, 47, 149–154. [Google Scholar] [CrossRef]
  6. Li, M.; Yang, L.R.; Xu, G.; Wu, J.P. Highly Diastereoselective Acylation of L-Menthol by a Lipase from Stenotrophomonas Maltophilia CGMCC 4254. Biochem. Eng. J. 2016, 109, 81–87. [Google Scholar] [CrossRef]
  7. Bai, S.; Guo, Z.; Liu, W.; Sun, Y. Resolution of (±)-Menthol by Immobilized Candida Rugosa Lipase on Superparamagnetic Nanoparticles. Food Chem. 2006, 96, 1–7. [Google Scholar] [CrossRef]
  8. Sun, J.; Ding, C.; Zheng, J.Y.; Yu, X.J.; Zhao, M.; Wang, Z. Improved Enantioselective Esterification of Dl-Menthol Catalyzed by Immobilized TL 100L Lipase. J. Mol. Catal. B-Enzym. 2016, 133, S271–S276. [Google Scholar] [CrossRef]
  9. Sá Gomes, P.; Rodrigues, A.E. Simulated Moving Bed Chromatography: From Concept to Proof-of-Concept. Chem. Eng. Technol. 2012, 35, 17–34. [Google Scholar] [CrossRef]
  10. Sá Gomes, P.; Minceva, M.; Rodrigues, A.E. Simulated Moving Bed Technology: Old and New. Adsorpt.-J. Int. Adsorpt. Soc. 2006, 12, 375–392. [Google Scholar] [CrossRef]
  11. Azevedo, D.C.S.; Rodrigues, A.E. Fructose–Glucose Separation in a SMB Pilot Unit: Modeling, Simulation, Design, and Operation. AICHE J. 2001, 47, 2042–2051. [Google Scholar] [CrossRef]
  12. Subramani, H.J.; Hidajat, K.; Ray, A.K. Optimization of Simulated Moving Bed and Varicol Processes for Glucose–Fructose Separation. Chem. Eng. Res. Des. 2003, 81, 549–567. [Google Scholar] [CrossRef]
  13. Paredes, G.; Mazzotti, M.; Stadler, J.; Makart, S.; Morbidelli, M. SMB Operation for Three-Fraction Separations: Purification of Plasmid DNA. Adsorpt.-J. Int. Adsorpt. Soc. 2005, 11, 841–845. [Google Scholar] [CrossRef]
  14. Borges da Silva, E.A.; Pedruzzi, I.; Rodrigues, A.E. Simulated Moving Bed Technology to Improve the Yield of the Biotechnological Production of Lactobionic Acid and Sorbitol. Adsorpt.-J. Int. Adsorpt. Soc. 2011, 17, 145–158. [Google Scholar] [CrossRef]
  15. Ray, N.; Ray, A. Multi-Objective Optimisation of Biodiesel Synthesis in Simulated Moving Bed Reactor. Separations 2021, 8, 127. [Google Scholar] [CrossRef]
  16. Santos, R.; Rebello, C.; Prudente, A.; Ribeiro, A.M.; Rodrigues, A.E.; Loureiro, J.M.; Pontes, K.V.; Nogueira, I.B.R. A Complete Heterogeneous Model for the Production of N-Propyl Propionate Using a Simulated Moving Bed Reactor. Separations 2022, 9, 43. [Google Scholar] [CrossRef]
  17. Gong, R.J.; Lin, X.J.; Li, P.; Yu, J.G.; Rodrigues, A.E. Experiment and Modeling for the Separation of Guaifenesin Enantiomers Using Simulated Moving Bed and Varicol Units. J. Chromatogr. A 2014, 1363, 242–249. [Google Scholar] [CrossRef] [PubMed]
  18. Pais, L.S.; Loureiro, J.M.; Rodrigues, A.E. Separation of Enantiomers of a Chiral Epoxide by Simulated Moving Bed Chromatography. J. Chromatogr. A 1998, 827, 215–233. [Google Scholar] [CrossRef]
  19. Yu, H.W.; Ching, C.B. Modeling, Simulation and Operation Performance of a Simulated Moving Bed for Enantioseparation of Fluoxetine on New β-Cyclodextrin Columns. Adsorpt.-J. Int. Adsorpt. Soc. 2003, 9, 213–223. [Google Scholar] [CrossRef]
  20. Liu, H.F.; Wu, Z.H.; Chen, J.; Wang, J.H.; Qiu, H.D. Recent Advances in Chiral Liquid Chromatography Stationary Phases for Pharmaceutical Analysis. J. Chromatogr. A 2023, 1708, 464367. [Google Scholar] [CrossRef]
  21. Jurin, M.; Kontrec, D.; Dražić, T.; Roje, M. Enantioseparation of Syn- and Anti-3,5-Disubstituted Hydantoins by HPLC and SFC on Immobilized Polysaccharides-Based Chiral Stationary Phases. Separations 2022, 9, 157. [Google Scholar] [CrossRef]
  22. Lu, G.Y.; Miao, Y.Y.; Zhao, J.C.; Chen, X.; Ke, Y.X. An Evaluation of Immobilized Poly-(S)-N-(1-Phenylethyl)Acrylamide Chiral Stationary Phases. Separations 2022, 10, 11. [Google Scholar] [CrossRef]
  23. Bolognino, I.; Carrieri, A.; Purgatorio, R.; Catto, M.; Caliandro, R.; Carrozzini, B.; Belviso, B.D.; Majellaro, M.; Sotelo, E.; Cellamare, S.; et al. Enantiomeric Separation and Molecular Modelling of Bioactive 4-Aryl-3,4-Dihydropyrimidin-2(1H)-One Ester Derivatives on Teicoplanin-Based Chiral Stationary Phase. Separations 2021, 9, 7. [Google Scholar] [CrossRef]
  24. Chanotiya, C.S.; Pragadheesh, V.; Yadav, A.; Gupta, P.; Lal, R.K. Cyclodextrin-Based Gas Chromatography and GC/MS Methods for Determination of Chiral Pair Constituents in Mint Essential Oils. J. Essent. Oil Res. 2021, 33, 23–31. [Google Scholar] [CrossRef]
  25. Coleman, W.M.; Perfetti, T.A.; Suber, R.L. Quantitative Analysis of Menthol Isomer Distributions in Selected Samples. J. Chromatogr. Sci. 1998, 36, 318–321. [Google Scholar] [CrossRef]
  26. Kasai, Y.; Watanabe, M.; Harada, N. Convenient Method for Determining the Absolute Configuration of Chiral Alcohols with Racemic 1H NMR Anisotropy Reagent, MαNP Acid: Use of HPLC-CD Detector. Chirality 2003, 15, 295–299. [Google Scholar] [CrossRef] [PubMed]
  27. Mao, H.F.; Zhou, Y.C.; Xu, Z.Y.; Zhao, Y. Enhanced Enantioselective Separation of Racemic Menthol via Reverse-Phase High-Performance Liquid Chromatography: Method Development and Computational Insights for Pre-Screening. Talanta 2025, 282, 127062. [Google Scholar] [CrossRef]
  28. Zhong, Y.J.; Guo, D.; Fan, J.; Ruan, L.J.; Gao, R.Q.; Zhang, W.G. HPLC Enantioseparation of Menthol with Non-Ultraviolet Detectors and Effect of Chromatographic Conditions. Chromatographia 2018, 81, 871–879. [Google Scholar] [CrossRef]
  29. Park, H.; Kim, J.W.; Lee, K.B.; Mun, S. Comparison of Two Adsorbents for Simulated-Moving-Bed Separation of Galactose and Levulinic Acid in Terms of Throughput and Desorbent Usage. J. Ind. Eng. Chem. 2021, 97, 337–348. [Google Scholar] [CrossRef]
  30. Arafah, R.S.; Ribeiro, A.E.; Rodrigues, A.E.; Pais, L.S. Separation of Nadolol Racemates by High pH Reversed-Phase Fixed-Bed and Simulated Moving Bed Chromatography. Sep. Purif. Technol. 2023, 305, 122529. [Google Scholar] [CrossRef]
  31. Zabka, M.; Rodrigues, A.E. Thermodynamic and Kinetic Study of Adsorption of R,S-α-Tetralol Enantiomers on the Chiral Adsorbent CHIRALPAK AD. Sep. Sci. Technol. 2007, 42, 739–768. [Google Scholar] [CrossRef]
  32. Gong, R.J.; Li, P.; Yu, J.G. Experiment and Modeling for the Separation of Trans-Stilbene Oxide Enantiomers on Chiralcel OD Preparative Column. J. Chromatogr. A 2013, 1286, 119–126. [Google Scholar] [CrossRef]
  33. Lee, J.W.; Kienle, A.; Seidel-Morgenstern, A. On-Line Optimization of Four-Zone Simulated Moving Bed Chromatography Using an Equilibrium-Dispersion Model: I. Simulation Study. Chem. Eng. Sci. 2020, 225, 115810. [Google Scholar] [CrossRef]
  34. Zhang, X.; Liu, J.; Ray, A.K.; Li, Y. Multi-Objective Optimization of Sequential Simulated Moving Bed for Multi-Component Separation Based on Multi-Parameter Modeling and Its Determination. Chem. Eng. Sci. 2024, 295, 120172. [Google Scholar] [CrossRef]
  35. Wiśniewski, Ł.; Pereira, C.S.M.; Polakovič, M.; Rodrigues, A.E. Chromatographic Separation of Prebiotic Oligosaccharides. Case Study: Separation of Galacto-Oligosaccharides on a Cation Exchanger. Adsorpt.-J. Int. Adsorpt. Soc. 2014, 20, 483–492. [Google Scholar] [CrossRef]
  36. Lee, C.G.; Jo, C.Y.; Lee, K.B.; Mun, S. Optimization of a Simulated-Moving-Bed Process for Continuous Separation of Racemic and Meso-2,3-Butanediol Using an Efficient Optimization Tool Based on Nonlinear Standing-Wave-Design Method. Sep. Purif. Technol. 2021, 254, 117597. [Google Scholar] [CrossRef]
  37. Soepriatna, N.; Wang, N.H.L.; Wankat, P.C. Standing Wave Design of a Four-Zone Thermal SMB Fractionator and Concentrator (4-Zone TSMB-FC) for Linear Systems. Adsorpt.-J. Int. Adsorpt. Soc. 2014, 20, 37–52. [Google Scholar] [CrossRef]
  38. Jo, C.Y.; Choi, J.H.; Kim, J.W.; Mun, S. Development of a Simulated Moving Bed Process for Ultra-High-Purity Separation of Ribose from a Low-Selectivity Sugar Mixture in Microalgal Hydrolyzate. Sep. Purif. Technol. 2021, 262, 118298. [Google Scholar] [CrossRef]
  39. Amanullah, M.; Abel, S.; Mazzotti, M. Separation of Tröger’s Base Enantiomers Through a Combination of Simulated Moving Bed Chromatography and Crystallization. Adsorpt.-J. Int. Adsorpt. Soc. 2005, 11, 893–897. [Google Scholar] [CrossRef]
  40. Mueller, I.; Seidel-Morgenstern, A.; Hamel, C. Simulated-Moving-Bed Technology for Purification of the Prebiotics Galacto-Oligosaccharides. Sep. Purif. Technol. 2021, 271, 118829. [Google Scholar] [CrossRef]
  41. Mazzotti, M.; Storti, G.; Morbidelli, M. Optimal Operation of Simulated Moving Bed Units for Nonlinear Chromatographic Separations. J. Chromatogr. A 1997, 769, 3–24. [Google Scholar] [CrossRef]
  42. Walgode, P.M.; Faria, R.P.V.; Rodrigues, A.E. Pseudo-Ternary Chromatographic Separation of Dihydroxyacetone from the Glycerol Oxidation Byproducts on a Simulated Moving Bed Cascade. Chem. Eng. J. 2023, 476, 146447. [Google Scholar] [CrossRef]
  43. Zabka, M.; Minceva, M.; Sá Gomes, P.; Rodrigues, A.E. Chiral Separation of R,S-α-Tetralol by Simulated Moving Bed. Sep. Purif. Technol. 2008, 43, 727–765. [Google Scholar] [CrossRef]
  44. Campo, M.C.; Baptista, M.C.; Ribeiro, A.M.; Ferreira, A.; Santos, J.C.; Lutz, C.; Loureiro, J.M.; Rodrigues, A.E. Gas Phase SMB for Propane/Propylene Separation Using Enhanced 13X Zeolite Beads. Adsorpt.-J. Int. Adsorpt. Soc. 2014, 20, 61–75. [Google Scholar] [CrossRef]
  45. Ribeiro, A.E.; Gomes, P.S.; Pais, L.S.; Rodrigues, A.E. Chiral Separation of Ketoprofen Enantiomers by Preparative and Simulated Moving Bed Chromatography. Sep. Sci. Technol. 2011, 46, 1726–1739. [Google Scholar] [CrossRef]
  46. Ribeiro, A.E.; Gomes, P.S.; Pais, L.S.; Rodrigues, A.E. Chiral Separation of Flurbiprofen Enantiomers by Preparative and Simulated Moving Bed Chromatography. Chirality 2011, 23, 602–611. [Google Scholar] [CrossRef] [PubMed]
  47. Zhang, Z.; Mazzotti, M.; Morbidelli, M. Multiobjective Optimization of Simulated Moving Bed and Varicol Processes Using a Genetic Algorithm. J. Chromatogr. A 2003, 989, 95–108. [Google Scholar] [CrossRef]
  48. Dubey, G.P.; Sharma, M. Volumetric, Viscometric and Acoustic Properties of Binary Mixtures of 2-Propanol with n-Alkanes (C6, C8, C10) at 298.15 and 308.15 K. Phys. Chem. Liq. 2008, 46, 610–626. [Google Scholar] [CrossRef]
  49. Coelho, L.C.D.; Filho, N.M.L.; Faria, R.P.V.; Ribeiro, A.M.; Rodrigues, A.E. Selection of a Stationary Phase for the Chromatographic Separation of Organic Acids Obtained from Bioglycerol Oxidation. Adsorpt.-J. Int. Adsorpt. Soc. 2017, 23, 627–638. [Google Scholar] [CrossRef]
  50. Aniceto, J.P.S.; Azenha, I.S.; Domingues, F.M.J.; Mendes, A.; Silva, C.M. Design and Optimization of a Simulated Moving Bed Unit for the Separation of Betulinic, Oleanolic and Ursolic Acids Mixtures: Experimental and Modeling Studies. Sep. Purif. Technol. 2018, 192, 401–411. [Google Scholar] [CrossRef]
  51. Tangpromphan, P.; Duangsrisai, S.; Jaree, A. Development of Separation Method for Alpha-Tocopherol and Gamma-Oryzanol Extracted from Rice Bran Oil Using Three-Zone Simulated Moving Bed Process. Sep. Purif. Technol. 2021, 272, 118930. [Google Scholar] [CrossRef]
  52. Gomes, P.S.; Zabkova, M.; Zabka, M.; Minceva, M.; Rodrigues, A.E. Separation of Chiral Mixtures in Real SMB Units: The FlexSMB-LSRE®. AIChE J. 2010, 56, 125–142. [Google Scholar] [CrossRef]
Figure 1. Schematic diagram of Symrise process for l-menthol synthesis.
Separations 13 00067 g001
Figure 2. Schematic diagram of (a) TMB and (b) SMB operations. Blue triangles represent less-retained component, and orange circles represent more-retained component.
Separations 13 00067 g002
Figure 3. The relationship between the pressure drops and the flow rates of the eluent in each SMB column. Lines: fitting curves; points: experimental data.
Separations 13 00067 g003
Figure 4. The elution profiles of TTBB pulse injection.
Separations 13 00067 g004
Figure 5. Comparison of the four different model-fitting curves and experimental data for the binary adsorption isotherms of racemic menthol (c1 = c2). Lines: fitting curves; points: experimental data. Black lines and points represent d-menthol, and red lines and points represent l-menthol. (a) Langmuir model; (b) Linear + Langmuir model; (c) Modified Linear + Langmuir model; (d) Bi-Langmuir Model.
Separations 13 00067 g005
Figure 6. Comparison of the predicted and experimental adsorption selectivity for racemic menthol at different concentrations (c1 = c2). Line: predicted curve by MLLG isotherm model; points: experimental data.
Separations 13 00067 g006
Figure 7. Comparison of the model-predicted curves and experimental data for the single-component adsorption isotherm of l-menthol (c1 = 0). Line: predicted curve; points: experimental data.
Separations 13 00067 g007
Figure 8. Comparison between the model-predicted curve and experimental data for the outlet response curves in the (a) frontal chromatography and (b) elution chromatography experiments. Racemic menthol feed concentration of 5 g/L. Injection time, 12 min and 1 min in frontal chromatography and elution chromatography. Flow rate, 3 mL/min. Lines: predicted curves; points: experimental data. Black lines and points represent d-menthol, and red lines and points represent l-menthol.
Separations 13 00067 g008aSeparations 13 00067 g008b
Figure 9. Comparison of the separation region under purity requirements of 99.0% for both extract and raffinate with different switching times. Column configuration, 1-2-2-1. Total feed concentration, 20 g/L. Fixed values of mI and mIV are 2.44 and 1.22, respectively.
Separations 13 00067 g009
Figure 10. Comparison of the separation region under purity requirements of 99.0% for both extract and raffinate with different total feed concentrations. Column configuration, 1-2-2-1. Switching time, 2 min. Fixed values of mI and mIV are 2.44 and 1.22, respectively.
Separations 13 00067 g010
Figure 11. Comparison of the separation region under different outlet purity requirements for both extract and raffinate. Total feed concentration, 20 g/L. Column configuration, 1-2-2-1. Switching time, 2 min. Fixed values of mI and mIV are 2.44 and 1.22, respectively.
Separations 13 00067 g011
Figure 12. Operating condition and the separation region. Purity requirements are 99.0% for both extract and raffinate. Column configuration, 1-2-2-1. Total feed concentration, 20 g/L. Switching time, 2 min. Fixed values of mI and mIV are 2.44 and 1.22, respectively. Line: predicted boundary for separation region; point: operation point.
Separations 13 00067 g012
Figure 13. Simulated average concentrations of menthol enantiomers in (a) raffinate and (b) extract of the SMB experiment.
Separations 13 00067 g013
Figure 14. Experimental and predicted internal concentration profiles at one-half of switching time during cyclic steady state of the SMB experiment. Lines: predicted curves; points: experimental data. Black lines and points represent d-menthol, and red lines and points represent l-menthol.
Separations 13 00067 g014
Table 1. The bed porosity, total porosity, and Peclet number of each SMB column.
Column No. ε Relative Error of ε  (%) ε T P e × 10 3
10.400.00.683.8
20.400.00.683.7
30.400.00.693.1
40.400.00.683.2
50.39−2.50.683.1
60.39−2.50.683.3
Average0.40-0.683.4
Table 2. Parameters in different competitive isotherms obtained by non-linear regression and fitting performance criteria.
ModelH1H2Qmax,A
(g/L)
Qmax,B
(g/L)
bA,1
(L/g)
bA,2
(L/g)
bB,1
(L/g)
bB,2
(L/g)
SQ
(g2/L2)
SD
(g/L)
LG--397.39-4.09 × 10−34.59 × 10−3--8.46950.8072
LLG0.75078.55-1.23 × 10−21.62 × 10−2--6.08410.7120
MLLG0.5041.27 × 10−23265.94-3.83 × 10−37.35 × 10−3--1.94540.4205
BLG--247.27337.953.27 × 10−37.90 × 10−32.09 × 10−33.70 × 10−162.03510.4511
Table 3. Estimated parameters for the evaluation of the separation region.
ParametersValue
Isotherm parametersH10.504
H20
Q (g/L)265.94
b1 (L/g)3.83 × 10−3
b2 (L/g)7.35 × 10−3
Bed propertiesL (mm)150
dC (mm)10
dp (μm)20
ε0.40
Mass transfer coefficientK (cm/s)1.3 × 10−4
Axial dispersionPe3.4 × 103
Table 4. SMB performance of the theoretical optimal operating points with different switching times. Purity requirements are 99.0% for both extract and raffinate. Column configuration, 1-2-2-1. Total feed concentration, 20 g/L. Fixed values of mI and mIV are 2.44 and 1.22, respectively.
ts (min)QF,max (mL/min)PRmax (gracemate/(LCSP∙min))SCmin (L/gracemate)
1.50.8110.3820.405
20.8380.3950.307
2.50.7520.3550.279
30.6640.3130.266
Table 5. SMB performance of the theoretical optimal operating points with different feed concentrations. Purity requirements are 99.0% for both extract and raffinate. Column configuration, 1-2-2-1. Switching time, 2 min. Fixed values of mI and mIV are 2.44 and 1.22, respectively.
cT,F (g/L)QF,max (mL/min)PRmax (gracemate/(LCSP∙min))SCmin (L/gracemate)
100.9190.2170.569
200.8380.3950.307
300.7350.5200.229
400.6330.5970.195
Table 6. SMB performance of the theoretical optimal operating points with different outlet purity requirements. Total feed concentration, 20 g/L. Column configuration, 1-2-2-1. Switching time, 2 min. Fixed values of mI and mIV are 2.44 and 1.22, respectively.
Purity Requirement
(%)
QF,max
(mL/min)
PRmax
(gracemate/(LCSP∙min))
SCmin
(L/gracemate)
99.00.8380.3950.307
95.01.1770.5550.233
Table 7. Operating conditions of the SMB experiment.
SMB Process ConditionValue
cT,F (g/L)20
ts (min)2
Column configuration1-2-2-1
QF (mL/min)0.57
QX (mL/min)2.97
QR (mL/min)1.91
QD (mL/min)4.31
QI (mL/min)10.98
QII (mL/min)8.01
QIII (mL/min)8.58
QIV (mL/min)6.67
Table 8. Experimental and predicted separation performance of SMB operation.
ExperimentSimulation
PUR (%)99.399.7
PUX (%)99.299.8
PR (gracemate/(LCSP∙min))0.2670.267
SC (L/gracemate)0.4310.431
Disclaimer/Publisher’s Note: The statements, opinions and data contained in all publications are solely those of the individual author(s) and contributor(s) and not of MDPI and/or the editor(s). MDPI and/or the editor(s) disclaim responsibility for any injury to people or property resulting from any ideas, methods, instructions or products referred to in the content.