


Abstract
Rock matrices, as low-permeability media, play a critical role in controlling the persistence and fate of groundwater contaminants. Accurately quantifying contaminant mass stored in these matrices is therefore essential for understanding contamination transport processes. In this study, a microwave-assisted extraction (MAE) method was developed to accelerate the complete extraction of trichloroethylene (TCE) from rock samples. Because microwave–sample interactions depend on multiple factors, extraction conditions, including solvent type, temperature, and extraction time, were optimized using dolostone samples collected from industrial sites with decades-old contamination in Guelph, Canada. Method performance was evaluated through extensive comparison of the newly developed MAE procedure with a conventional shake-flask extraction method used as a reference. In addition, the necessity of field preservation was assessed, given its importance in the overall analytical workflow and accuracy of total mass concentrations and mass stored. The MAE method provided recoveries comparable to or greater than those obtained with the reference method, while avoiding several drawbacks of the shake-flask approach, such as sample cross-contamination during prolonged extraction times over several weeks. Its shorter processing time and faster turnaround support rapid, field-based decision-making. Field preservation was determined to be essential, as non-preserved samples consistently yielded lower measured concentrations than preserved samples.
1. Introduction
Volatile organic compounds (VOCs) are one of the most common classes of soil and groundwater pollutants, comprising many toxic, carcinogenic, mutagenic, and otherwise harmful compounds [1]. Although VOCs tend to partition into the atmosphere, many VOC contaminants are frequently detected in groundwater, soil and sedimentary rock formations, especially below or near old industrial or commercial sites where these organic solvents were commonly used and unintentionally released to the ground through day-to-day operations. Once in the subsurface, they tend to be persistent and highly mobile in groundwater [2].
Sedimentary rocks are complex environmental media with respect to understanding groundwater contaminant transport and fate. The fracture network provides pathways for fluid flow, while the rock matrix acts as a repository for storing and releasing dissolved contamination via diffusion [3,4,5]. As contaminant sources and plumes in the subsurface age, the proportion of contaminant mass stored within the rock matrix relative to that in the fractures increases. This evolution in mass distribution eventually shifts to where concentrations are lower in the fractures, and diffusive mass transfer from the rock matrix into the adjacent fractures sustains a long-term source of contamination to the mobile groundwater. Therefore, plume aging necessitates increasing attention to the contamination residing in the low-permeability zones [6].
The first step in assessing the risk posed by the contaminants is to quantify them. Quantitation of analytes in solid samples typically involves the isolation of analytes from the solid matrix. For low-permeability media samples such as rocks, this extraction step can be very slow, often requiring weeks to be completed. Conventional methods for analyzing VOCs in soil, such as US Environmental Protection Agency (EPA) Methods 5035 (purge-and-trap) and 5021 (static headspace analysis), are not suitable for accurately assessing the extent of contamination in rock matrices; these methods are unable to completely extract VOCs that have diffused deep into internal micropores or are strongly sorbed, a condition commonly observed at sites with long-term contamination histories [7,8].
To ensure the complete extraction of VOCs from low-permeability media, the standard method employed by the Morwick G360 Groundwater Research group has been the shake-flask extraction method. Shake-flask extraction involves immersing samples in an extraction solvent for extended periods of time and periodically sampling and analyzing them. Extraction is considered complete when the concentration of the analytes in the extracting solvent stabilizes, typically after 6 to 8 weeks. Despite its effectiveness, shake-flask extraction has numerous disadvantages, including long extraction times, potential loss of volatiles, cross-contamination risk during sample storage to achieve full extraction, and the typical requirement for multiple analyses per sample [9]. Therefore, the development of an accelerated extraction method was highly beneficial.
In this research, a fast and efficient MAE-based method was developed for the extraction of chlorinated solvents from low-permeability rock samples. MAE performance depends on numerous parameters, and although similar protocols exist for clays and soils, the extraction conditions required optimization for the rock matrix [10]. Trichloroethylene (TCE) was chosen as the model compound due to its widespread occurrence as an environmental pollutant, adverse health effects, and environmental persistence [11].
2. Materials and Methods
2.1. Chemicals and Reagents
An analytical-grade standard of TCE (purity: ≥99.5%) was purchased from BDH Inc. (Toronto, ON, Canada). HPLC-grade methanol and acetone were supplied by Fisher Scientific (Ottawa, ON, Canada), while HPLC-grade hexane was obtained from EMD Chemicals (Gibbstown, NJ, USA).
2.2. Rock Sample Collection and Preservation
Dolostone rock samples were collected from two contaminated sites in Guelph, Ontario, Canada. The average porosity of the samples was 0.096, and most samples were highly saturated with water due to the shallow water table at the site. Average fraction of organic carbon (% foc) was 0.02%. Rock cores approximately 1500 mm long and 85 mm in diameter were obtained by wireline diamond-bit coring using an HQ system. The cores were retrieved from the subsurface and immediately placed on PVC trays (PVC pipe split along its length), lined with a clean sheet of aluminum foil, and wrapped to protect the core from direct sunlight and wind to minimize the loss of VOCs. Within 10–20 min, the rock core was inspected to observe the location of naturally occurring fractures and lithology variability to identify VOC sample locations. The samples were taken by breaking a section of the core using a mason’s chisel, and the sample depths and characteristic features of the core were recorded. The perimeter of the core, which had been exposed to drilling water and air, was removed with the chisel to minimize bias due to possible cross-contamination and loss of volatiles. The rock was then crushed with a hydraulic press into approximately sand and gravel-sized pieces [12].
The samples intended for the development of the MAE method were immediately transferred to 40 mL pre-cleaned glass vials (VWR, Mississauga, ON, Canada). Vials were filled with rock to the brim and quickly sealed with PTFE-lined silicone septa, screw caps, and PTFE tape. Crushing and sample transfer were carried out in less than 2 min to minimize losses of volatile analytes. No methanol or other preservatives were used in the field to make sure that the extraction started simultaneously for both the MAE and shake-flask extraction methods. The samples collected were placed in coolers with dry ice and transported to the laboratory within 8 h. Samples that could be processed within 48 h of arrival were stored at −20 °C; the samples were frozen at −80 °C for longer-term storage.
Two additional sets of samples were also collected at corresponding depths; a set of 101 samples was collected to evaluate the fitness of EPA method 5035 for the analysis of VOCs in low-permeability media such as rocks. These samples were sent to Maxxam Analytics Inc. (Mississauga, ON, Canada) to be analyzed.
A second set of samples was collected to evaluate the necessity and impact of field preservation. These samples were immediately transferred into 40 mL pre-cleaned glass vials, containing 15 mL of HPLC-grade methanol, and quickly sealed with PTFE-lined silicone septa, screw caps, and PTFE tape. Although these samples were not true replicates due to rock heterogeneity, they were considered similar and suitable for comparative analyses.
2.3. TCE Determination Method
Analyses were conducted on an Agilent 6890 Plus GC (Agilent Technologies Inc., Santa Clara, CA, USA) equipped with a µ-ECD detector and a 30 m × 320 µm × 5.0 µm DB-1 fused silica capillary column (Agilent Technologies Inc.), and a Trace GC Ultra (Thermo Electron Co., Waltham, MA, USA) equipped with an ECD and a 30 m × 320 µm × 5.0 µm HP-1 fused silica capillary column (Agilent Technologies Inc.). Sample injection was performed using an Agilent 7683 liquid autosampler on the Agilent GC and an AS 3000 liquid autosampler on the Thermo GC, with an injection volume of 1 µL. All samples were centrifuged before injection to remove any remaining fine rock particles that could interfere with the injector. Helium was used as the carrier gas at a constant flow rate of 2.7 mL/min.
Cool on-column injection was used for sample introduction into the GC, and the injector temperature was set to track the oven temperature. The initial oven temperature was 55 °C, held for 0.5 min, then ramped up to 150 °C at a rate of 10 °C/min, then to the final temperature of 210 °C at a rate of 35 °C/min, held for 6 min. The detectors were operated at 350 °C, using nitrogen as the makeup gas at a flow rate of 60 mL/min. Instrument control, data collection, and analysis were performed using HP ChemStation (V. C.00.00) and ChromQuest™ (V. 4.1) software on the Agilent GC and Thermo GC, respectively.
2.4. MAE Method Development
The microwave extraction method was developed on an Ethos SEL microwave solvent extraction system (Milestone™ Srl, Sorisole, Italy), controlled by a mini-PC from the same company. The extraction vessels supplied with the system were made of TFM™ modified PTFE, characterized by its very dense structure and very low permeability to gases and vapors. They were housed in safety shields and mounted in a 12-position rotor. Pressure limit for the vessels was 500 psi. Extraction temperature was controlled using a fiber optic temperature sensor placed in a special well in a reference vessel used alongside the regular vessels. The reference vessel was filled with the same amount of sample and solvent as the other extraction vessels, and it was assumed that the temperature in all vessels was equal due to the uniformity of the microwave energy distribution. The system allowed microwave power to be set in 1-watt increments up to a maximum output of 1600 watts. To develop the MAE method for TCE in dolostone samples, three extraction parameters were optimized: the choice of the extraction solvent, the extraction temperature, and the irradiation duration.
2.4.1. Selection of the Extraction Solvent for MAE
Pure methanol and a 1:1 (v/v) mixture of hexane/acetone were examined as potential extraction solvents. MAE vessels were filled with 20 mL of the solvent, followed by the addition of approximately 15 g of crushed rock from the contaminated site. Microwave extraction was performed at 120 °C for 20 min. The vessels were left to cool before opening and evaluation of the extraction solvents.
2.4.2. Extraction Temperature Optimization
Approximately 20 g of analyte-free crushed rock was added to 25 mL of aqueous solution containing 1.4 mg/L of TCE, in 40 mL pre-cleaned clear glass vials. The vials were then sealed and stored at room temperature. They were hand-shaken twice a week, each time for 5 min, over a period of one month. The crushed rock particles were subsequently filtered and air-dried. Each spiked rock sample was then split between an MAE vessel and a 40 mL glass vial for shake-flask extraction, both pre-filled with 20 mL of HPLC-grade methanol. The containers were quickly sealed to minimize TCE loss.
The samples analyzed by shake-flask extraction were hand-shaken for 10 min immediately after being transferred into 40 mL glass vials, left for 2 h, then shaken for another 5 min and left for 1 h before the first aliquots were taken for the analysis. A second set of aliquots was collected on the next day using a similar procedure. For samples that were processed with MAE, the first aliquot was taken following the microwave irradiation after the samples had cooled down to room temperature. Contents of the extraction vessels were then transferred into 40 mL glass vials, sealed, and stored for the second aliquot to be collected on the next day. Three MAE temperatures, 100 °C, 120 °C, and 130 °C, were examined. MAE was carried out for 20 min in all cases, keeping the extraction time constant to isolate the temperature effect on the extraction efficiency. The TCE content of the aliquots was then analyzed by the GC method described above.
2.4.3. Extraction Time Optimization
To determine the optimized extraction time, a series of field-contaminated samples was chosen, and 15 g aliquots of them were transferred to MAE vessels containing 20 mL of HPLC-grade methanol. MAE was performed at 120 °C for 20 min. Subsequently, the vessels were cooled to room temperature, opened, and a 0.5 mL aliquot was quickly collected for GC analysis. The vessels were then resealed and subjected to another 20 min extraction cycle, followed by the collection of a second set of aliquots. The procedure was then repeated until the extraction was considered complete, at which time the concentration of TCE in the extract did not increase significantly after an additional microwave extraction cycle.
2.4.4. Comparison of MAE with Shake-Flask Extraction
Shake-flask extraction was used as the reference method to evaluate the efficiency of the MAE method. For this comparison, over 400 rock samples from the contaminated sites were split and processed using both methods. For shake-flask extraction, aliquots were transferred into pre-cleaned 40 mL vials, pre-filled with 20 mL of HPLC-grade methanol. The vials were quickly sealed with PTFE-lined silicone septa, screw caps, and Parafilm and shaken for 30 min on an orbital shaker (MODEL 3520, Lab Line Instruments Inc., Dubuque, IA, USA). The first set of aliquots was collected subsequently for GC analysis to establish the extraction time profile. Vials were then resealed and refrigerated at 4 °C. Another aliquot was collected on the next day, followed by weekly sub-sampling. The samples were shaken for half an hour and allowed to settle for one hour before each aliquot was collected.
For the MAE procedure, split samples were placed into extraction vessels pre-filled with 20 mL of HPLC-grade methanol and irradiated in the MAE system for 40 min at 120 °C. Following extraction, the vessels were allowed to cool prior to opening, after which a 0.5 mL aliquot was collected for GC analysis. All laboratory analyses were conducted at a laboratory for trace organic analyses, Earth Sciences Department, University of Waterloo.
2.5. Statistical Analysis
The detection limit of TCE in the extracts was converted to a detection limit in µg/g wet rock in order to standardize limits of detection across different samples. A concentration of one-half of the detection limit of the method was assigned to all samples in which the analyte was not detected.
The normality of data distribution was assessed using a quantile-quantile (Q-Q) plot to determine whether parametric or non-parametric tests are appropriate. In these plots, sample quantiles are plotted against the theoretical quantiles expected for normally distributed datasets. The experimental data deviated significantly from a straight line in Q-Q plots, indicating non-normal distribution. Hence, non-parametric tests were applied for statistical analysis throughout the datasets.
For the MAE method efficiency assessment, individual pairs of results—one from the shake-flask extraction method, and one from the corresponding MAE method—were compared using the Wilcoxon signed-rank test. The same test was also applied for preservation impact assessment. Since the number of sample pairs was larger than 30, normal distribution was used for evaluating the test results.
3. Results and Discussion
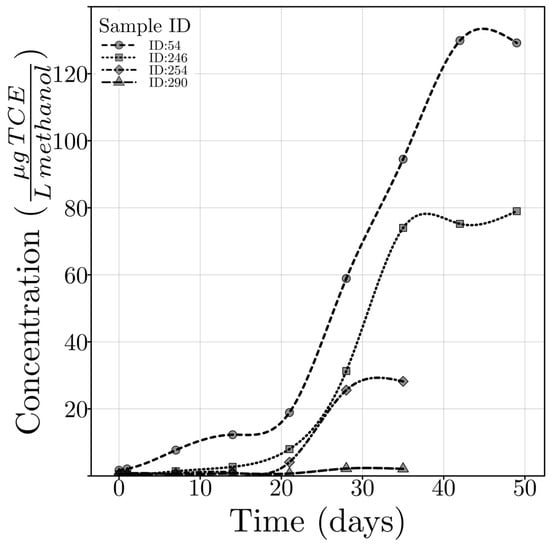
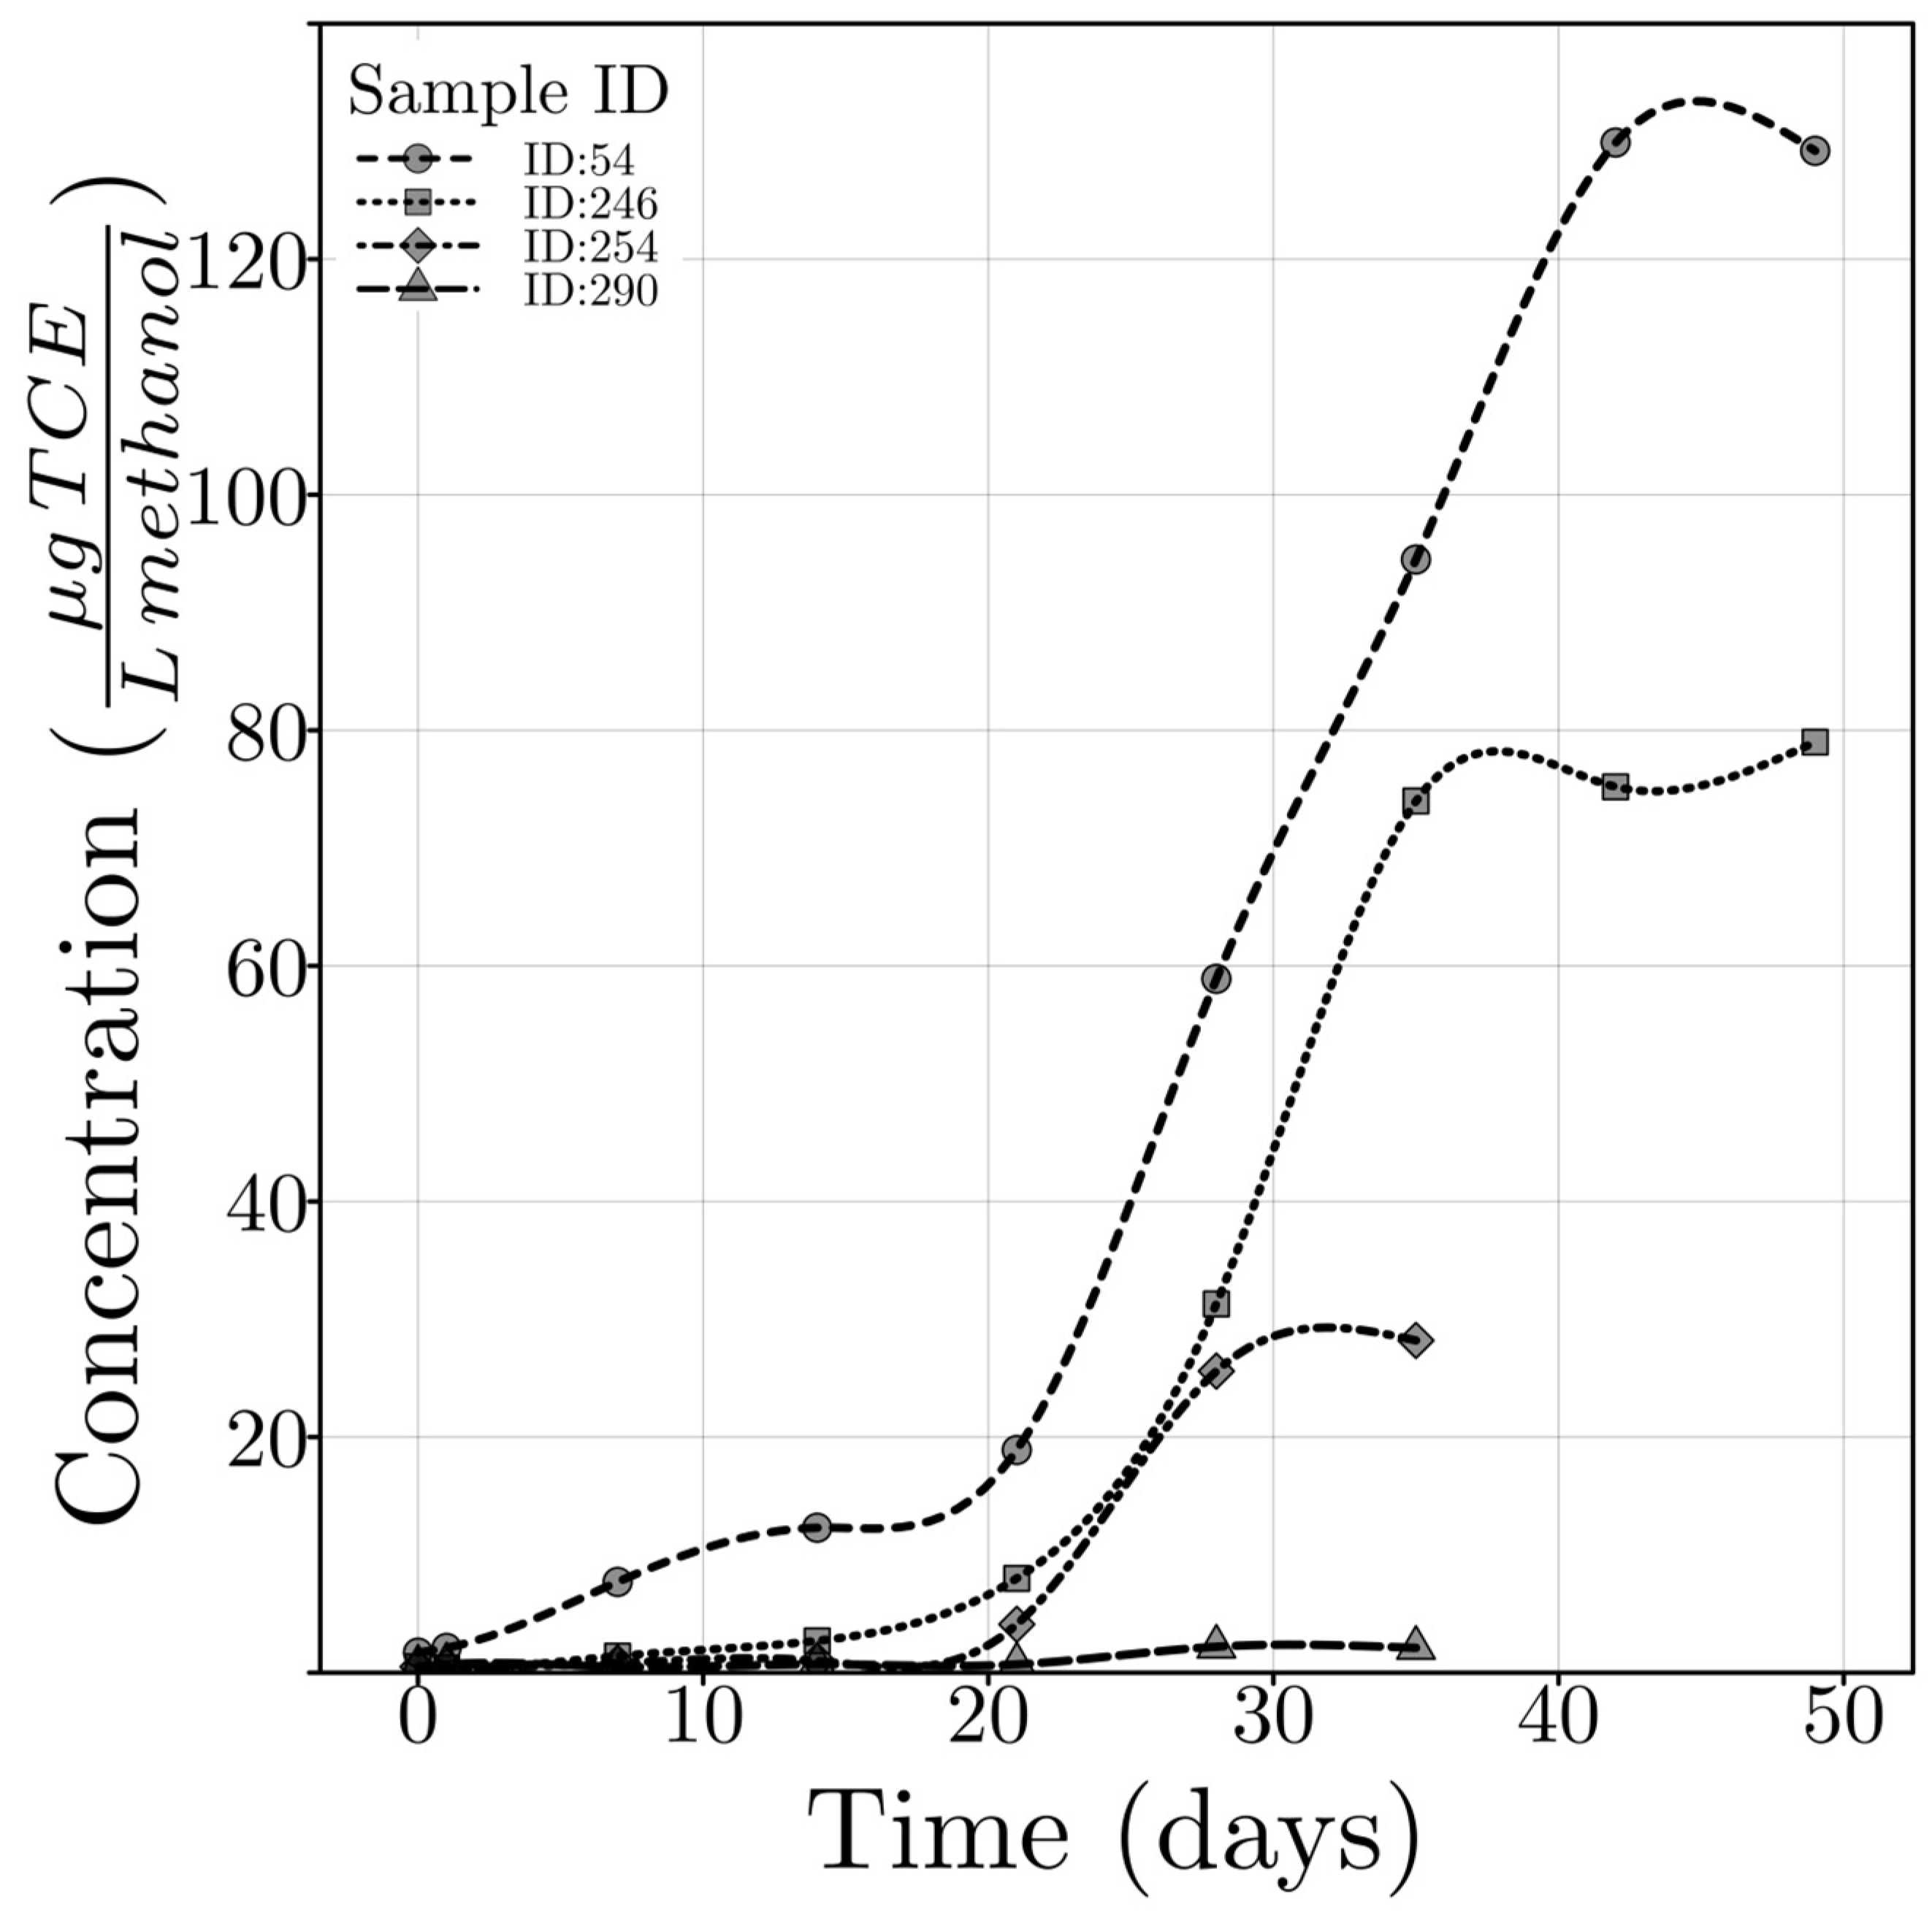
Determination of the levels of VOCs in low-permeability media, such as rocks, is a challenging task. Shake-flask extraction proved to be an effective method for the extraction of VOCs from various solid media, including soils and clay, provided that the extraction time was long enough [13]. However, shake-flask extraction typically requires 6 to 8 weeks to be completed for rock samples with low permeability (Figure 1). The long extraction time leads to an increased potential for cross-contamination during the storage process as indicated by multiple field QA/QC samples used in the sampling and analysis workflow (analytes detected in trip and storage blanks). Multiple sub-sampling of the extraction solvent for confirmation also increases the chance of VOC losses. Additionally, long extraction times do not allow results from the laboratory analyses to inform decisions in the field. Hence, faster extraction methods are desirable and can improve multiple aspects of the analysis.
Figure 1.
Typical shake-flask extraction time profiles for low-permeability rock samples. The contaminant concentration in the extraction solvent increases gradually and reaches a plateau after approximately five weeks. However, the time required to reach equilibrium depends on several factors, including rock matrix porosity and pore-size distribution, solvent viscosity, and temperature, and must be re-evaluated for different lithologies and sites.
A traditional method for accelerated extraction of analytes from solid matrices is Soxhlet extraction. However, its application is limited to semi- and non-volatile analytes. Supercritical fluid extraction (SFE), pressurized fluid extraction (PFE), microwave-assisted extraction (MAE), and sonication extraction are all newer extraction techniques, and compared to Soxhlet extraction, they offer reduced solvent consumption, shorter extraction times, and comparable or better analyte recovery [14,15,16]. PFE, MAE and ultrasonic extraction have all been adopted by EPA for the extraction of semi-volatiles from solid samples as per methods 3545A, 3546, and 3550C, respectively.
SFE and PFE are not suitable for the extraction of volatile compounds because of potential analyte losses during extraction and/or extract recovery stages [17]. Sonication extraction, despite being suitable for volatile analytes, might cause the compression of fine rock and clay particles at the bottom of the extraction vial if used in isolation, and impede the completion of the extraction [17]. On the other hand, MAE has been successfully applied for the extraction of chlorinated solvents from natural clay-rich sample matrices, as well as chlorophenols, PAHs, and PCBs, and emerging contaminants in soil and sediment samples [10,18,19,20,21,22,23]. Therefore, MAE was selected as the extraction method for evaluation in this study.
3.1. MAE Method Development
In MAE, the samples are irradiated with microwaves, resulting in rapid and efficient heating [17]. The elevated temperature increases diffusion rates, decreases the viscosity and surface tension of the extraction solvent, and enhances solvent penetration into the sample matrix, ultimately leading to quicker extraction of the analytes [24]. MAE systems are classified based on the extraction vessels used, either closed or open. In closed vessel MAE, the vessels are hermetically sealed, preventing loss of chemicals during extraction—a crucial feature for preserving volatile compounds [25]. Additionally, sealed vessels allow the solvent to be pressurized and heated above its atmospheric boiling point, further enhancing extraction efficiency. The sealed vessels can be left to cool after extraction, minimizing the loss of volatiles. Consequently, closed vessel MAE was selected as the method of choice for the rapid extraction of VOCs from contaminated rock samples. Since the extraction efficiency of MAE is dependent on the extraction solvent, temperature, and duration, optimization of these parameters was required. Notably, these parameters must be optimized for field-contaminated samples, as laboratory spiking cannot reproduce the behavior of rocks exposed to contaminants for long time [26].
3.2. Selection of the Extraction Solvent
Solvent plays a crucial role in MAE: it must absorb the radiation energy of microwaves to increase the extraction temperature and also dissolve the analytes. Two solvent systems were evaluated for the experiments: a 1:1 (v/v) mixture of hexane and acetone, and pure methanol.
Hexane is microwave-transparent, but is a well-suited solvent for dissolving non-polar organic analytes such as TCE, while acetone absorbs microwaves efficiently. In experiments involving this mixture, phase separation occurred due to the high moisture content in most samples, resulting in two distinct layers. The bottom layer was primarily composed of water and acetone, while the top layer was predominantly hexane. The volume ratios of the two layers varied among samples due to differences in the water content of the rock samples (Table 1). GC analysis of both phases revealed that TCE concentrations in the lower layer were significantly higher than those in the upper layer. It was, however, impractical to determine the distribution ratio of TCE between the two liquid phases due to the variability in phase ratios among different samples and variable acetone content in each layer. Consequently, the hexane/acetone solvent system was deemed unsuitable for this analysis and was not considered in subsequent experiments.
Table 1.
Volume and concentration of TCE in the separated phases when a 1:1 (v/v) mixture of hexane and acetone was used as the extraction solvent. The concentration of TCE was higher in the lower layer.
Methanol was evaluated as an alternative solvent and was found to be capable of effectively dissolving and extracting TCE from rock samples. Methanol absorbs microwave energy and is miscible with water, making it less susceptible to variations in the water content of the samples. Furthermore, methanol is the solvent of choice for shake-flask extraction and preservation of field samples for VOCs, which facilitated a direct comparison between the two methodologies.
3.3. Extraction Temperature Optimization
Optimal extraction temperature was determined using spiked samples due to the unavailability of real contaminated samples at the time. Crushed rock particles were aged over a period of one month in the spiking solution to make them behave as similarly as possible to real contaminated rock samples. The spiking procedure did not allow the evaluation of absolute recovery of TCE, but relative extraction efficiencies between MAE and shake-flask extraction could be easily compared. Although genuine aged samples would be preferable, employing spiked samples prepared in this way for preliminary optimization was the most effective approach.
Three extraction temperatures were evaluated: 100 °C, 120 °C, and 130 °C. Theoretically, higher extraction temperatures should lead to faster extraction. However, higher temperatures may also result in longer overall turnaround times, as the contents of the extraction vessels must be cooled back to room temperature before opening to prevent the loss of volatiles, which takes longer for hotter extracts. The relative increase in TCE concentration was determined between the first and second aliquots following MAE at various temperatures and shake-flask extraction. The extraction efficiency was evaluated by comparing the extent of concentration increase observed on the day following the extraction. Regardless of the temperature used, the relative concentration increase in the extract produced by MAE was significantly lower than for samples processed by shake-flask extraction. The average increase in TCE concentration on the second day was 25% with shake-flask extraction, compared to 11.5%, 4.6%, and 2.1% for MAE at 100 °C, 120 °C, and 130 °C, respectively. The results were analyzed by the Wilcoxon signed-rank test, and the difference between extractions at 120 °C and 130 °C was found to be statistically insignificant. Therefore, a temperature of 120 °C was selected for future experiments, as it offered shorter turnaround times.
3.4. MAE Time Optimization
To determine optimal extraction time, approximately 100 field-contaminated rock samples were processed by the MAE, 17 of which were found to be contaminated with TCE. Unlike MAE with clay samples, in which extraction was completed within a short time (about 6 min [10]), even a 20 min extraction time was not long enough for the rock samples to reach steady-state concentration (Table 2). A 6.7% average increase in TCE concentration was observed when the extraction time was extended by an additional 20 min. However, no further analyte concentration increases were observed when the MAE time was extended by another 20 min. In fact, a small decrease in concentration was observed in most cases, likely due to losses associated with repeated opening and closing of the vessels. Therefore, minimizing the duration that samples are exposed to open air during transfer or aliquot collection is essential for maintaining the accuracy of analytical results.
Table 2.
TCE concentration after 20, 40, and 60 min of MAE. The concentration does not significantly increase after 40 min of microwave-assisted extraction.
3.5. Comparison of MAE and Shake-Flask Extraction
To evaluate the extraction efficiency of the MAE method, split crushed-rock samples were extracted using the MAE and shake-flask methods, and the results were compared. The high heterogeneity of the rock samples makes obtaining equivalent split samples difficult, and it is likely that the contaminant levels differed in the two splits. Statistically, this problem can be overcome by using a large number of samples for the comparison. Accordingly, over 400 samples from a tool manufacturing site in Guelph, Canada were collected. Rock samples collected in the field are typically preserved immediately with methanol to minimize the loss of VOCs. However, in the comparison experiment, this preservation step would allow methanol to penetrate the matrix and partially extract the analyte during the storage period (at least 24 h), potentially confounding the results and making MAE not the sole extraction mechanism. Therefore, these samples were collected without any methanol preservation to ensure both extraction processes started at the same time and to prevent potential biases.
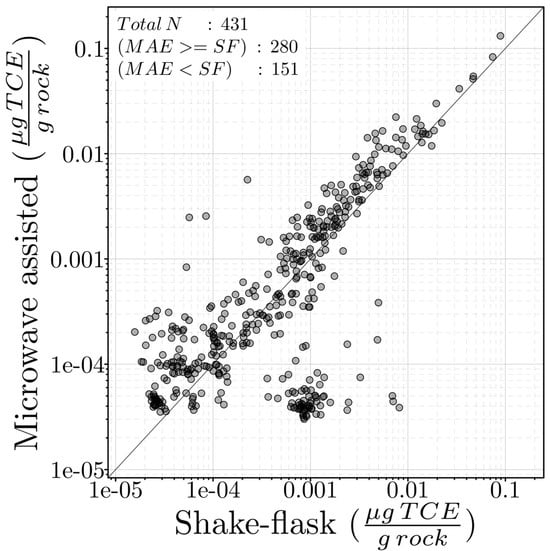
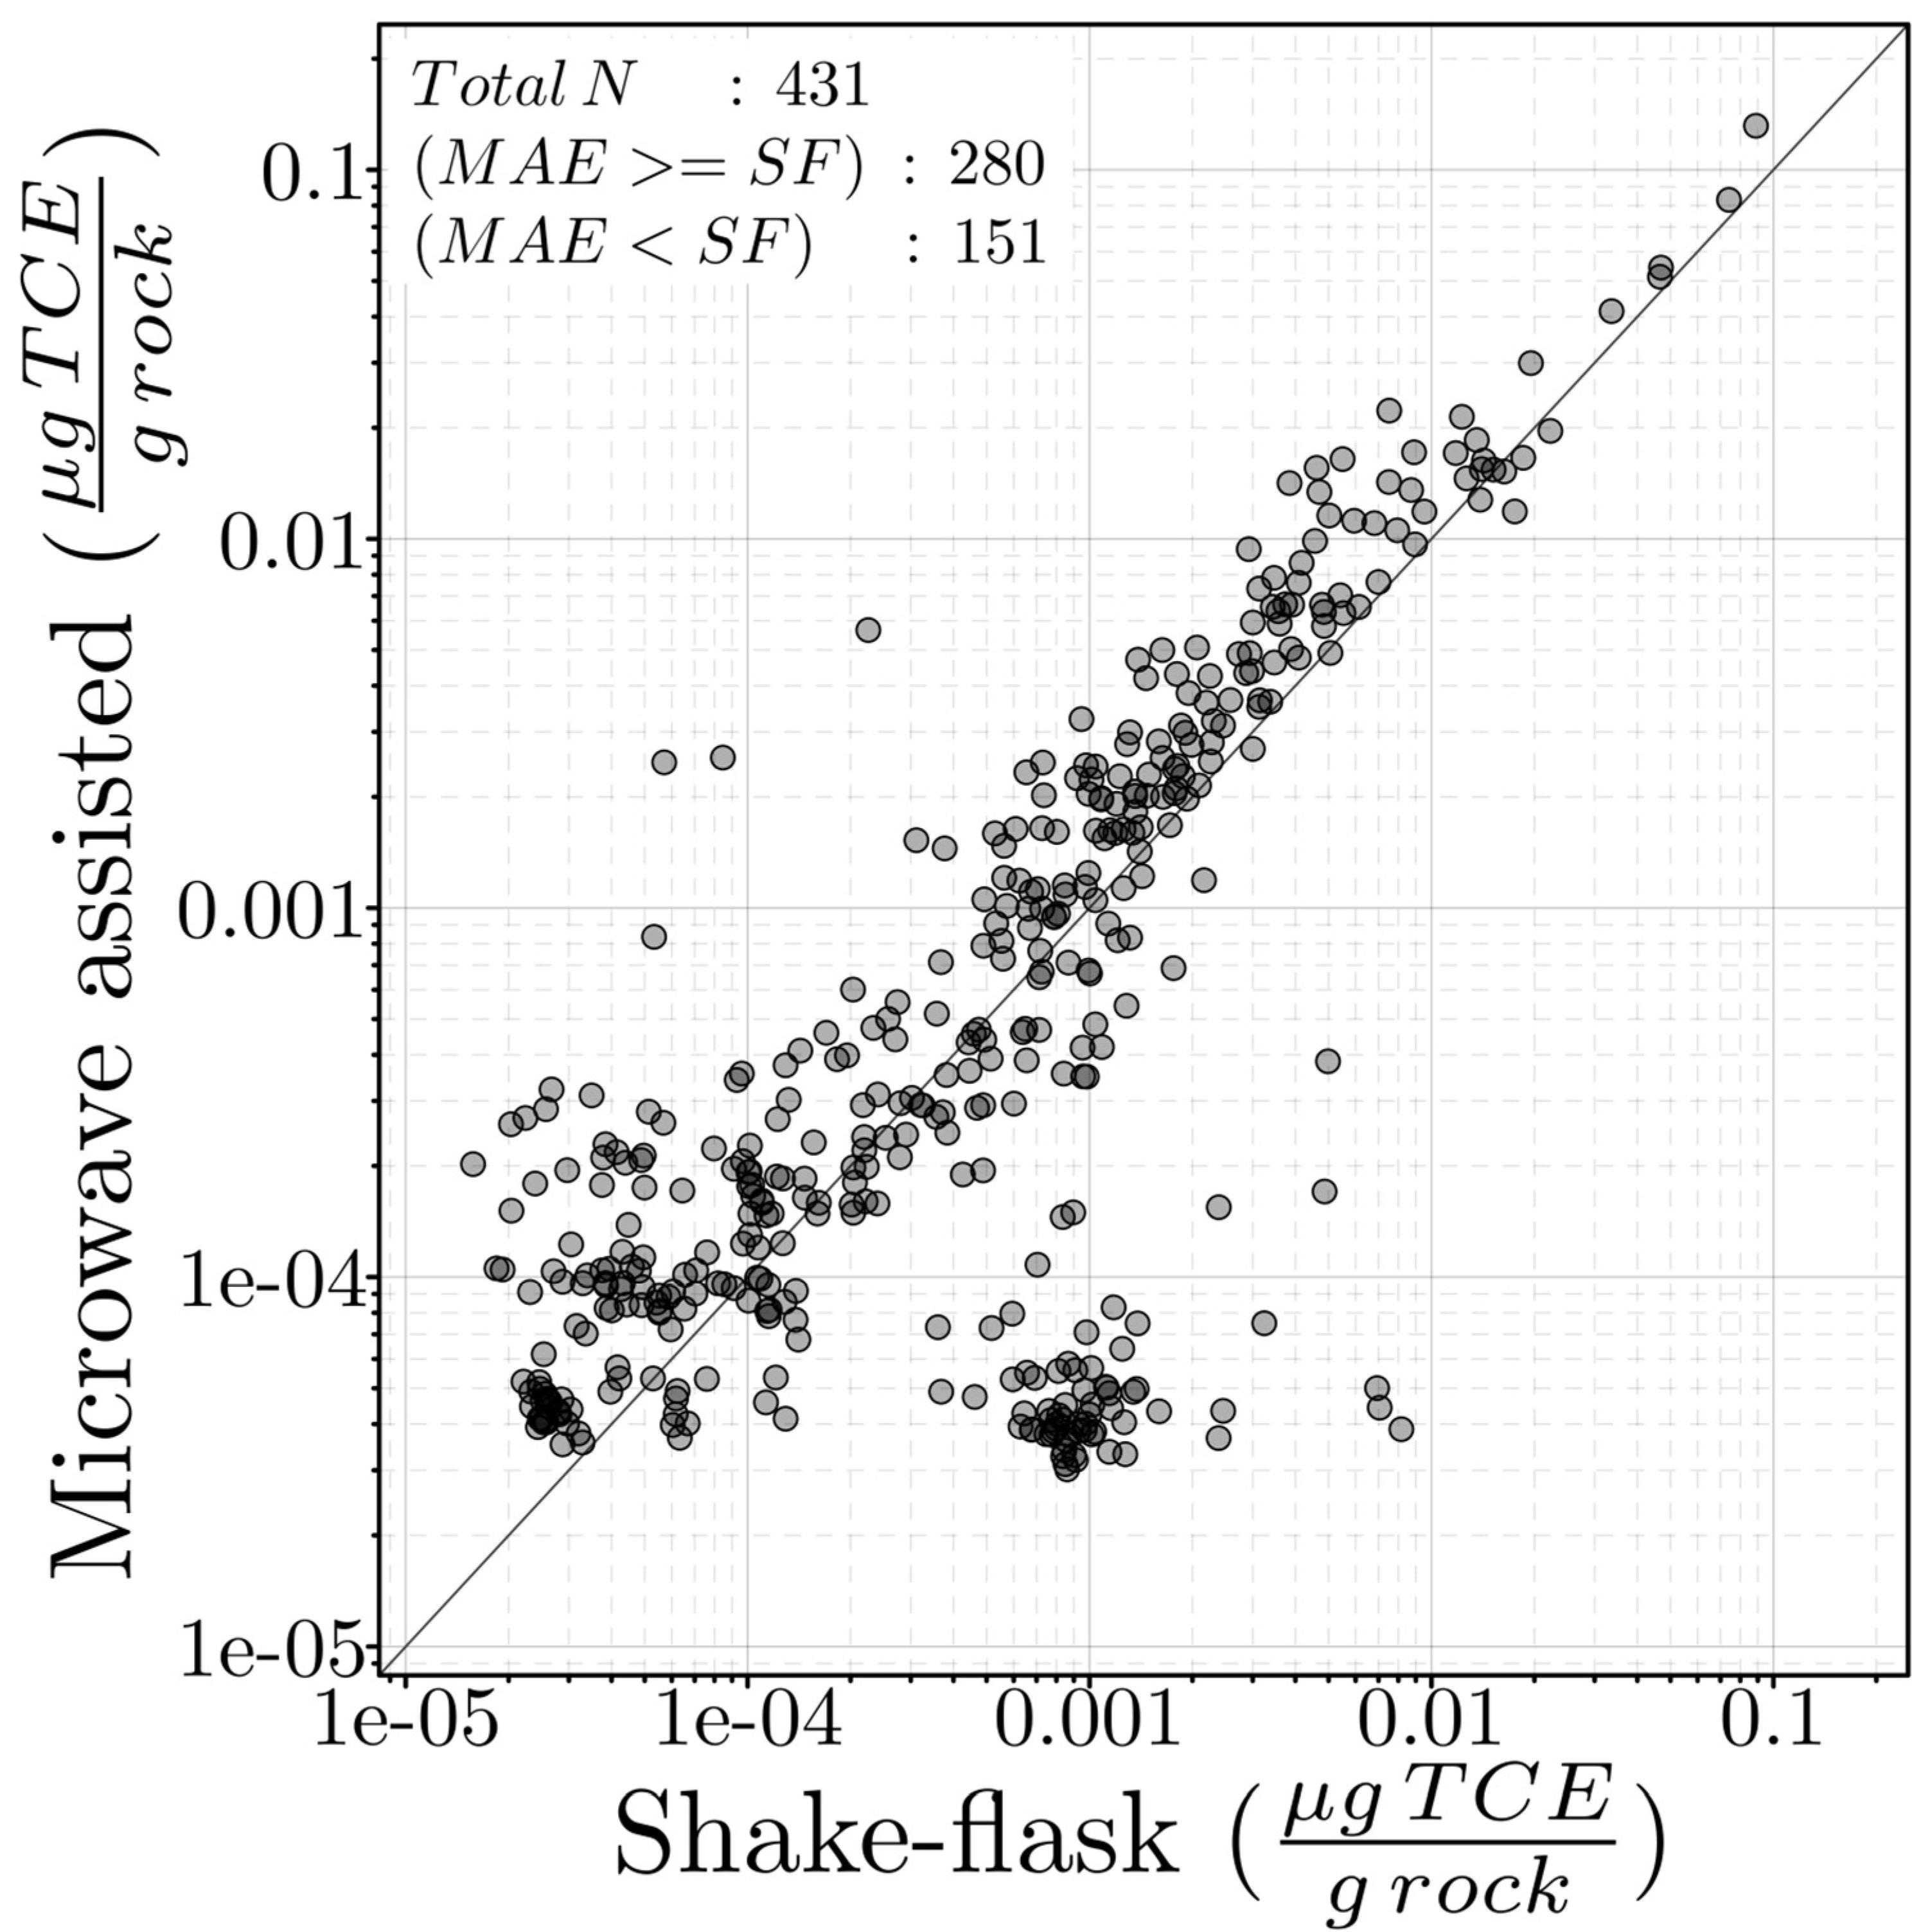
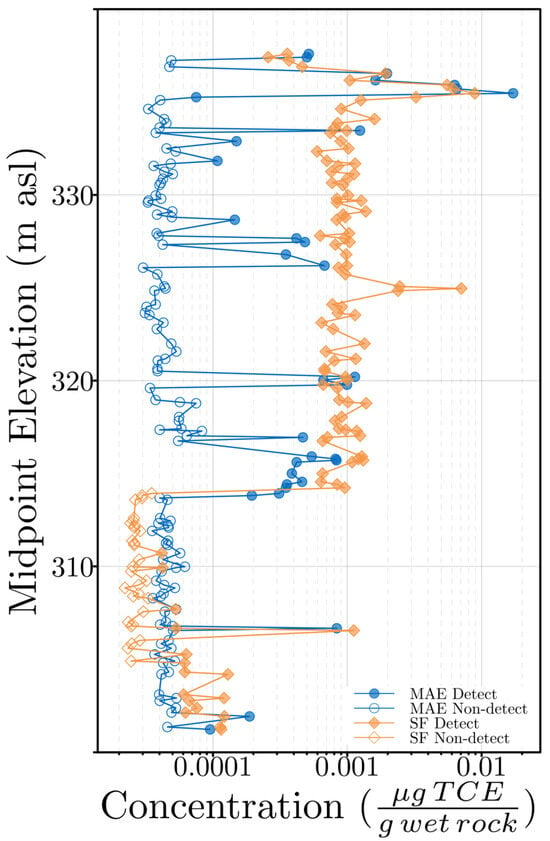
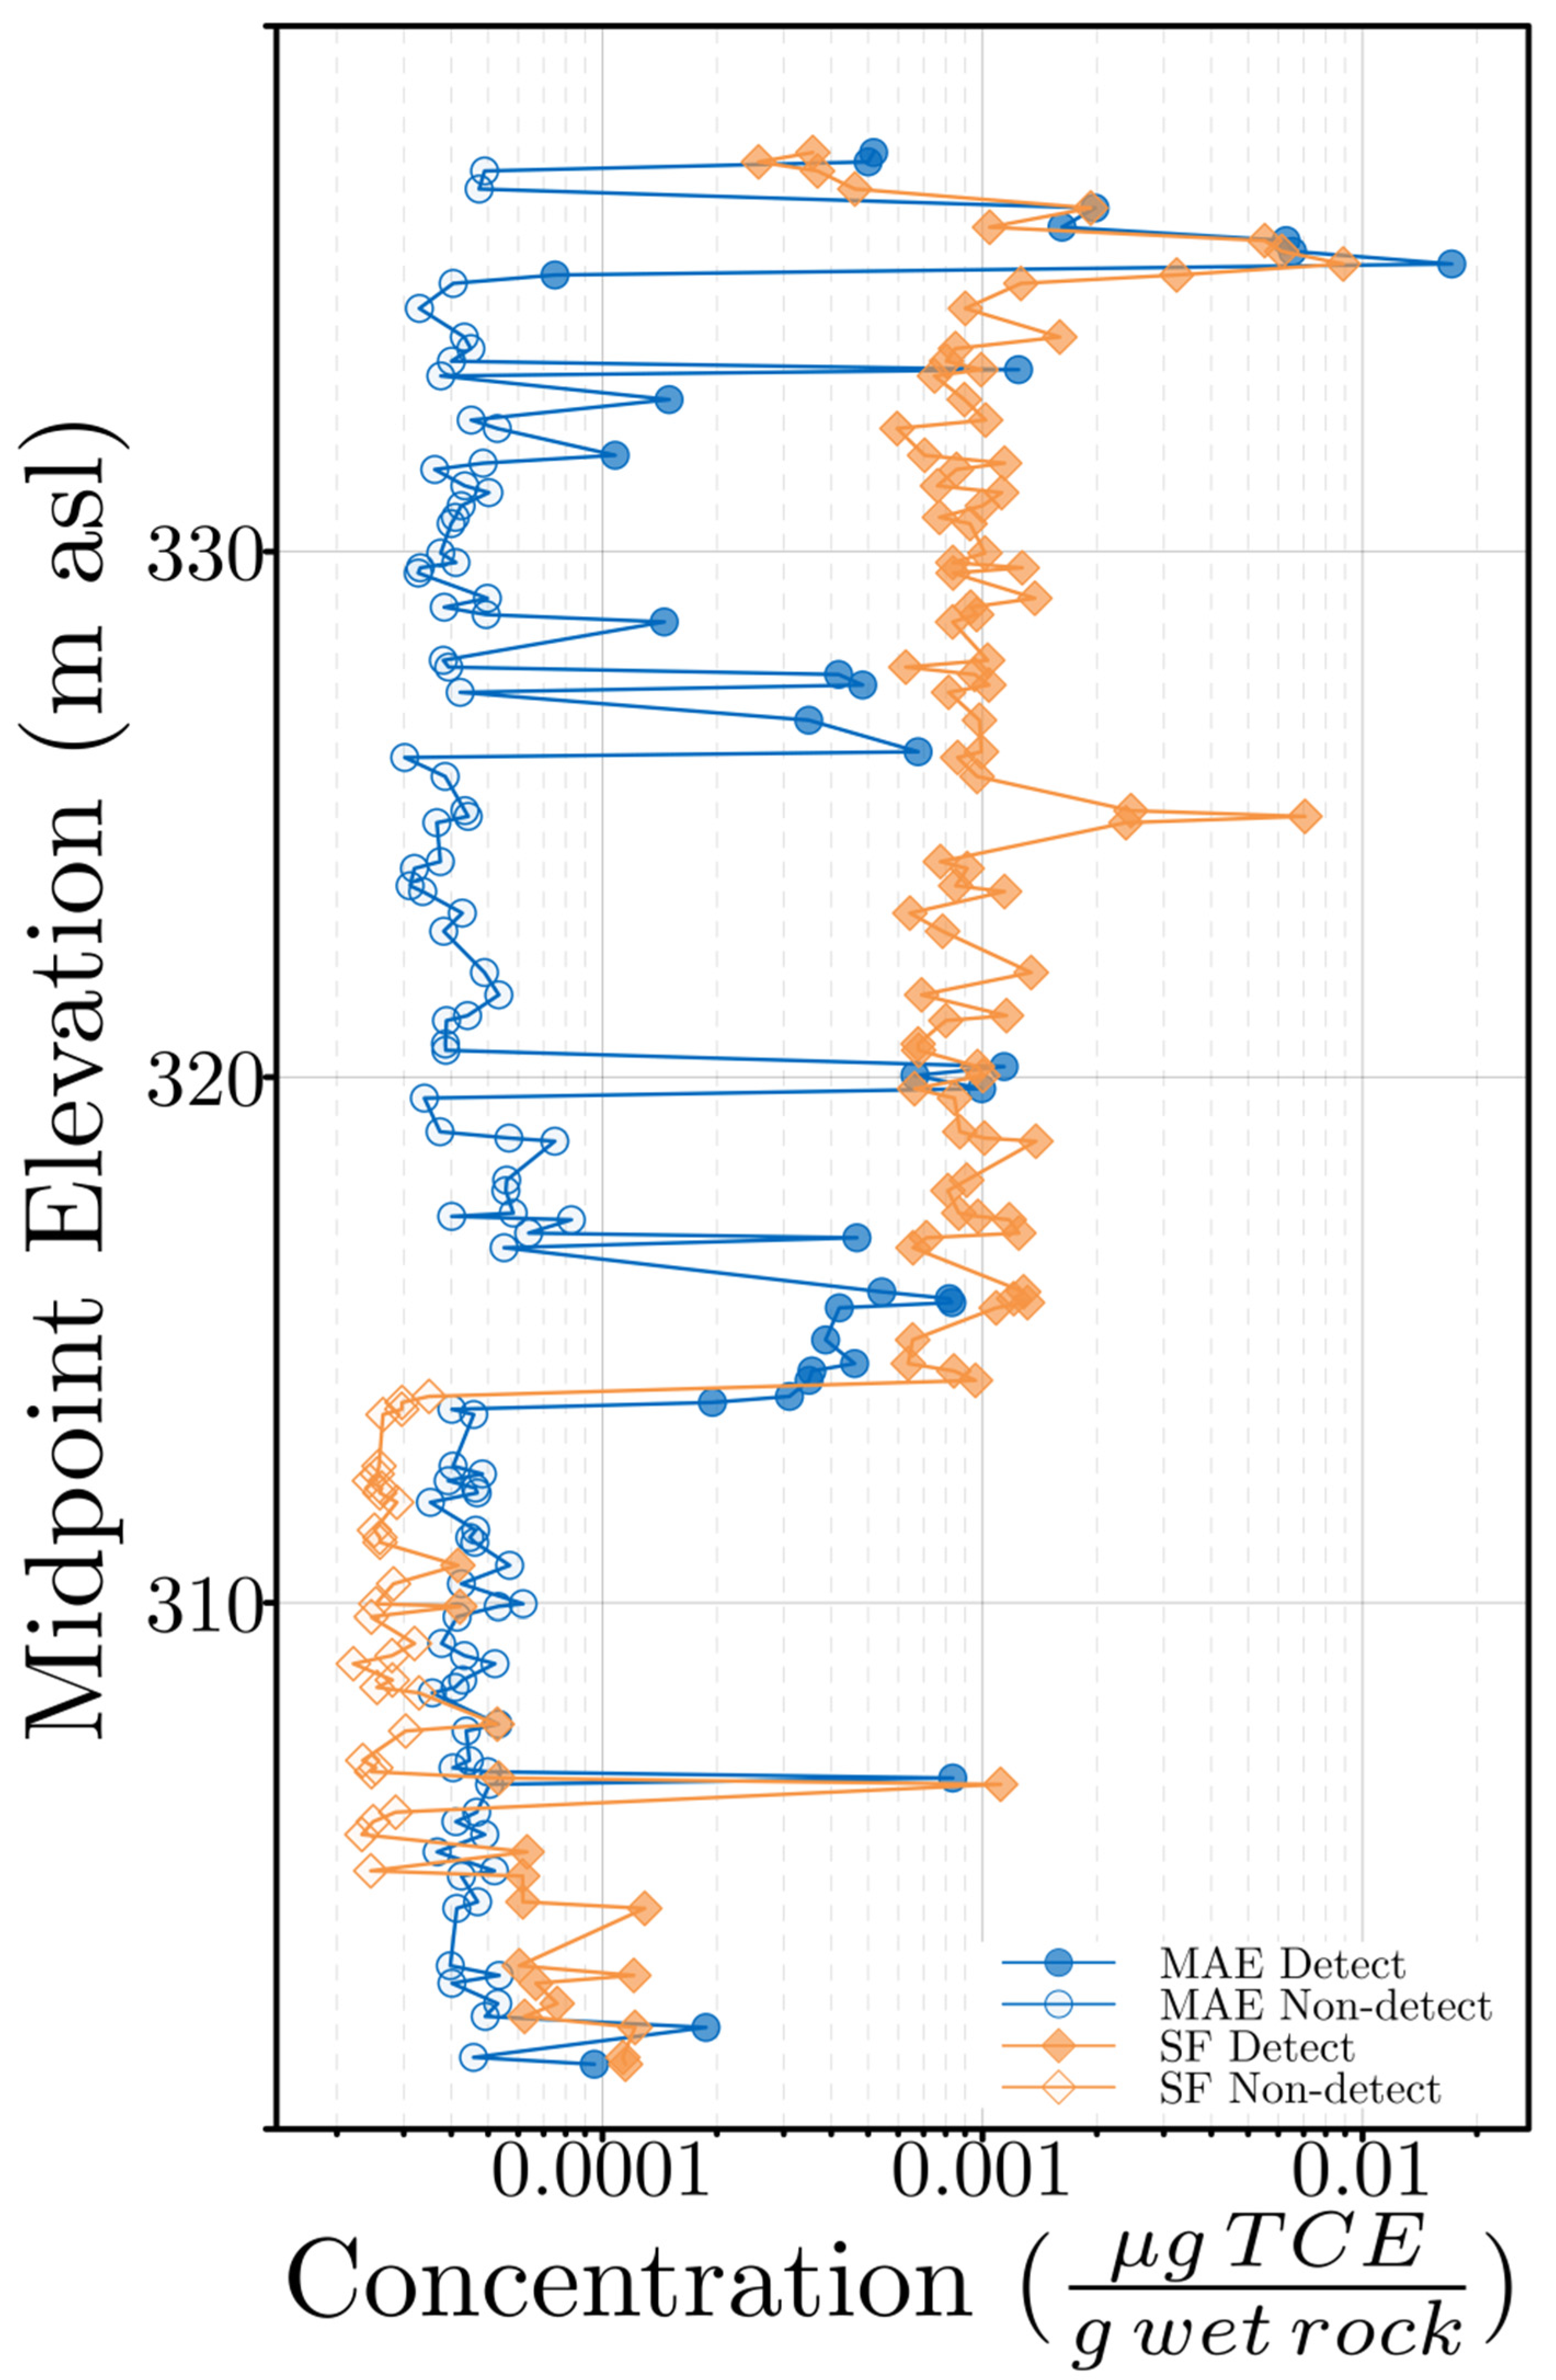
The results for the samples processed by the two methods are summarized in Table 3, with raw data provided in Table S1. Visual inspection of the determined concentrations suggested that the MAE resulted in higher concentrations in most cases (Figure 2 and Figure 3). To confirm this, the results were analyzed with the non-parametric Wilcoxon signed rank test. The null hypothesis was that the concentrations of samples processed with MAE were equal to or higher than those of samples processed with shake-flask extraction, implying that MAE was at least as efficient as shake-flask extraction. Wilcoxon signed rank test was performed on both the complete dataset and a subset of the data where TCE was quantifiable in both extraction methods. Regardless of the subset, the test resulted in p-values greater than 0.999, indicating that there were no grounds for rejecting the null hypothesis. Therefore, the experiment indicated that MAE was at least as efficient as the shake-flask extraction method.
Table 3.
Descriptive statistics of the results yielded by microwave-assisted extraction and shake-flask extraction.
Figure 2.
Cross plot of TCE determination results of shake-flask extraction and MAE for split samples. Relative agreement between the two methods can be observed, while the MAE method has generally resulted in higher concentrations. The clustered data points at the bottom of the graph, which resulted in orders of higher magnitude concentrations with the shake-flask method, are most probably the result of cross-contamination.
Figure 3.
TCE contamination depth profiles for split rock samples. Concentrations obtained using the MAE method were generally equivalent to those from the shake-flask method, except for a small number of samples at very low concentrations. The nearly uniform low-level detections observed in the shake-flask results are improbable given natural rock heterogeneity and are likely attributable to cross-contamination during long-term storage.
3.6. Cross-Contamination Risks in Shake-Flask Extraction
It was observed that in many cases, low levels of TCE were detected by shake-flask extraction, but not by the MAE (Figure 3). Two important features were revealed on closer inspection of the data. First, those concentrations were very low and nearly constant (around 0.001 µg TCE/g wet rock). Second, they were evenly and uniformly distributed throughout the drilling depth. Both characteristics are extremely unlikely to occur for rock samples because of the geological heterogeneity of the sedimentation and cementation of grains that comprise the rock matrix blocks. Thus, the most likely explanation is that TCE detected in those samples by the shake-flask method was due to cross-contamination, a frequently encountered problem associated with long-term storage of samples containing volatile constituents. In the shake-flask method, hundreds of samples are stored together in a refrigerator for at least six weeks before the analysis. In contrast, the MAE samples are processed within a very short time after delivery to the laboratory, minimizing the opportunity for cross-contamination. This also signifies the importance of collecting quality control blank samples at all stages of storage and transport to detect any anomalies in the results.
3.7. Comparison to EPA Method 5035
EPA Method 5035 used by Maxxam Analytics Inc. did not provide low enough detection limits for the samples analyzed for adequate characterization of the site. The detection limits for the shake-flask and MAE methods were approximately 2 orders of magnitude lower than for the EPA Method. TCE was only detected in three samples out of the total 101 samples collected, with concentrations of 0.02, 0.03, and 0.05 µg/g rock. The corresponding shake-flask extraction results were 0.089, 0.00067, and 0.0087 µg/g rock using the direct, on-column injection with uECD detection. While a large variation can be observed in the results, the higher detection limit for EPA Method 5035 limited the number of samples available for comparisons, resulting in an inconclusive evaluation. In addition, the increased detection limits precluded a meaningful assessment of contamination levels against regulatory guidelines. The elevated detection limit primarily results from EPA Method 5035’s inability to extract analytes that reside deep within the rock matrix.
3.8. Evaluation of the Impact of Field Preservation
To evaluate how field preservation influences TCE recovery, a series of samples were collected at depths comparable to those of non-preserved shake-flask samples. These samples were processed identically to the non-preserved controls, with one modification: after crushing, each sample was transferred to a vial containing 15 mL of methanol. The methanol volume was selected as the minimum required to fully submerge all rock fragments. Insufficient immersion would increase the risk of sample loss, whereas excess methanol would dilute the TCE and raise the detection limit.
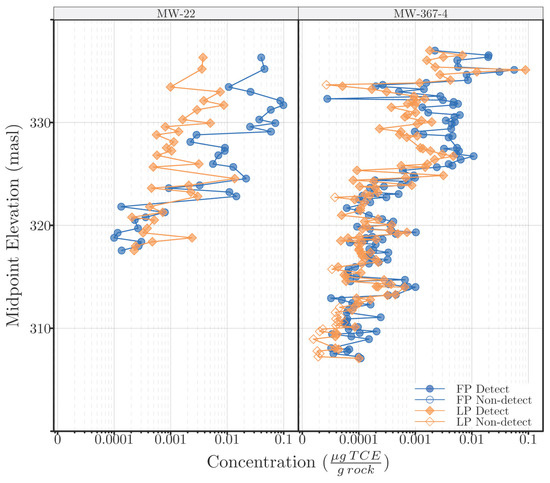
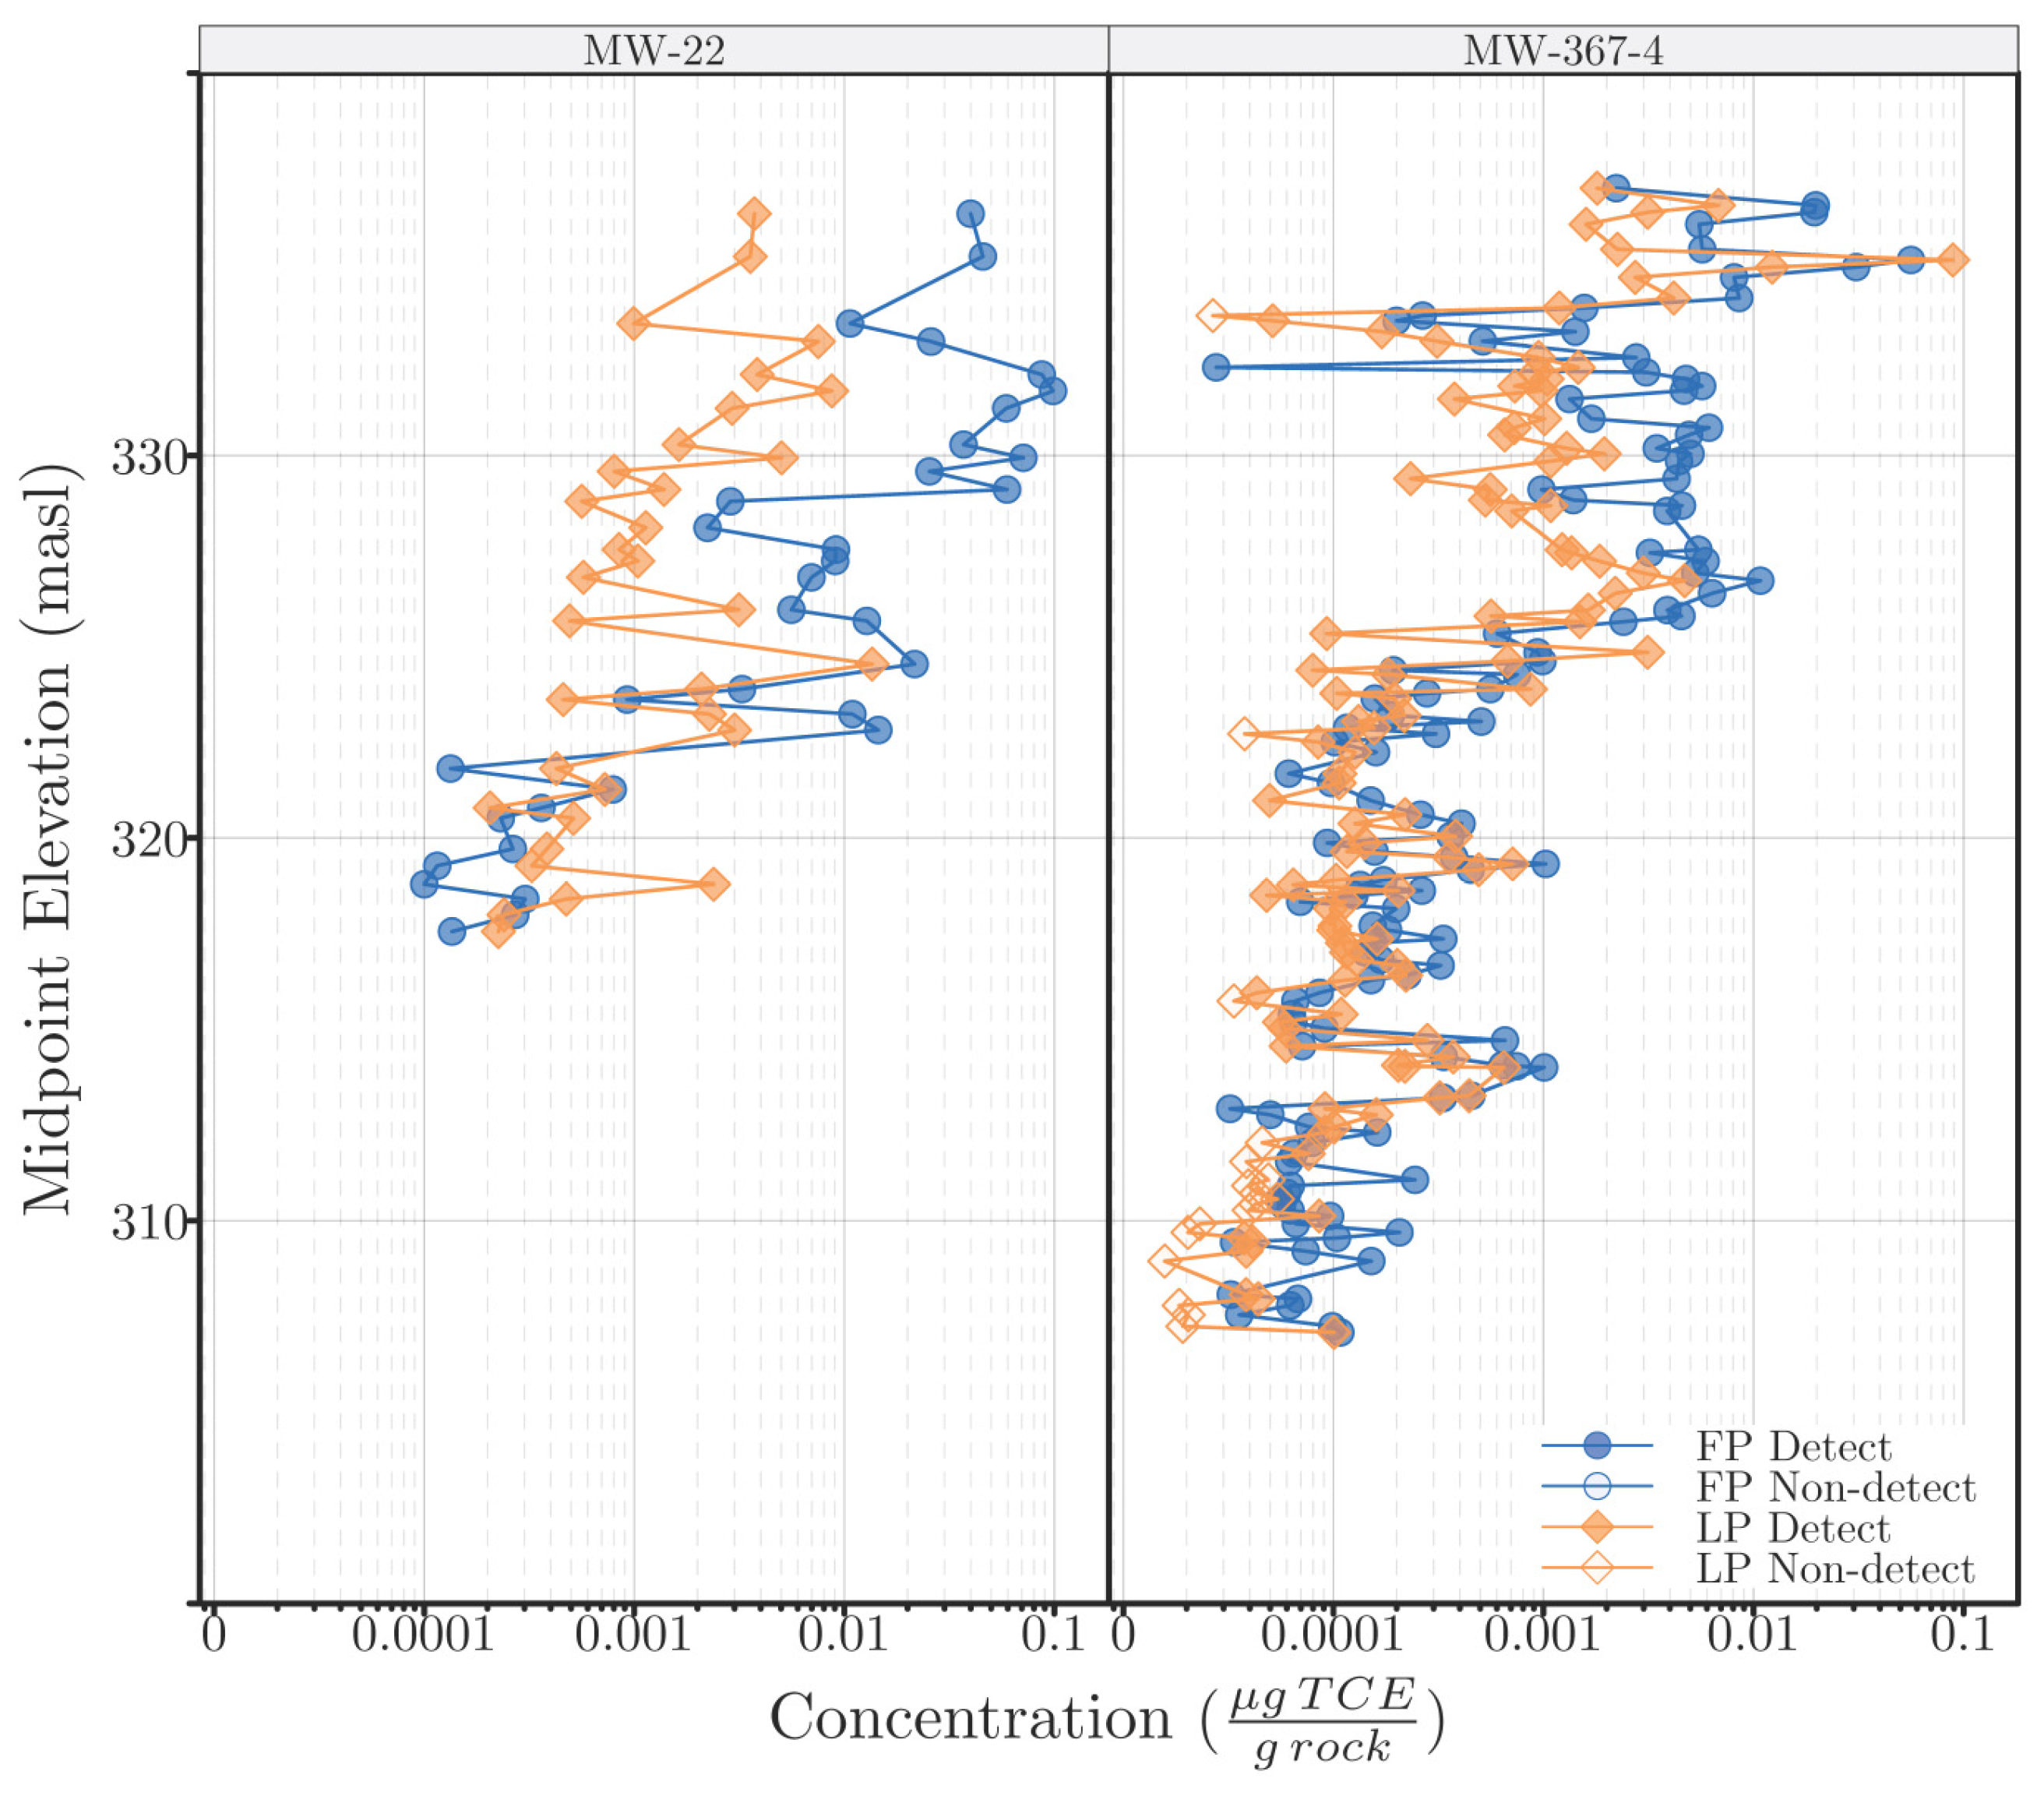
Samples collected and preserved in the field showed markedly higher concentrations of TCE than samples that were not preserved, as illustrated in Figure 4. The magnitude of losses appears to increase for higher concentration samples, reaching a full order of magnitude difference or more. These findings indicate that field preservation is necessary to minimize the loss of volatiles even in low-permeability samples. Therefore, analysis of samples without field preservation should not be considered quantitative.
Figure 4.
TCE contamination depth profiles of field-preserved (FP) and lab-preserved (LP) samples of two rock cores, processed by the shake-flask extraction method. The concentrations obtained for LP samples were generally lower than those of FP samples, signifying the necessity of field preservation. No non-detects were found for the field-preserved samples.
4. Conclusions
Extraction is often the rate-limiting step in the processing of low-permeability media such as rock, and can require extended periods of time to complete. In this research, an MAE method was developed and optimized for the rapid extraction of TCE from dolostone rock samples with an average porosity of 0.096. Rock samples were added to methanol contained in MAE vessels, which were then irradiated in the microwave system for 40 min at 120 °C. To evaluate performance, the MAE method was compared to shake-flask extraction by analyzing over 400 split samples. Statistical analysis of the results demonstrated that MAE achieved equal or better extraction efficiency and analyte recovery relative to shake-flask extraction. Furthermore, the standard US EPA method for sediment samples did not extract amounts of the analytes sufficient for quantitation, with elevated detection limits compared to regulatory standards.
The study also examined the impact and necessity of field preservation. A set of field-preserved samples was compared to samples transported to the laboratory without preservation. Both sets were processed by shake-flask extraction and analyzed by GC. Results showed substantially lower recoveries for the non-preserved samples, indicating significant volatile losses. Therefore, despite the logistical convenience of avoiding preservation in the field, data from non-preserved samples should not be considered quantitative due to the high likelihood of VOC loss.
Overall, the method has proven highly effective in improving both the efficiency and reliability of VOC analysis. This improved performance enables faster remediation decisions and reduces analytical uncertainty in risk assessments. However, it is important to note that rock lithology and the nature of the analytes strongly influence MAE performance, and further validation may be required for other analytes and rock types. Moreover, if the method is applied to other organic compounds, their stability under microwave irradiation must be investigated.
Supplementary Materials
The following supporting information can be downloaded at: https://www.mdpi.com/article/10.3390/separations13020049/s1, Table S1: TCE determination results for split samples, processed by MAE and shake-flask extraction method.
Author Contributions
Conceptualization, T.G. and B.P.; methodology, Y.L., J.K., T.G. and B.P.; software, Y.L. and J.K.; validation, Y.L. and T.G.; formal analysis, Y.L. and M.G.; investigation, Y.L., M.G. and J.K.; resources, B.P. and T.G.; data curation, Y.L. and J.K.; writing—original draft preparation, Y.L., J.K. and M.K.; writing—review and editing, T.G. and B.P.; visualization, J.K.; supervision, B.P. and T.G.; project administration, B.P. and T.G.; funding acquisition, T.G. and B.P. All authors have read and agreed to the published version of the manuscript.
Funding
This research was funded by Natural Sciences and Engineering Council of Canada (NSERC) and the University Consortium for Field Focused Groundwater Contamination Research.
Data Availability Statement
Data is contained within the article or Supplementary Materials.
Acknowledgments
Restek is gratefully acknowledged for continuous support of the research.
Conflicts of Interest
The authors declare no conflicts of interest.
Abbreviations
The following abbreviations are used in this manuscript:
| EPA | Environmental Protection Agency |
| MAE | Microwave-Assisted Extraction |
| NSERC | Natural Sciences and Engineering Council of Canada |
| PFE | Pressurized Fluid Extraction |
| SFE | Super-critical Fluid Extraction |
| TCE | Trichloroethylene |
| VOC | Volatile Organic Compound |
References
- Hedon, J.L. Photochemical Smog: Contribution of Volatile Organic Compounds; OECD: Paris, France, 1982; ISBN 978-92-64-12297-0. [Google Scholar]
- Stroo, H.F.; Unger, M.; Ward, C.H.; Kavanaugh, M.C.; Leeson, A.; Marqusee, J.A.; Smith, B.P. Remediating Chlorinated Solvent Source Zones. Environ. Sci. Technol. 2003, 37, 224A–230A. [Google Scholar] [CrossRef] [Scilit] [PubMed]
- Parker, B.L.; Chapman, S.W.; Cherry, J.A. Plume Persistence in Fractured Sedimentary Rock after Source Zone Removal. Groundwater 2010, 48, 799–808. [Google Scholar] [CrossRef] [Scilit]
- West, M.R.; Kueper, B.H. Plume Detachment and Recession Times in Fractured Rock. Groundwater 2010, 48, 416–426. [Google Scholar] [CrossRef] [Scilit] [PubMed]
- Goode, D.J.; Imbrigiotta, T.E.; Lacombe, P.J. High-Resolution Delineation of Chlorinated Volatile Organic Compounds in a Dipping, Fractured Mudstone: Depth- and Strata-Dependent Spatial Variability from Rock-Core Sampling. J. Contam. Hydrol. 2014, 171, 1–11. [Google Scholar] [CrossRef] [Scilit]
- Parker, B.L.; Cherry, J.A.; Chapman, S.W. Discrete Fracture Network Approach for Studying Contamination in Fractured Rock. AQUA Mundi 2012, 3, 101–116. [Google Scholar]
- Hewitt, A.D. Comparison of Sample Preparation Methods for the Analysis of Volatile Organic Compounds in Soil Samples: Solvent Extraction vs Vapor Partitioning. Environ. Sci. Technol. 1998, 32, 143–149. [Google Scholar] [CrossRef] [Scilit]
- Askari, M.D.F.; Maskarinec, M.P.; Smith, S.M.; Beam, P.M.; Travis, C.C. Effectiveness of Purge-and-Trap for Measurement of Volatile Organic Compounds in Aged Soils. Anal. Chem. 1996, 68, 3431–3433. [Google Scholar] [CrossRef] [Scilit]
- Górecki, T.; Liu, Y.; Parker, B.; Górecka, M. Determination of Trichloroethylene in Rock Samples Using Microwave-Assisted Extraction and Cool On-Column Injection. In Proceedings of the North American Environmental Field Conference & Exposition, Tampa, FL, USA, 12 January 2010. [Google Scholar]
- Dincutoiu, I.; Górecki, T.; Parker, B.L. Microwave-Assisted Extraction of Trichloroethylene from Clay Samples. Int. J. Environ. Anal. Chem. 2006, 86, 1113–1125. [Google Scholar] [CrossRef] [Scilit]
- Wu, C.; Schaum, J. Exposure Assessment of Trichloroethylene. Environ. Health Perspect. 2000, 108, 359–363. [Google Scholar] [CrossRef] [Scilit]
- Hurley, J.C. Rock Core Investigation of DNAPL Penetration and Persistence in Fractured Sandstone; University of Waterloo: Waterloo, ON, Canada, 2003. [Google Scholar]
- Lojkasek-Lima, P.; Bertolo, R.; Pino, D.S.; Fregona, L.; Hirata, R.; Aravena, R.; Parker, B.L. Chlorinated Ethenes Characterization Using High-Resolution Rock Core Analysis in a Weathered Crystalline Rock Aquifer in São Paulo, Brazil. Environ. Earth Sci. 2023, 83, 28. [Google Scholar] [CrossRef] [Scilit]
- Sparr Eskilsson, C.; Björklund, E. Analytical-Scale Microwave-Assisted Extraction. J. Chromatogr. A 2000, 902, 227–250. [Google Scholar] [CrossRef] [Scilit] [PubMed]
- Heemken, O.P.; Theobald, N.; Wenclawiak, B.W. Comparison of ASE and SFE with Soxhlet, Sonication, and Methanolic Saponification Extractions for the Determination of Organic Micropollutants in Marine Particulate Matter. Anal. Chem. 1997, 69, 2171–2180. [Google Scholar] [CrossRef] [Scilit] [PubMed]
- Northcott, G.L.; Jones, K.C. Experimental Approaches and Analytical Techniques for Determining Organic Compound Bound Residues in Soil and Sediment. Environ. Pollut. 2000, 108, 19–43. [Google Scholar] [CrossRef] [Scilit] [PubMed]
- Dincutoiu, I.; Górecki, T.; Parker, B.L. A Novel Technique for Rapid Extraction of Volatile Organohalogen Compounds from Low Permeability Media. Environ. Sci. Technol. 2003, 37, 3978–3984. [Google Scholar] [CrossRef] [Scilit]
- Zhang, P.; Ge, L.; Zhou, C.; Yao, Z. Evaluating the Performances of Accelerated-Solvent Extraction, Microwave-Assisted Extraction, and Ultrasonic-Assisted Extraction for Determining PCBs, HCHs and DDTs in Sediments. Chin. J. Oceanol. Limnol. 2011, 29, 1103–1112. [Google Scholar] [CrossRef] [Scilit]
- Fouial-Djebbar, D.; Ahmed, A.Y.B.-H.; Budzinski, H. Determination of Organochlorine Compounds in Coastal Marine Sediments from the Southern West of the Mediterranean Sea. Int. J. Environ. Sci. Technol. 2010, 7, 271–280. [Google Scholar] [CrossRef] [Scilit]
- Guo, L.; Lee, H.K. Microwave Assisted Extraction Combined with Solvent Bar Microextraction for One-Step Solvent-Minimized Extraction, Cleanup and Preconcentration of Polycyclic Aromatic Hydrocarbons in Soil Samples. J. Chromatogr. A 2013, 1286, 9–15. [Google Scholar] [CrossRef] [Scilit]
- Naeeni, M.H.; Yamini, Y.; Rezaee, M.; Seidi, S. Microwave-Assisted Extraction Combined with Dispersive Liquid–Liquid Microextraction as a New Approach to Determination of Chlorophenols in Soil and Sediments. J. Sep. Sci. 2012, 35, 2469–2475. [Google Scholar] [CrossRef] [Scilit]
- Sanchez-Prado, L.; Garcia-Jares, C.; Llompart, M. Microwave-Assisted Extraction: Application to the Determination of Emerging Pollutants in Solid Samples. J. Chromatogr. A 2010, 1217, 2390–2414. [Google Scholar] [CrossRef] [Scilit]
- Sanchez-Prado, L.; Garcia-Jares, C.; Dagnac, T.; Llompart, M. Microwave-Assisted Extraction of Emerging Pollutants in Environmental and Biological Samples before Chromatographic Determination. TrAC Trends Anal. Chem. 2015, 71, 119–143. [Google Scholar] [CrossRef] [Scilit]
- Teo, C.C.; Chong, W.P.K.; Ho, Y.S. Development and Application of Microwave-Assisted Extraction Technique in Biological Sample Preparation for Small Molecule Analysis. Metabolomics 2013, 9, 1109–1128. [Google Scholar] [CrossRef] [Scilit]
- Dean, J.R.; Cresswell, S.L. Chapter 17 Extraction Techniques for Solid Samples. In Comprehensive Analytical Chemistry; Elsevier: Amsterdam, The Netherlands, 2002; Volume 37, pp. 559–586. ISBN 978-0-444-50510-1. [Google Scholar]
- Hatzinger, P.B.; Alexander, M. Effect of Aging of Chemicals in Soil on Their Biodegradability and Extractability. Environ. Sci. Technol. 1995, 29, 537–545. [Google Scholar] [CrossRef] [Scilit]

Disclaimer/Publisher’s Note: The statements, opinions and data contained in all publications are solely those of the individual author(s) and contributor(s) and not of MDPI and/or the editor(s). MDPI and/or the editor(s) disclaim responsibility for any injury to people or property resulting from any ideas, methods, instructions or products referred to in the content. |
© 2026 by the authors. Licensee MDPI, Basel, Switzerland. This article is an open access article distributed under the terms and conditions of the Creative Commons Attribution (CC BY) license.