Abstract
Water pollution from pharmaceutical and textile industries urgently requires effective treatment solutions due to environmental and health risks. Effective treatment methods are desperately needed for water pollution from the textile and pharmaceutical industries because of the dangers to the environment and human health. To treat these micropollutants, the optimized granular activated carbon (OGAC) produced from olive fruit stones was utilized as an adsorbent in this study. The central composite design (CCD) of response surface methodology (RSM) was statistically used to optimize the operating factors for rhodamine B (RhB) and thiamphenicol (THI) removal efficiency on the optimized granular activated carbon. This study evaluated the influence of factors such as the solution’s pH, initial RhB and THI concentration, and OGAC dose, along with their interactions to model outcomes and determined optimal adsorption conditions on OGAC. The adsorption kinetic data will be analyzed using the intra-particle diffusion, pseudo-second-order, and pseudo-first-order models. Equilibrium data will be analyzed using the Langmuir, Freundlich, Temkin, and Dubinin–Radushkevich isotherms. The adsorption thermodynamics of the various systems under investigation will also be examined. Finally, a study on OGAC regeneration has been conducted. Results showed that THI and RhB removal is primarily influenced by pH, initial pollutant concentration, and dose. RSM indicated the optimal adsorption parameters for THI and RhB on OGAC as pH = 5.7, an initial concentration of C0 = 2.5 mg/L, and a dose of 6 g/L. The kinetic study revealed that THI and RhB retention on OGAC generally follows a pseudo-second-order kinetic model, indicating chemisorption as the primary mechanism controlling adsorption. The adsorption isotherm data analysis showed that chemisorption has a significant role in the THI and RhB adsorption process on OGAC. Furthermore, thermodynamic parameters suggest that THI adsorption on OGAC is exothermic, while RhB adsorption is endothermic. Activated carbon regeneration tests demonstrated its cost-effectiveness, and activated carbon was successfully regenerated over three cycles, achieving efficiencies of 62.39% for RhB and 59.6% for THI. These results demonstrate that the studied OGAC is an effective adsorbent for THI and RhB removal.
1. Introduction
Numerous trace organic contaminants, also known as micropollutants (MPs), have been found in drinking water sources and completed drinking waters, as a result of recent advancements in analytical techniques [1]. Urban and agricultural land runoff, as well as wastewater discharges from industries and municipalities are examples of MP sources. According to Snyder et al. [2], certain MPs are recognized or suspected endocrine disrupting substances that can be harmful to the public’s health even at trace levels of ng/L to low μg/L [3].
The world economy has been developing continuously, which has contributed to the development of many different substances necessary for industry, agriculture, and the health of people and animals [4,5]. However, whether these chemicals are new or have been in use for years, their uncontrolled disposal has had a major negative influence on the environment, affecting soil, water, and air [6]. Furthermore, aquatic ecosystems have been exposed to significant amounts of toxic compounds, particularly organic pollutants, as a result of the changes brought about by the previous decades’ fast industrialization and urbanization. The primary sources of these pollutants include waste from hospitals as well as the textile, dyeing, and pharmaceutical sectors, and other manufacturing facilities. These pollutants pose a major danger to the ecosystem and human health [7]. Over two million tons of wastewater are thought to be released into the environment every day, which exacerbates the issue of water pollution in many nations without efficient treatment plants [6]. The most common organic contaminants found in aquatic ecosystems were organic dyes and pharmaceutical residues [8].
Rhodamine B is a xanthene dye that occurs as dark green crystals. It is commonly used as a dye in the textile and food industries (it was later banned by the European Food Safety Authority (EFSA) due to safety concerns [9]) and a fluorescent tracer in water to assess underground rivers’ flow speed and direction [10]. When ingested, it is harmful, irritating the respiratory tract and skin, and can lead to severe eye damage upon contact. It can cause severe eye injury if it comes into contact with the eyes [11,12]. Additionally, rhodamine B has potential genotoxic, neurotoxic, and carcinogenic effects. The mutagenic effects of rhodamine B on animals, bacteria, and insects are well-established [13]. Experimental studies on animals have also demonstrated that rhodamine B can induce reproductive and tumor consequences [14,15]. Because rhodamine B is challenging to remove from water and poses neurotoxic and chronic poisoning risks, it requires treatment before wastewater containing it can be released into aquatic environments [16]. Thiamphenicol (THI) is a common antibiotic drug used to control bacterial illnesses and is used in aquaculture and animal husbandry [17]. However, the negative effects of THI, such as its hematotoxicity, embryotoxicity, and potent immunosuppressive activity, affects how well plant microbes function physiologically and in animals [18]. Additionally, THI may infiltrate surface water and wastewater through rain runoff, wastewater discharge, and animal metabolism, which readily produces toxicity in humans and the environment via the food chain [19]. Treated wastewater, containing pharmaceuticals, biocides, and industrial compounds, poses health risks when used for irrigation due to the presence of new pollutants at levels hazardous to health. These substances can be absorbed into plant roots, stems, leaves, and fruits. For example, thiamphenicol was found in treated wastewater at levels less than 0.02 μg/L. Since treated effluents can seep into groundwater, mixing with it, the presence of pharmaceutical residues could threaten the health of humans and animals consuming this water [20]. Thus, to remove THI from water, a practical and very efficient technique is required. To remove contaminants from water, a variety of treatment methods have been developed, including advanced oxidation [21], membrane technology [22], biodegradation [23], and adsorption [24]. Adsorption is cost-effective and relatively simple to use [25,26,27,28]. The adsorption process uses ecologically benign and cost-effective biomass, such as agricultural waste as the adsorbent [29]. Employing the adsorption approach, micropollutants are removed from polluted water through the adsorbent’s surface [30]. As an efficient adsorbent for removing trace contaminants, granular activated carbon (GAC) has been reported to have higher porosity, a high specific surface area, environmental friendliness, availability, simplicity of regeneration, and thoroughly investigated use, GAC is one of the most effective and widely utilized adsorbents. Its extremely affordable cost is another benefit, particularly when made from agricultural waste such as olive fruit stones [31], peach stones [32], palm date pits [33], biochar [34], and materials formed from sludge [35].
The principal objective of this paper is to investigate the two micropollutants, RhB dye and THI drug, on optimized granular activated carbon (OGAC) from water in a batch process. The optimal operating conditions for RhB and THI elimination efficiency were identified using numerical optimization of the central composite design (CCD) of response surface methodology (RSM). Parametric studies on the adsorption of THI and RhB, including pH, initial pollutant concentration, and adsorbent/adsorbate dose, were conducted. Organic micropollutant adsorption was studied through kinetics, isotherms and thermodynamic, and a regeneration study of the OGAC was also performed. Furthermore, the adsorption mechanism was investigated, considering the interactions between the functional groups of OGAC and the ionized forms of THI and RhB under different pH conditions, highlighting the main adsorption pathways.
2. Materials and Methods
2.1. Materials
2.1.1. Adsorbent
The study used granular activated carbon (OGAC) derived from olive fruit stones, which was optimized using response surface methodology using a central composite design. The ideal parameters for this optimized granular activated carbon were a weight ratio of 74.52% phosphoric acid, a solid–liquid ratio of 1:2, a temperature of 550 °C with a heating rate of 10 °C/min, and an activation time of 120 min [31].
2.1.2. Adsorbate
The pharmaceutical and textile industries are considered industrial activities that damage the environment with their discharges, causing toxicological issues. To mitigate these impacts, the study evaluated the performance of OGAC produced from agricultural waste. THI and RhB dye were selected as the primary chemical model pollutants in this context. Table 1 describes the adsorbates’ properties.

Table 1.
Physicochemical characteristics of the THI drug and RhB dye [12,36].
2.2. Methods
2.2.1. Adsorption Study
Response Surface Methodology
The optimal operating conditions for RhB and THI elimination efficiency were identified using numerical optimization of the central composite design (CCD) of response surface methodology (RSM). In this work, three independent variables were investigated: solution pH (X1), initial pollutant concentration (X2), and OGAC dose (X3). The CCD was used to analyze the interactions between the independent factors impacting adsorption. It is also used to statistically examine data generated by the RSM’s multivariate nonlinear model.
This study examined three independent variables, with the center point set into three runs. This results in 17 trial runs proposed by the CCD of the JMP11 program. Table 2 depicts the values of the independent variables assigned at the lower and higher levels.
Table 2.
Coded variables and levels considered for THI and RhB removal by OGAC.
Aqueous pollutant solutions were prepared by diluting a concentrated solution ([pollutant] = 1 g/L). The stock solutions were kept in a refrigerator.
Adsorption studies were conducted in a batch reactor by agitating the aqueous solutions of THI and RhB (50 mL) for 145 and 120 min, respectively. We investigated the impact of significant variables influencing pollutant adsorption capability, including pH, initial pollutant concentration, and OGAC mass.
The supernatant concentration of the RhB dye and the THI solutions after adsorption was determined using a calibration curve on a UV-visible absorption spectrophotometer.
The experiments were carried out by the design for the three factors, corresponding to 17 experiments for each pollutant and trials were conducted according to the design matrix. It illustrates fixing factors at different levels, as illustrated in Table 3.
Table 3.
CCD’s experiment matrix of the RhB and THI adsorption on OGAC.
Adsorption Experimental Protocols
- Adsorptionkinetics
Adsorption kinetics studies for the two solutes employed on OGAC were performed using an initial adsorbate concentration, adsorbent dose, and solution pH determined via design optimization. To determine when the adsorption equilibrium is reached, 6 g/L of OGAC was added to the THI and RhB solutions at an initial concentration of 2.5 mg/L, with the solutions’ pH set to precisely 5.7. Samples are collected every ten minutes and centrifuged. Absorbance is determined using a UV-visible spectrophotometer at the wavelength closest to each contaminant’s absorption maximum (225 nm for THI (in acidic medium of THI, 223 nm was used) and 553 nm for RhB).
Adsorption capacity is typically measured in milligrams of pollutant absorbed per gram of adsorbent. The adsorption yield of THI and RhB, represented by , or the quantity adsorbed, represented by (mg/g), were used to measure the change in adsorption efficiency. The adsorption’s quantity and the adsorption’s yield were calculated using the following relationships:
where m is the OGAC’s mass (g), V is the solution’s volume (L), and and are the initial and final concentrations (mg/L), respectively.
The kinetic investigation offers insights into the adsorption mechanism by evaluating the variation in the amount of solute adsorbed onto a solid substrate over time. The limiting stage or stages that regulate the adsorption process may be determined using a variety of kinetic models, including the first-order model, the second-order model, and the intra-particle diffusion model [37].
Kinetics equations of pseudo-first-order (3) [38,39], pseudo-second-order (4) [40,41], and the intra-particle diffusion model (5) [42] were used in this study:
K1 (min−1) and (g·mg−1·min−1) represent the pseudo-first-order and pseudo-second-order speed constants, respectively. is the adsorption rate constant for intra-particle diffusion (mg·g−1·min−1/2), is the adsorption amount at equilibrium (mg/g), is the adsorption amount at time t in mg/g, is the contact time in minutes and indicates the thickness of the boundary layer.
Several statistical error functions, such as the average relative error (ARE) (6), sum of squares error () (7), normalized standard deviation () (8), and chi-square test () (9), were used to assess the kinetic models’ correctness [43,44]. The following is an expression for these functions:
where is the experimental adsorption capacity in mg/g, is the adsorption capacity calculated by the model in mg/g, and is the total number of experimental data points.
- Adsorption isotherms
The adsorption isotherms of pollutants on OGAC were investigated by fixing the adsorbent’s mass and the solution’s pH obtained through design optimization and adding them to a 50 mL volume of each adsorbate (THI and RhB) with concentrations between 5 and 22.5 mg/L. The mixture was agitated (200 revolutions/min) at room temperature (25 ± 07 °C) for 145 and 120 min, respectively, for THI and RhB in a batch reactor. Using UV-visible spectrophotometry, the filtrates’ residual concentration was ascertained following liquid–solid (pollutant-OGAC) separation via centrifugation (3500 rpm for 15 min) at the maximum absorption wavelengths indicated in Table 1 for the two organic adsorbates (THI and RhB).
Several isotherm models have been applied to our experimental results, to describe the phenomenon of THI and RhB adsorption on OGAC, such as Langmuir (10) [45], Freundlich (11) [46,47], Dubinin–Radushkevich (12) [48], and Temkin (13) [49]:
where is the amount of adsorption by the substance in mg/g, is the concentration of the pollutant in mg/L, Qm is the maximum amount of adsorbate adsorbed on the surface of the adsorbent while it is in equilibrium in mg/g, is the Langmuir constant, is an empirical constant that correlates with the binding capability of the adsorbate, and n is a constant that describes the affinity between the adsorbate and the adsorbent surface. ɛ stands for potential energy, T is the temperature (°K), and B is Temkin’s constant with is reported in milligrams per gram, KT is in (L/mg) and is in (J/mol). With ɛ = RT ln(1 + ), when the adsorbate is moved from the solution to the solid’s surface, the mean free energy E of adsorption per molecule is provided by the Dubinin–Radushkevich isotherm model constant, represented by β, which is linked to adsorption capacity. The following formula can be used to calculate it: [29].
Ln Qe = Ln Qm − β·ɛ2
Qe = B Ln(KT · Ce)
- Thermodynamic study
The influence of temperature was investigated throughout a range of 30 °C to 50 °C by fixing the adsorbent dose (dose = 6 g/L), the solution’s pH (pH = 5.7), and the THI and RhB initial concentrations (2.5 mg/L) acquired during design optimization. To ensure a constant temperature, this experiment was conducted in a thermostat bath. Using a magnetic stirrer, the mixture was stirred at 300 rpm for 145 min for THI and 120 min for RhB. The thermodynamic study aims to clarify the spontaneity of the adsorption reaction and if this reaction is exothermic or endothermic and to validate the nature of the reaction studied adsorption, by calculating the variations in standard free enthalpy , standard entropy , and standard enthalpy , based on the following relationships (14)–(16) [50].
where is the absolute temperature (°K), is the equilibrium constant, and is the ideal gas constant of 8.31 J/(mol·K).
- Optimized granular activated carbon desorption and regeneration
A desorption and regeneration experiment was carried out to investigate the prospects for pollution removal and reuse of the OGAC. Optimized granular activated carbon regeneration was carried out on OGAC saturated with THI and RhB. To carry out thermal regeneration, samples of OGAC were placed in a crucible with a cover in an anoxic environment at 600 °C for one hour, under a heating rate of 10 °C/min.
3. Results and Discussion
3.1. Adsorption of Organic Micropollutants on OGAC: Response Surface Methodology
3.1.1. Experimental Matrix
The following experimental matrix (Table 4) displays the central composite design tests’ operating conditions and the THI and RhB molecules’ adsorption efficiencies on the OGAC.
Table 4.
Experimental responses for THI and RhB adsorption in the experimental matrix of the central composite design.
To identify the distinctive characteristics of the polynomial model used for the adsorption system under study, the JMP11 program analyzed the results obtained for the organic micropollutants adsorption (THI and RhB) on the OGAC (Table 4).
3.1.2. Statistical Results
Variance Analysis
The method known as analysis of variance (ANOVA) is used to examine how qualitative factors affect one or more response variables. The accompanying p-value indicates the probability of a significant impact. Coefficients in the model can be considered significant if the p-value is below 5% [51,52,53,54]. The p-values for THI and RhB adsorption on OGAC are less than 0.05, with p-values (OGAC/THI) = 0.0051 and (OGAC/RhB) = 0.0033, respectively. Based on the analysis of variance (ANOVA) results displayed in Table 5, the model is significant as it is less than 5%. This suggests the validity of the central composite design for this investigation.
Table 5.
Variance analysis of the adsorption of THI and RhB on OGAC.
Determination Coefficients
R squared reports the fraction of response variability that can be explicated by the model. With values ranging from zero to one, it represents the model’s quality. A correlation between the experimental and model-calculated data are shown if it is around one. The model is unable to describe the phenomena being studied if it equals zero. Figure 1 provides the R2 values for the adsorption of THI and RhB on OGAC.
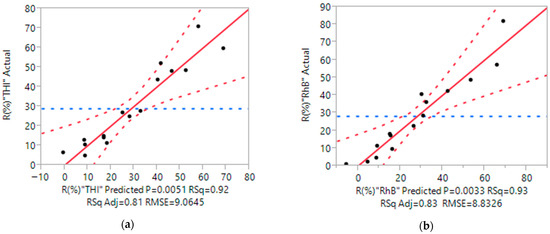
Figure 1.
Correlation coefficients for THI (a) and RhB (b) removal on OGAC.
Figure 1 demonstrates a perfectly straight line formed by the observed versus predicted values. RhB and THI adsorption on OGAC have coefficients of determination that are almost equal to one with R2 (THI) = 0.92 and R2 (RhB) = 0.93. These numbers show that the experimental values and the values forecasted by the chosen design planning are reasonably compatible. The model has high significance, as evidenced by the strong adjusted coefficients of determination (R2adj(THI) < R2(THI) and R2adj(RhB) < R2(RhB)).
Residual Analysis
The residue represents the variation between empirically measured values and those predicted by the model. Comparing residuals to experimental yields is known as residual analysis. The model’s quality is assessed using these residuals, as seen in Figure 2.
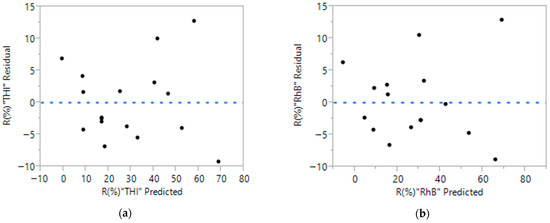
Figure 2.
Residual THI (a) and RhB (b) removal yields by OGAC as a function of predicted yields.
The residue values for the two organic micropollutants’ adsorption on OGAC are displayed in Figure 2. The residue graphs are dispersed randomly over space, demonstrating the model’s acceptance and its ability to adequately represent the phenomenon studied. In other words, the second-degree model’s ability to illustrate the experimental results of the conducted study well.
Estimated Parameters
We identified the most significant parameters affecting the adsorption process of THI and RhB on OGAC by examining the p-values of each studying factor. The associated parameter’s influence on the decontamination effectiveness is indicated by a p-value of less than 0.05, whilst a value larger than 0.05 suggests that the parameter does not affect the phenomenon’s efficiency. Table 6 displays the results that were collected.
Table 6.
Estimated parameters of the THI and RhB removal using OGAC.
Table 6 demonstrates that the pH, concentration, dosage, and the double concentration–concentration interaction are statistically significant for the elimination of THI by OGAC. The p-values for THI decontamination are as follows: p-value (pH) = 0.049; p-value [THI] = 0.0007; p-value (Dose) = 0.0021; and p-value [THI] × [THI] = 0.0112. For RhB elimination the pH, concentration, and dosage are statistically significant and their p-values are p-value (pH) = 0.04, p-value [RhB] = 0.0001, and p-value (Dose) = 0.016. The other interaction parameters have no impact on this investigation since their p-values are higher than 0.05. Following these findings, the yield equations for this study may be expressed as a function of the three factors’ levels. The mathematical models for the THI and RhB adsorption investigation on OGAC are shown in Equations (17) and (18).
YTHI/OGAC = 17.06 − 6.39X1 − 15.47X2 + 12.76X3 + 12.76X2X2
YRhB/OGAC = 31.11 − 6.73X1 − 20.53X2 + 8.33X3
Parameter Optimization of the THI and RhB Adsorption on OGAC
Parameter optimization aims to realize the optimum regulation of parameters to maximize adsorption efficiency. Stated differently, our goal is to find the ideal conditions that result in better yields while removing the greatest amount of pollutants and using the least amount of adsorbent material. Each response’s desirability is added together to create the global desirability function, which we employ. In Figure 3, the global desirability function is displayed.
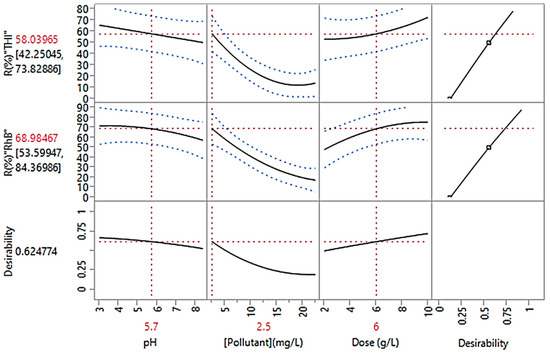
Figure 3.
Prediction profiler for the adsorption of organic micropollutants on OGAC.
The results from Figure 3, obtained using the prediction profiler for the adsorption of organic micropollutants on OGAC, indicate the following:
The removal efficiency is proportional to the adsorbent dose, which explains why when the adsorbent dose increased, it enhanced the availability of active adsorption sites. This is because of the study’s granulometry selection.
The removal efficiency is proportional to the adsorbent dose which explains the increase in adsorbent dosage with the increase in active sites.
Adsorbate concentrations are inversely related to removal efficiency, with the maximum efficiency observed at the lowest concentrations. Optimal efficiency is achieved by lowering the solution’s pH to precisely 5.7.
The following conditions should be applied to achieve maximum removal efficiencies of 70.83% and 81.9% for THI and RhB adsorption, respectively: pH = 5.7, dose = 6 g/L, and pollutant concentration = 2.5 mg/L.
3.2. Adsorption Study
3.2.1. Kinetic Study
The analysis of kinetics reveals the adsorption mechanism, which indicates the process’s effectiveness. For the removal of THI and RhB by OGAC, respectively, Figure 4 and Figure 5 show the adsorbed amount and the removal efficiency as a function of contact time.
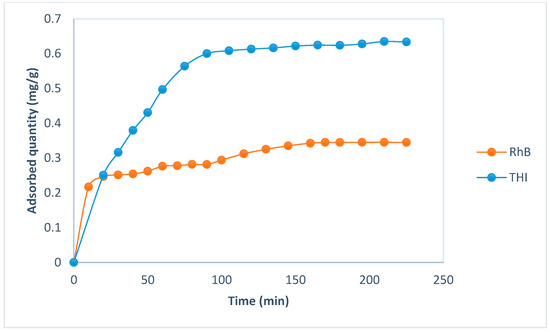
Figure 4.
Adsorbed quantity of the THI and RhB adsorption on OGAC.
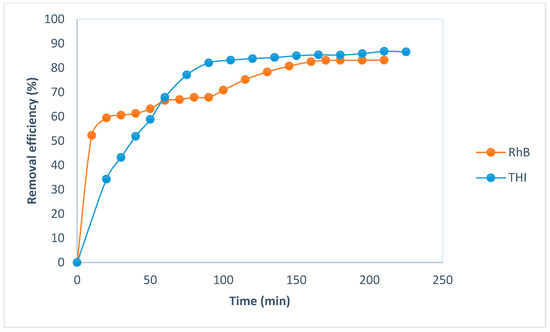
Figure 5.
Removal efficiency the adsorption of THI and RhB on OGAC.
Similar patterns can be seen in the curves in Figure 4 and Figure 5, which both exhibit an immediate rise in adsorption yield in the first few minutes (between 0 and 20 min) and then a gradual increase until equilibrium is achieved (teq(RhB) = 145 min; teq(THI) = 120 min). The reason for the rapid adsorption kinetics in the first few minutes of adsorption is that there are considerably more active sites on the OGAC surface at the initial phase of adsorption than after a certain time [55]. Compared to RhB, OGAC adsorbs THI at a substantially faster rate.
Kinetic Models
The adsorption mechanism and the method by which solutes are moved from the solution to the solid surface are revealed by the kinetic analysis of adsorption processes. It is possible to describe a material’s adsorption kinetics, similar to adsorption equilibrium. The kinetic curves derived from modeling using the three kinetic models studied and the experimental kinetic curve for the adsorption of the micropollutants THI and RhB by OGAC have been compared. The three kinetic models’ parameters were determined by comparing them with the experimental findings of the adsorption kinetics investigation. Based on the depicted curves (Figure 6, Figure 7 and Figure 8), we have determined the parameters of the various kinetic models.
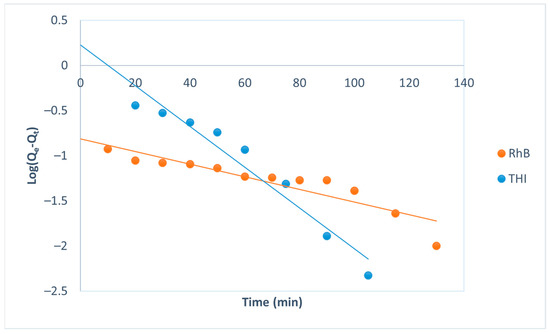
Figure 6.
Pseudo-first-order kinetic model of THI and RhB adsorption on OGAC.
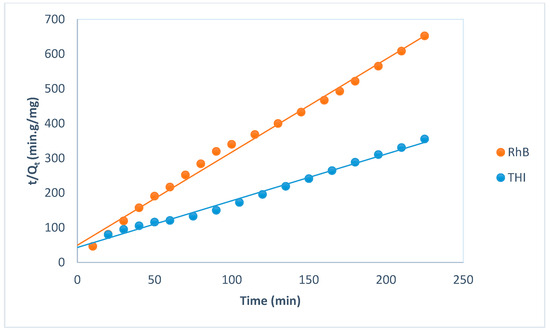
Figure 7.
Pseudo-second-order kinetic model of the THI and RhB adsorption on OGAC.
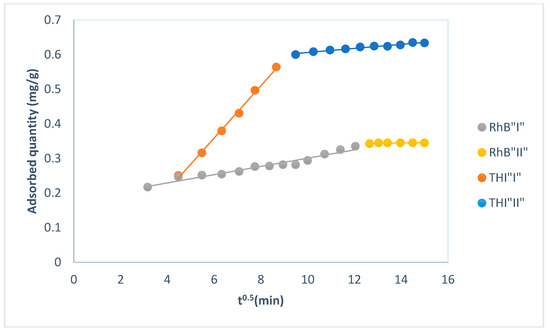
Figure 8.
Intraparticle diffusion kinetic model of THI and RhB adsorption on OGAC.
Using the linear equation for each model, the parameters of the three models studied were determined from equations resulting from Figure 6, Figure 7 and Figure 8. Table 7 provides the data acquired together with the R2 correlation coefficients.
Table 7.
Kinetic constants of THI and RhB adsorption on OGAC.
The pseudo-second-order model is the most significant model to describe the adsorption of THI and RhB micropollutants by OGAC, according to the data obtained, which are displayed in Table 7. The pseudo-second-order model demonstrated relevance to this investigation when compared to the other kinetic models, according to an analysis of the coefficients of determination (R2(THI) = 0.9912 and R2(RhB) = 0.993). The pseudo-second-order model’s equilibrium adsorption capacity values for THI (qecal = 0.74 mg/g) and RhB (qecal = 0.37 mg/g) adsorption closely relate to the experimentally measured values (qeexp(THI) = 0.6 mg/g and qeexp(RhB) = 0.34 mg/g). Thus, we may conclude that chemisorption is primarily responsible for controlling the adsorption process. The work of Li et al. [36], which discovered that the adsorption kinetics of drugs adsorbed by OGAC follow the pseudo-second-order, is supported by these findings. It may be inferred that the exchange between the cations and protons (H+) on the OGAC surface controls the adsorption mechanism. The adsorption process’s kinetics are slow, as shown by the low value of the speed constant K2. The nature of the adsorbent and its physico-chemical and structural characteristics may be responsible for this. In addition to the high determination coefficients, the pseudo-second-order model also presented the lowest statistical error values (ARE = 5.1% for THI and 9.7% for RhB; SSE = 0.013 for THI and 0.052 for RhB; NSD = 0.026% for THI and 0.056% for RhB; χ2 = 0.0067 for THI and 0.025 for RhB), which further confirms its reliability and better fit compared to the pseudo-first-order and intraparticle diffusion models.
Figure 8 presents the experimental findings for the THI and RhB adsorption on OGAC using the intraparticle diffusion model. The first part of the curve represents the rapid diffusion of THI and RhB molecules over the OGAC surface, which indicates adsorption at the external surface. Under these conditions, its temporal development is linear and corresponds to a function of the kind (y = ax + b), where “a” stands for the slope and “b” for the intercept. The last one, the intraparticle diffusion constant (Kd), occurs within the first 90 min of the entire adsorption time for THI and 145 min for RhB. The progressive adsorption stage, which is the second section, illustrates how the diffusion rate decreases as pore filling becomes closer. The duration of this phase is determined as 135 min for THI and 65 min for RhB.
3.2.2. Study of Adsorption Isotherms
An adsorption isotherm investigation was conducted to clarify the adsorption phenomena of THI and RhB molecules on OGAC. Understanding the adsorption mechanism is made much easier with the use of adsorption isotherms [56]. According to Al-Ghouti and Da’ana [56], adsorption isotherms typically include details on adsorbent enhancement, a description of the affinity and binding energy between the adsorbent and the adsorbate, and adsorption capacity. Furthermore, adsorption mode (monolayer or multilayer adsorption) is revealed by the isotherm. This study examined the impact of the initial concentration of micropollutants on the adsorption capacity (qe) of OGAC throughout an initial concentration range of 2.5–22.5 mg/L. Figure 9, Figure 10, Figure 11 and Figure 12 display the adsorption isotherms for THI and RhB adsorption on OGAC.
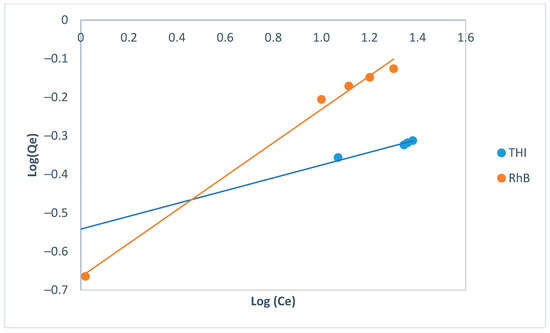
Figure 9.
Adsorption isotherms for THI and RhB using the Freundlich model.

Figure 10.
Adsorption isotherms for THI and RhB using the Langmuir model.
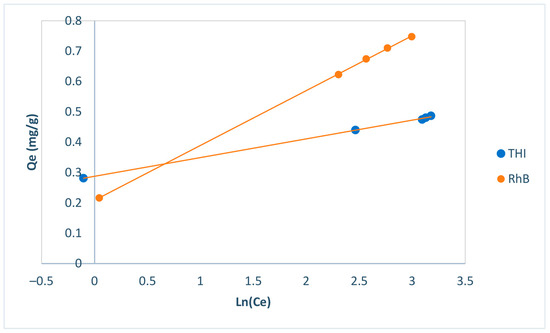
Figure 11.
Adsorption isotherms for THI and RhB using the Temkin model.
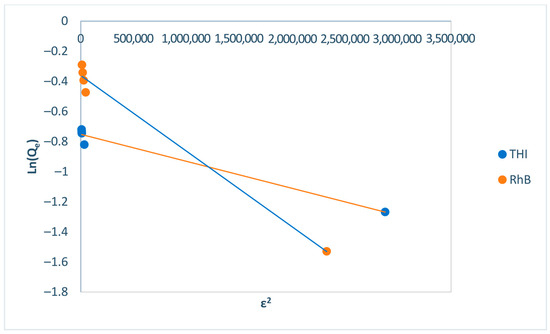
Figure 12.
Adsorption isotherms for THI and RhB using the Dubinin–Radushkevich model.
Numerous laws have described adsorption isotherms, and various models have characterized the processes involved. The Dubinin–Radushkevich, Temkin, Freundlich, and Langmuir models have all been used to evaluate experimental data. Figure 9, Figure 10, Figure 11 and Figure 12 graphically depict the various adsorption isotherms of the pollutants under study, THI and RhB, on OGAC. Table 8 lists the correlation coefficient (R2) and other constant values for the various models based on these figures, which were used to estimate the adsorption parameters from the isotherms.
Table 8.
Characteristic parameters of THI and RhB adsorption isotherms on OGAC.
The Langmuir isotherm is most well-known for its ability to predict chemisorption for the adsorption process with high forces between the adsorbents and the adsorbate by explaining the adsorption phenomena on monolayer coverage. Its R2 values are nearer to one, with values of 0.9909 and 0.9994 for THI and RhB adsorption, respectively. The Langmuir data in Table 8 for the adsorption of these two pollutants was the most appropriate and best to describe the adsorption phenomena. This enables us to presume chemisorption phenomena on the adsorption process under study, as it implies that the majority of the THI and RhB adsorbed at equilibrium are situated on the monolayer on the OGAC surface. Additionally, the Langmuir constant (RL) for the THI and RhB adsorption process falls between zero and one, suggesting that the two adsorbates’ adsorption on OGAC is favorable.
The adsorption of THI and RhB on OGAC could also be explained by Freundlich’s isotherm, which proves best for adsorption on nonuniform surfaces where there is an interaction between the adsorbed molecules and no constraint on multilayer formation. This is because the determination coefficients R2 values for THI and RhB are, respectively, 0.9978 and 0.9927, which are closer to 1. Furthermore, the OGAC adsorbent’s surface is heterogeneous for the adsorbates (THI and RhB) if the Freundlich heterogeneity factor 1/n is less than one.
In general, the adsorption phenomena properties cannot be well explained by the data derived from the isotherms of Langmuir and Freundlich. When expressing the mechanism of adsorption with the energy distribution onto a heterogeneous surface, the Dubinin–Radushkevich isotherm is typically utilized. With its mean free energy E per adsorbate molecule, the method was often used to differentiate between the physical and chemical adsorption of adsorbate molecules. Although the theoretical amounts adsorbed at equilibrium differ from the experimental adsorbed quantities for THI and RhB adsorption on OGAC, Table 8 shows that the R2 values of the adsorption of THI and RhB are close to one (R2(THI) = 0.97 and R2(RhB) = 0.99), which is sufficient to describe the adsorption phenomenon. Additionally, the Dubinin–Radushkevich energy for THI and RhB adsorption on OGAC is much higher than 8 KJmol−1 (ETHI = 1581.14 KJ·mol−1 and ERhB = 1000 KJ·mol−1), suggesting that chemisorption with the creation of chemical bonds dominates the adsorption processes of the THI and RhB on OGAC. This supports the Langmuir model’s assumption that there are significant interactive forces between the THI/OGAC and RhB/OGAC.
Adsorption is explained by the isotherm of Temkin, which includes a component that explicitly accounts for interactions between adsorbent and adsorbates while disregarding very low and high concentration values, with R2 values of 0.9992 and 0.9999 for THI and RhB, respectively. Table 8 indicates that the Temkin isotherm may also be utilized to explain the adsorption of THI and RhB on OGAC. Strong bonds are formed between OGAC–RhB and OGAC–THI because of the high value of the Temkin constant KT in the adsorption process of THI and RhB on OGAC, which also suggests that the bond energies of THI/OGAC and RhB/OGAC are very significant. Furthermore, the chemisorption process is further confirmed by the high adsorption energies of THI and RhB on OGAC.
3.2.3. Thermodynamic Study
The equations from the thermodynamics research are used to compute the adsorption process thermodynamic characteristics based on the experimental data obtained at various temperatures. From the equation in Figure 13, the values of the ΔH0 and ΔS0 were computed, respectively, which after that establishes the values of the change in ΔG0 of the adsorption process. The thermodynamic parameter values are presented in Table 9.
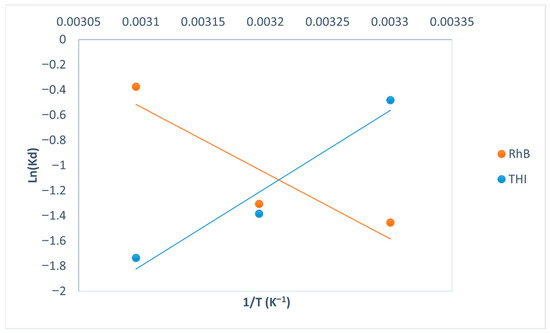
Figure 13.
Van’t Hoff equation plot.
Table 9.
Thermodynamic adsorption constants for THI and RhB on OGAC.
OGAC’s adsorption of THI:
Table 9 shows that as the temperature of THI adsorption by OGAC increases from 30 °C to 50 °C, the free energy values increase from 1.21 to 4.66 KJ·mol−1, and the capacity of adsorption decreases from 0.6 to 0.21 mg·g−1. These results might be interpreted by the fact that increasing the temperature influences the adsorbent–adsorbate interaction, which promotes a slower reaction and weakens the binding between the two substances.
Table 9 shows that the THI adsorption on OGAC is exothermic based on the negative value of enthalpy ΔH0. The negative value of ΔS0 indicates the enthalpy-driven nature of the adsorption process. During the adsorption process, the disorder at the solid–liquid interface decreases, resulting in a negative value of entropy change (ΔS0). Another investigation into the adsorption of THI produced similar results [36].
OGAC’s adsorption of RhB:
Table 9 shows that as the temperature of RhB adsorption by OGAC increases from 30 °C to 50 °C, the free energy values fall from 3.66 to 1.01 KJ mol−1 and the adsorption amount increases from 0.34 to 0.67 mg·g−1. This effect might be interpreted by the fact that a rising temperature causes the OGAC’s surface to space out or its internal structure to enlarge, which in turn causes more RhB to diffuse. The results demonstrate that increasing the temperature improves the adsorption process.
RhB adsorption on OGAC is endothermic, as evidenced by the ΔH0 positive value, which also indicates that energy is needed for RhB to move from the solution to the OGAC surface, while the growing randomness at the interface of OGAC-RhB during the adsorption process is indicated by the ΔS0 positive value, which also represents the affinity of the RhB. In other words, this implies that both the adsorbent and the adsorbate acquire structural changes throughout the adsorption process [57].
3.3. Adsorption Mechanisms
The mechanisms by which the adsorbent and adsorbate interact are very varied and contingent upon the characterization of the adsorbent as well as the experimental setup [58]. In particular, the adsorbents’ surface functional groups have the potential to interact with THI and RhB in a variety of ways. THI and RhB ionization is influenced by experimental parameters such solution pH. In general, THI and RhB adsorb onto OGAC via several main mechanisms.
We used the adsorption and characterization investigations of OGAC [31], especially the ones that enabled us to identify the functional groups on the surface of OGAC, to suggest the adsorption mechanism of THI and RhB on OGAC. The Boehm titration of OGAC revealed that the carboxylic groups (5.03 mmol/g), phenolic groups (4.36 mmol/g), lactones (4.36 mmol/g), and basic groups (4.97 mmol/g) are crucial to the chemical adsorption process because they allow micropollutants adsorb to OGAC’s active sites. These functional groups become protonated in an acidic medium when the solution’s pH (pH = 5.7) is lower than the pH of point zero charge of OGAC (pHpzc = 8.19), giving the surface of OGAC a positive charge. This positive charge attracts negatively charged molecules, such as THI and RhB, making it easier for them to adsorb onto OGAC.
The main mechanisms for THI and RhB adsorption over OGAC adsorbent are depicted in Figure 14A,B. These proposed mechanisms include electrostatic interactions, H-bond interactions, the interaction of the electron donor and acceptor, and others. This section will carefully go over the processes for THI and RhB’s adsorption onto OGAC, based on the findings from the characterization study.
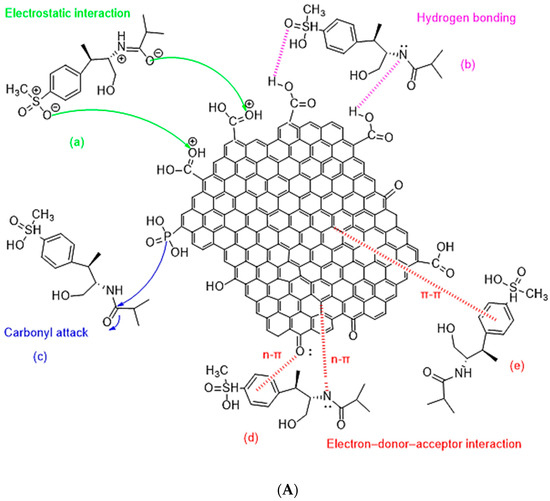
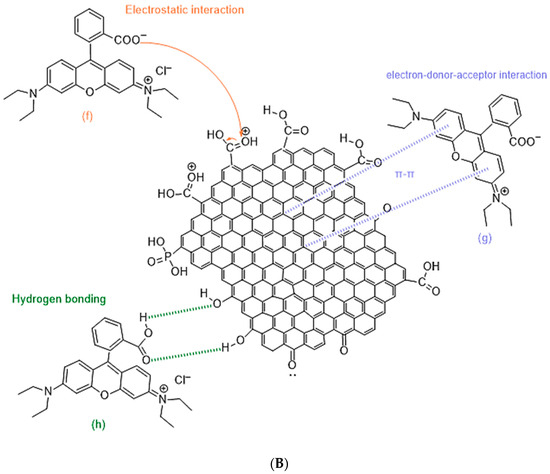
Figure 14.
Mechanisms for THI adsorption over OGAC (A) and mechanisms for RhB adsorption over OGAC (B). Suggested electrostatic interaction mechanisms (a,f), hydrogen bonding (b,h), carbonyl attack (c), and electron donor–acceptor interaction mechanisms (d,e,g).
The functional groups on the biochar surface, particularly those that include oxygen, such as carboxylic, lactone, and phenolic groups, are intimately linked to its chemical activation processes. When phosphoric acid is used in the chemical activation process to produce OGAC, certain surface functionalities could be present [31].
We suggested a standard molecule of OGAC that contains the many functional groups found on its surface, based on the data collected through the characterization section of the molecule, including Boehm titration, FTIR, and the suggested mechanism after phosphoric acid activation of biochar [31].
An overabundance of H+ protons from the solution will protonate the functional groups on the OGAC surface in an acidic pH range below pHpzc, as a result, the support will attract negatively charged adsorbate. This suggests that the OGAC surface will have a positive charge in a pH 5.7 solution. Other than that, the proportion of adsorption varies depending on the individual molecule and the amount of time needed for the OGAC surface fixation process.
The electrostatic interaction [59] is a typical mechanism that forms between positively and negatively charged sites of THI or RhB and OGAC which can be observed in Figure 14A,B. The molecule generated by electrostatic interaction in the suggested mechanism of THI adsorption is molecule (a). In contrast, the molecule in the proposed mechanism of RhB adsorption is molecule (f).
The significance of π–π and n–π electron donors–acceptors in adsorption processes has been demonstrated in several previous investigations [60,61]. The molecules generated by electron donor–acceptor interactions in the suggested mechanism of THI adsorption are molecules (d) and (e), whereas the molecule in the proposed mechanism of RhB adsorption is molecule (g).
A kind of dipole–dipole attraction known as H-bond occurs when a hydrogen atom is covalently bound to the most electronegative atom, such as N and O [62], as seen in Figure 14 (b and h), Figure 14A,B show that hydrogen bonds are frequently present when THI and RhB are adsorbed onto the surface of OGAC. The hydrogen bonding therefore provides an adsorption process that effectively removes THI and RhB from OGAC.
Figure 14A’s suggested molecule (c) illustrates another mechanism that has been suggested: a form of carbonyl attack between the carbonyl present in the THI adsorption and the phosphor on the surface of OGAC.
3.4. Regeneration Cycles
Determining the adsorption efficiency of THI and RhB during several consecutive adsorption cycles on OGAC is the primary goal of the regeneration study. The regeneration cycles of OGAC utilizing thermal regeneration are depicted in Figure 15.
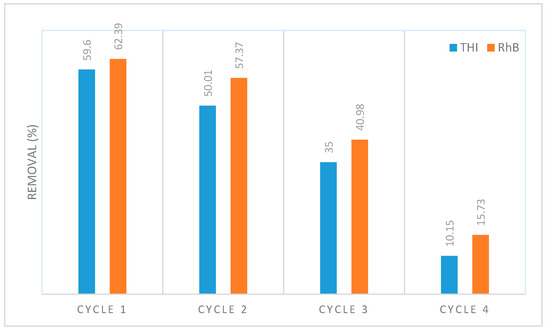
Figure 15.
OGAC regeneration cycles.
The regeneration experiment was conducted to desorb THI and RhB and regenerate the OGAC. The OGAC’s regeneration efficiency was total, according to Figure 15. The outcome unequivocally demonstrates that OGAC may be used three times for THI and RhB adsorption, with a minor drop in removal efficiency. The loss of active sites on the OGAC surface is often cited as the reason for this decline in material performance from one cycle to the next.
4. Conclusions
To understand the adsorption process, we studied the removal of various micropollutants, including the emerging pharmaceutical contaminant THI and the RhB dye. This requires optimizing the parameters that impact treatment efficiency. In this study, we applied Response Surface Methodology (RSM) using a central composite design (CCD) based on a statistical approach to optimize the efficiency of the OGAC in removing the selected micropollutants. Factors studies on the adsorption of THI and RhB, including pH, concentration of THI and RhB, and OGAC dose, were also conducted.
The results revealed that the adsorption of THI and RhB is primarily influenced by pH, initial pollutant concentration, and adsorbent/adsorbate dose. The Response Surface Methodology (RSM) indicated that the optimal adsorption parameters for THI and RhB on OGAC are pH = 5.7, initial concentration C0 = 2.5 mg/L, and dose = 6 g/L.
The kinetic study of THI and RhB retention on OGAC indicates that the process generally follows pseudo-second-order kinetic for both micropollutants, as confirmed by the correlation coefficient values and statistical error functions for each. This suggests that chemisorption is primarily responsible for controlling the adsorption process. Analyzing the adsorption isotherm data revealed that chemisorption significantly affects the THI and RhB adsorption process on OGAC. Additionally, the thermodynamic parameters indicate that the adsorption of THI on OGAC is exothermic, while the adsorption of RhB on OGAC is endothermic. According to the analysis of the probable adsorption mechanisms of THI and RhB on OGAC, these molecules can form electron donor–acceptor interactions, hydrogen bonds, electrostatic interaction mechanisms, or carbonyl attacks. Regeneration tests on OGAC demonstrated its cost-effectiveness and the activated carbon was successfully regenerated for three cycles, achieving efficiencies of up to 62.39% for RhB and 59.6% for THI. These findings demonstrate that OGAC as a feedstock is a successful adsorbent for removing THI and RhB. This promotes the use of OGAC in place of commercially activated carbon in the treatment of drug and dye removal through the use of the adsorption process.
Author Contributions
Conceptualization, N.S. and S.E.H.; Methodology, N.L. and S.E.H.; Software, M.B.; Validation, N.S. and S.E.H.; Formal analysis, N.L.; Investigation, N.S. and M.B.; Resources, M.B.; Data curation, N.L. and H.N.; Writing—original draft, N.S.; Writing—review & editing, H.N. and S.E.H.; Supervision, S.E.H. All authors have read and agreed to the published version of the manuscript.
Funding
This research received no external funding.
Data Availability Statement
The original contributions presented in this study are included in the article. Further inquiries can be directed to the corresponding author.
Conflicts of Interest
The authors declare no conflict of interest.
References
- Kolpin, D.W.; Furlong, E.T.; Meyer, M.T.; Thurman, E.M.; Zaugg, S.D.; Barber, L.B.; Buxton, H.T. Pharmaceuticals, Hormones, and Other Organic Wastewater Contaminants in U.S. Streams, 1999−2000: A National Reconnaissance. Environ. Sci. Technol. 2002, 36, 1202–1211. [Google Scholar] [CrossRef]
- Snyder, S.A.; Westerhoff, P.; Yoon, Y.; Sedlak, D.L. Pharmaceuticals, Personal Care Products, and Endocrine Disruptors in Water: Implications for the Water Industry. Environ. Eng. Sci. 2003, 20, 449–469. [Google Scholar] [CrossRef]
- Pomati, F.; Castiglioni, S.; Zuccato, E.; Fanelli, R.; Vigetti, D.; Rossetti, C.; Calamari, D. Effects of a Complex Mixture of Therapeutic Drugs at Environmental Levels on Human Embryonic Cells. Environ. Sci. Technol. 2006, 40, 2442–2447. [Google Scholar] [CrossRef]
- Wang, F.; Xiang, L.; Sze-Yin Leung, K.; Elsner, M.; Zhang, Y.; Guo, Y.; Pan, B.; Sun, H.; An, T.; Ying, G.; et al. Emerging Contaminants: A One Health Perspective. Innovation 2024, 5, 100612. [Google Scholar] [CrossRef]
- Shetty, S.S.; D, D.; S, H.; Sonkusare, S.; Naik, P.B.; Kumari N, S.; Madhyastha, H. Environmental Pollutants and Their Effects on Human Health. Heliyon 2023, 9, e19496. [Google Scholar] [CrossRef]
- Geissen, V.; Mol, H.; Klumpp, E.; Umlauf, G.; Nadal, M.; van der Ploeg, M.; van de Zee, S.E.A.T.M.; Ritsema, C.J. Emerging Pollutants in the Environment: A Challenge for Water Resource Management. Int. Soil Water Conserv. Res. 2015, 3, 57–65. [Google Scholar] [CrossRef]
- Karim, M.A.H.; Aziz, K.H.H.; Omer, K.M.; Salih, Y.M.; Mustafa, F.; Rahman, K.O.; Mohammad, Y. Degradation of Aqueous Organic Dye Pollutants by Heterogeneous Photo-Assisted Fenton-like Process Using Natural Mineral Activator: Parameter Optimization and Degradation Kinetics. IOP Conf. Ser. Earth Environ. Sci. 2021, 958, 012011. [Google Scholar] [CrossRef]
- Hama Aziz, K.H.; Mahyar, A.; Miessner, H.; Mueller, S.; Kalass, D.; Moeller, D.; Khorshid, I.; Rashid, M.A.M. Application of a Planar Falling Film Reactor for Decomposition and Mineralization of Methylene Blue in the Aqueous Media via Ozonation, Fenton, Photocatalysis and Non-Thermal Plasma: A Comparative Study. Process Saf. Environ. Prot. 2018, 113, 319–329. [Google Scholar] [CrossRef]
- Lin, S.; Lin, X.; Lou, X.-T.; Yang, F.; Lin, D.-Y.; Lu, Z.-W. Rapid and Sensitive SERS Method for Determination of Rhodamine B in Chili Powder with Paper-Based Substrates. Anal. Methods 2015, 7, 5289–5294. [Google Scholar] [CrossRef]
- Rowiński, P.M.; Chrzanowski, M.M. Influence of Selected Fluorescent Dyes on Small Aquatic Organisms. Acta Geophys. 2011, 59, 91–109. [Google Scholar] [CrossRef]
- Ashfaq, M.H.; Imran, M.; Haider, A.; Shahzadi, A.; Mustajab, M.; Ul-Hamid, A.; Nabgan, W.; Medina, F.; Ikram, M. Antimicrobial Potential and Rhodamine B Dye Degradation Using Graphitic Carbon Nitride and Polyvinylpyrrolidone Doped Bismuth Tungstate Supported with in Silico Molecular Docking Studies. Sci. Rep. 2023, 13, 17847. [Google Scholar] [CrossRef]
- Singh, S.; Parveen, N.; Gupta, H. Adsorptive Decontamination of Rhodamine-B from Water Using Banana Peel Powder: A Biosorbent. Environ. Technol. Innov. 2018, 12, 189–195. [Google Scholar] [CrossRef]
- Lu, Q.; Gao, W.; Du, J.; Zhou, L.; Lian, Y. Discovery of Environmental Rhodamine B Contamination in Paprika during the Vegetation Process. J. Agric. Food Chem. 2012, 60, 4773–4778. [Google Scholar] [CrossRef]
- Priya, P.S.; Pratiksha Nandhini, P.; Vaishnavi, S.; Pavithra, V.; Almutairi, M.H.; Almutairi, B.O.; Arokiyaraj, S.; Pachaiappan, R.; Arockiaraj, J. Rhodamine B, an Organic Environmental Pollutant Induces Reproductive Toxicity in Parental and Teratogenicity in F1 Generation in Vivo. Comp. Biochem. Physiol. C Toxicol. Pharmacol. 2024, 280, 109898. [Google Scholar] [CrossRef]
- Umeda, M. Experimental Study of Xanthene Dyes as Carcinogenic Agents. Gann 1956, 47, 51–78_3. [Google Scholar]
- Zhang, X.; Gan, X.; Cao, S.; Shang, J.; Cheng, X. Efficient Removal of Rhodamine B in Wastewater via Activation of Persulfate by MnO2 with Different Morphologies. Water 2023, 15, 735. [Google Scholar] [CrossRef]
- Li, K.; Zhang, P.; Ge, L.; Ren, H.; Yu, C.; Chen, X.; Zhao, Y. Concentration-Dependent Photodegradation Kinetics and Hydroxyl-Radical Oxidation of Phenicol Antibiotics. Chemosphere 2014, 111, 278–282. [Google Scholar] [CrossRef] [PubMed]
- Maita, K.; Kuwahara, M.; Kosaka, T.; Inui, K.; Sugimoto, K.; Takeuchi, Y.; Hatakenaka, N.; Harada, T.; Yasuhara, K.; Mitsumori, K. Testicular Toxicity of Thiamphenicol in Sprague-Dawley Rats. J. Toxicol. Pathol. 1999, 12, 27. [Google Scholar] [CrossRef][Green Version]
- Sim, W.-J.; Lee, J.-W.; Lee, E.-S.; Shin, S.-K.; Hwang, S.-R.; Oh, J.-E. Occurrence and Distribution of Pharmaceuticals in Wastewater from Households, Livestock Farms, Hospitals and Pharmaceutical Manufactures. Chemosphere 2011, 82, 179–186. [Google Scholar] [CrossRef]
- Abdallat, G.A.; Salameh, E.; Shteiwi, M.; Bardaweel, S. Pharmaceuticals as Emerging Pollutants in the Reclaimed Wastewater Used in Irrigation and Their Effects on Plants, Soils, and Groundwater. Water 2022, 14, 1560. [Google Scholar] [CrossRef]
- Tarigan, A.Y.; Effendi, A.J. Kinetic Study of Paracetamol Degradation with Advanced Oxidation Process (AOP) Combination of Ozone, Hydrogen Peroxide and Ultraviolet (O3/H2O2/UV). J. Multidisiplin Madani 2024, 4, 518–527. [Google Scholar] [CrossRef]
- Snyder, S.A.; Adham, S.; Redding, A.M.; Cannon, F.S.; DeCarolis, J.; Oppenheimer, J.; Wert, E.C.; Yoon, Y. Role of Membranes and Activated Carbon in the Removal of Endocrine Disruptors and Pharmaceuticals. Desalination 2007, 202, 156–181. [Google Scholar] [CrossRef]
- Belgiorno, V.; Rizzo, L.; Fatta, D.; Della Rocca, C.; Lofrano, G.; Nikolaou, A.; Naddeo, V.; Meric, S. Review on Endocrine Disrupting-Emerging Compounds in Urban Wastewater: Occurrence and Removal by Photocatalysis and Ultrasonic Irradiation for Wastewater Reuse. Desalination 2007, 215, 166–176. [Google Scholar] [CrossRef]
- Samghouli, N.; Regraguy, B.; Abahdou, F.-Z.; Azoulay, K.; Bencheikh, I.; Mabrouki, J.; Hajjaji, S.E. Removal of a Non-Steroidal Anti-Inflammatory Drug (Piroxicam) in an Aqueous Medium by an Agricultural by-Product. E3S Web Conf. 2022, 337, 05001. [Google Scholar] [CrossRef]
- Kathi, S.; El Din Mahmoud, A. Trends in Effective Removal of Emerging Contaminants from Wastewater: A Comprehensive Review. Desalination Water Treat. 2024, 317, 100258. [Google Scholar] [CrossRef]
- Belahrach, B.; Farah, M.; Samghouli, N.; Gadda, N.; Bensemlali, M.; Labjar, N.; Benabdellah, G.A.; Hajjaji, S.E. Investigation of Equilibrium and Kinetic Aspects of Methylene Blue Dye Adsorption from Aqueous Solutions Using Raw and Extract of Eriobotrya Japonica Seeds. Euro-Mediterr. J. Environ. Integr. 2025, 10, 2197–2211. [Google Scholar] [CrossRef]
- Gadda, N.; Benabdallah, G.A.; Belahrach, B.; Bendany, M.; Labjar, N.; Samghouli, N.; Dahrouch, A.; Hajjaji, S.E. Investigation of Equilibrium and Kinetics in the Removal of Methylene Blue from Aqueous Solutions Using Chamaerops Humilis Fruit. Moroc. J. Chem. 2024, 12, 1446–1461. [Google Scholar] [CrossRef]
- Samghouli, N.; Rghioui, L.; Sebbahi, S.; El Hajji, A.; Guennoun, L.; Khaoulaf, R.; Serghini Idrissi, M.; El Hajjaji, S. Removal of Methylene Blue from Aqueous Solution by Loquats Nuclei. Bulg. Chem. Commun. 2025, 57, 85–93. [Google Scholar]
- Azoulay, K.; Bencheikh, I.; Mabrouki, J.; Samghouli, N.; Moufti, A.; Dahchour, A.; Hajjaji, S.E. Adsorption Mechanisms of Azo Dyes Binary Mixture onto Different Raw Palm Wastes. Int. J. Environ. Anal. Chem. 2021, 0, 1–20. [Google Scholar] [CrossRef]
- Lam, A.; Rivera, A.; Rodrídguez-Fuentes, G. Theoretical Study of Metronidazole Adsorption on Clinoptilolite. Microporous Mesoporous Mater. 2001, 49, 157–162. [Google Scholar] [CrossRef]
- Samghouli, N.; Bencheikh, I.; Azoulay, K.; El Hajjaji, S.; Labjar, N. Optimisation of Olea Europaea Stone—Activated Carbon Preparation Using Response Surface Methodology for Thiamphenicol Removal in Fixed Bed Column. Ecol. Eng. Environ. Technol. 2024, 25, 37–53. [Google Scholar] [CrossRef]
- Masiya, T.T.; Gudyanga, F.P. Investigation of Granular Activated Carbon from Peach Stones for Gold Adsorption in Acidic Thiourea. In Proceedings of the Hydrometallurgy Conference, Muldersdrift, South Africa, 24–26 February 2009; pp. 465–474. [Google Scholar]
- Vohra, M.S. Adsorption-Based Removal of Gas-Phase Benzene Using Granular Activated Carbon (GAC) Produced from Date Palm Pits. Arab. J. Sci. Eng. 2015, 40, 3007–3017. [Google Scholar] [CrossRef]
- Huggins, T.M.; Haeger, A.; Biffinger, J.C.; Ren, Z.J. Granular Biochar Compared with Activated Carbon for Wastewater Treatment and Resource Recovery. Water Res. 2016, 94, 225–232. [Google Scholar] [CrossRef]
- Jjagwe, J.; Olupot, P.W.; Menya, E.; Kalibbala, H.M. Synthesis and Application of Granular Activated Carbon from Biomass Waste Materials for Water Treatment: A Review. J. Bioresour. Bioprod. 2021, 6, 292–322. [Google Scholar] [CrossRef]
- Li, R.; Sun, W.; Xia, L.; U, Z.; Sun, X.; Wang, Z.; Wang, Y.; Deng, X. Adsorption of Toxic Tetracycline, Thiamphenicol and Sulfamethoxazole by a Granular Activated Carbon (GAC) under Different Conditions. Molecules 2022, 27, 7980. [Google Scholar] [CrossRef]
- Bera, A.; Kumar, T.; Ojha, K.; Mandal, A. Adsorption of Surfactants on Sand Surface in Enhanced Oil Recovery: Isotherms, Kinetics and Thermodynamic Studies. Appl. Surf. Sci. 2013, 284, 87–99. [Google Scholar] [CrossRef]
- Sahmoune, M.N.; Louhab, K.; Boukhiar, A. Studies of Chromium Removal from Tannery Effluents by Dead Streptomyces Rimosus. Chem. Product Process Model. 2008, 3. [Google Scholar] [CrossRef]
- Mukherjee, S.; Halder, G. A Review on the Sorptive Elimination of Fluoride from Contaminated Wastewater. J. Environ. Chem. Eng. 2018, 6, 1257–1270. [Google Scholar] [CrossRef]
- Sahmoune, M.N.; Louhab, K.; Boukhiar, A. Biosorption of Cr (III) from Aqueous Solutions Using Bacterium Biomass Streptomyces Rimosus. Int. J. Environ. Res. 2009, 3, 229–238. [Google Scholar]
- Simonin, J.-P. On the Comparison of Pseudo-First Order and Pseudo-Second Order Rate Laws in the Modeling of Adsorption Kinetics. J. Chem. Eng. 2016, 300, 254–263. [Google Scholar] [CrossRef]
- Sahmoune, M.N.; Louhab, K.; Boukhiar, A.; Addad, J.; Barr, S. Kinetic and Equilibrium Models for the Biosorption of Cr(III) on Streptomyces rimosus. Toxicol. Environ. Chem. 2009, 91, 1291–1303. [Google Scholar] [CrossRef]
- Kajjumba, G.W.; Emik, S.; Öngen, A.; Özcan, H.K.; Aydın, S. Modelling of Adsorption Kinetic Processes—Errors, Theory and Application. Adv. Sorpt. Process Appl. 2018, 1–19. [Google Scholar]
- Hossain, M.A.; Ngo, H.H.; Guo, W.S.; Setiadi, T. Adsorption and Desorption of Copper(II) Ions onto Garden Grass. Bioresour. Technol. 2012, 121, 386–395. [Google Scholar] [CrossRef] [PubMed]
- McKay, G.; El-Geundi, M.; Nassar, M.M. Equilibrium Studies for the Adsorption of Dyes on Bagasse Pith. Adsorpt. Sci. Technol. 1997, 15, 251–270. [Google Scholar] [CrossRef]
- Kovalova, L.; Knappe, D.R.U.; Lehnberg, K.; Kazner, C.; Hollender, J. Removal of Highly Polar Micropollutants from Wastewater by Powdered Activated Carbon. Environ. Sci. Pollut. Res. 2013, 20, 3607–3615. [Google Scholar] [CrossRef] [PubMed]
- Tong, Y.; Mayer, B.K.; McNamara, P.J. Adsorption of Organic Micropollutants to Biosolids-Derived Biochar: Estimation of Thermodynamic Parameters. Environ. Sci.: Water Res. Technol. 2019, 5, 1132–1144. [Google Scholar] [CrossRef]
- Dubinin, M.M.; Astakhov, V.A. Development of the Concepts of Volume Filling of Micropores in the Adsorption of Gases and Vapors by Microporous Adsorbents. Russ. Chem. Bull. 1971, 20, 3–7. [Google Scholar] [CrossRef]
- Vadi, M.; Mansoorabad, A.; Mohammadi, M.; Rostami, N. Investigation of Langmuir, Freundlich and Temkin Adsorption Isotherm of Tramadol by Multi-Wall Carbon Nanotube. Asian J. Chem. 2013, 25, 5467. [Google Scholar]
- Guo, J.-Z.; Li, B.; Liu, L.; Lv, K. Removal of Methylene Blue from Aqueous Solutions by Chemically Modified Bamboo. Chemosphere 2014, 111, 225–231. [Google Scholar] [CrossRef]
- Fu, M.; Perlman, M.; Lu, Q.; Varga, C. Pharmaceutical Solid-State Kinetic Stability Investigation by Using Moisture-Modified Arrhenius Equation and JMP Statistical Software. J. Pharm. Biomed. Anal. 2015, 107, 370–377. [Google Scholar] [CrossRef] [PubMed]
- Samghouli, N.; Bencheikh, I.; Azoulay, K.; Abahdou, F.-Z.; Mabrouki, J.; El Hajjaji, S. Study of Piroxicam Removal from Wastewater by Artichoke Waste Using NemrodW® Software: Statistical Analysis. In IoT and Smart Devices for Sustainable Environment; Springer: Cham, Switzerland, 2022; pp. 29–42. ISBN 978-3-030-90082-3. [Google Scholar]
- Bencheikh, I.; Azoulay, K.; Samghouli, N.; Mabrouki, J.; Bouhachlaf, L.; Moufti, A.; Hajjaji, S.E. Mathematical and Statistical Study for the Wastewater Adsorbent Regeneration Using the Central Composite Design. In IoT and Smart Devices for Sustainable Environment; Springer: Cham, Switzerland, 2022; pp. 71–83. [Google Scholar]
- Azoulay, K.; Bencheikh, I.; Samghouli, N.; Mabrouki, J.; Moufti, A.; Hajjaji, S.E. Modeling and Design of Water Treatment Processes by Biosorption Method Using JMP® 11 Software. In IoT and Smart Devices for Sustainable Environment; Springer: Cham, Switzerland, 2022; pp. 53–69. [Google Scholar]
- Ouasif, H.; Yousfi, S.; Bouamrani, M.; Talbi, M.; Tarik, A.; el Kouali, M. Comparative Study of Adsorption of Methylene Blue in Two Natural Materials (Etude Comparative Du Phénomène D’adsorption Du Bleu De Méthylène Sur Deux Matériaux Adsorbants Naturels). Phys. Chem. News 2011, 58, 1–5. [Google Scholar]
- Al-Ghouti, M.A.; Da’ana, D.A. Guidelines for the Use and Interpretation of Adsorption Isotherm Models: A Review. J. Hazard. Mater. 2020, 393, 122383. [Google Scholar] [CrossRef]
- Ghibate, R.; Senhaji, O.; Taouil, R. Kinetic and Thermodynamic Approaches on Rhodamine B Adsorption onto Pomegranate Peel. Case Stud. Chem. Environ. Eng. 2021, 3, 100078. [Google Scholar] [CrossRef]
- Samghouli, N.; Bencheikh, I.; Azoulay, K.; Jansson, S.; El Hajjaji, S. Mechanistic and Reactional Activation Study of Carbons Destined for Emerging Pharmaceutical Pollutant Adsorption. Environ. Monit. Assess. 2025, 197, 259. [Google Scholar] [CrossRef] [PubMed]
- Mohamed Idris, Z.; Hameed, B.; Ye, L.; Hajizadeh, S.; Mattiasson, B.; Mohd Din, A.T. Amino-Functionalised Silica-Grafted Molecularly Imprinted Polymers for Chloramphenicol Adsorption. J. Environ. Chem. Eng. 2020, 8, 103981. [Google Scholar] [CrossRef]
- Yi, L.; Zuo, L.; Wei, C.; Fu, H.; Qu, X.; Zheng, S.; Xu, Z.; Guo, Y.; Li, H.; Zhu, D. Enhanced Adsorption of Bisphenol A, Tylosin, and Tetracycline from Aqueous Solution to Nitrogen-Doped Multiwall Carbon Nanotubes via Cation-π and π-π Electron-Donor-Acceptor (EDA) Interactions. Sci. Total Environ. 2020, 719, 137389. [Google Scholar] [CrossRef]
- Chen, A.; Pang, J.; Wei, X.; Chen, B.; Xie, Y. Fast One-Step Preparation of Porous Carbon with Hierarchical Oxygen-Enriched Structure from Waste Lignin for Chloramphenicol Removal. Environ. Sci. Pollut. Res. 2021, 28, 27398–27410. [Google Scholar] [CrossRef] [PubMed]
- Xiang, Y.; Yang, X.; Xu, Z.; Hu, W.; Zhou, Y.; Wan, Z.; Yang, Y.; Wei, Y.; Yang, J.; Tsang, D.C.W. Fabrication of Sustainable Manganese Ferrite Modified Biochar from Vinasse for Enhanced Adsorption of Fluoroquinolone Antibiotics: Effects and Mechanisms. Sci. Total Environ. 2020, 709, 136079. [Google Scholar] [CrossRef]


Disclaimer/Publisher’s Note: The statements, opinions and data contained in all publications are solely those of the individual author(s) and contributor(s) and not of MDPI and/or the editor(s). MDPI and/or the editor(s) disclaim responsibility for any injury to people or property resulting from any ideas, methods, instructions or products referred to in the content. |
© 2025 by the authors. Licensee MDPI, Basel, Switzerland. This article is an open access article distributed under the terms and conditions of the Creative Commons Attribution (CC BY) license (https://creativecommons.org/licenses/by/4.0/).