Article

Carp Scales Modified with Cerium Oxide Nanoparticles as a New Bio-Adsorbent for Arsenic and Chromium Separation from Water

1
Military Academy, University of Defence, 33 Veljka Lukica Kurjaka Street, 11000 Belgrade, Serbia
2
Faculty of Technology and Metallurgy, University of Belgrade, Karnegijeva 4, 11000 Belgrade, Serbia
3
Innovation Center of the Faculty of Technology and Metallurgy Ltd., University of Belgrade, Karnegijeva 4, 11000 Belgrade, Serbia
4
Faculty of Technical Sciences, University of Priština, Knjaza Miloša 7, 38220 Kosovska Mitrovica, Serbia
*
Author to whom correspondence should be addressed.
Separations 2025, 12(9), 253; https://doi.org/10.3390/separations12090253
Submission received: 2 July 2025 / Revised: 29 August 2025 / Accepted: 16 September 2025 / Published: 19 September 2025
(This article belongs to the Section Materials in Separation Science)

Abstract

Different treatments of fish scales from carps (Cyprinus carpio) (FS)—mechanical milling, modified with cerium dioxide (CeO2) nanoparticles and controlled carbonization of FS and modification with CeO2—were applied to obtain FS, FS-CeO2 and CFS-CeO2 bio-adsorbents. The synthesized adsorbents were used for As(V) and Cr(VI) oxyanion separation from water. Porosity and the amount of CeO2 nanoparticles deposition were controlled using different experimental conditions. Response surface methodology (RSM) was used to select optimal parameters for adsorbent synthesis to obtain the highest adsorption capacity. The structural and surface characteristics of the synthesized adsorbents were examined using FTIR, XRD and SEM techniques. The efficiency of pollutant removal was analyzed in terms of varying experimental conditions: the mass of adsorbent, pH, temperature and contact time. RSM was also used to optimize adsorption and desorption processes. The adsorption data, obtained at 25, 35 and 45 °C, were processed using Langmuir, Freundlich, Temkin and Dubinin–Radushkevich isotherm and Van’t Hoff thermodynamic models. The FS-CeO2 bio-adsorbent showed good adsorption capacities of 92.61 and 65.50 mg g−1 for As(V) and Cr(VI) ion removal, respectively, obtained by using the Langmuir model. Thermodynamic parameters proved that adsorption was a viable, spontaneous and endothermic process. The results from kinetic modeling indicated that both adsorbate and surface functional group concentration determine overall kinetic law with the highest participation of intra-particle diffusion resistance to pollutant transport. Exceptional adsorption and desorption performances of FS-CeO2 in conjunction with the bio-based origin of synthesized adsorbents offer valuable alternatives for the remediation of polluted water.

Graphical Abstract

1. Introduction

Due to the increasing pollution of the environment, there is an equal global interest in the field of purification of drinking water and municipal and industrial wastewater. Regardless of the source of the water, it must be treated if its quality does not comply with national drinking water or wastewater regulations [1,2,3,4].
The most common anthropogenic pollutants registered in the environment are compounds of organic and inorganic origin, such as heavy metals, nutrients (nitrogen and phosphorus compounds), hydrocarbons (oil and its derivatives), textile synthetic organic dyes, pesticides, surfactants, polycyclic hydrocarbons, radionuclides, pharmaceutical products and others [1,3,4,5,6]. Metals are not biodegradable under natural conditions and have a high tendency to accumulate in the environment. Heavy metals such as lead (Pb), cadmium (Cd), nickel (Ni), chromium (Cr) and copper (Cu) are among the most common pollutants of industrial wastewater in most countries of the world [1,5,6,7]. Groundwater pollution with heavy metals and metalloids, most often arsenic (As), lead (Pb) and nickel (Ni), occurs after the natural decomposition of minerals and ores or the erosion of indigenous rocky topographical structures in certain regions [7,8].
Arsenic and chromium contamination of drinking water is a global ecological and health problem because of its toxicity and carcinogenic hazards. The World Health Organization (WHO) has classified arsenic, inorganic arsenic and hexavalent chromium compounds as carcinogenic to humans (Group 1) and revised the maximum allowed concentration in drinking water. Specifically, the WHO recommends a guideline value of 50 μg L−1 for total chromium in drinking water and 10 μg L−1 for arsenic [2,4,6,7,8,9]. Such restrictive limits for drinking water initiated intense research and development of new technologies and materials. However, no method for the removal of these pollutants from water has been developed yet that could be widely and commercially acceptable, especially for low concentrations of pollutants. Standard methods and materials are expensive, and disposal of their byproducts is often environmentally unacceptable. Lately, research has focused on low-cost and widely available materials, such as clay, zeolite and tufa [10,11,12], various metals and their oxides in conventional and nanostructured forms, such as goethite, magnetite or alumina, and industrial or agricultural waste materials, such as fly ash, slags, cellulose-based materials or fish scales [2,4,5,8,10,13,14,15].
Special attention should be addressed to the research on biosorption, where heavy metals are adsorbed on natural materials (biomaterials) or biomass in their basic or modified form. Biosorption is an innovative technology that is probably the best alternative to other methods for the removal of heavy metals from polluted water. Natural materials can provide a high removal capacity because of the large number of reactive functional groups in the cellular wall of a material: carboxyl, amine, carboxamide, sulfo, phosphate and hydroxyl [2,14,15]. Also, the biodegradability of their solid residue is another main advantage of biosorbents over conventional sorbents. In this paper, the adsorption method was used with the aim of removing As(V) and Cr(VI) oxyanions from a water solution using a highly efficient bio-adsorbent [2,15].
Fish scales have already been proven as promising highly efficient adsorbents for the removal of heavy metals from water [15,16,17,18]. Currently, they are mainly considered biowaste, so developing an efficient technology using fish scales for the removal of arsenic and other heavy metal ions from water would provide multiple positive contributions to environmental protection. Carp scales are proven to be efficient due to the following benefits [15,18]: they are abundant (for this study, they were obtained from the fish farm in Ečka, Serbia), cost-effective, efficient adsorbents, modifiable for enhanced performance and effective across various conditions. Fish scales are composed of several organic components containing different functional groups and properties, such as collagen, fat, lecithin, scleroprotein, different vitamins, etc., and mineral components (mainly hydroxyapatite and calcium phosphate). Such compositions can be used for the synthesis of highly porous carbon-based materials that are ideal as adsorbents. Correspondingly, metals can be easily attached to different functional groups located on the surface of fish scales, like carboxyl, nitro and amine [15,16,17,18,19].
In this study, synthesized bio-sorbents, based on fish carp (Cyprinus carpio) and its carbonized form, both modified with cerium dioxide, were used for As(V) and Cr(VI) ion removal from water. Optimization of adsorbent preparation, adsorption conditions and the desorption process was performed using RSM purposely applied to attain the most efficient removal of As(V) and Cr(VI) from water while having the smallest negative impact on the environment. The possibilities of using differently modified carp fish scales for removal of arsenate and chromate oxyanions from water were investigated in a batch and column system. Equilibrium, kinetic and thermodynamic studies were applied to explain the adsorption process.
This study builds upon prior research demonstrating that pure CeO2 nanoparticles exhibit lower adsorption efficiency compared to adsorbents modified with cerium dioxide. The incorporation of CeO2 into composite or doped materials has been shown to enhance surface reactivity, increase oxygen vacancy concentration and improve overall performance in the removal of contaminants such as As(V) and Cr(VI) [20,21].

2. Materials and Methods

2.1. Chemicals and Materials

Full data on the materials used are provided in the Supplementary Materials (Section S2.1).

2.2. Optimization of Adsorbent Synthesis

For this study, three adsorbents based on fish scales were synthesized and investigated:
  • The carp fish scales, washed and mechanically milled (PFS—pure fish scales);
  • The carp fish scales modified with cerium dioxide nanoparticles (FS-CeO2);
  • The porous carbonized carp fish scales modified with cerium dioxide nanoparticles (CFS-CeO2). Detailed data on the optimization procedure of both adsorbent syntheses are given in the Supplementary Materials (Section S2.2).

2.3. The Optimization of Experimental Conditions of Adsorption and Desorption

The optimization of the experimental conditions of adsorbent syntheses and adsorption processes was performed using response surface methodology (RSM). This method is harmonized with the principles of environmental protection, since it can be used to minimize the number of experiments and the amount of environmentally harmful chemicals used, including chemical waste.
Classical optimization synthesis and adsorption are usually performed by separate examinations of the influence of individual variables [1,2,8,22]. However, according to such results, it is difficult to anticipate optimal reaction conditions because of possible interactions between different independent variables of the adsorption process [1,2,4,8,22]. Recently, different forms of computer software for statistical analysis have proven useful for the design of experiments. Using RSM, it is possible to investigate individual and interactive influences of different variables according to various predictors. Such an approach can point to the optimal conditions that give the best results [1,2,4,5,22]. Also, it was proven that the central composition design (CCD) and Box–Behnken design (BBD) are efficient designs of the RSM method for optimization of adsorbent synthesis and adsorption processes [1,2,4,5,22]. Optimization of adsorbent synthesis and adsorption conditions for oxyanion removal was performed for FS-CeO2, which showed better adsorption properties.
The optimization of adsorbent synthesis was performed using the RSM method with the two-factor central composite design. Each numeric factor was varied over 5 levels: plus and minus alpha (axial points), plus and minus 1 (factorial points), and center point. The operational values of the selected variables are listed in Table S1, where 13 experiments with 5 replicates at the central point were considered. Optimization of the adsorbent synthesis conditions was performed by varying the various input variables that were evaluated as the most significant for the adsorbent capacity. The input variables that were varied to optimize FS-CeO2 are the amount of CeCl3 for modification and the temperature of the reaction mixture. Each experiment (except in the central point) was performed two times. The output variable is adsorption capacity.
The adsorption process was optimized using numerical and graphical optimization methods with the Box–Behnken design. Designs with four factors (input variables) and three value levels were used, where 29 experiments with 5 repetitions in the central point were carried out. Adsorbent capacity was used as the response. An overview of the coded and actual values and the experimental plan of the BBD design are given in Table 1 and Table 2.
Due to the sensitivity of the adsorbent to desorption agents, the desorption process was optimized via numerical and graphical optimization methods using a D-optimal design. Designs with three factors (input variables) were used, and 20 experiments were performed. The desorbed ions from the adsorbent were used as a response variable. An overview of the D-optimal design experiment is given in Table S2.
The obtained data were used in the second-degree polynomial equation, and equation coefficients were obtained using the software Design-Expert, version 9.0.1 (Stat-Ease Inc., 2021 E. Hennepin Ave. Suite 480 Minneapolis, MN, USA) (Figure 1).

2.4. Material Characterization Methods

The synthesized adsorbents were adequately characterized by FTIR, XRD, SEM and EDS techniques. The elemental composition was determined using a chemical elemental analyzer, and the metal content was determined by dissolving samples in ultrapure nitric acid and measuring the concentration of As(V) and Cr(VI) ions using a plasma mass spectrometer coupled with a plasma ICP-MS system, Agilent 7500C (Agilent Technologies, Inc., Santa Clara, CA, USA). The specific adsorbent area, specific pore volume and pore diameter were determined by using the BET method of adsorption/desorption in a stream of nitrogen at 72.4 K, using a gas sorption analyzer Micromeritics ASAP 2020MP v 1.05 H. The sample was first degassed under vacuum or inert gas flow at elevated temperature (100 °C) to remove moisture and contaminants. The BET surface area was calculated from the linear portion of the adsorption isotherm, typically in the relative pressure range of 0.05–0.30. Pore volume and average pore diameter were derived from the adsorption branch of the isotherm using the Barrett–Joyner–Halenda (BJH) method, which assumes cylindrical pores and applies the Kelvin equation to estimate pore size distribution. These values are usually reported in the same analysis output and are crucial for understanding the accessibility of adsorbates to internal surfaces. FTIR spectra were collected using a Nicolet™ iS™ 10 FT-IR Spectrometer (Thermo Fisher SCIENTIFIC, Waltham, MA, USA) with Smart iTR™ Attenuated Total Reflectance (ATR) Sampling accessories. The spectra were recorded in the range 4000–500 cm−1, in 20-scan mode, and at a resolution of 4 cm−1. A zeta potential analyzer (Zetasizer 2000, Malvern, UK) was used to determine the zeta potential of the used adsorbents.
The native and modified samples’ morphological structure was tested using the X-ray diffraction method (XRD) (type of instrument: ENRAF NONIUS FR590 XRD, Bruker AXS, MA, USA); a diffractometer with Cu Kα 1.2 radiation, a step size of 0.05° and a step time of 1 s was used.
Morphological characterization of synthesized powders was conducted using a TESCAN MIRA 3 XMU (Czech Republic) field emission scanning electron microscope (FESEM). Before FESEM analysis, the powders underwent coating with Au utilizing a Polaron SC502 sputter coater.
The EDS analysis instrument employed for elemental analysis incorporates the INCA x-act detector for capturing characteristic X-ray emissions, coupled with the AZtec 4.3 software package developed by Oxford Instruments, Abingdon, UK. This system is seamlessly integrated with the aforementioned scanning electron microscope equipped with field emission technology, the TESCAN Mira3 XMU.

2.5. Batch Adsorption Experiments

Adsorption experiments were modeled using different isotherm (Langmuir, Freundlich, Temkin and Dubinin–Radushkevich), kinetic (pseudo-first-order, pseudo-second-order—Lagergren and second order) and kinetic diffusion models (Weber–Morris, Dunwald–Wagner model and Homogenous Solid Diffusion Model—HSDM) [2,4,5,11,12,13]. The experimental adsorption conditions applied in a batch system, as well as theoretical data on the applied isothermal and kinetic models, are given in the Supplementary Materials, Section S2.5.

2.6. Bed Column Experiments

The experimental conditions for the column system and theoretical data on the applied models are given in the Supplementary Materials, Section S2.6.

2.7. Desorption Study

The desorption methodology is given in Section S2.7.

3. Results and Discussion

In the first step of this work, fish scale (FS) was considered a potential adsorbent for oxyanion removal, and as a result of adsorption examination, the capacities of 7.84 and 6.62 mg g−1 for As(V) and Cr(VI), using FS, respectively, were obtained. Due to unfavorable structures/porosity of materials and the unavailability of the constituents’ functionalities for pollutant adsorption, milled FS was subjected to a one-step process of modification with CeO2 and two-step modification: carbonization and modification with CeO2. In order to attain a coupled positive effect in relation to environmental protection, RSM was applied to both FS-CeO2 and CFS-CeO2 syntheses.

3.1. Optimization of FS-CeO2 Synthesis

During preliminary research, the optimization of adsorbent synthesis and adsorption conditions for the removal of oxyanions from water was performed using a single-variable study. However, it is difficult to predict the optimum reaction conditions from previous results owing to the possible interactions between different independent variables involved in the reactions [1,2,22]. Statistical programs come in handy when establishing an experimental design using RSM to develop a mathematical function relating the response with various predictors and to obtain optimum conditions that maximize the desired results under high desirability [1,2,4,5,8,22,23]. Moreover, the central composite design (CCD) and Box–-Behnken design (BBD) are effective RSM model designs for generating second-order response surface models in the optimization of adsorbent synthesis and adsorption treatment processes [1,2,4,5,22,23].
To optimize conditions for FS-CeO2 adsorbent synthesis, a central composite design (CCD) was used with 13 experiments and 5 repetitions at the central point, where the capacity of the adsorbent was taken as the response (Table S1). By optimizing the synthesis conditions, i.e., the amount of deposited CeO2 and temperature, the highest capacity for As(V) removal was obtained at 75 °C, which provides 7% of CeO2 (prediction), while the experimental result was 4–5% (Figure 1). Similar results for Cr(VI) removal were obtained (Figure S4).

3.2. Physico-Chemical Characterization

The elemental composition of fish scales, listed in Table 3, indicates the presence of organic material (collagen) and mineral substances (hydroxyapatite), as found in similar research on the composition of other fish scales [15,16].
Collagen is a long fibrillar protein structure that provides strength and elasticity to fish scales. Amino acids are bound into a triple helix of the elongated fibril, which is the main component of connective tissue providing the structural integrity of cells [19,22].
Other physical characteristics of the absorbent such as specific surface, pore volumes, point of zero charge (pHPZC) and zeta potential are given in Table 4. Somewhat lower values of pHPZC of both modified absorbents indicate positively charged adsorbent surfaces at pH < pHPZC, which provides favorable conditions for oxyanion removal. A change in pHPZC is an important indicator of the adsorption mechanism. It was proved that an increase in pHPZC values after adsorption indicates a greater specific adsorption contribution compared to electrostatic interactions [4,5,23].

3.3. X-Ray Diffraction (XRD)

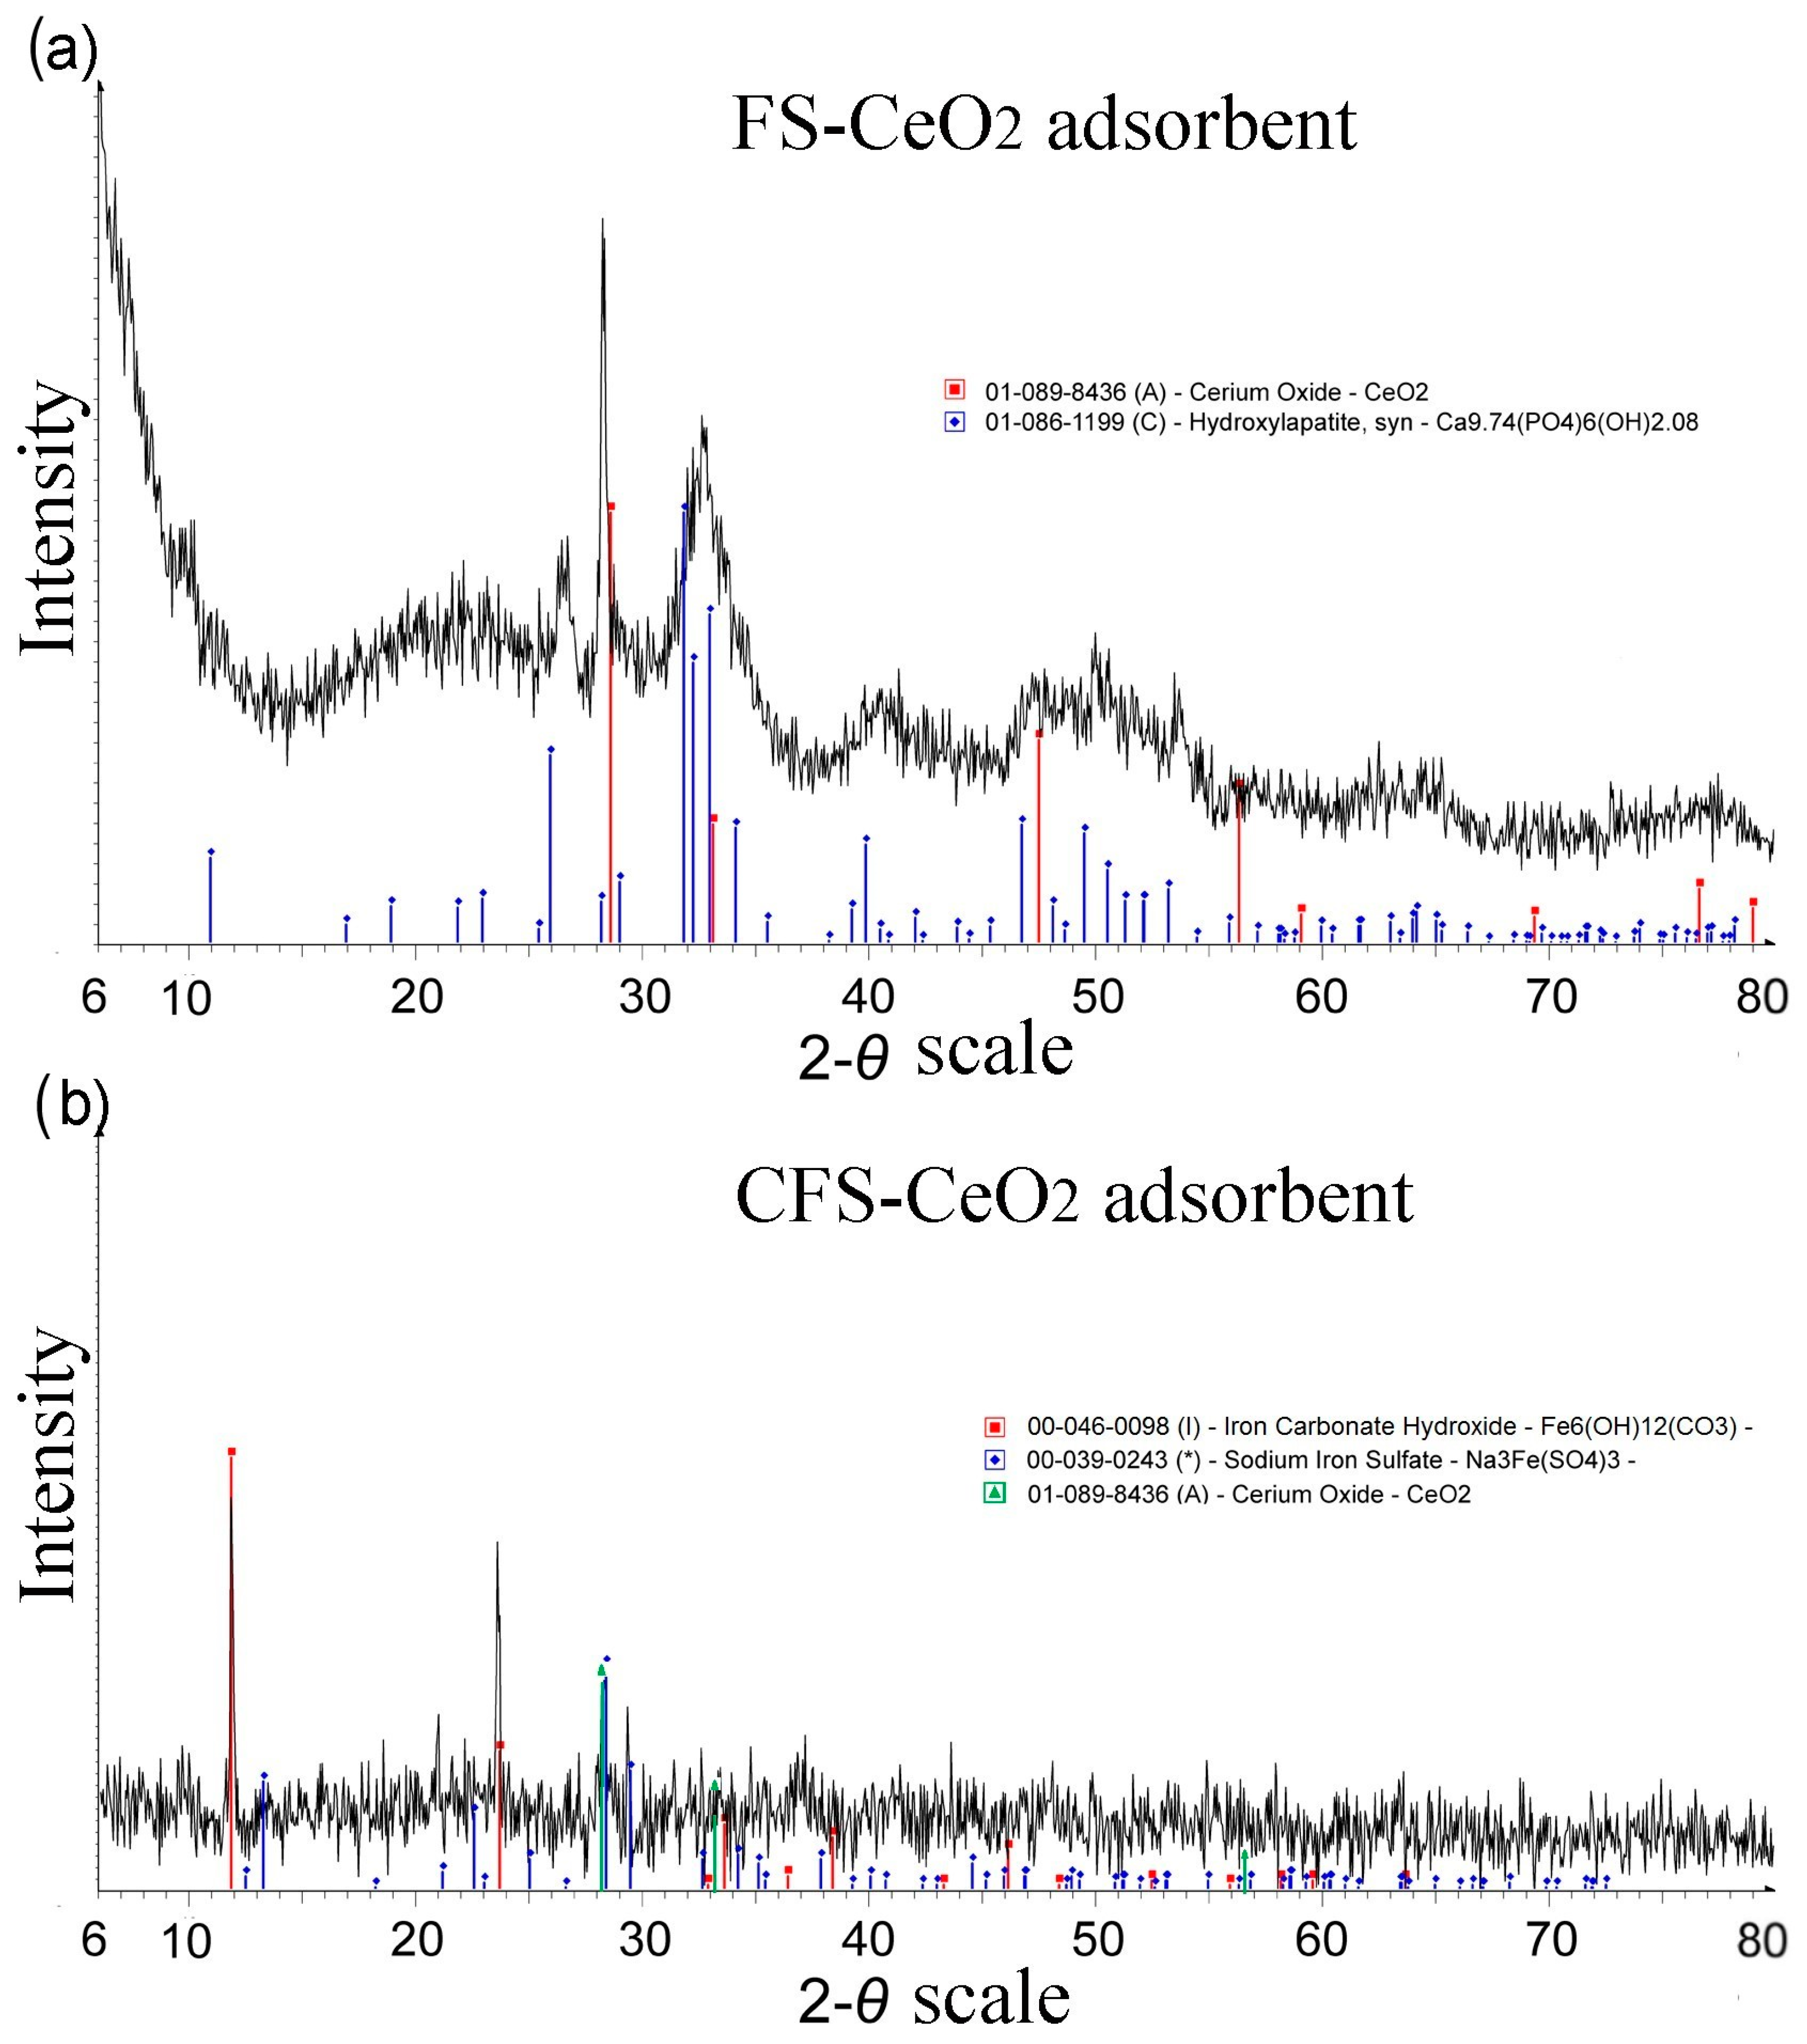
The XRD diagram (Figure 2) for both modified adsorbents confirmed CeO2 formation on the surfaces of fish scales. Values of d could be indexed as γ-cerium with the centered cubical crystal structure of CeO2 (JCPDS No. 01-089-8436). The crystal structure of CePO4 was also observed (JCPDS No. 01-074-1890), which is a consequence of the reaction of cerium ions with a constituent of hydroxyapatite from fish scales.

3.4. Fourier Transform Infrared Spectroscopy

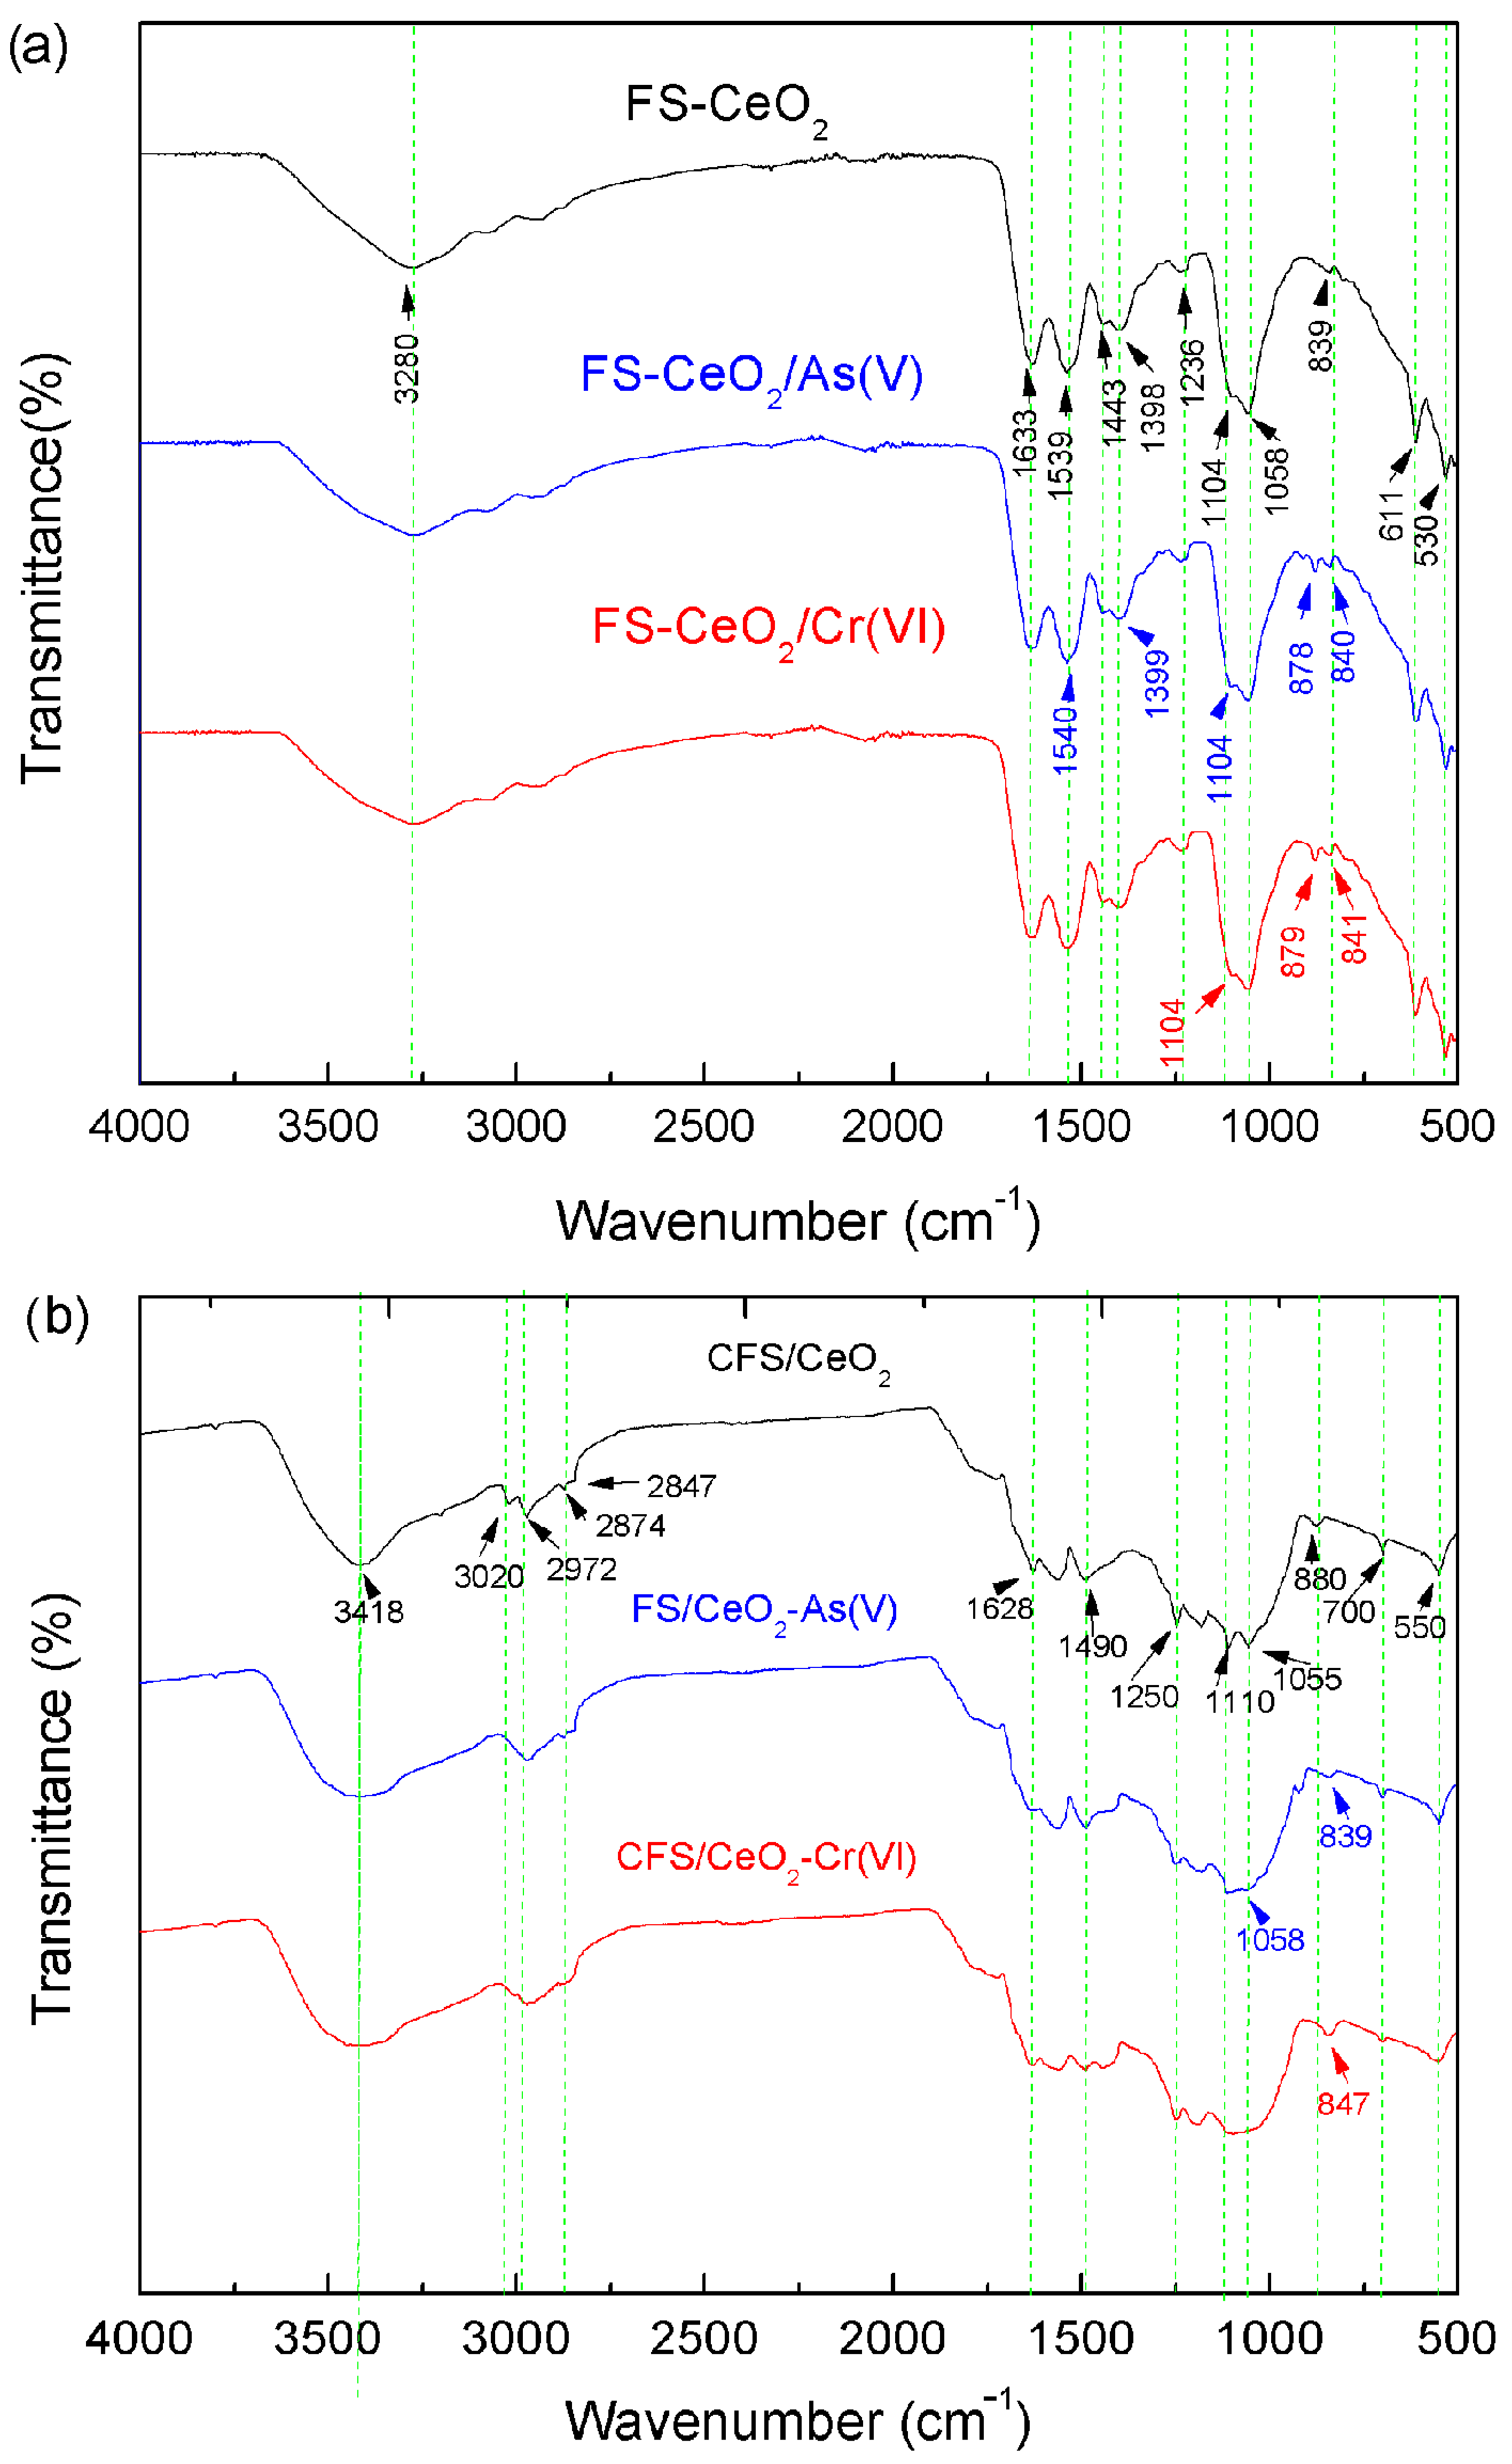
FTIR spectrometry was used to confirm the presence of functional groups and their interaction with adsorbing species. The FTIR spectra (Figure 3a) show a peak at 3280 cm−1 which corresponds to the overlapped stretching vibration of O–H and N–H groups. Similar results were obtained for CFS-CeO2 (Figure 2b). The bands at 2970, 2874 and 2847 cm−1 are due to the valence C–H stretching vibration and the range of 1443–1398 cm−1 is attributed to the bending mode of C–H groups [4]. Bending vibrations of surface OH groups and adsorbed water are indicated by a peak at 1633 (Figure 2a) and 1628 cm−1 (Figure 3b). Vibrations of Ce–OH bonds, observed at 1104 and 1058 cm−1 (Figure 2a), and 1110 and 1055 cm−1 (Figure 3b), were similarly found in the literature [19]. The band at 550 cm−1 belongs to the Ce–O layer stretching vibrations, and the peak at 700 cm−1 corresponds to stretching vibrations of Ce–O–C bonds (Figure 3b). The band at 1236 cm−1 is assigned to stretching vibrations of C–N bonds (Figure 3a). After chromium adsorption (Figure 2b), Ce–OH bending vibrations disappear and a new vibration occurs at 847 cm−1 assigned to Cr–O–Ce bonds. A similar result is seen for As(V) adsorption, which is confirmed by the appearance of a band at 839 cm−1 attributed to As–O–Ce bonds [22]. The exchange of the OH group from Ce–OH with As(V) or Cr(VI) oxyanions can be explained as a specific adsorption mechanism. Specific adsorption includes reactions of ligand substitutions where anions substitute OH and/or H2O on the surface.

3.5. Scanning Electron Microscopy (SEM) and EDS Analysis

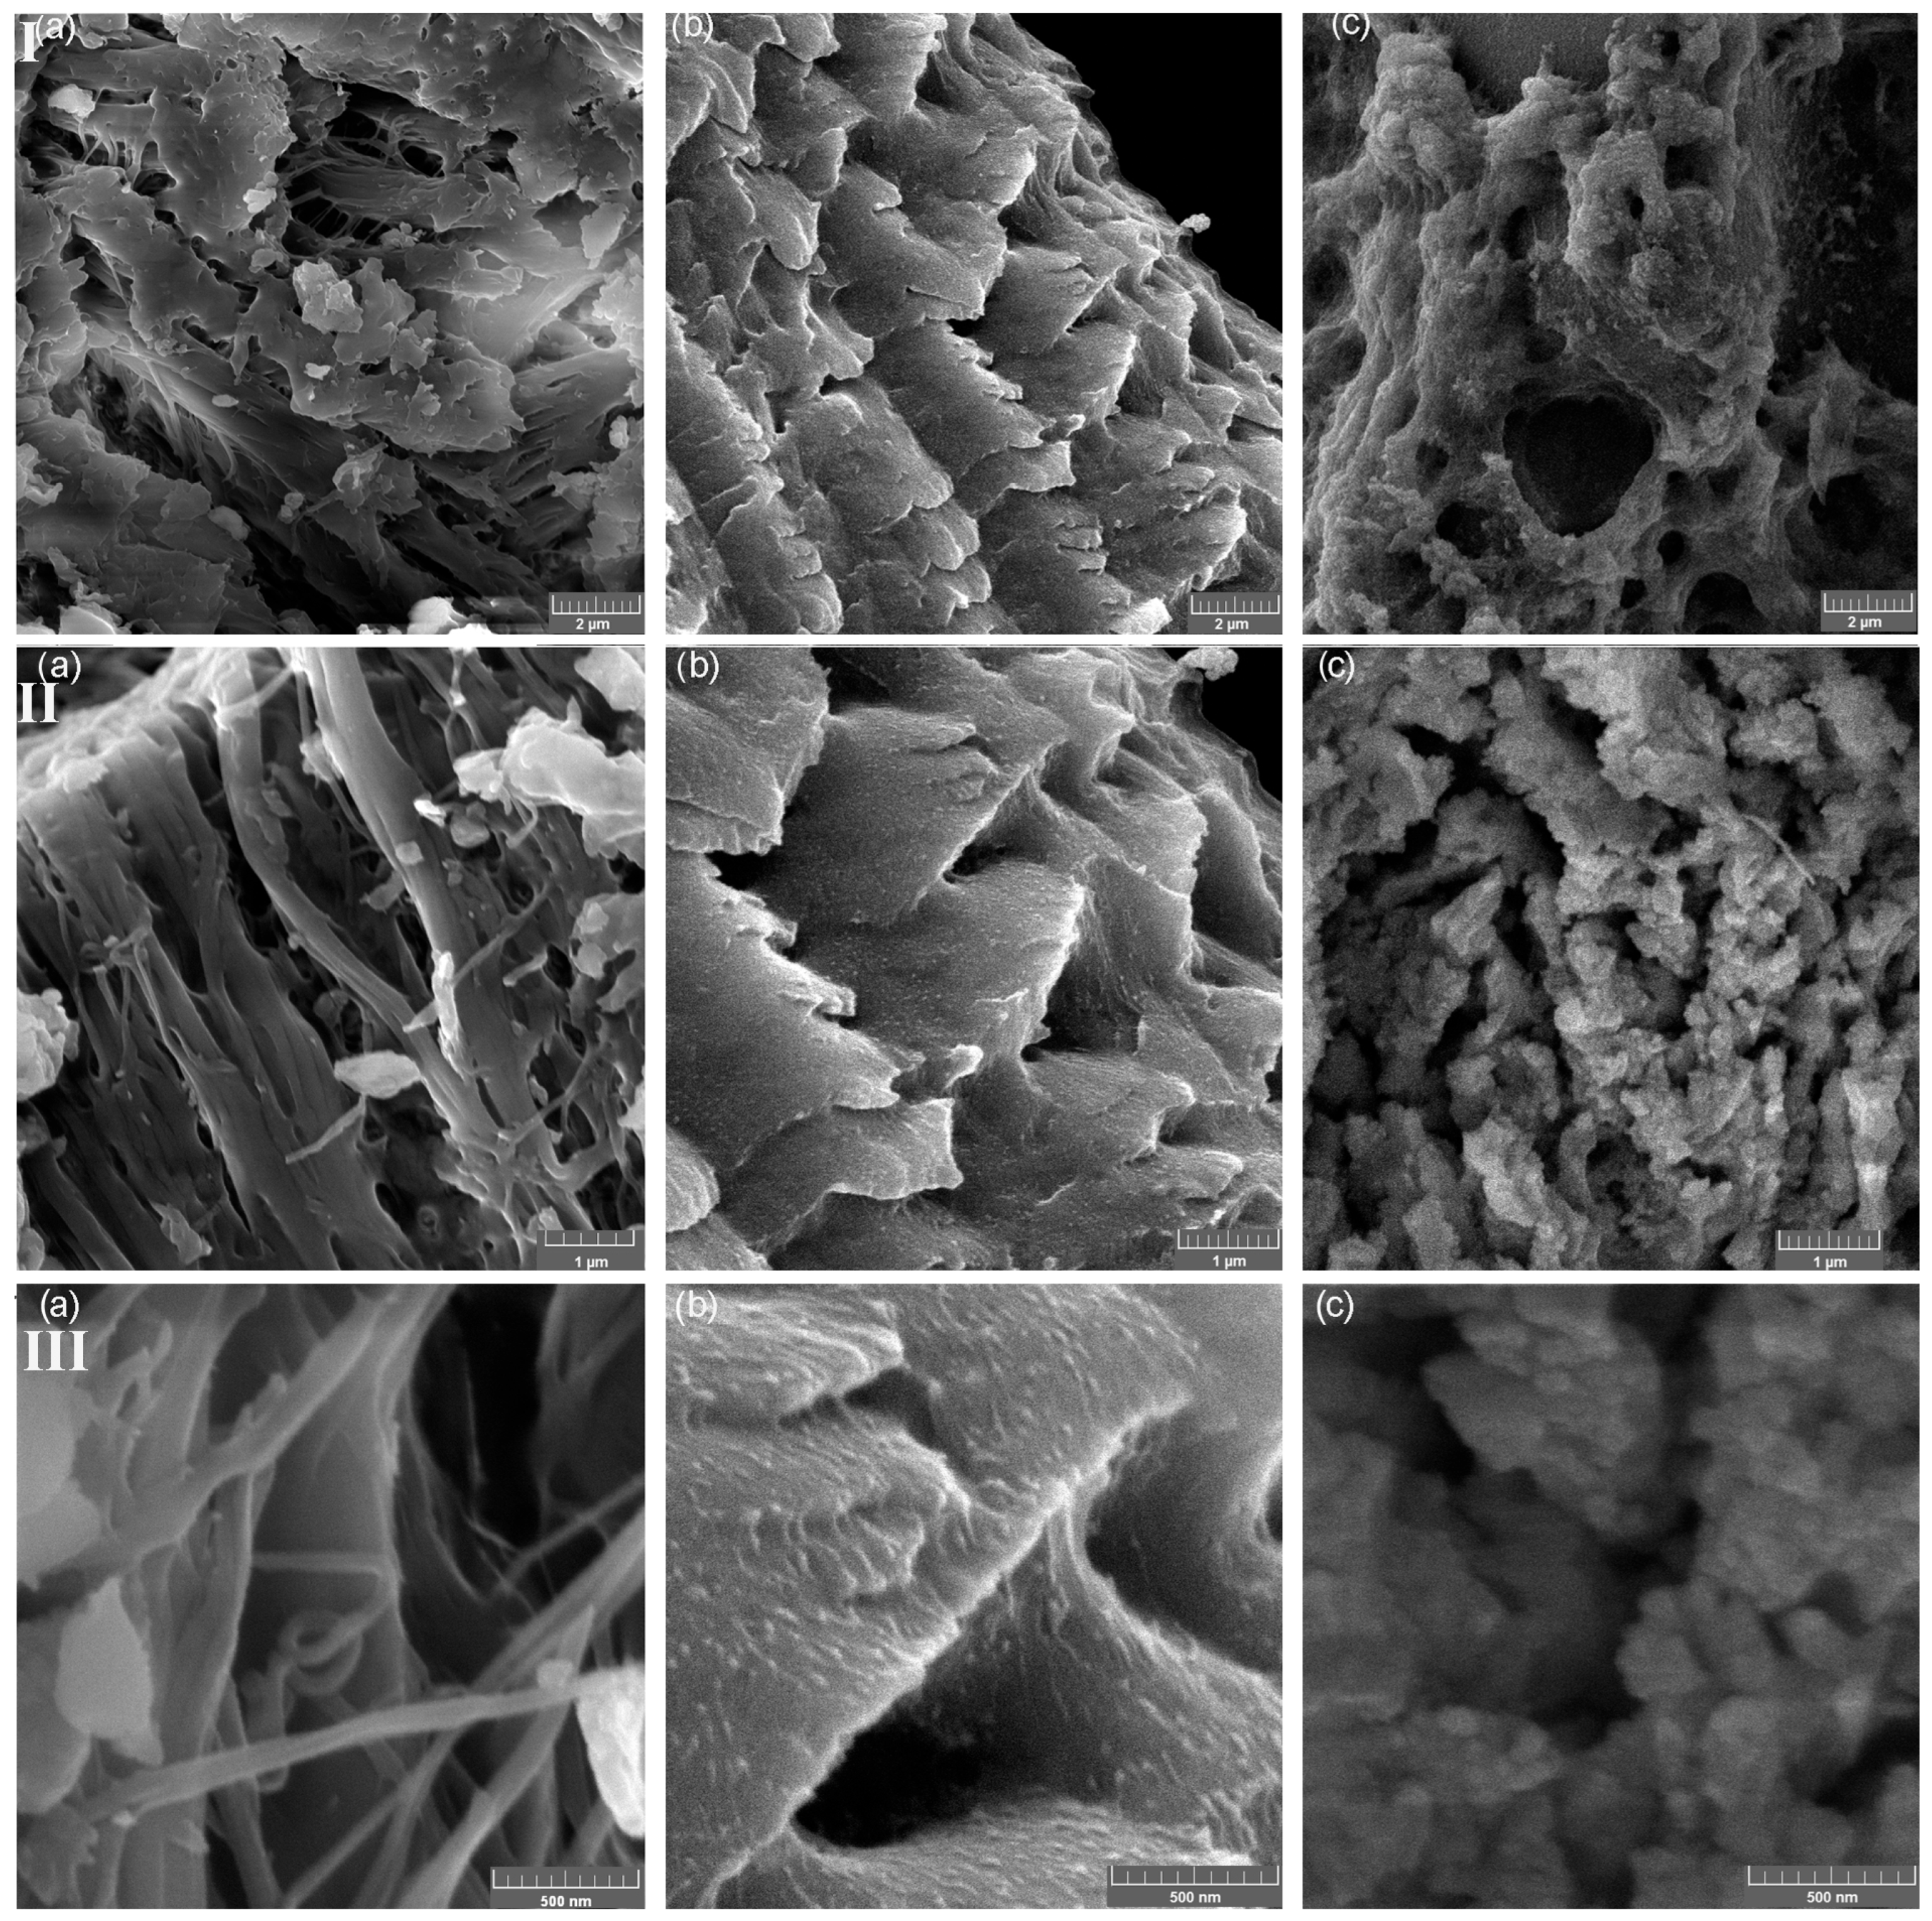
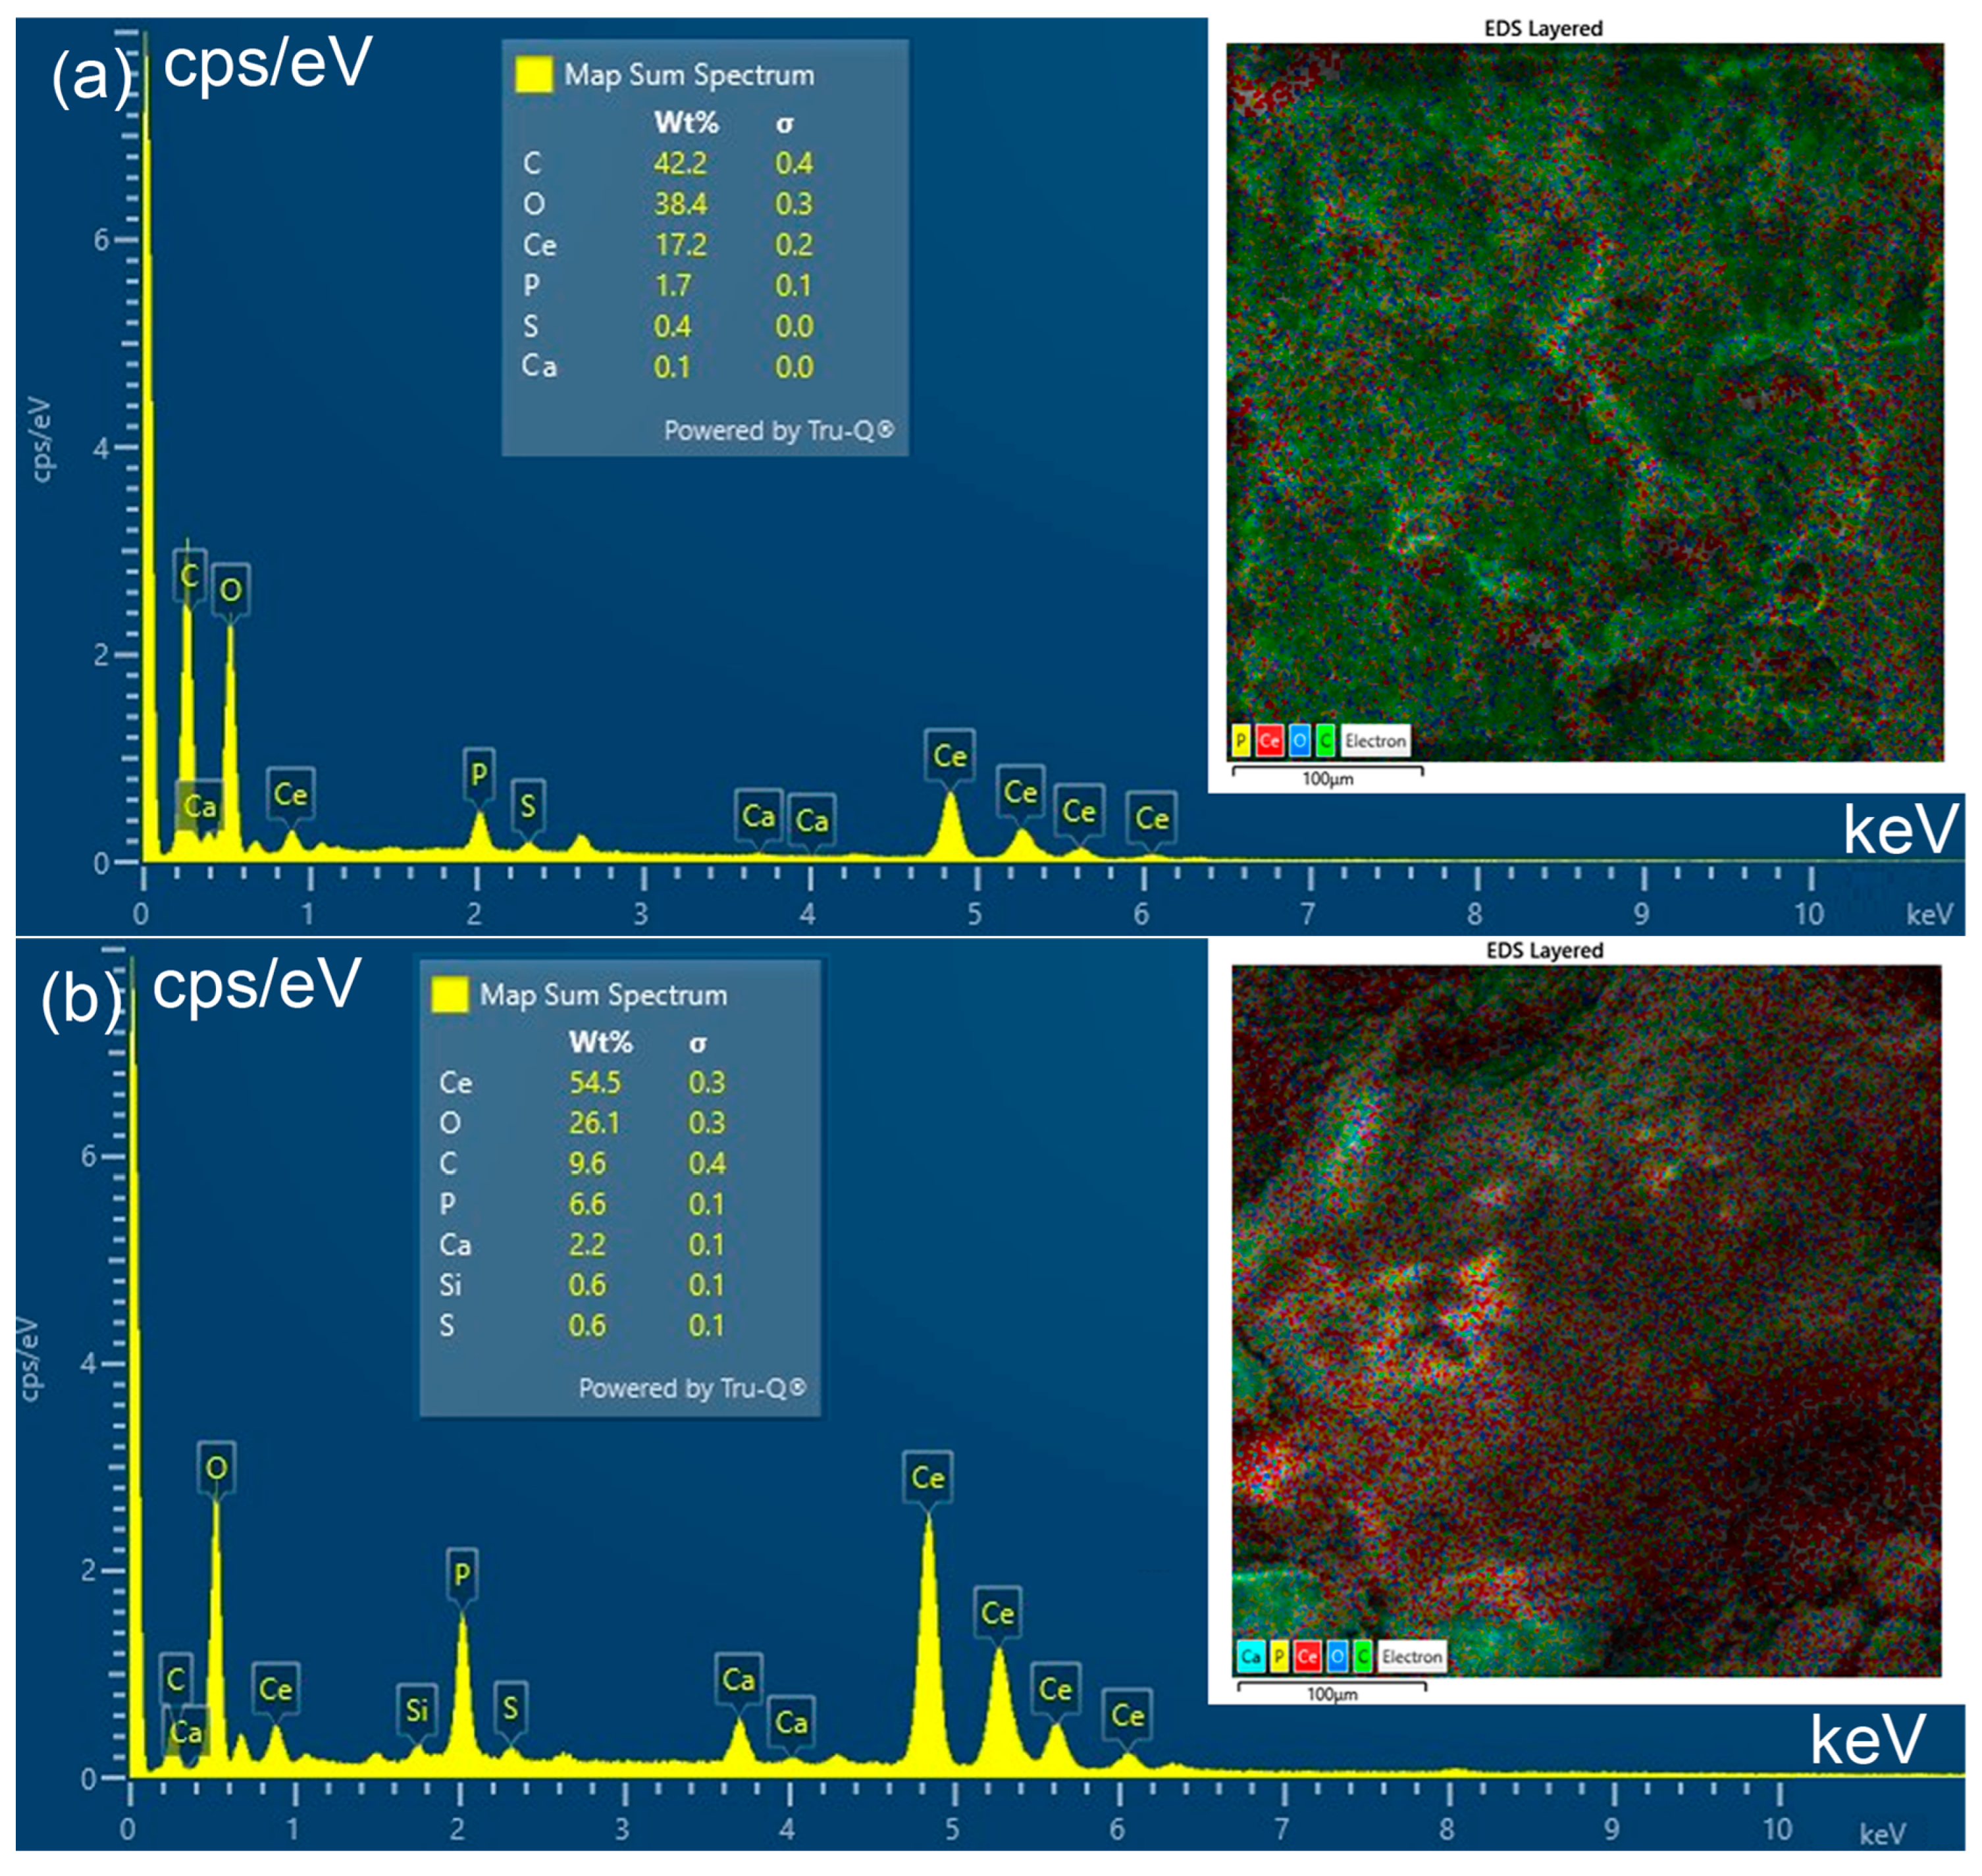
The SEM micrographs of PFS, FS-CeO2 and CFS-CeO2 and the related EDS analysis are shown in Figure 4 and Figure 5, respectively. Two parts of fibrous and porous structures of fish scales are clearly visible in the SEM images taken at different magnifications (Figure 4). The thin outer mineralized layer is mainly composed of calcium-deficient hydroxyapatite with a small amount of sodium and magnesium, and phosphate sites of apatite are occupied with carbonate anions. The thick inner layer (also known as basal or fibril plate) is mainly composed of collagen [19]. Also, in Figure 5a,b, surface-dispersed CeO2 nanoparticles can be seen, as additionally confirmed by the results from EDS analysis (Figure 5).
The EDS spectra of FS-CeO2 (II) and CFS-CeO2 adsorbents are shown in Figure 5a and Figure 5b, respectively. The obtained results confirm the presence of cerium and elements present in hydroxyapatite and collagen from carp fish scale. The somewhat higher amount of cerium obtained for the FS-CeO2 adsorbent is due to the thermally induced volatilization of organic constituents, which leads to carbonization of the material, i.e., the creation of the polyaromatic structures covered by CeO2 nanocrystal deposits.

3.6. Adsorption Study

3.6.1. The Influence of pH

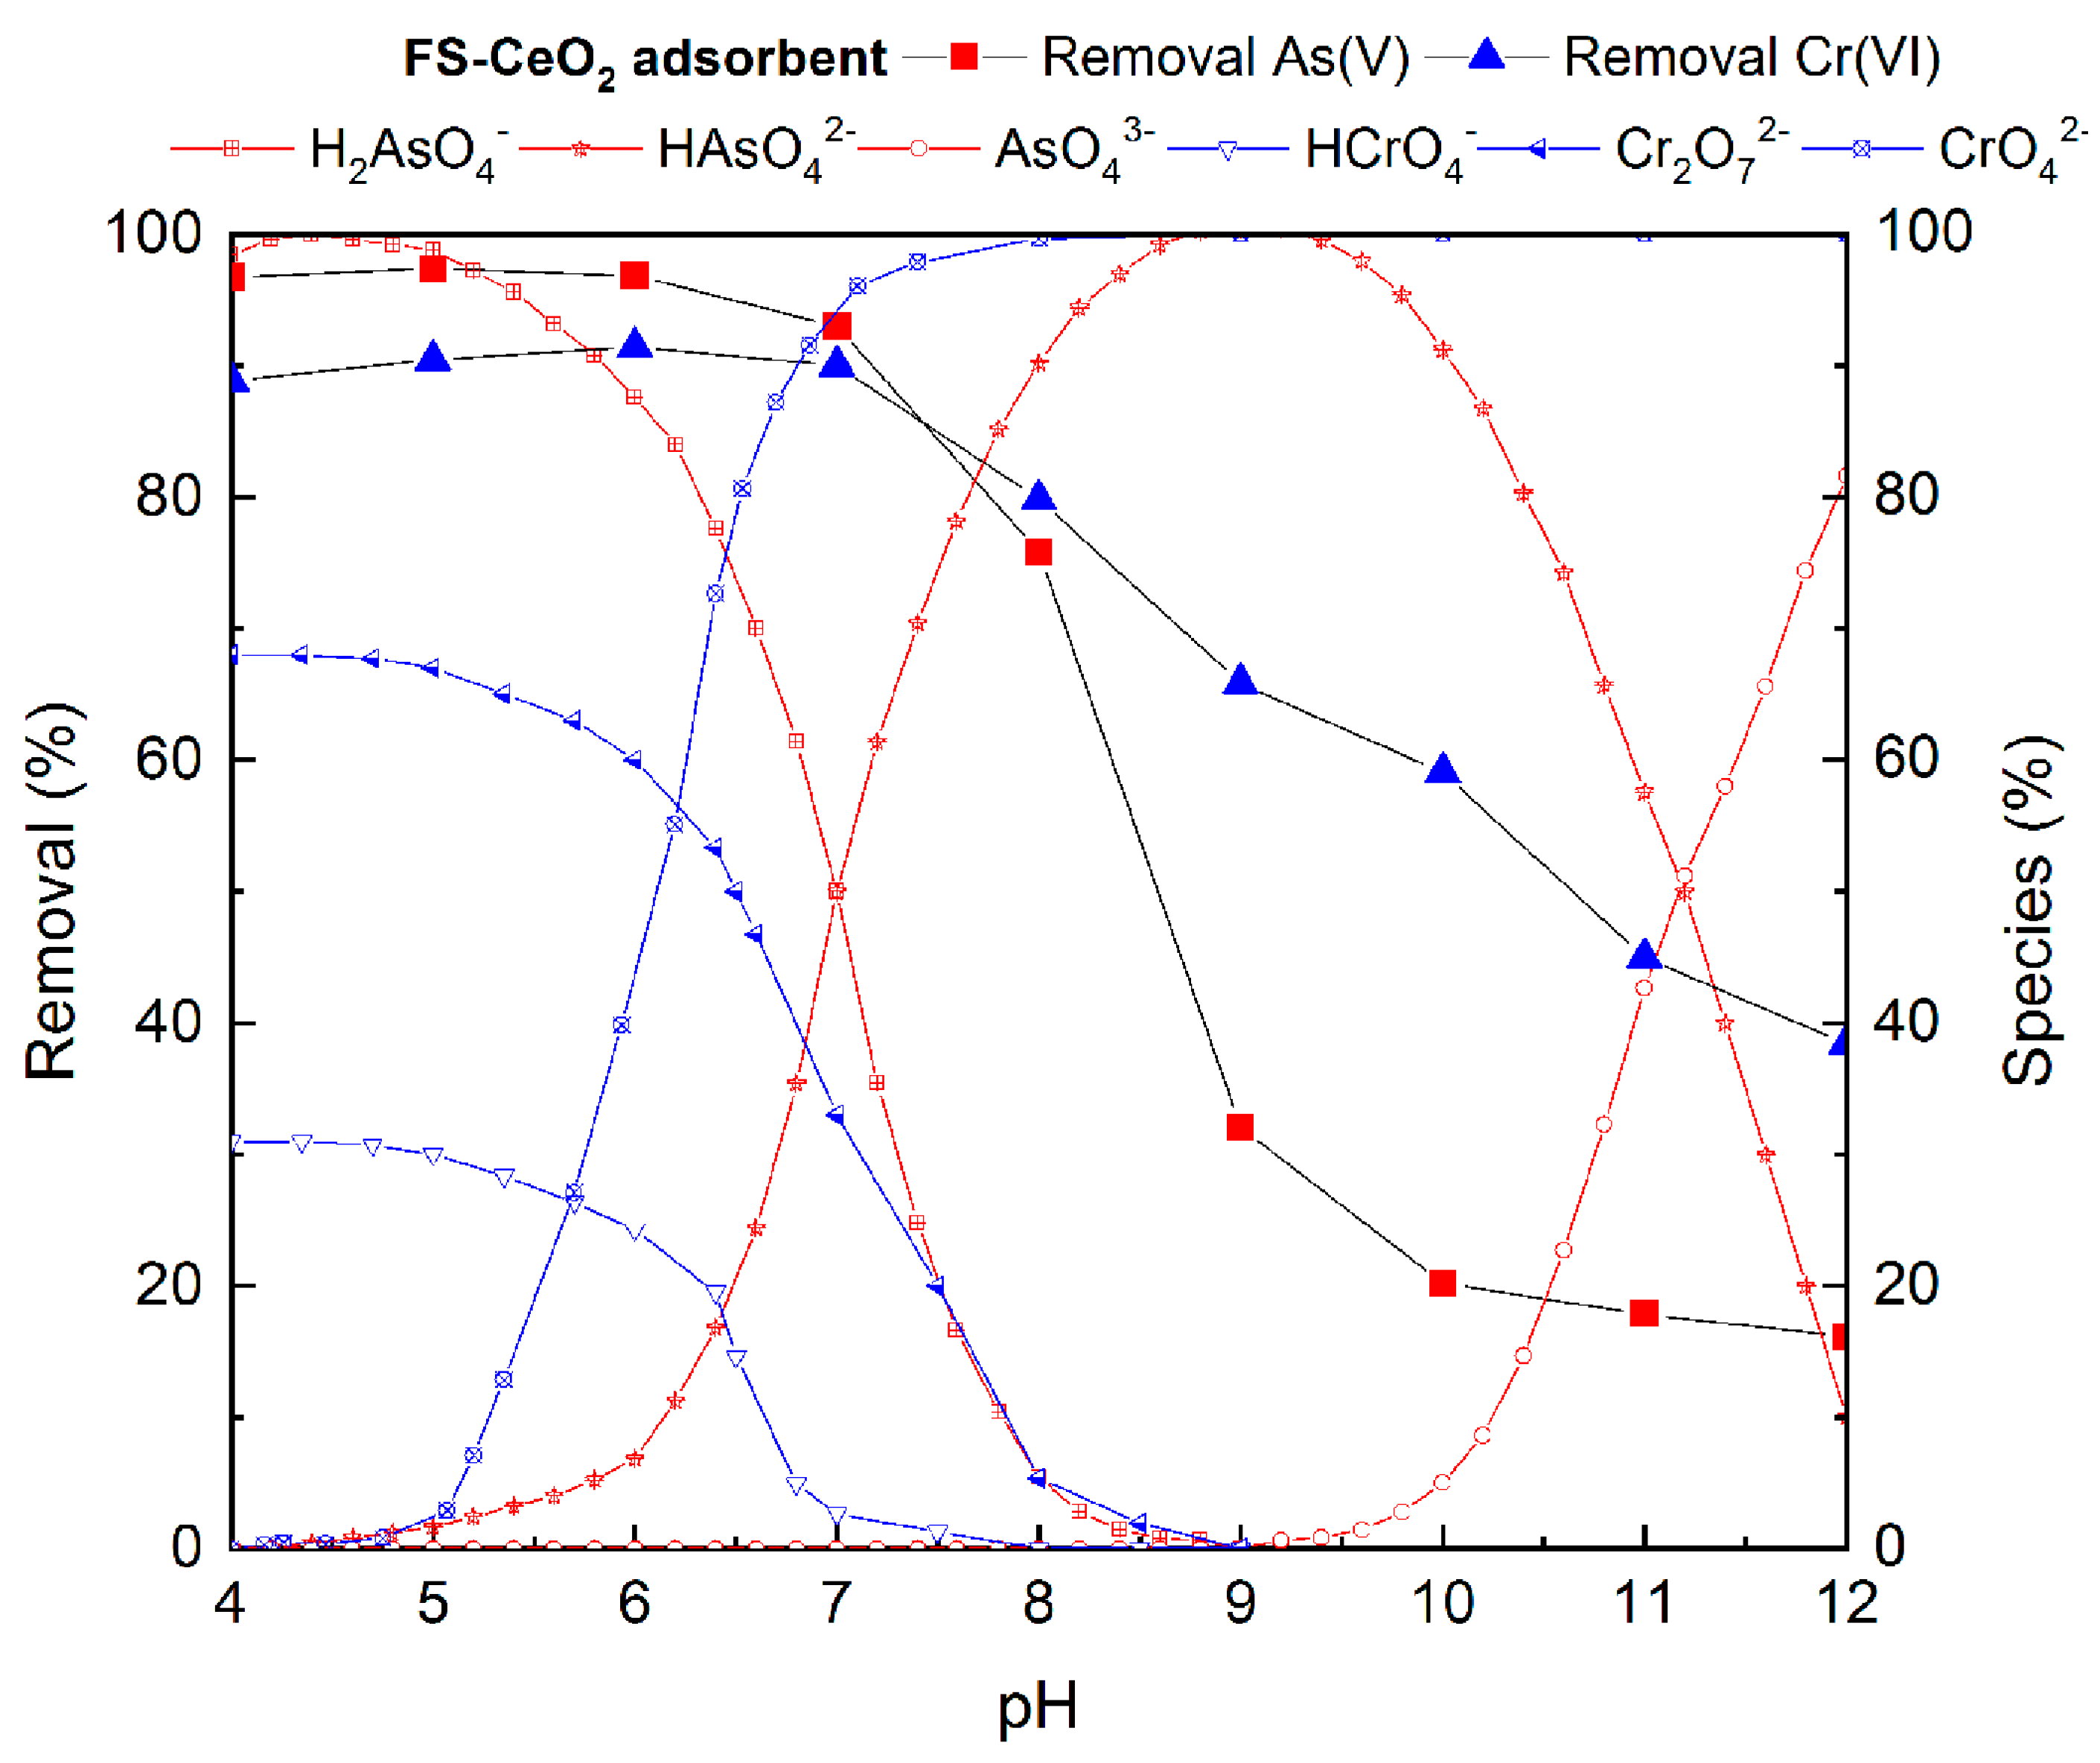
The influence of pH on the system is manifested through (i) the surface characteristics of the adsorbent, (ii) the degree of ionization of the group present on the adsorbent surface and (iii) ion speciation in the water solution at an operative pH value. It is well known that the speciation of pollutants in water depends on the pH, and, thus, pH-dependent ionic speciation of chromium and arsenic is shown in Figure 6 [4,5,13,23].
The effect of all these factors on the efficiency of As(V) and Cr(VI) removal in the pH range from 4.0 to 12.0 on FS-CeO2 was investigated (Figure 6). The dependence of the adsorption of CFS-CeO2 (the worst result) on the pH value is very similar to the FS-CeO2 adsorbent and is given in Figure S5.
The highest degree of As(V) and Cr(VI) adsorption on FS-CeO2 was achieved in the pH range from 5 to 7, where around 90% of Cr(VI) and 95–98% of As(V) ions were removed (Figure 5). Significant decreases in arsenic and chromium adsorption were detected at a pH higher than 7. Despite the difference in basic material properties, CFS-CeO2 showed similar influences of pH on As(V) and Cr(VI) removal efficiency (Figure S1). These results can be explained by taking into consideration the pHPZC value and textural properties of the studied adsorbents.
At lower pH, the adsorbent surface is positively charged due to the interactions with H3O+ ions. For both FS-CeO2 and CFS-CeO2 adsorbents at pH < pHPZC, the positively charged surface attracts negatively charged arsenic ions (H2AsO4- and HAsO42−) or chromium ions (Cr2O72− and CrO42−), while at pH > pHPZC, electrostatic repulsion leads to a decrease in adsorption efficiency. The affinity of oxyanions toward the positive adsorbent surface is somewhat diminished due to the competition with H3O+ ions at pH < 5.
The pH-dependent adsorption study showed that adsorption processes are favorable near to neutral pH, and due to this, pH 6 was selected for adsorption experiments. At pH 6, protonated functional groups prevail at the adsorbent surface, contributing to increased electrostatic attraction with pollutants. H2AsO4 and HAsO42− show both proton-donating and proton-accepting properties, while chromate oxyanions interact only via proton-accepting interaction. Additionally, it was expected that the advanced textural properties of CFS-CeO2, i.e., increased specific surface area and pore volume, and numerous active sites present on the surface of the CeO2 deposit would contribute to better adsorption performance. Contrary to that, the somewhat better adsorption performance of FS-CeO2 indicates that an abundance of different surface functionalities, both from FS and CeO2 deposits, plays a significant role in the adsorption process.

3.6.2. Optimization of Adsorption Using FS-CeO2 and CFS-CeO2 Adsorbents

The eco-friendliness of the entire process was further supported through RSM optimization of the adsorption processes. The BBD is preferred when parameters are limited to three levels [22]. In this study, FS-CeO2 was used to optimize the conditions for oxyanion removal, and the adsorption process was performed numerically and graphically. The results from the optimization process were confirmed through additional experimental testing. A four-factor BBD with RSM was used to maximize As(V) removal considering pH (X1), adsorbent dosage (X2), temperature (X3) and adsorption time (X4) as independent predictor parameters, while As(V) removal (Y) was considered the process response in the Design of Experiment. Hence, the developed quadratic model for As(V) adsorption in terms of encoded factors was established. The quadratic model (Equation (1)) estimates the parametric coefficients of the statistical model by correlating both predictor parameters and responses using the least-squares regression:
qe = 35.5 − 9.75A − 8.83B + 1.33C + 3.75D − 4.25AB + 8.25AC + 1.25AD + 2.50BC + 9.25BD − 5.75CD + 9.17A2 + 7.546B2 + 6.04C2 + 5.67D2
In this model, positive coefficients correspond to favorable effects on As(V) removal for C, D, AC, AD, BC, BD, A2, B2, C2 and D2, while the opposite is true for negative values, i.e., A, B, AB and CD coefficients. Parameters with coefficients close to zero indicate a lower effect on As(V) removal than that of larger coefficients under the same magnitude of change in that certain factor.
The statistical significance of the developed model and predictors was evaluated using the analysis of variance (ANOVA) with a 95% confidence interval of As(V) removal, as shown in Table 5.
The significance of each factor coefficient was determined using probability values (p-values) from Fisher’s (F) exact test, where values of “Prob > F” less than 0.0500 indicate that model terms are significant. The continuous variance assumption was confirmed graphically using Figure S5, showing the plot of predicted response versus the internally studentized residuals, where internally studentized residual values were attained by dividing the residual values by the respective standard deviation. The sample points in Figure S5 were randomly scattered within outlier detection limits from −3 to +3. Moreover, the observed and predicted response in Figure S5a indicated minor discrepancies and a reasonable agreement between the predicted model and observed values. Therefore, the prediction model expressed in Equation (1) is deemed satisfactory.
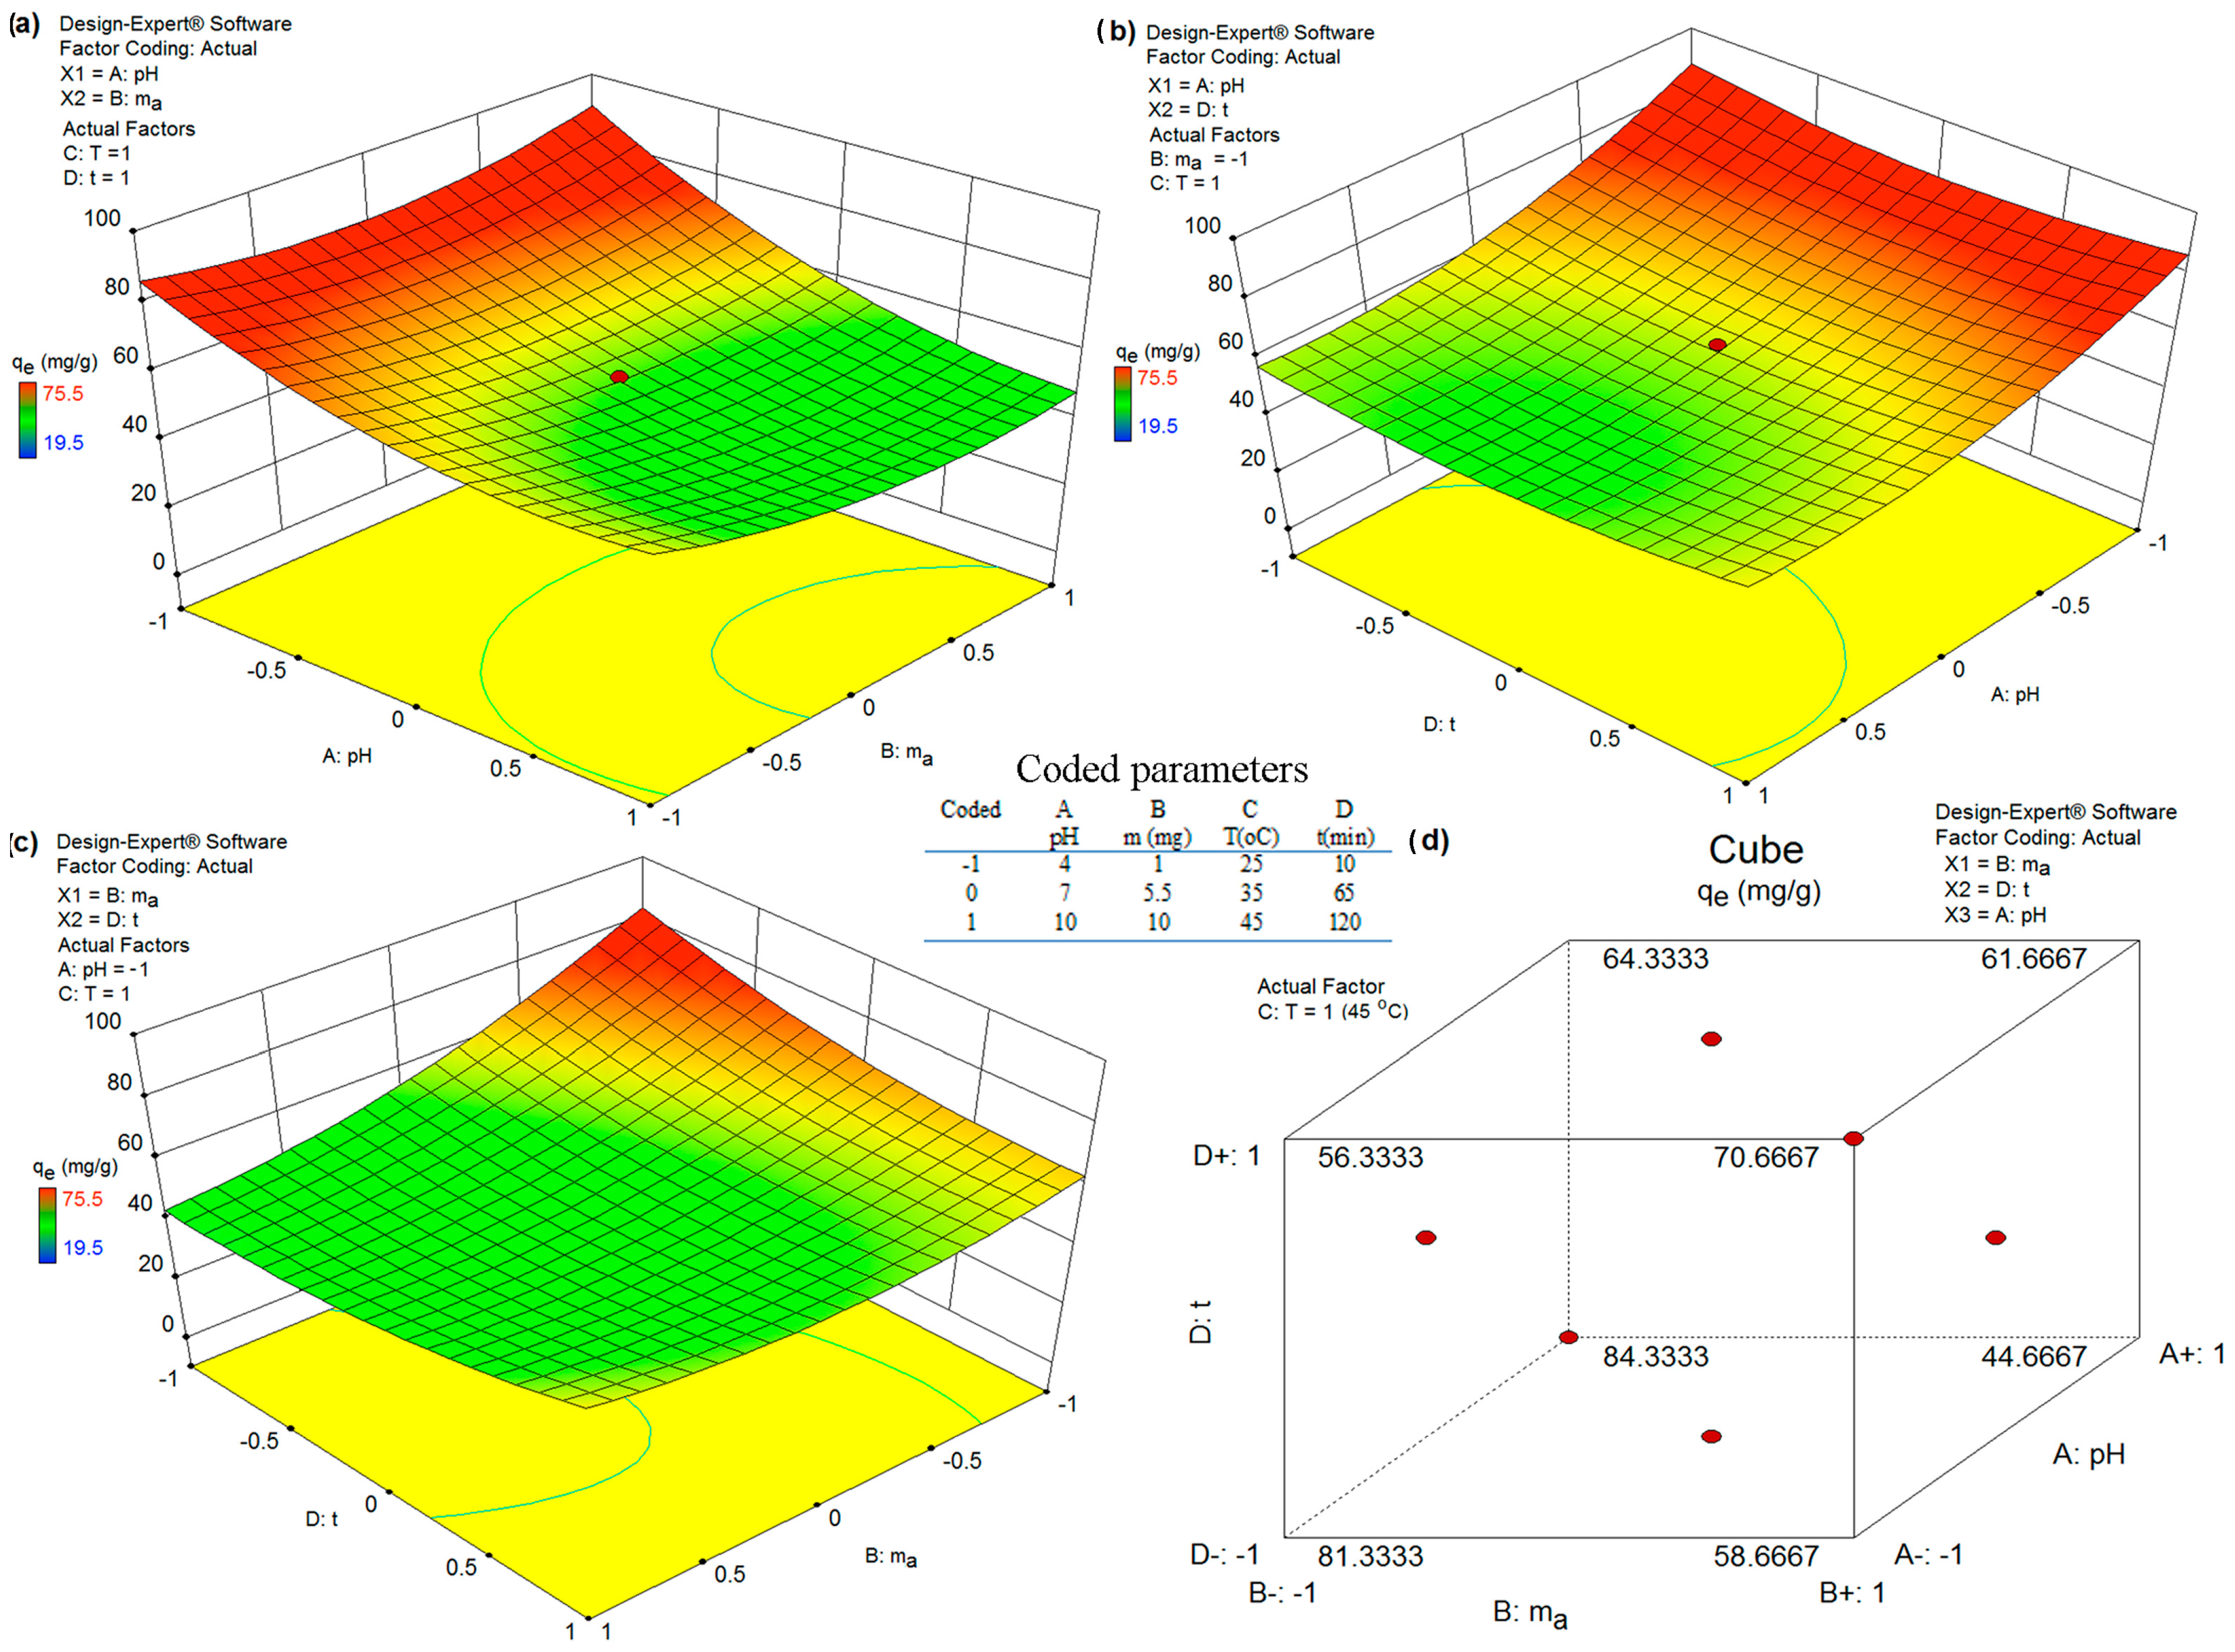
Interaction between Model Parameters and 3D Response Surface: As shown in Table 5, among all model parameters, the interaction between the pH, adsorbent dosage (AB), temperature and time adsorption (CD) did not have significant effects on As(V) removal. In contrast, the interaction between the pH and time adsorption and temperature (AC and AD) and the interaction between the adsorbent dosage and temperature and time adsorption (BC and BD) presented significant effects. Thus, the choice of the pH, adsorbent dosage and time adsorption could be optimized to minimize any treatment-related costs, especially to achieve a high treatment efficiency. Equation (1) was used to obtain the interaction plots in Figure 7 while maximizing As(V) removal (Y) and the desirability value (D).
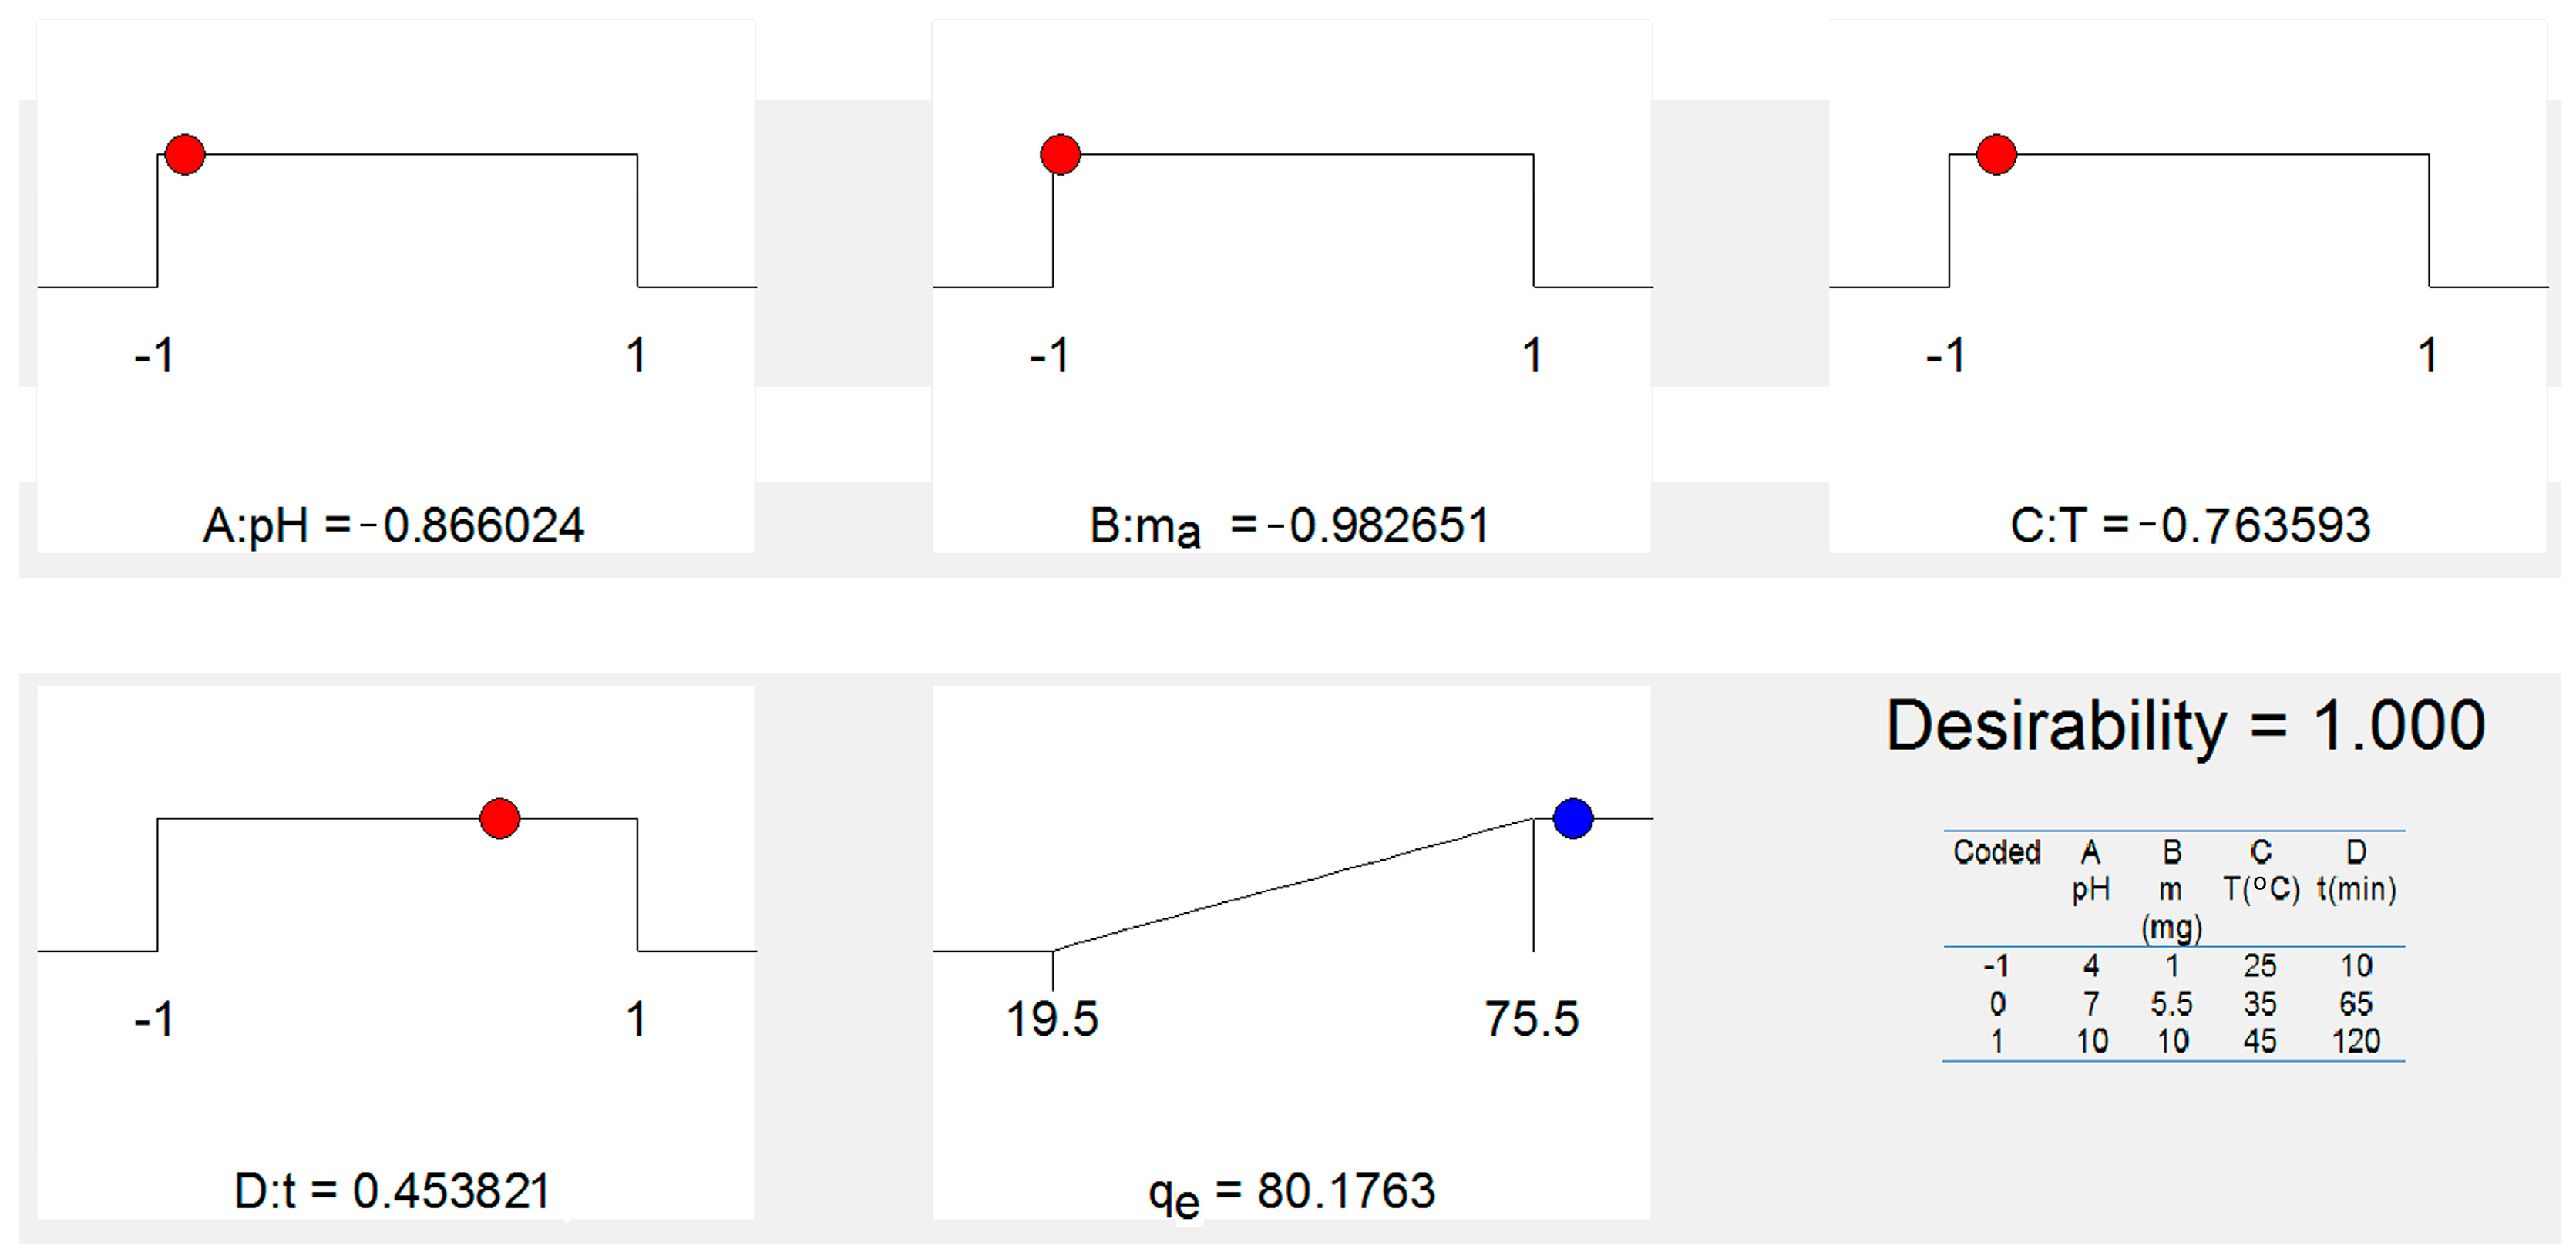
The value of desirability is determined by statistical software based on Equation (1); the graphic representation of the optimization of desirability is given in Figure 8. Hence, a desirability value of 1.00 was achieved while acquiring an As(V) removal of qe = 80.17 mg g−1 under optimum conditions of pH (5.38), mass dosage (1 mg), temperature (42 °C) and time adsorption (90 min) for the removal of As(V) ions from a water solution using the FS-CeO2 adsorbent. Finally, the obtained optimum experimental conditions were validated by an extra experiment, which presented As(V) removal as qe = 80.17 mg g−1). The observed experimental As(V) removal under optimum conditions was within the 95% CI and 2% relative standard deviation (RSD) of the predicted value, which confirms the accuracy and reliability of the developed model.
Similar optimization results were obtained for the removal of Cr(VI) ions from aqueous solutions, which was expected due to the similar chemistry of these two oxyanions. Statistical indicators of the optimization of Cr(VI) ion removal (Table S8) and a graphic representation of the influence of variables on the removal capacity of Cr(VI) ions (Figure S6) are given in the Supplementary Materials, Section S3.6.4. Models for optimization of the adsorption process. The obtained results were the basis for the establishment and definition of the condition for adsorption experiments.

3.6.3. Adsorption Equilibrium Study

The condition of interaction/bonds at the surfaces of the adsorbate and adsorbent can be analyzed by fitting experimental data with different adsorption isotherms. The experimental adsorption data were processed using the Langmuir, Freundlich, Temkin and Dubinin–Radushkevich isotherm models. The normalized coefficient of determination (R2), standard deviation and analysis of variance (ANOVA) with a 95% confidence interval were used to evaluate correlation. Analysis of variance (ANOVA) using Origin 8 software determined the significance of each model using probability values (p-values) from Fisher’s (F) exact test, where “Prob > F” values less than 0.0500 indicate that model terms are significant. Based on the normalized coefficient of determination and variance analysis, the order of modeling success for both adsorbents and oxyanions is as follows: Freundlich, Langmuir, Temkin and Dubinin–Radushkevich isotherm models.
The results of As(V) and Cr(VI) adsorption modeling are listed in Table 6, while the results of the other isothermal models are given Table S7 and Figures S2 and S3.
According to the basic Freundlich isotherm postulate, the mechanism of adsorption onto the FS-CeO2 and CFS-CeO2 adsorbents can be considered multilayer adsorption with an exponential distribution of both adsorbent active sites and their related energies with respect to the adsorbate. The value n in the Freundlich isotherm is a measure of the adsorption intensity or heterogeneity of the adsorbent surface, and a value close to zero indicates a highly heterogeneous adsorbent surface. A value of n less than 1 implies a chemisorption mechanism, and a higher value indicates combined adsorption, i.e., physisorption and chemisorption with different contributions at different steps of the process. Thus, the results in Table 6 indicate that multiple cooperative mechanisms of physical and chemical adsorption participate in the overall process. The results from another study [15] also indicate that a complex mechanism is present, while differences in the adsorption performances of both adsorbents clearly confirm the significance of functionalities present at the surface of the CeO2 deposit and place less significance on basic materials, i.e., FS and CFS.

3.6.4. Adsorption Thermodynamics

The Gibbs free energy (ΔGΘ), enthalpy (ΔHΘ) and entropy (ΔSΘ) were calculated using the following Van’t Hoff Equations (S14) and (S15), and the calculated thermodynamic parameters are listed in Table 7 [5,23].
Negative values of Gibbs free energy (ΔGΘ) and positive values of entropy (ΔSΘ) at all temperatures indicate that adsorption processes are spontaneous. The decrease in Gibbs free energy (ΔGΘ) with an increase in temperature indicates higher spontaneity at higher temperatures. Due to coordination and hydrogen bonds, solvated Cr(VI) and As(V) ions are more easily dissolved at higher temperatures, and diffusion through the hydration shell and pore interior are faster processes contributing to a greater intensity of the overall process [4,5,23].
Positive values of the entropy change (ΔSΘ) indicate the tendency of greater system disorder on the FS-CeO2 and CFS-CeO2 surfaces and in the As(V) and Cr(VI) solution. It is shown in Table 7 that the values of Gibbs free energy (ΔGΘ) are similar, while the values of entropy (ΔSΘ) and enthalpy (ΔHΘ) are positive for all adsorbents at all considered temperatures, which indicates that the process is endothermic. In general, the exchange of free energy during physisorption is between −20 and 0 kJ mol−1; during simultaneous chemisorption and physisorption, it is between −20 and −80 kJ mol−1; and during chemisorption, it is less than −80 kJ mol−1 [23]. The results of the thermodynamic study confirmed the main contribution of physisorption, while other adsorption mechanisms take place too. In general, the complexity of the adsorption mechanism is manifested by several simultaneous reactions where physisorption, ion exchange, electrostatic interactions and chemisorption, i.e., surface complexation, at varying degrees, participate in the overall adsorption process.
Calculation of the separation factor (RL) indicates the feasibility of adsorption on a given adsorbent. It is calculated using Equation (S16). The adsorption process can be irreversible (RL = 0), favorable (0 < RL < 1), linear (RL = 1) or unfavorable (RL > 1) [4,5]. Thus, RL between 0.013 and 0.115 for the PFS, 0.011 and 0.132 for FS-CeO2 and 0.159 and 0.753 for CFS-CeO2 indicate that Cr(VI) adsorption is a favorable process.

3.6.5. Adsorption Kinetics

The dependence of the adsorption process on time was investigated in the time interval from 10 to 90 min. Equilibrium was reached after 240 min. Since differences in As(V) and Cr(VI) removal in time intervals from 90 and 240 min were insignificant (in the range of 3 to 5%), all experiments were limited to 90 min. The influence of the stirring technique in relation to ultrasonic treatment on adsorption efficiency was also investigated. Ultrasonication proved to be better than magnetic mixing. Ultrasound waves increase the adsorption rate due to lower resistance to mass transfer. Waves create microbubbles and cavitation around solid particles of adsorbent. Such micro impacts decrease the bond strength and increase the mass transfer of the adsorbate from the solution towards the adsorbent, resulting in an increased adsorption rate. Kinetic parameters, obtained using pseudo-first, pseudo-second, and second-order models, for As(V) and Cr(VI) ion adsorption on FS-CeO2 and CFS-CeO2 are listed in Table 8.
According to the coefficient of determination (R2) and standard error for the used models, the results show that the pseudo-second-order kinetic model best describes the kinetics of the process (Table 5).
The parameters obtained using diffusional kinetic models—intraparticle diffusion, Weber–Morris, Dunvald–Wagner and Homogenous Solid Diffusion Model [4,5,23]—are shown in Table S5. In general, the complex nature of adsorption kinetics can be described as a one-step adsorption process, as described by the pseudo-second-order equation, or with consecutive/competitive steps analyzed using diffusional kinetic models. The Weber–Morris model describes the adsorption process with two linear steps: the first step with fast kinetics and a slower second step. The first step corresponds to the external mass transfer on the adsorbent surface, while the second step describes the mass transfer of the substance into the porous structure of the adsorbent. The second step is highly dependent on pore dimensions and size, as well as on the density of their distribution on both adsorbents, here FS-CeO2 and CFS-CeO2. Intraparticle and film diffusion are the processes that slow down the transport of the adsorbate from the bulk of the solution to adsorbent active sites. In the final phase, adsorption is fast until the entire available outer surface of the adsorbent is saturated, and after intraparticle diffusion mainly dictates adsorbate transport inside the pore network. In conclusion, the obtained results (Table S5) show similar behavior as a result of similar chemistry and transportability of Cr(VI) and As(V) oxyanions.

3.6.6. The Adsorption Activation Energy

Determination of the activation energy was conducted on the basis of the kinetic results obtained at 298, 308 and 318 K using the Arrhenius equation:
ln K = E a R T + ln A
where K′ is the reaction constant at a certain temperature, Ea is the activation energy, R is the universal gas constant (8.314), T is the temperature in K and A is the Arrhenius pre-exponential factor (frequency factor). The obtained results (Table S6) indicate that the activation energy increase is a consequence of the actual adsorption mechanism [4,23]. It is well known that the activation energy for physisorption (physical adsorption) is usually lower than 40 kJ mol−1, while chemisorption requires higher activation energy [4,23]. The results of activation energy determination—2.97 and 7.20 kJ mol−1 for FS-CeO2 and 6.20 and 3.97 kJ mol−1 for CFS-CeO2—for As(V) and Cr(VI) ion removal, respectively, indicate that the main adsorption mechanism is physisorption. Low and similar values of Ea for both oxyanions and adsorbents are due to two factors: CeO2 nanoparticles play a significant role in the adsorption and the oxyanions have similar chemistry.

3.6.7. Bed Column Study

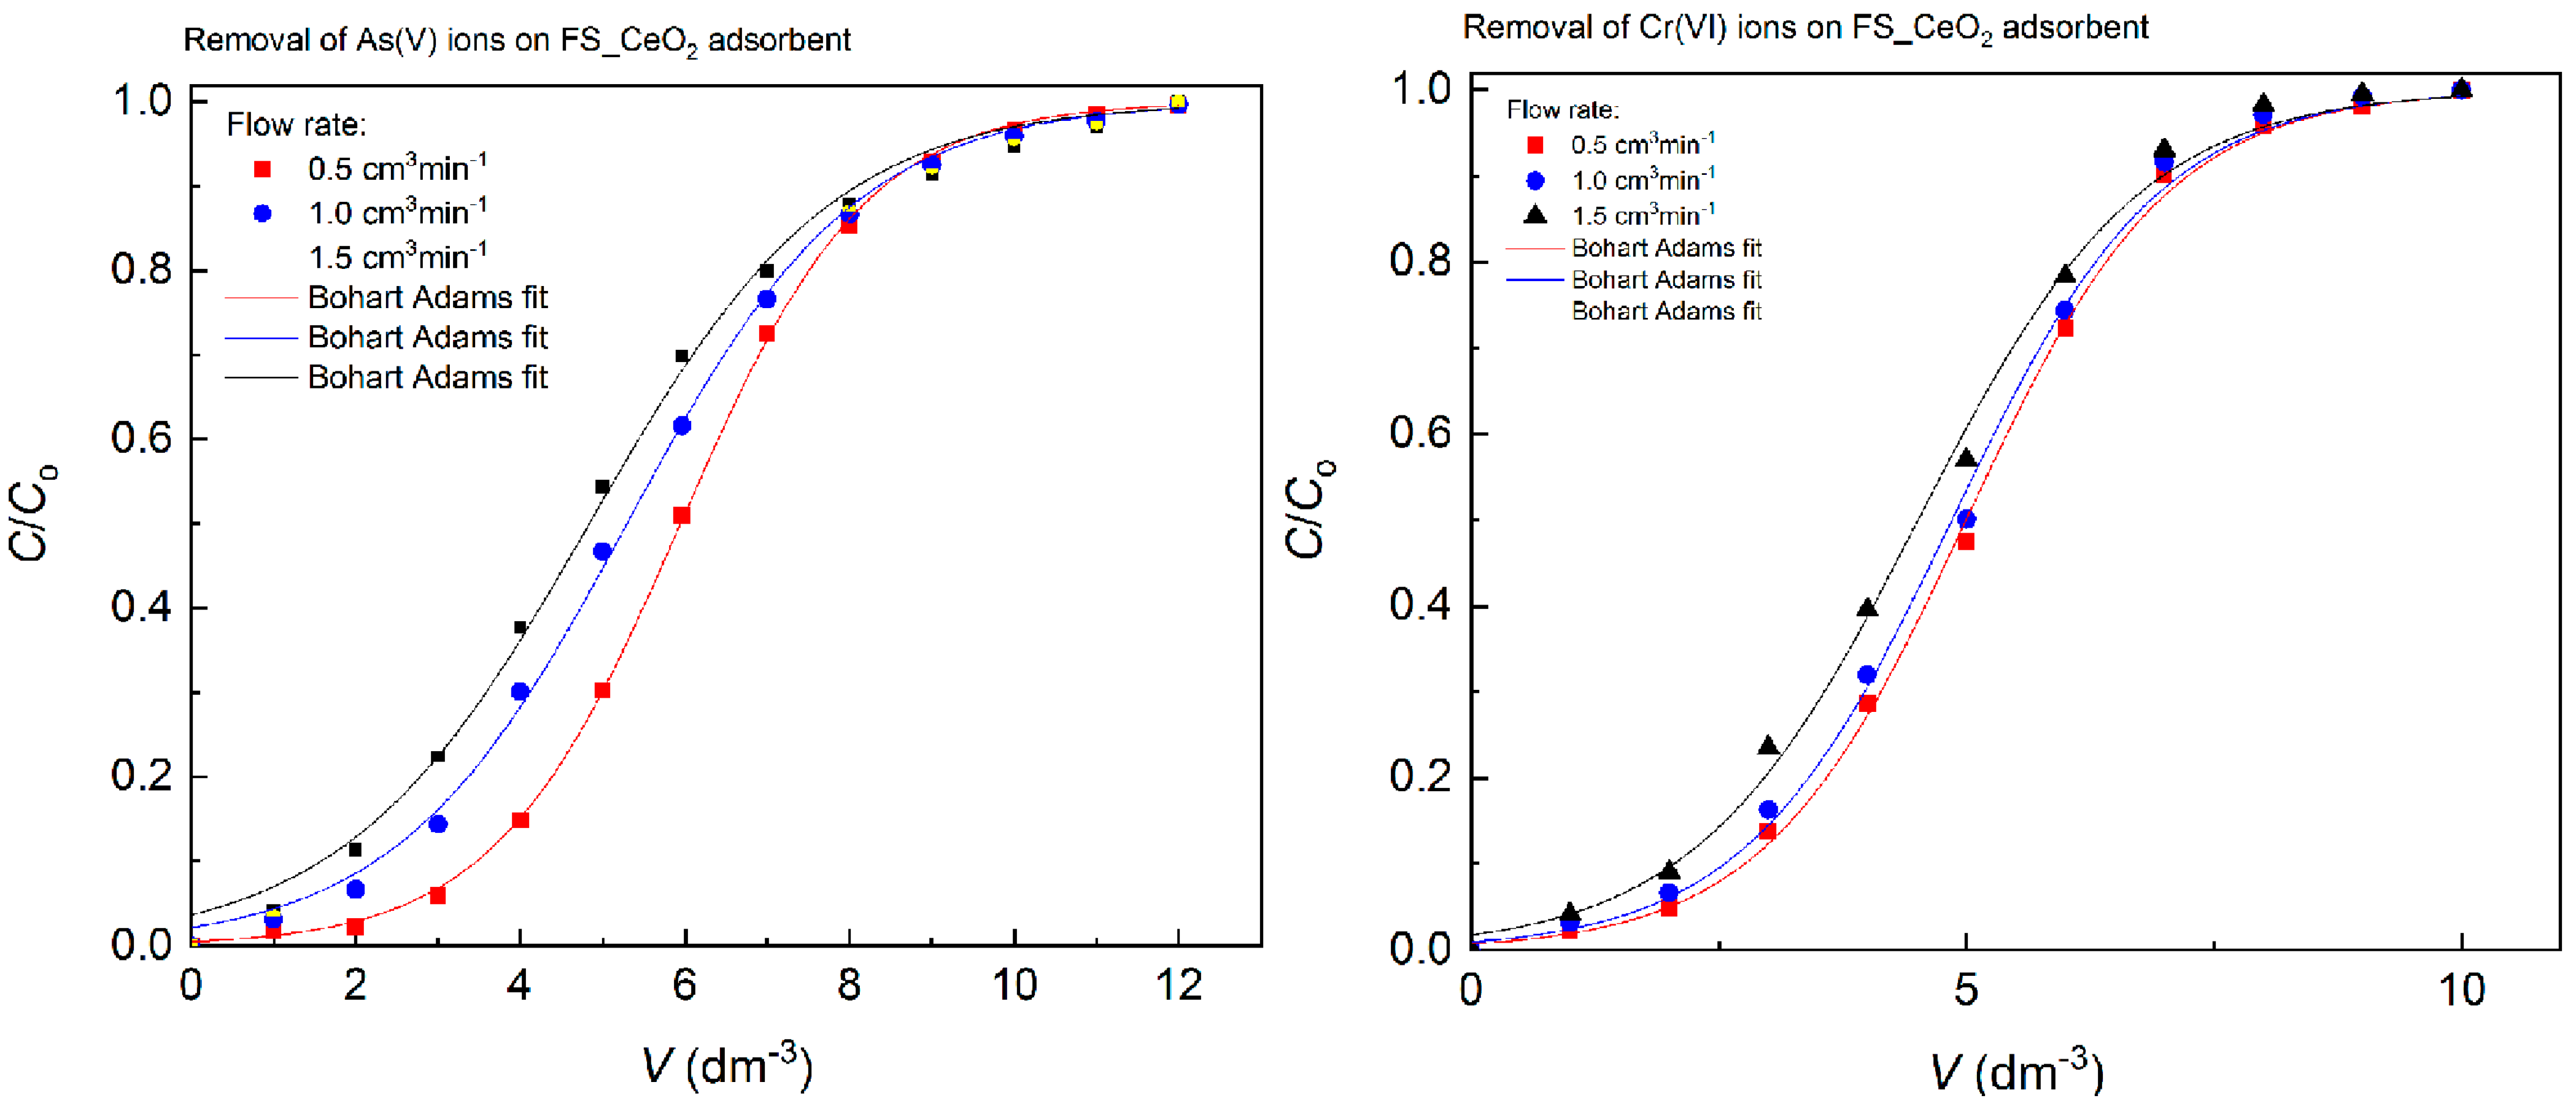
A fixed-bed column study was performed to investigate the potential application of FS-CeO2 in the process of water remediation. The results of the fitting of experimental data, using Bohart–Adams and Yoon–Nelson models [4,12], are shown in Table 9 and Figure 9. Both models show high suitability for predicting the breakthrough curve for investigating systems. The contour diagram representing the changes in the dimensionless value C/Ci versus V volumes of feed solution through the column is shown in Figure 9. The rate constants obtained showed low rate decreases, which can be explained by the fast saturation of the adsorbent outer surface. According to the B-A model, the adsorption capacity decreases as the flow rate increases and the breakthrough time decreases. Changes in operating conditions had an effect on the lower range of adsorption capacities compared to the values obtained in the batch system, where the system’s higher capacity was for As(V) adsorption. The fixed-bed sorption values obtained indicate a high potential for the application of FS-CeO2 in a real system for water purification.
Based on the results from in 9 (see Figure 9), it can be observed that the KBA values are inversely proportional to qo. As the throughput for the FS-CeO2 increases, so does the value of the KBA constant. The FS-CeO2 sorbent showed good values (q) for As(V) and Cr(VI) removal, and it can be said that its application in real systems is possible.

3.6.8. Competitive Arsenate and Chromate Ion Adsorption

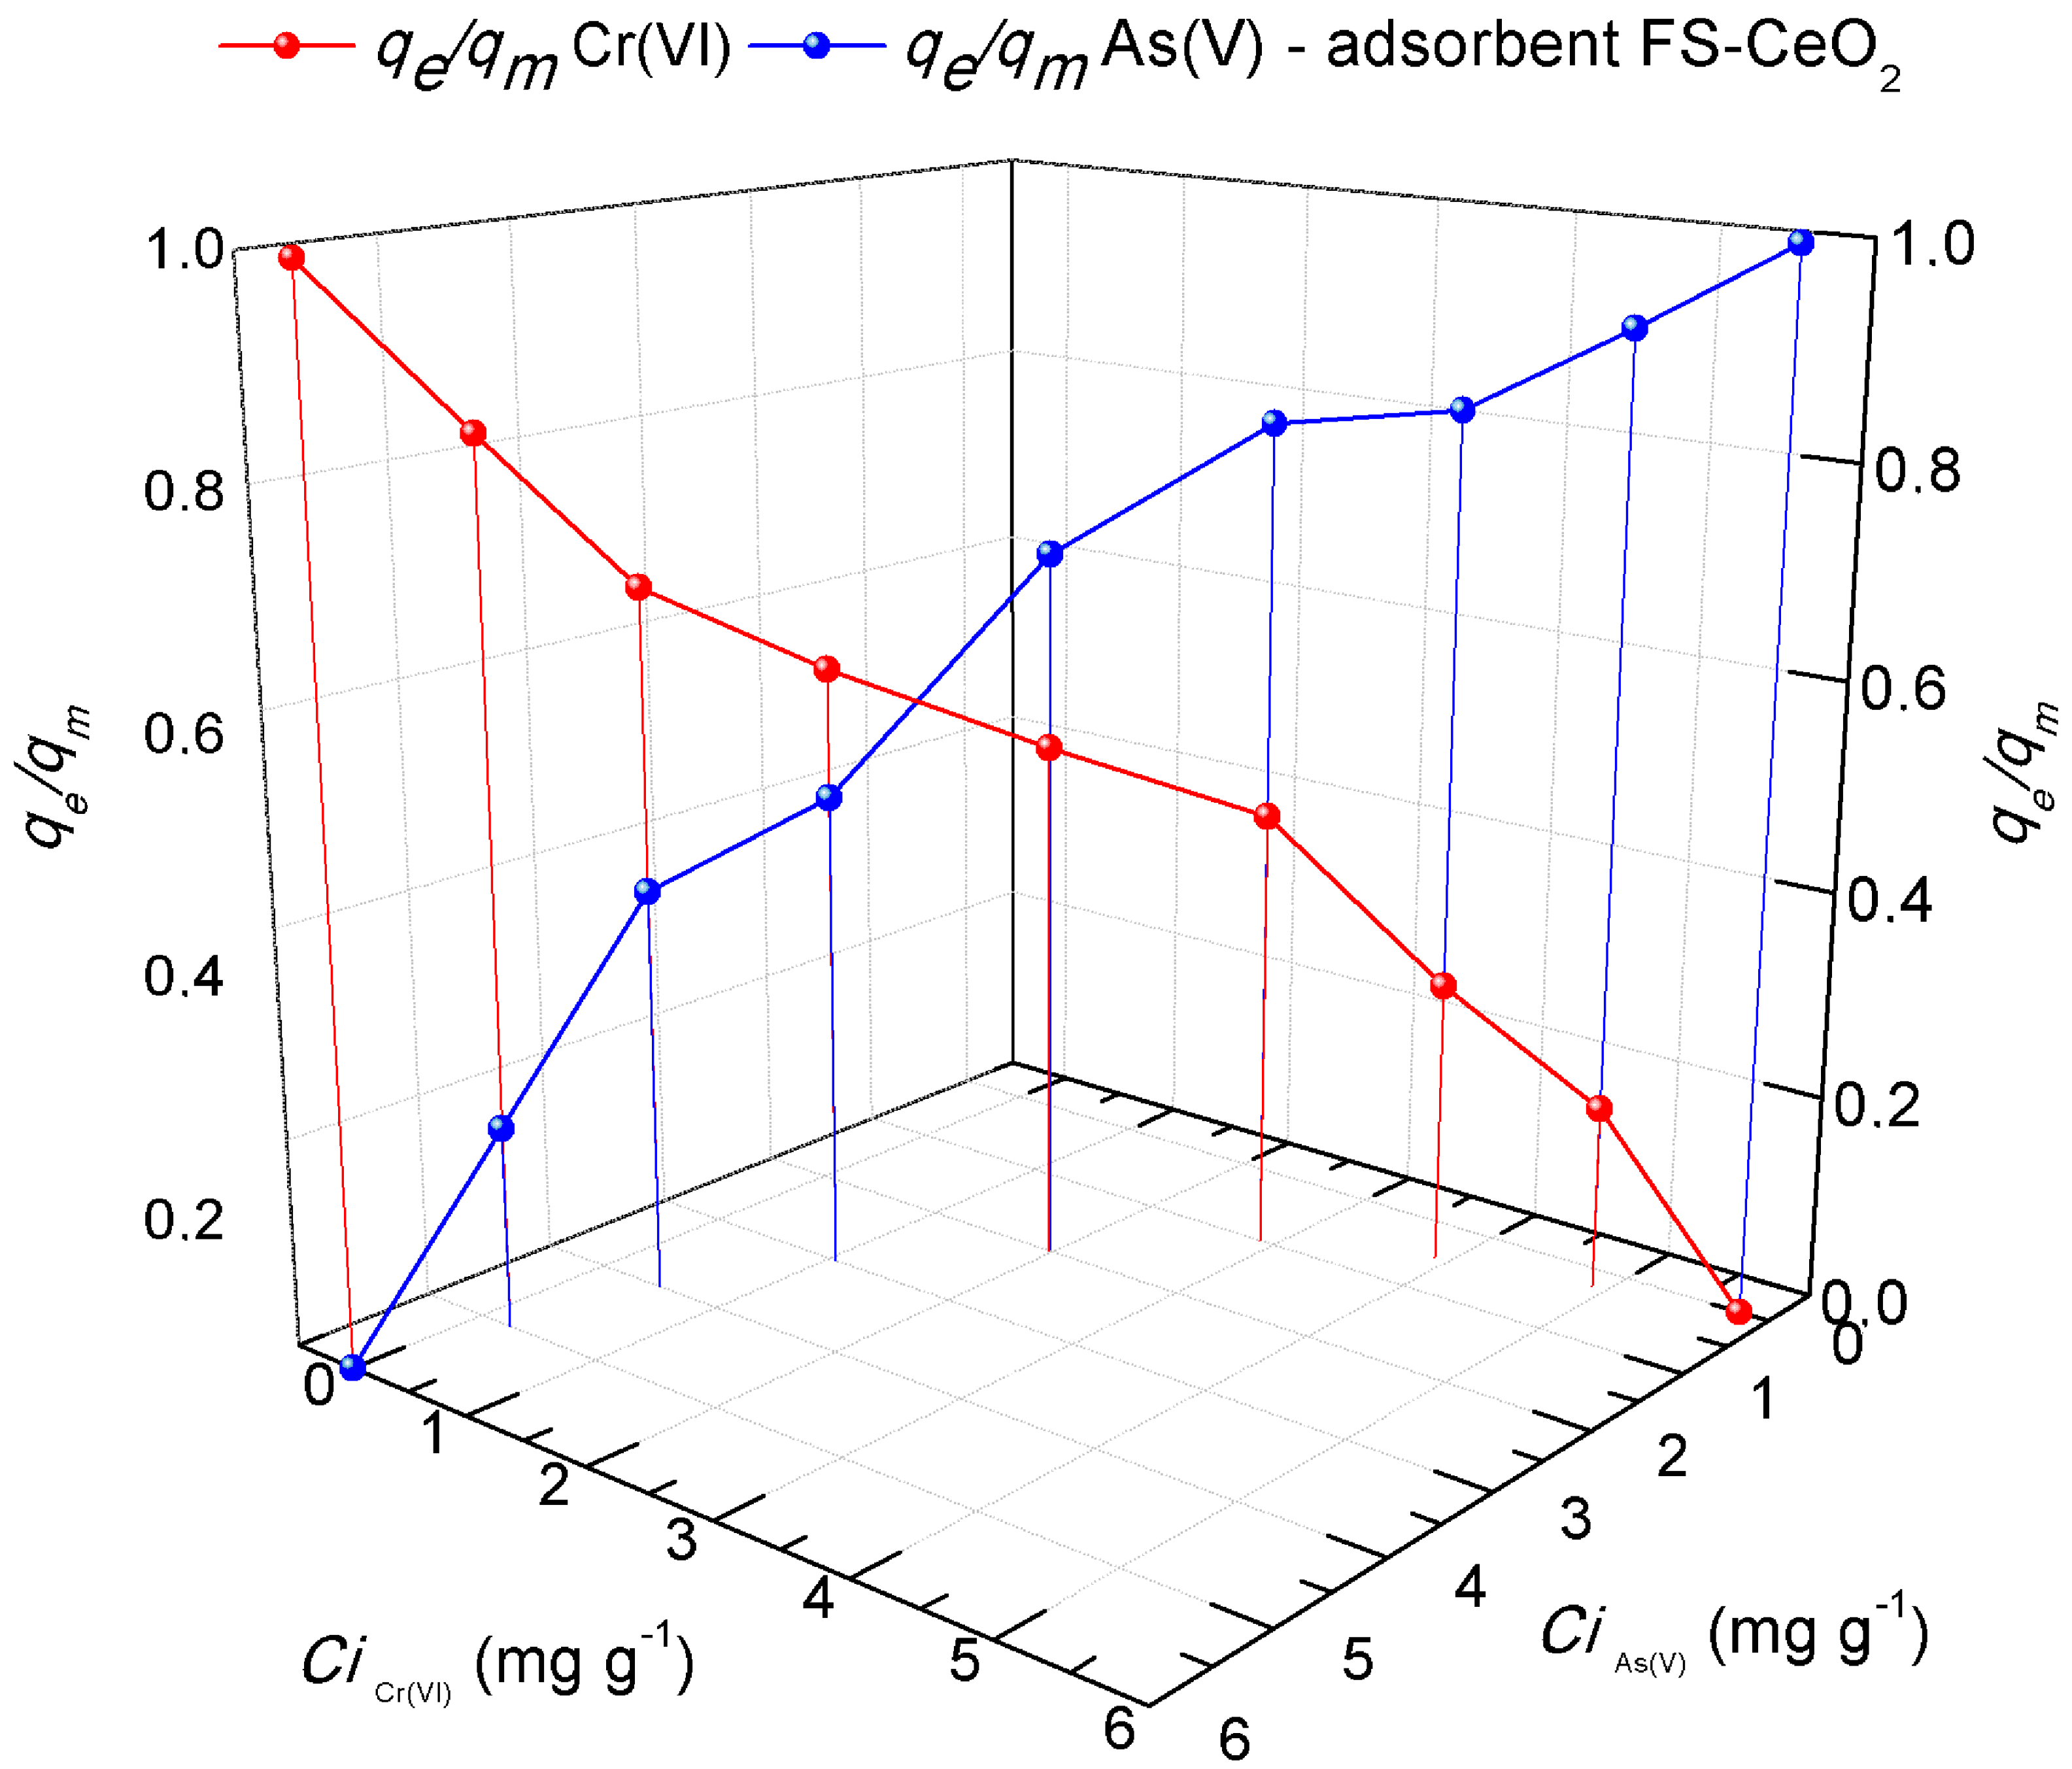
Contaminated waters contain heavy metals and other anions/cations in varying concentrations. The consequence of such a complex environment, in which there is very significant competition between ions with different charges, is a challenge to create a natural adsorbent that can effectively remove the present pollutants simultaneously. In the experiments of competitive sorption of pollutants, the size of the ionic and hydrostatic radius and the electronegativities that affect the competition of metals and dyes should not be ignored. To more precisely show the impact of the pollutants examined here, as well as the possibility of their removal with the help of the FS-CeO2 adsorbent, the results show the graphically competitive sorption of As(V) and Cr(VI) ions. A competitive study of pollutant adsorption on the FS-CeO2 adsorbent was achieved using an appropriate amount (up to 15 mL) of 6 mg L−1 of each solution, resulting in a solution with a total concentration of 6 mL L−1 after mixing (Figure 10). The dependence of the change in the concentration of As(V)/Cr(VI) on the adsorption capacities of the same pollutants is shown graphically. The output variables in the graph are the ratios of the equilibrium and maximum adsorption capacity of FS-CeO2 to pollutants.
The blue curve in Figure 10 represents the binding rate of As(V) ions in the same solution with Cr(VI) ions. The greater values shown in the diagram are typical for As(V), signifying a higher rate (qe/qm = 0.5) of FS-CeO2 surface pore blocking and better electrostatic interaction. The differences in the competitive sorption process of As(V) and Cr(VI) ions can be described by the difference in their atomic weight and ion size [24,25,26]. The rate of sorbate binding in the binary system, such as the one presented here, is strongly influenced by the mutual interference between the studied ions. It has been pointed out elsewhere that when (qe/qm) = 1, competitive effects cannot be seen, while for values of (qe/qm) < 1, adsorption is reduced due to the presence of competing ions/molecules [25,26]. The trend lines of the curves in the case of competitive sorption for the examined ions agree with the obtained adsorption capacities for individual ion removal.

3.6.9. Desorption Study

From the aspect of the life cycle of adsorbent regeneration efficiencies offer a parameter about the longevity of its use, i.e., a number of the adsorption/desorption cycles during which is justifiable to use studied adsorbent. Cost reduction is directly proportional to the adsorbent lifetime. The two main factors, type and strength of adsorbate/adsorbent interactions, mostly influence the desorption efficiency and process intensity. Moreover, FS-CeO2 chemical degradation during desorption causes rapid deterioration of both adsorption and desorption efficiency.
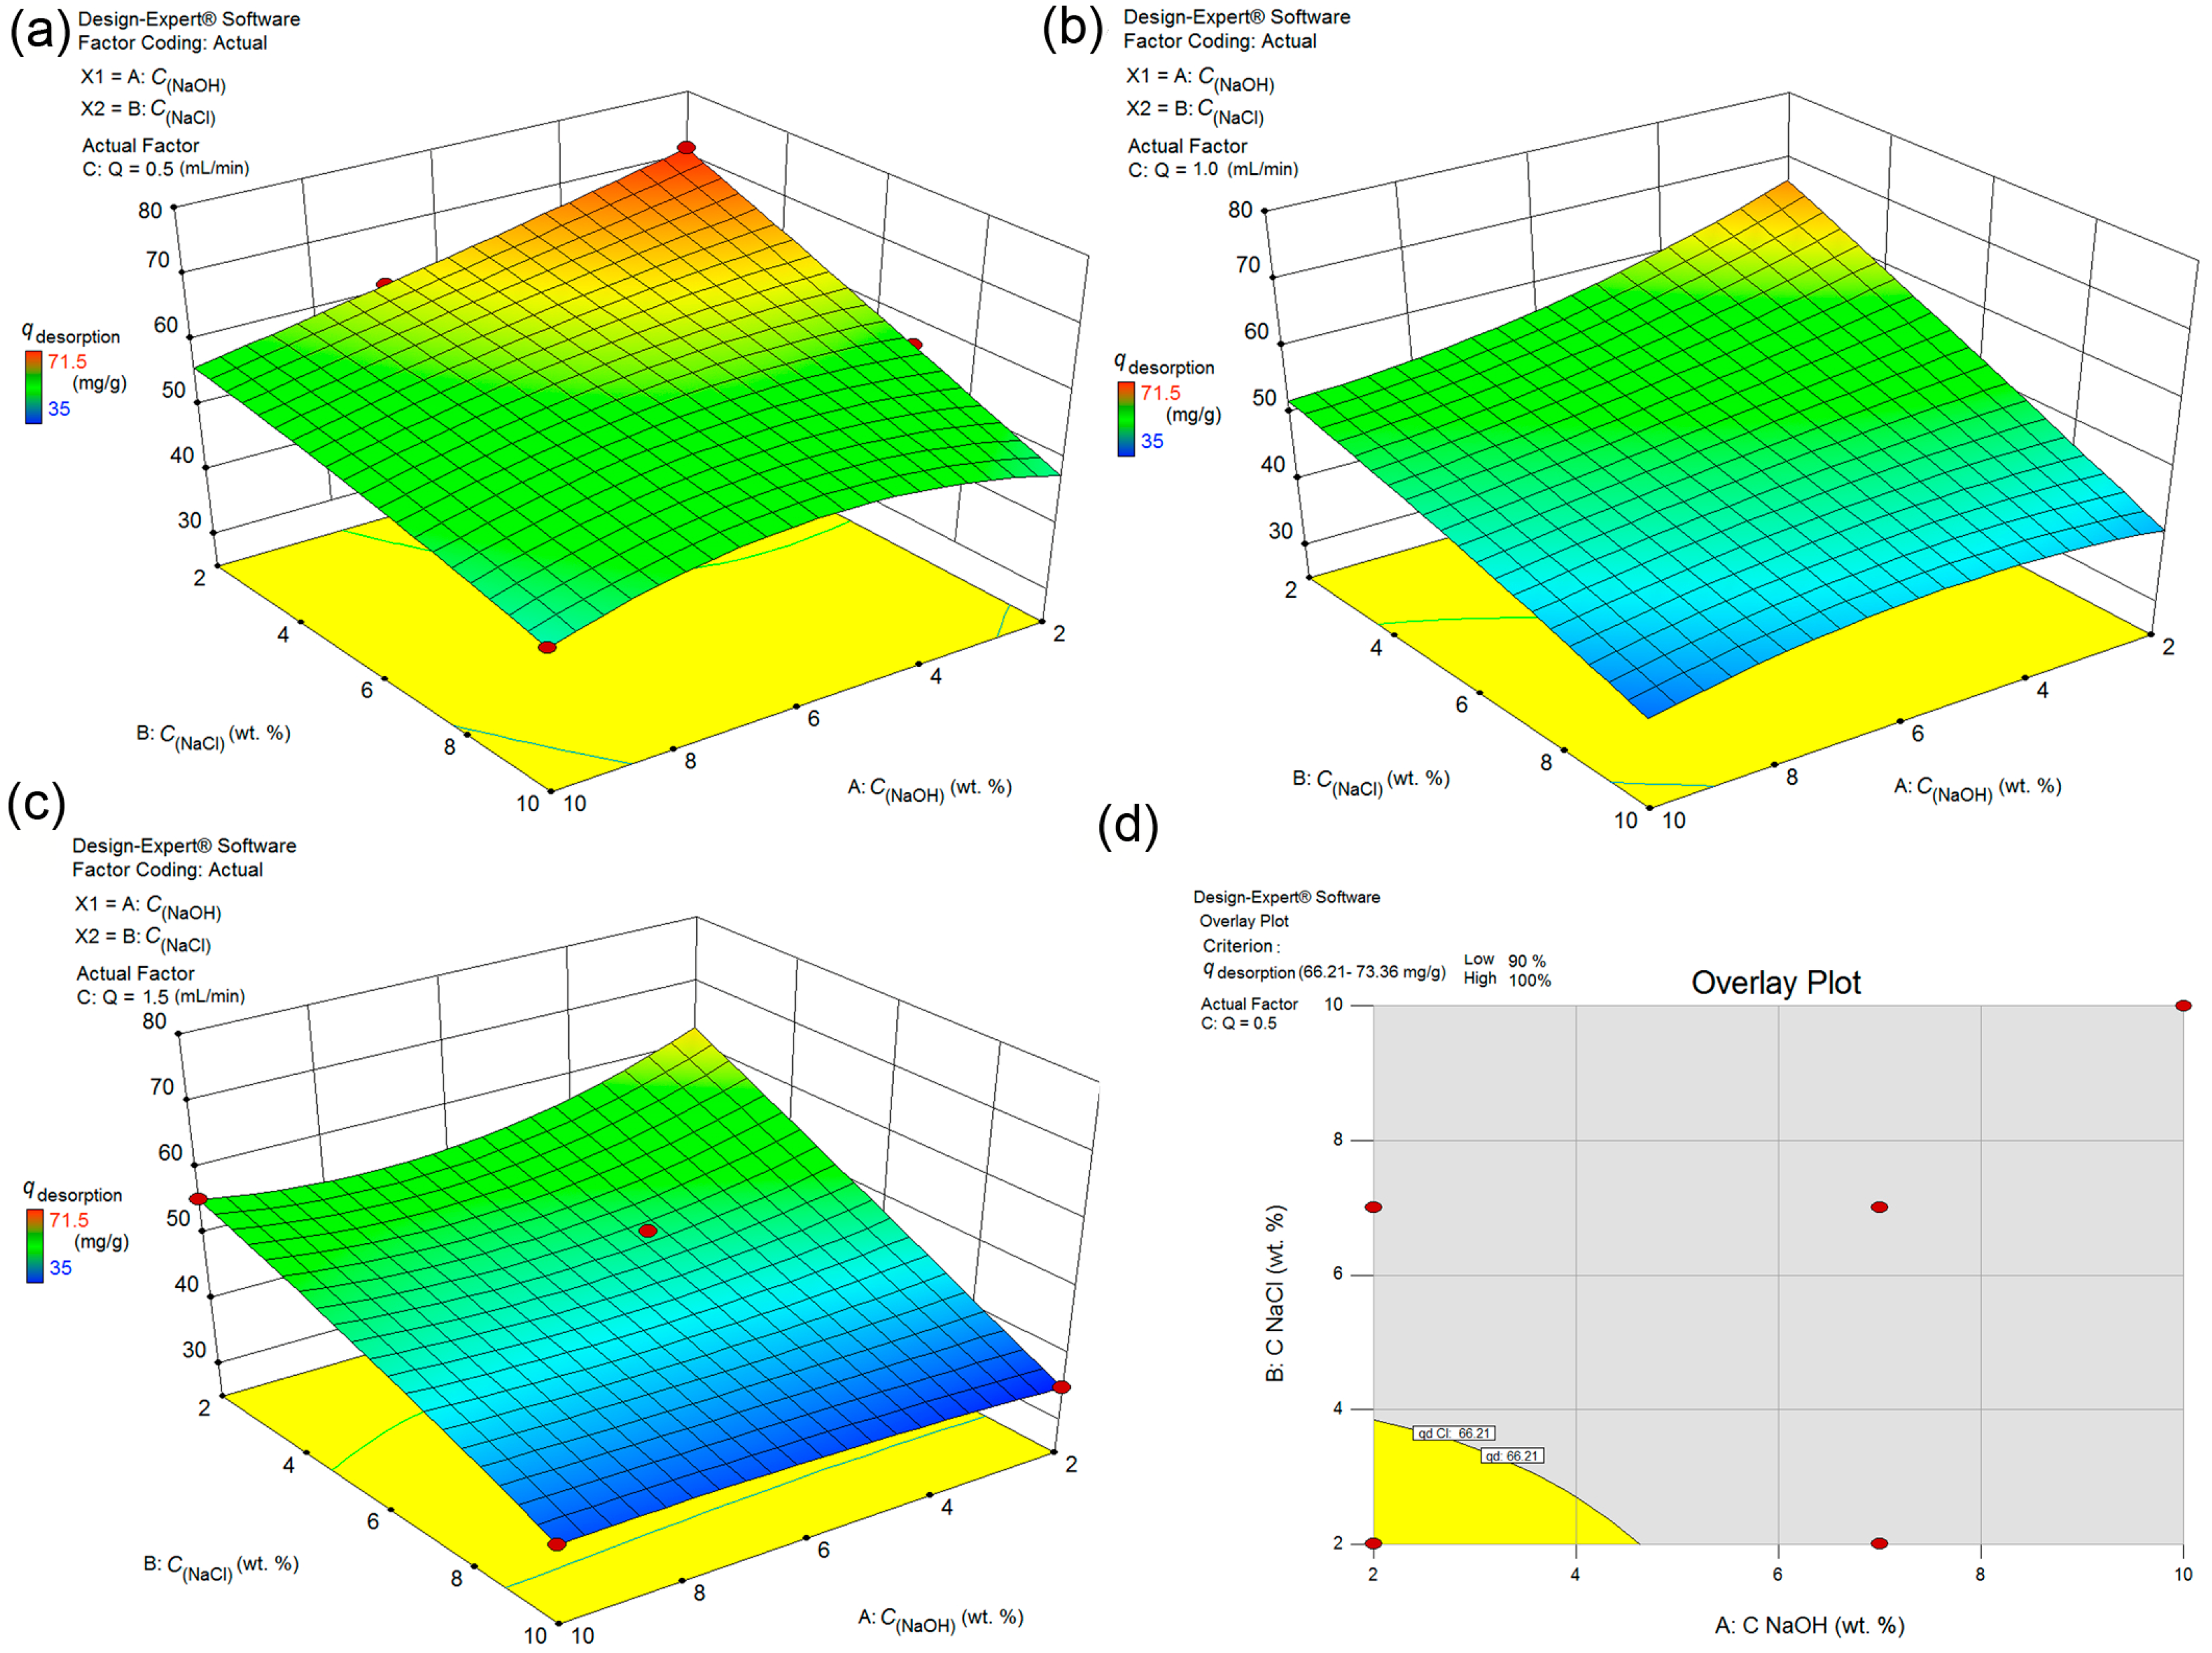
An optimization study was performed about the type of regenerator, and the optimal concentration (desorption efficiency versus concentration and time) because FS-CeO2 adsorbent was proven to be sensitive to acidic and basic desorbing agents. This was completed to ensure a slow decrease in the desorption performance and functionality of the adsorbent. The high sensitivity of FS-CeO2 precipitate to the acidic medium requires the use of the less harmful alkaline regenerator. The dependences of desorption on the concentration of the regenerator and the flow of the regenerator in the system are given in Figure 11a–c. The study of the desorption optimization followed a similar pattern for Cr(VI), so it was omitted from further discussion. Optimized desorption is obtained for the following conditions set up, the minimum desorption of 90% at a flow rate of 0.5 mL/min, as it is shown in Figure 11. At higher flow rates the previously stated criterion cannot be met. The optimal regenerator for the given conditions is defined as follows: 50 mL 2% NaOH/2 wt. % NaCl solution at 0.5 mL min−1 (Table 10).
A good desorption ability of 97.1% was obtained for FS-CeO2 in the first cycle (Table 10) at Qdes = 0.5 mL min−1, while the increased flow rate of the regenerator brings to proportional desorption efficiency decreased to 89.1% and 79.9% for 1.0 and 1.5 mL min−1 flow rates, respectively. A similar situation was obtained after the third and fifth cycles where desorption efficiency dropped to 95.1 and 92.7% at 0.5 mL min−1. Due to the effective desorption of As(V) high concentration of ions appeared in effluent water which was further subjected to proper technological disposal tending to attain zero environmental impact.
A similar regeneration efficiency was obtained for Cr(VI) (Table S9). Synthesized FS-CeO2 comprise two important features: high capacities in adsorption mode and good desorption efficiency (considering As(V) and Cr(VI)) which offer an outstanding unified property for potential applicability in a real wastewater purification technology. In summary, overall adapted technology from raw material and material/membrane synthesis provided material with good adsorption performances and considered disposal technology for both exhausted adsorbent and effluent water solutions containing desorbed pollutants.

3.7. Comparative Review of Adsorbents Performances

The literature overview on adsorption performances related to agricultural waste-based bio-adsorbents for oxyanions uptake is presented in Table 11. Comparing the published data on maximum adsorption uptake using agricultural waste-based bio-adsorbents with ones obtained for FS-CeO2 and CFS-CeO2 provides valuable data on the advantages of these novel sorbents. Generally, different operational/surface parameters define the adsorbent performances, e.g., pollutant initial concentration, adsorbent/pollutant contact time and/or mass ratio, temperature, etc.
Based on the data given in Table 11, it can be concluded that both FS-CeO2 and CFS-CeO2 have higher adsorption capacities concerning As(V) and Cr(VI) ions. Exceptions are carbonized waste biomass chestnut shells (CPC) [27] (Ci = 30 mg dm−3) and Bead Cellulose (Cotton) treated with FeCl3·6H2O [30] regarding As(III) removal. A preliminary study on Cr(VI) (Ci = 30 mg dm−3) removal using FS-CeO2 gave 11% higher qe, while for As(III) removal even better results were obtained, i.e., 22% higher.

4. Conclusions

In this research, an applicable methodology was developed for the use of fish scales, which are bio-waste from the agroindustry, for the removal of arsenic and chromium oxyanions from water. In general, the scales, along with the gills and mucous membranes of fish, are most susceptible to water pollution by heavy metals and metalloids. Due to the presence of a significant amount of foreign ions and non-stoichiometric formula, the biological apatite of fish scales has a low degree of crystallinity and a large surface area, which contributes to their high reactivity. Subsequent modification of fish scales or carbonized material with CeO2 nanoparticles significantly improved the adsorption characteristics of the newly synthesized materials CFS-CeO2 and FS-CeO2. CFS-CeO2 and FS-CeO2 showed good removal performance for Cr(VI) from water. Detailed analysis of the adsorbents CFS-CeO2 and FS-CeO2, before and after adsorption, as well as equilibrium and kinetic modeling, indicated complex sorption mechanisms. Numerous independent and related processes that affect the removal of Cr(VI) ions from water on these adsorbents are physisorption, ion exchange, electrostatic interactions, and chemisorption, i.e., surface complexation, which to varying degrees participate in adsorption. The kinetic data were successfully fitted with the pseudo-second-order equation and the Weber-Morris model. The adsorption capacities of 65.50 and 57.30 mg g−1 for Cr(VI) and 92.61 and 89.67 mg g−1 for As(V), from a previous work [6], were obtained for FS-CeO2 and CFS-CeO2 adsorbent, respectively. The benefit that should be especially emphasized in this research is that in this way the waste gained new value and application, which makes biosorption environmentally sustainable and renewable.
The authors recognize that, unlike synthetic water samples, real wastewater contains a complex matrix of competing ions and organic matter, which may influence adsorption efficiency. As a part of the future work, the authors are currently planning follow-up experiments using actual industrial and municipal wastewater samples to validate the robustness and selectivity of the adsorbent under realistic conditions.

Supplementary Materials

The following supporting information can be downloaded at: https://www.mdpi.com/article/10.3390/separations12090253/s1, Table S1: Experimental plan for two-factor design of FS-CeO2 synthesis; Figure S1: Schematic presentation of FS-CeO2 and CFS-CeO2 adsorbents synthesis; Table S2: Four-factor experimental design BBD optimization of adsorption conditions with three levels of values for removal of As(V) and Cr(VI) ions; Table S3: Experiment plan for three-factor D-optimal design for As(V) desorption using FS-CeO2 adsorbent; Table S4: Kinetic model equations; Table S5: Adsorption isotherms equations; Figure S2: 3D diagram of CCD optimization of FS-CeO2 adsorbent synthesis conditions in relation to adsorbent capacity towards Cr(VI) ions; Figure S3: The influence of initial pH on As(V) and Cr(VI) removal efficiency onto CFS-CeO2; Table S6: ANOVA statistic results for the optimization of As(V) adsorption onto FS-CeO2 modelled by quadratic modelling; Figure S4: Validation of the As(V) removal model using (a) internally studentized model residuals and (b–d) internally studentized residuals of observed most significant adsorption variables; Table S7: ANOVA of Cr(VI) removal modeled by quadratic modeling in the optimization of adsorption of Cr(VI) on FS-CeO2; Figure S5: Interaction effects between different parameters on Cr(VI) removal analyzed by 3D response surface; Table S8: Experimental parameters of nonlinear adsorption isotherms modeling of As(V) and Cr(VI) ions onto the FS-CeO2 and CFS-CeO2 adsorbents; Figure S6: The results of adsorption experiments with the best-fitted isothermal models (line) for removal of Cr(VI) ions using the FS-CeO2 adsorbent; Figure S7: The results of adsorption experiments with the best-fitted isothermal models (line) for removal of Cr(VI) ions using the CFS-CeO2 adsorbent; Table S9: Parameters of diffusional kinetics models (Ci[Cr(VI)] = 6.00 mg L−1, pH = 6; m/V = 1000 mg L−1, T = 25 °C; Ci[As(V)] = 5.78 mg L−1, pH = 6; m/V = 667 mg L−1, T = 25 °C); Table S10: Experimental parameters of the pseudo-second order model for Cr(VI) adsorption on the FS-CeO2 and CFS-CeO2 adsorbents (Ci[Cr(VI)] = 6.00 mg L−1, pH = 6; m/V = 667 mg L−1, T = 25 °C; Ci[As(V)] = 5.78 mg L−1, pH = 4; m/V = 667 mg L−1); Table S11: The adsorption-desorption of the studied Cr(VI) onto FS-CeO2 (Qdes = 0.50; 1.00 and 1.50 mL min−1; mads = 0.235 g) using 2 wt.% NaOH/2 wt.% NaCl; Table S12: Comparative review of the adsorbent’s performances of oxyanions removal [27,28,29,30,31,32,33,34,35,36,37,38,39,40].

Author Contributions

Conceptualization, Z.B., U.Z.V., V.D., M.B., J.B., K.P. and A.D.M.; Methodology, Z.B., U.Z.V., M.B., J.B. and A.D.M.; Software, Z.B. and U.Z.V.; Validation, V.D., M.B. and J.B.; Formal analysis, A.D.M.; Investigation, U.Z.V., K.P. and A.D.M.; Resources, V.D., J.B. and A.D.M.; Data curation, Z.B. and U.Z.V.; Writing—original draft, Z.B., U.Z.V., V.D., M.B., J.B., K.P. and A.D.M.; Writing— review & editing, Z.B., U.Z.V., V.D., M.B., J.B., K.P. and A.D.M.; Visualization, Z.B., U.Z.V., V.D. and A.D.M.; Supervision, A.D.M.; Project administration, J.B., K.P. and A.D.M.; Funding acquisition, V.D., J.B. and A.D.M. All authors have read and agreed to the published version of the manuscript.

Funding

This work was supported by the Ministry of Science, Technological Development and Innovation of the Republic of Serbia (Contract Grants No. 451-03-136/2025-03/200135 and 451-03-136/2025-03/200287) and the University of Defence in Belgrade, Project No. VA TT/1/22-24.

Data Availability Statement

The original contributions presented in this study are included in the article/Supplementary Material. Further inquiries can be directed to the corresponding author.

Conflicts of Interest

Author Veljko Djokić was employed by the company Innovation Center of the Faculty of Technology and Metallurgy Ltd. The remaining authors declare that the research was conducted in the absence of any commercial or financial relationships that could be construed as a potential conflict of interest.

Correction Statement

This article has been republished with a minor correction to the Data Availability Statement. This change does not affect the scientific content of the article.

References

  1. Muntean, S.G.; Halip, L.; Nistor, M.A.; Păcurariu, C. Removal of Metal Ions via Adsorption Using Carbon Magnetic Nanocomposites: Optimization through Response Surface Methodology, Kinetic and Thermodynamic Studies. Magnetochemistry 2023, 9, 163. [Google Scholar] [CrossRef]
  2. Fertu, D.I.; Bulgariu, L.; Gavrilescu, M. Modeling and Optimization of Heavy Metals Biosorption by Low-Cost Sorbents Using Response Surface Methodology. Processes 2022, 10, 523. [Google Scholar] [CrossRef]
  3. Alguacil, F.J.; Alcaraz, L.; García-Díaz, I.; López, F.A. Removal of Pb2+ in Wastewater via Adsorption onto an Activated Carbon Produced from Winemaking Waste. Metals 2018, 8, 697. [Google Scholar] [CrossRef]
  4. Perendija, J.; Velickovic, Z.S.; Cvijetic, I.; Rusmirovic, J.D.; Ugrinovic, V.; Marinkovic, A.D.; Onjia, A. Batch and column adsorption of cations, oxyanions and dyes on a magnetite modified cellulose-based membrane. Cellulose 2020, 27, 8215–8235. [Google Scholar] [CrossRef]
  5. Popovic, A.L.; Rusmirovic, J.D.; Velickovic, Z.; Radovanovic, Z.; Ristic, M.; Pavlovic, V.P.; Marinkovic, A.D. Novel amino-functionalized lignin microspheres: High performance biosorbent with enhanced capacity for heavy metal ion removal. Int. J. Biol. Macromol. 2020, 156, 1160–1173. [Google Scholar] [CrossRef]
  6. Georgaki, J.M.-N.; Charalambous, M.; Kazakis, N.; Talias, M.A.; Georgakis, C.; Papamitsou, T.; Mytiglaki, C. Chromium in Water and Carcinogenic Human Health Risk. Environments 2023, 10, 33. [Google Scholar] [CrossRef]
  7. Shaji, E.; Santosh, M.; Sarath, K.; Prakash, P.; Deepchand, V.; Divya, B. Arsenic contamination of groundwater: A global synopsis with focus on the Indian Peninsula. Geosci. Front. 2021, 12, 101079. [Google Scholar] [CrossRef]
  8. Bajić, Z.J.; Pamučar, D.S.; Bogdanov, J.Đ.; Bučko, M.M.; Veličković, Z.S. Optimization of arsenite adsorption on hydroxy apatite based adsorbent using the adaptive neuro-fuzzy inference system. Mil. Tech. Cour. 2019, 67, 735–752. [Google Scholar]
  9. Sharma, S.K.; Petrusevski, B.; Amy, G. Chromium removal from water: A review. J. Water Supply Res. Technol. AQUA 2008, 57, 541–553. [Google Scholar] [CrossRef]
  10. Sarkar, A.; Paul, B. The global menace of arsenic and its conventional remediation—A critical review. Chemosphere 2016, 158, 37–49. [Google Scholar] [CrossRef]
  11. Bajić, Z.J.; Veličković, Z.S.; Djokić, V.R.; Perić-Grujić, A.A.; Ersen, O.; Uskoković, P.S.; Marinković, A.D. Adsorption Study of Arsenic Removal by Novel Hybrid Copper Impregnated Tufa Adsorbents in a Batch System. Clean Soil. Air Water 2016, 44, 1477–1488. [Google Scholar] [CrossRef]
  12. Pantić, K.; Bajić, Z.J.; Veličković, Z.S.; Tomić, N.Z.; Marinković, A.D. Arsenic removal by copper-impregnated natural mineral tufa part II: A kinetics and column adsorption study. Environ. Sci. Pollut. Res. 2019, 26, 24143–24161. [Google Scholar] [CrossRef]
  13. Karanac, M.; Đolić, M.; Veljović, Đ.; Rajaković-Ognjanović, V.; Veličković, Z.; Pavićević, V.; Marinković, A. The removal of Zn2+, Pb2+, and As(V) ions by lime activated fly ash and valorization of the exhausted adsorbent. Waste Manag. 2018, 78, 366–378. [Google Scholar] [CrossRef]
  14. Veličković, Z.S.; Karkalić, R.; Bajić, Z.J.; Marinković, A.; Nikolić, A.; Otrisal, P.; Florus, S. Cerium supported on high porous carbon from fish scales carp, as a novel low cost adsorbent to remove As (V) ions from water. Mater. Methods Technol. 2018, 12, 110–122. [Google Scholar]
  15. Bajić, Z.J.; Djokić, V.R.; Veličković, Z.S.; Vuruna, M.M.; Ristić, M.Đ.; Ben Issa, N.; Marinković, A.D. Equilibrium, kinetic and thermodynamic studies on removal of Cd(II), Pb(II) and As(V) from wastewater using carp (Cyprinus Carpio) scales. Dig. J. Nanomater. Biostruct. 2013, 8, 1581–1590. [Google Scholar]
  16. Teshale, F.; Karthikeyan, R.; Sahu, O. Synthesized bioadsorbent from fish scale for chromium (III) removal. Micron 2020, 130, 102817. [Google Scholar] [CrossRef]
  17. Ighalo, J.O.; Eletta, O.A.A. Recent advances in the biosorption of pollutants by fish scales: A mini-Review. Chem. Eng. Commun. 2021, 208, 1301–1312. [Google Scholar] [CrossRef]
  18. Damian, G.; Varvara, S. Assessment of Cyprinus carpio Scales as a Low-Cost and Effective Biosorbent for the Removal of Heavy Metals from the Acidic Mine Drainage Generated at Rosia Montana Gold Mine (Romania). Water 2022, 14, 3734. [Google Scholar] [CrossRef]
  19. Nagai, T.; Izumi, M.; Ishii, M. Fish scale collagen. Preparation and partial characterization. Int. J. Food Sci. Technol. 2004, 39, 239–244. [Google Scholar] [CrossRef]
  20. Li, R.; Li, Q.; Gao, S.; Shang, J.K. Exceptional arsenic adsorption performance of hydrous cerium oxide nanoparticles: Part A. Adsorption capacity and mechanism. Chem. Eng. J. 2012, 185, 127–135. [Google Scholar] [CrossRef]
  21. Gran, S.; Aziz, R.; Rafiq, M.T.; Abbasi, M.; Qayyum, A.; Elnaggar, A.Y.; Elganzory, H.H.; El-Bahy, Z.M.; Hussein, E.E. Development of cerium oxide/corncob nanocomposite: A cost-effective and eco-friendly adsorbent for the removal of heavy metals. Polymers 2021, 13, 4464. [Google Scholar] [CrossRef]
  22. Yi, L.; Mehrab, M. Photocatalytic Treatment of An Actual Confectionery Wastewater Using Ag/TiO2/Fe2O3: Optimization of Photocatalytic Reactions Using Surface Response Methodology. Catalysts 2018, 8, 409. [Google Scholar] [CrossRef]
  23. Pantić, K.; Bajić, Z.J.; Veličković, Z.S.; Djokića, V.; Rusmirović, J.; Marinković, A.; Perić-Grujić, A. Adsorption performances of branched aminated waste polyacrylonitrile fibers: Experimental versus modelling study. Desalination Water Treat. 2019, 171, 223–249. [Google Scholar] [CrossRef]
  24. Sawana, R.; Somasundar, Y.; Iyer, V.S.; Baruwati, B. Ceria modified activated carbon: An efficient arsenic removal adsorbent for drinking water purification. Appl. Water Sci. 2017, 7, 1223–1230. [Google Scholar] [CrossRef]
  25. Knežević, N.; Milanović, J.; Veličković, Z.; Milošević, M.; Vuksanović, M.M.; Onjia, A.; Marinković, A. A closed cycle of sustainable development: Effective removal and desorption of lead and dyes using an oxidized cellulose membrane. J. Ind. Eng. Chem. 2023, 126, 520–536. [Google Scholar] [CrossRef]
  26. Aichour, A.; Zaghouane-Boudiaf, H. Single and competitive adsorption studies of two cationic dyes from aqueous mediums onto cellulose-based modified citrus peels/calcium alginate composite. Int. J. Biol. Macromol. 2020, 154, 1227–1236. [Google Scholar] [CrossRef]
  27. Magsi, S.K.; Kandhar, I.A.; Brohi, R.-O.-Z.; Channa, A. Removal of metals from water using fish scales as a bio adsorbent. AIP Conf. Proc. 2019, 2119, 20023. [Google Scholar] [CrossRef]
  28. Parlayici, Ş.; Pehlivan, E. Comparative study of Cr(VI) removal by bio-waste adsorbents: Equilibrium, kinetics, and thermodynamic. J. Anal. Sci. Technol. 2019, 10, 15. [Google Scholar] [CrossRef]
  29. Zhang, X.; Ren, B.; Wu, X.; Yan, X.; Sun, Y.; Gao, H.; Qu, F. Efficient Removal of Chromium(VI) Using a Novel Waste Biomass Chestnut Shell-Based Carbon Electrode by Electrosorption. ACS Omega 2021, 6, 25389–25396. [Google Scholar] [CrossRef]
  30. Oke, I.A.; Olarinoye, N.O.; Adewusi, S.R.A. Adsorption Kinetics for Arsenic Removal from Aqueous Solutions by Untreated Powdered Eggshell. Adsorption 2008, 14, 73–83. [Google Scholar] [CrossRef]
  31. Ouédraogo, I.W.K.; Pehlivan, E.; Tran, H.T.; Bonzi-Coulibaly, Y.L.; Zachmann, D.; Bahadir, M. Synthesis of iron oxyhydroxide-coated rice straw (IOC-RS) and its application in arsenic(V) removal from water. J. Water Health 2015, 13, 726–736. [Google Scholar] [CrossRef]
  32. Guo, X.; Chen, F. Removal of Arsenic by Bead Cellulose Loaded with Iron Oxyhydroxide from Groundwater. Environ. Sci. Technol. 2005, 39, 6808–6818. [Google Scholar] [CrossRef]
  33. Zhang, F.; Wang, X.; Xionghui, J.; Ma, L. Efficient arsenate removal by magnetite-modified water hyacinth biochar. Environ. Pollut. 2016, 216, 575–583. [Google Scholar] [CrossRef]
  34. Kongsri, S.; Janpradit, K.; Buapa, K.; Techawongstien, S.; Chanthai, S. Nanocrystalline hydroxyapatite from fish scale waste: Preparation, characterization and application for selenium adsorption in aqueous solution. Chem. Eng. J. 2013, 215–216, 522–532. [Google Scholar] [CrossRef]
  35. Shourije, S.M.J.S.; Dehghan, P.; Bahrololoom, M.E.; Cobley, A.J.; Vitry, V.; Azar, G.T.P.; Kamyab, H.; Mesbah, M. Using fish scales as a new biosorbent for adsorption of nickel and copper ions from wastewater and investigating the effects of electric and magnetic fields on the adsorption process. Chemosphere 2023, 317, 137829. [Google Scholar] [CrossRef]
  36. Selimin, M.A.; Latif, A.F.A.; Lee, C.W.; Muhamad, M.S.; Basri, H.; Lee, T.C. Adsorption efficiency of hydroxyapatite synthesised from black tilapia fish scales for chromium (VI) removal. Mater. Today Proc. 2022, 57, 1142–1146. [Google Scholar] [CrossRef]
  37. Kashyap, K.; Moharana, M.; Pattanayak, S.K.; Khan, F. Effective Removal of Pb(II), Cr(VI), and Cd(II) Ions from Water Using Environmentally Friendly Cerium Oxide Nanoparticles Synthesized from Pods of Pisum sativum. Water Air Soil Pollut. 2024, 235, 276. [Google Scholar] [CrossRef]
  38. Chen, B.; Zhu, Z.; Hong, J.; Wen, Z.; Ma, J.; Qiu, Y.; Chen, J. Nanocasted synthesis of ordered mesoporous cerium iron mixed oxide and its excellent performances for As(V) and Cr(VI) removal from aqueous solutions. Dalton Trans. 2014, 43, 10767–10777. [Google Scholar] [CrossRef]
  39. Hoang, V.A.; Yoshizuka, K.; Nishihama, S. Oxidative adsorption of arsenic from water environment by activated carbon modified with cerium oxide/hydroxide. Chem. Eng. Res. Des. 2022, 186, 161–173. [Google Scholar] [CrossRef]
  40. Yu, Y.; Zhang, C.; Yang, L.; Paul, C.J. Cerium oxide modified activated carbon as an efficient and effective adsorbent for the rapid uptake of arsenate and arsenite: Material development and study of performance and mechanisms. Chem. Eng. J. 2017, 315, 630–638. [Google Scholar] [CrossRef]
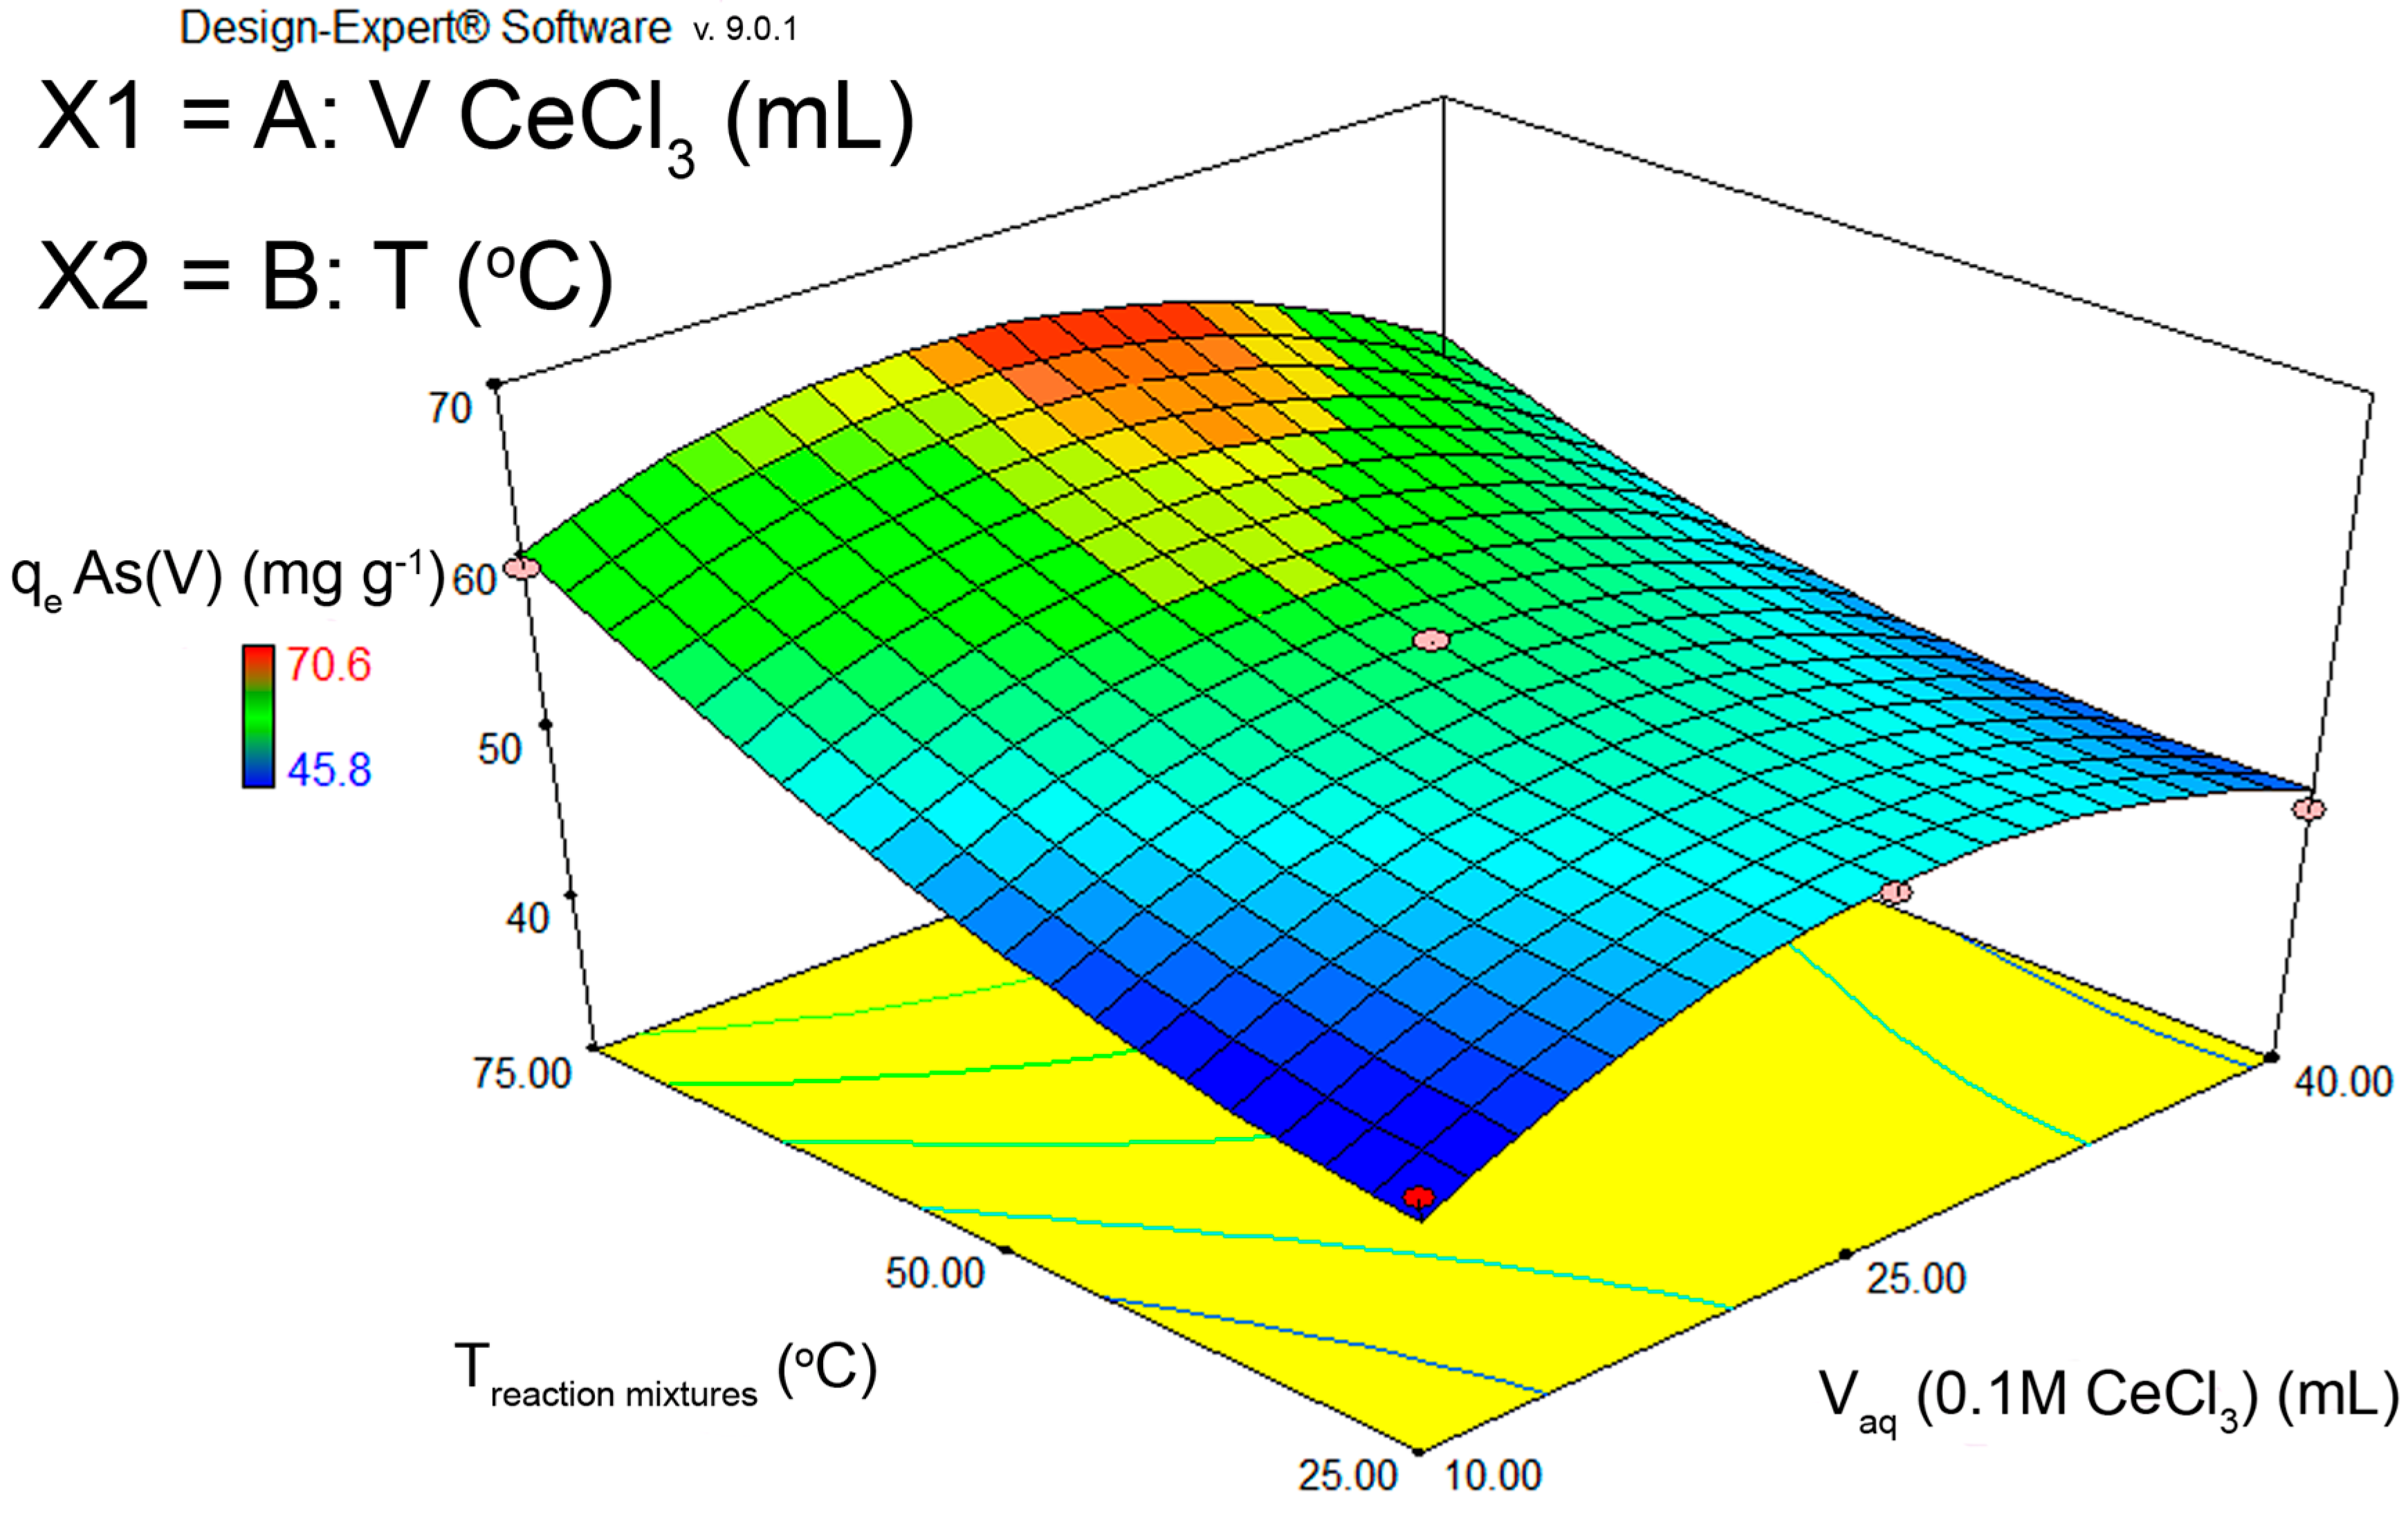
Figure 1. A 3D diagram of CCD optimization of FS-CeO2 adsorbent synthesis conditions in relation to adsorbent capacity towards As(V) ions.
Separations 12 00253 g001
Figure 2. XRD spectra for fish scales modified with FS-CeO2 (a) and highly porous carbonized fish scales modified with CeO2 nanoparticles (CFS-CeO2) (b).
Separations 12 00253 g002
Figure 3. The FTIR spectra of FS-CeO2 and CFS-CeO2, and both adsorbents before and after As(V) and Cr(VI) adsorption: (a) and (b), respectively.
Separations 12 00253 g003
Figure 4. SEM image of PFS (I) [15], FS-CeO2 (II) and CFS-CeO2 (III); magnification (ac): 20,000×, 50,000× and 100,000×.
Separations 12 00253 g004
Figure 5. EDS spectrum of FS-CeO2 (a) and CFS-CeO2 adsorbent (b).
Separations 12 00253 g005
Figure 6. The influence of the initial pH on As(V) and Cr(VI) removal efficiency on FS-CeO2.
Separations 12 00253 g006
Figure 7. Interaction effects between different parameters on As(V) removal analyzed by 3D response surface. (a) Diagram for pH and adsorbent mass dependency; (b) Diagram for pH and adsorption time dependency; (c) Diagram for adsorbent mass and adsorbent time dependency and (d) Diagram for adsorbent mass, adsorption time and pH dependency.
Separations 12 00253 g007
Figure 8. Graphical representation of obtained coded optimal experimental conditions.
Separations 12 00253 g008
Figure 9. Bohart–Adams fitting for As(V) and Cr(VI) adsorption by FS-CeO2.
Separations 12 00253 g009
Figure 10. Comparative results of absorption capacities according to pollutants: As(V)/Cr(VI) ions.
Separations 12 00253 g010
Figure 11. Interaction effects between different parameters of As(V) desorption form FS-CeO2 analyzed by 3D response surface (a) Flow rate 0.5 mL min−1 (b) Flow rate 1.0 mL min−1 (c) Flow rate 1.5 mL min−1 (d) Diagram for the overlay plot.
Separations 12 00253 g011
Table 1. Coded parameters in the statistical quadratic model.
CodedA
pH
B
m (mg)
C
T (°C)
D
t (min)
−1412510
075.53565
1101045120
Table 2. Four-factor experimental BBD optimization of adsorption conditions with three levels of values for removal of As(V) and Cr(VI) ions with removal results.
Run No.A
pH
B
m (mg)
C
T (°C)
D
t (min)
qe for As(V)
(mg g−1)
qe for Cr(VI)
(mg g−1)
1001−140.54533.655
2−100145.55037.810
3110035.53929.502
410−1045.55037.810
5−110035.53929.502
61−10037.54131.162
7−10−1052.55743.627
8−1−10048.55340.303
9000036.54030.331
1001−1054.55945.289
110−10157.56347.782
12001157.56347.782
1300−1−163.56952.768
14000050.55541.965
15010−135.53929.502
16100135.53929.502
170−1−1061.56751.106
1800−1161.56751.106
19−101045.47927.753
20101036.54030.331
21000033.53627.838
22000067.57456.092
23000056.56246.951
240−10−175.58362.740
250−11052.55743.627
26−100−132.53527.007
27011048.55340.303
28010157.56342.782
29100−135.53929.502
Table 3. Elemental composition of fish scales, reprinted with permission from ref. [15]. Copyright year: 2024. Copyright Owner’s Name: Dig. J. Nanomater. Bios.
ElementCNCaPNaMgMineral Content
Content (%)26.511.114.56.70.40.346.26
Table 4. Physical characteristics of PFS, FS-CeO2 and CFS-CeO2 adsorbents.
AdsorbentSpecific Surface
(m2 g−1)
Pore Volumes (cm3 g−1)Average Pore Diameter (nm)pHPZCZeta Potential
(mV)
FS *18.50.35626.77.21/
FS-CeO236.90.4886.87.05−17.92 (pH 5.14)
CFS-CeO2106.70.6382.56.84−17.40 (pH 5.02)
* previous research [6].
Table 5. ANOVA statistical results for the optimization of As(V) adsorption on FS-CeO2 modeled via quadratic modeling.
Source
Model
Sum of
Squares
dfMean
Square
F
Value
p-Value
Prob > F
Model4013.8914286.716.360.0007
A-pH1140.7511140.7525.290.0002
B-ma936.331936.3320.760.0004
C-T21.33121.330.470.5028
D-t168.751168.753.740.0735
AB72.25172.251.600.2263
AC272.251272.256.040.0277
AD6.2516.250.140.7153
BC25.00125.000.550.4689
BD342.251342.257.590.0155
CD132.251132.252.930.1089
A2545.051545.0512.080.0037
B2368.931368.938.180.0126
C2236.771236.775.250.0380
D2208.291208.294.620.0496
Residual631.421445.10
Lack of Fit631.421063.14
Pure Error0.00040.000
Cor Total4645.3128
Std. Dev.6.72 R-Squared0.9689
Mean47.26 Adj R20.9387
C.V.%14.21 Pred R20.8771
PRESS3636.96 Adeq Precision18.385
Table 6. Experimental parameters of nonlinear adsorption isotherm modeling of As(V) and Cr(VI) ions on FS-CeO2 and CFS-CeO2 adsorbents.
AdsorbentIsotherm Models and ParametersTemperature
25 °C35 °C45 °C
As(V)Cr(VI)As(V)Cr(VI)As(V)Cr(VI)
Langmuir isotherm
FS-CeO2qm (mg g−1)92.6165.3094.7270.7096.5871.82
KL (dm3 mg−1)2.452.512.692.803.003.21
R20.9490.9610.9570.9560.9640.958
CFS-CeO2qm (mg g−1)89.6757.3092.0758.0594.4458.73
KL (dm3 mg−1)1.391.741.441.831.491.93
R20.9840.9410.9830.9460.9800.938
Freundlich isotherm
FS-CeO2KF
(dm3 mg−1)1/n
65.8445.0470.3647.9275.4851.06
n1.941.951.941.941.951.93
R20.9980.9980.9990.9980.9990.998
CFS-CeO2KF
(dm3 mg−1)1/n
48.8032.4751.1733.5153.7534.60
n1.802.331.792.351.782.37
R20.9980.9990.9990.9990.9990.999
Table 7. Calculated thermodynamic parameters for As(V) and Cr(VI) adsorption onto FS-CeO2 and CFS-CeO2 adsorbents.
Adsorbent/ionΔGΘ (kJ mol−1)ΔHΘ
(kJ mol−1)
ΔSΘ
(J mol−1 K−1)
R2
25 °C35 °C45 °C
FS-CeO2/As(V)−39.10−40.64−42.267.97157.820.994
FS-CeO2/Cr(V)−39.16−40.75−42.439.67163.730.993
CFS-CeO2/As(V)−37.70−39.04−40.402.59135.130.996
CFS-CeO2/Cr(V)−38.25−39.66−41.083.93141.470.998
Table 8. Kinetic parameters for As(V) and Cr(VI) adsorption on FS-CeO2 and CFS-CeO2 adsorbents (Ci[As(V)] = 5.78 mg dm−3, Ci[Cr(VI)] = 6.00 mg dm−3, pH = 6; m/V = 667 mg dm−3, T = 25 °C).
AdsorbentParameters of ModelPseudo-First OrderPseudo-Second OrderSecond Order
As(V)Cr(VI)As(V)Cr(VI)As(V)Cr(VI)
FS-CeO2qe6.019.199.229.989.229.98
k (k1, k2)0.0760.0860.0160.0080.0880.049
R20.9330.9310.9980.9940.8690.834
CFS-CeO2qe5.318.158.679.618.679.61
k (k1, k2)0.0700.0740.0190.00990.0270.029
R20.9690.9680.9980.9940.8820.883
Table 9. Bohart–Adams and Yoon–Nelson fitting for As(V) and Cr(VI) adsorption by FS-CeO2 (Ci[As(V)] = 2.9 mg dm−3,Ci[Cr(VI)] = 3.0 mg dm−3, mads = 0.235 g, T = 25 °C, pH = 6).
Model and ParametersIonsQ (cm3 min−1)
0.51.01.5
Bohart–AdamsKBA (dm3 mg−1 min−1)As(V)0.1530.2480.349
qo (mg g−1)73.3665.3356.68
R20.9990.9980.997
KBA (dm3 mg−1 min−1)Cr(VI)0.1640.3200.446
qo (mg g−1)63.8061.9857.62
R20.9980.9970.997
Yoon–NelsonkYN (min−1)As(V)0.8880.7190.675
θ (min)5.945.294.84
R20.9990.9970.998
kYN (min−1)Cr(VI)0.9830.9570.981
θ (min)4.994.884.51
R20.9990.9980.997
Table 10. The adsorption-desorption of the As(V) from FS-CeO2 (Qdes = 0.50; 1.00 and 1.50 mL min−1; mads = 0.235 g) using 2 wt.% NaOH/2 wt.% NaCl.
CycleAdsorption
(mg g−1) *
Flow Rate
(mL min−1)
Desorption
(mg g−1) *
Desorption
Efficiency (%)
C (ppm) **Δq
(mg g−1) ***
I73.360.5071.2397.1334.82.1
1.0065.3689.1307.28.0
1.5058.6179.9275.514.7
III69.450.5066.0595.1310.43.4
1.0060.2886.8283.39.2
1.5054.7378.8257.214.7
V65.750.5060.9592.7286.54.8
1.0055.2984.1259.910.5
1.5049.8475.8234.315.9
* adsorption capacity and quantity of desorbed pollutants; ** concentration of the pollutant in effluent water; *** quantity of the irreversibly bonded pollutants.
Table 11. Comparative review of the adsorbent’s performances of oxyanions removal.
AdsorbentCi
(mg dm−3)
Oxyanions/qmax
(mg g−1)
Isotherm or
Kinetic Model
Ref.
fish scales0.25 mg dm−3As(V)/64% (dose 200 mg dm−3)exp. Batch Adsorption Studies[27]
10.00 mg dm−3Cr(VI)/first litre of 96.25% removed (dose 20 g dm−3)exp. Column Study
cranberry kernel shell (CKS)1000 mg dm−3Cr(VI)/10.42Langmuir[28]
rosehip seed shell (RSS)1000 mg dm−3Cr(VI)/15.17Langmuir
banana peel (BP)1000 mg dm−3Cr(VI)/6.81Langmuir
carbonized waste biomass chestnut shells (CPC)—electrosorption30 mg dm−3Cr(VI)/43.18- 89.71exp.[29]
Untreated powdered eggshell0.5 mg dm−3As(V)/43.18Langmuir[30]
Rice straw—treated Fe(NO3)350.0 mg dm−3As(V)/21.74Langmuir[31]
Bead Cellulose (Cotton)—treated FeCl3·6H2O/As(III)/99.6, As(V)/33.2Langmuir[32]
Magnetite-modified water hyacinth
Biochar (MW2501)
5 mg dm−3As(V)/8.19Langmuir[33]
Nanocrystalline hydroxyapatite prepared from fish scale waste (FHAp)0.01 mg dm−3Se(IV)/1.94Langmuir[34]
fish scale waste (FS)0.01 mg dm−3Se(IV)/1.02Langmuir
fish scale waste150 mg dm−3Cr(III)/99.75% (dose 800 mg dm−3)Pseudo 2nd order, qe = 18.83 mg g−1[35]
FS-CeO25.78 mg dm−3As(V)/92.61Langmuirthis study
FS-CeO26.00 mg dm−3Cr(IV)/65.30Langmuir
CFS-CeO25.78 mg dm−3As(V)/89.67Langmuir
CFS-CeO26.00 mg dm−3Cr(IV)/57.30Langmuir
Disclaimer/Publisher’s Note: The statements, opinions and data contained in all publications are solely those of the individual author(s) and contributor(s) and not of MDPI and/or the editor(s). MDPI and/or the editor(s) disclaim responsibility for any injury to people or property resulting from any ideas, methods, instructions or products referred to in the content.