1. Introduction
Chromium compounds are widely present in wastewater from industries such as tanning, printing, electroplating, and steel production [
1,
2,
3]. Among these compounds, hexavalent chromium Cr(VI) is highly soluble at all pH conditions, highly oxidizable, highly mobile, and 100 times more toxic than trivalent chromium Cr(III) [
4]. Reduction of Cr(VI) to Cr(III) in wastewater can effectively reduce chromium pollution to protect ecosystem quality and human health. Various methods have been explored to treat Cr(VI) pollution, such as adsorption, chemical precipitation, ion exchange, biological reduction, photocatalytic reduction, and so on [
5,
6,
7]. Among them, adsorption and photocatalytic methods stand out for their simplicity and low cost [
8,
9]. In the photocatalytic process, semiconductor materials absorb photon energy under light to produce photogenerated electrons and holes [
10,
11,
12], and the photogenerated electrons are transferred to Cr(VI) for a reduction reaction to produce Cr(III) [
13,
14]. However, the photocatalytic method could not enrich Cr(VI) well, resulting in a long degradation time. Therefore, combining the adsorption method with photocatalysis to prepare photocatalysts with strong adsorption capacity can achieve faster and more thorough Cr(VI) removal [
15].
In recent years, carbon materials with a large specific surface area, rich pore structure, and adjustable surface functional groups [
16,
17] have received widespread attention for efficient adsorption and reduction of Cr(VI) [
18,
19]. Some carbon materials can reduce Cr(VI) to Cr(III) with lower toxicity under photocatalytic conditions, achieving a more thorough removal [
20]. However, bare carbon usually exhibits insufficient adsorption capacity for target pollutants. The adsorption capacity and selectivity of Cr(VI) can be further improved by modifying carbon materials, such as by doping metal or nonmetallic elements and surface functionalization treatment [
21]. Wei et al. prepared nitrogen-doped spherical carbon materials derived from waste peanut shells (WPHSC) by a one-step hydrothermal method. According to the adsorption experiments, WPHSC showed excellent adsorption performance for Cr(VI). The adsorption removal rate of 100 mg/L Cr(VI) was above 99.5%, and the residual concentration was lower than 0.5 mg/L [
22]. In addition, the abundant pore structure is extremely important for the removal performance of Cr(VI) [
23]. Generally, the preparation of porous carbon materials uses strong bases such as KOH. By corroding carbon materials, a relatively large specific surface area can indeed be achieved, and strong acid is also needed to remove the residue corrosive KOH [
24]. Thus, this method is not safe enough and may pollute the environment. Therefore, it is necessary to prepare a porous carbon material with a large specific surface area by a clean and safe method to efficiently reduce Cr(VI).
Deep learning is a branch of machine learning [
25]. It is an algorithm based on data representation learning, which aims to simulate the neural network structure in the human brain to solve complex problems. Its core is to build a network of multi-layer nonlinear processing units (neurons) that can automatically extract features from raw data and learn. Deep learning is widely used in image recognition, speech recognition, image generation, and other fields. At present, deep learning has become the mainstream technical paradigm for time series prediction with its powerful feature extraction and nonlinear modeling capabilities. The application of deep learning has been very extensive, and many successful cases, such as AlphaGo, are based on deep learning technology. In order to systematically evaluate the prediction performance of different architecture models, three representative models including temporal convolutional network (TCN), gated recurrent unit (GRU), and Transformer are generally used. The TCN innovates the time series modeling capability of the traditional convolutional neural network (CNN) through the causal convolution mechanism [
26]. While retaining the parallel computing advantages of CNN, it significantly reduces memory overhead and improves the applicability of sequence prediction tasks. The GRU is an improved recurrent neural network (RNN) structure [
27]. As an efficient and simplified variant of the long short-term memory (LSTM) network, the model complexity of the GRU (in terms of the number of parameters) is significantly lower than that of LSTM, and its prediction accuracy on various time series datasets is comparable to or even better than that of LSTM. Based on the above characteristics, the GRU has become a widely used lightweight and efficient recurrent unit. The Transformer architecture replaces traditional recurrent/convolution operations with a self-attention mechanism [
28]. Its core breakthrough lies in its global dependency modeling capabilities and parallel computing advantages. It can synchronously integrate all position information and effectively solve long-range dependency problems. Therefore, these models are expected to be applicable for the prediction of Cr(VI) degradation performance.
In this work, by combining cellulosic carbon and sludge precursors, a porous carbon material with a large specific surface area and rich nitrogen/oxygen functional groups was successfully synthesized using green activation agent ammonium bicarbonate (NH4HCO3). These as-prepared cellulose/sludge based carbon (CPS) materials can perform dual functions, which are adsorption and catalytic reduction of Cr(VI) under light. The design of this composite carbon material could enhance the capture capacity of the heavy metal Cr and improve the photocatalytic efficiency to realize the efficient adsorption and reduction of Cr(VI) from wastewater. Also, the effects of catalysts with different proportions of cellulose and different calcination temperatures on the degradation performance of Cr(VI) were also investigated. Moreover, deep learning algorithms were applied to study the Cr(VI) degradation behavior and predicted the Cr(VI) changing trend. The accuracy of the algorithms was finally verified by subsequent experiments. This method greatly reduced the number of experimental tests, saving time and resources through algorithms. Under similar experimental conditions, data can be predicted through deep learning, reducing the cost of manual testing.
2. Materials and Methods
2.1. Preparation of CPS
CPS catalysts were prepared using 1.0 g cellulose (Aladdin, Shanghai, China, 99.5%) and 1.0 g sludge (municipal wastewater treatment plant, information is provided in
Table S1) evenly mixed by ball milling, stirred with 1.0 g urea (CO(NH
2), Alfa Aesar, Ward Hill, MA, USA, 99%) and NH
4HCO
3 (Macklin, Shanghai, China, 99%) for 12 h, calcined in a tube furnace at 350 °C, and washed with ethanol to remove the soluble organics. The mass ratio of cellulose, sludge, and milling balls was 1:1:20. The ball milling process proceeded at 500 rpm for 10 h. Afterward, the samples were rinsed with deionized water and dried in a vacuum oven at 50 °C overnight. Based on the ratio of cellulose and sludge, the sample could be labeled as CPS 1:1. For calcination temperature, the sample could be also named as CPS 350. For comparison, CPS 500, CPS 700, CPS 900 were produced following the same process with different calcination temperatures.
2.2. Characterization
The crystal structure was characterized by X-ray diffraction (XRD, Rigaku, Tokyo, Japan, D-MAX 2200 VPC, Cu Kα radiation, 26 mA, 40 kV) over a 2θ range of 5–70° at a scanning speed of 2° min−1. Specific surface area was calculated using the Brunauer–Emmett–Teller (BET) method, which was derived from a Micromeritics ASAP 2460 instrument (Norcross, GA, USA). Catalysts surface functional groups were investigated by FT-IR spectra, which were recorded by a Perkin-Elmer Spectrum GX spectrometer (Shelton, CT, USA, 500–2000 cm−1, 1 cm−1 resolution). Morphology was studied by scanning electron microscopy (SEM; SIGMA HD, Zeiss, Germany). Surface chemical states were analyzed by X-ray photoelectron spectroscopy (XPS; Thermo Scientific K-Alpha+, Waltham, MA, USA, Al-Kα source). Solution pH was measured using an OHAUS STARTER 3100 pH meter (Parsippany, NJ, USA). Cr(VI) concentration was calibrated by an ICP analyzer (ICP-OES, PerkinElmer Optima 5300 DV, Shelton, CT, USA) or UV spectrophotometer (Shimadzu UV-2600, Kyoto, Japan, λ = 540 nm).
The experiments were performed in a photochemical reaction instrument (PR22-25, Beijing, China). A Xe lamp with a power density of 75 mW/cm2 (PLS-LAX500, Beijing, China) equipped with a 420 nm cutoff filter served as the visible light source. Potassium dichromate (K2Cr2O7, Macklin, Shanghai, China, 99.8%) was used as the solute and 0.5 wt% nitric acid solution (HNO3, 65.0–68.0%, Guangzhou Chemical Reagent Factory, Guangzhou, China) was used as the solvent to prepare a 1000 mg/L mother solution. During the experiment, an appropriate amount of the mother solution was taken out and diluted, then 1 mol/L HCl or NaOH solution was added to adjust the pH value. The removal rate (η) of Cr(VI) is calculated by the following formula: η = (1 − C/C0) × 100%, where the initial concentration of Cr(VI) is C0 and the instantaneous concentration of Cr(VI) is C.
2.3. Prediction
Three smoothing algorithms are used in time series data preprocessing: moving average, Savitzky–Golay filter, and LOWESS. Data augmentation is achieved by linear interpolation, cubic polynomial interpolation (based on the Lagrange method), and nearest neighbor interpolation. The experimental results on pH and other parameter datasets show that the combination of Savitzky–Golay smoothing with cubic polynomial interpolation exhibits the lowest mean absolute error, which is consistent with the experimental results, meanwhile, the continuity and noise suppression ability of the time series are improved. The prediction model is constructed based on three artificial neural network architectures: GRU, TCN, and Transformer. In the experimental setup, the length of the input sequence is fixed at 10 time steps. The dataset was divided chronologically into training (60%), validation (20%), and test (20%) sets. The Adam optimizer is used to train the model, the batch size is 8, the maximum number of training epochs is 100, and the early stopping mechanism is set, whose threshold is the loss of the verification set for 5 consecutive rounds. Dropout was used for model regularization, and its ratio was set to 0.1. All computations were performed in the Python 3.12 environment using the TensorFlow 2.18.0 framework. The performance of the model is evaluated by independent test sets, and the quantitative indicators include coefficient of determination (R2), root mean square error (RMSE), and mean absolute error (MAE).
3. Results and Discussion
The CPS catalysts were fabricated via a one-step method, as illustrated in
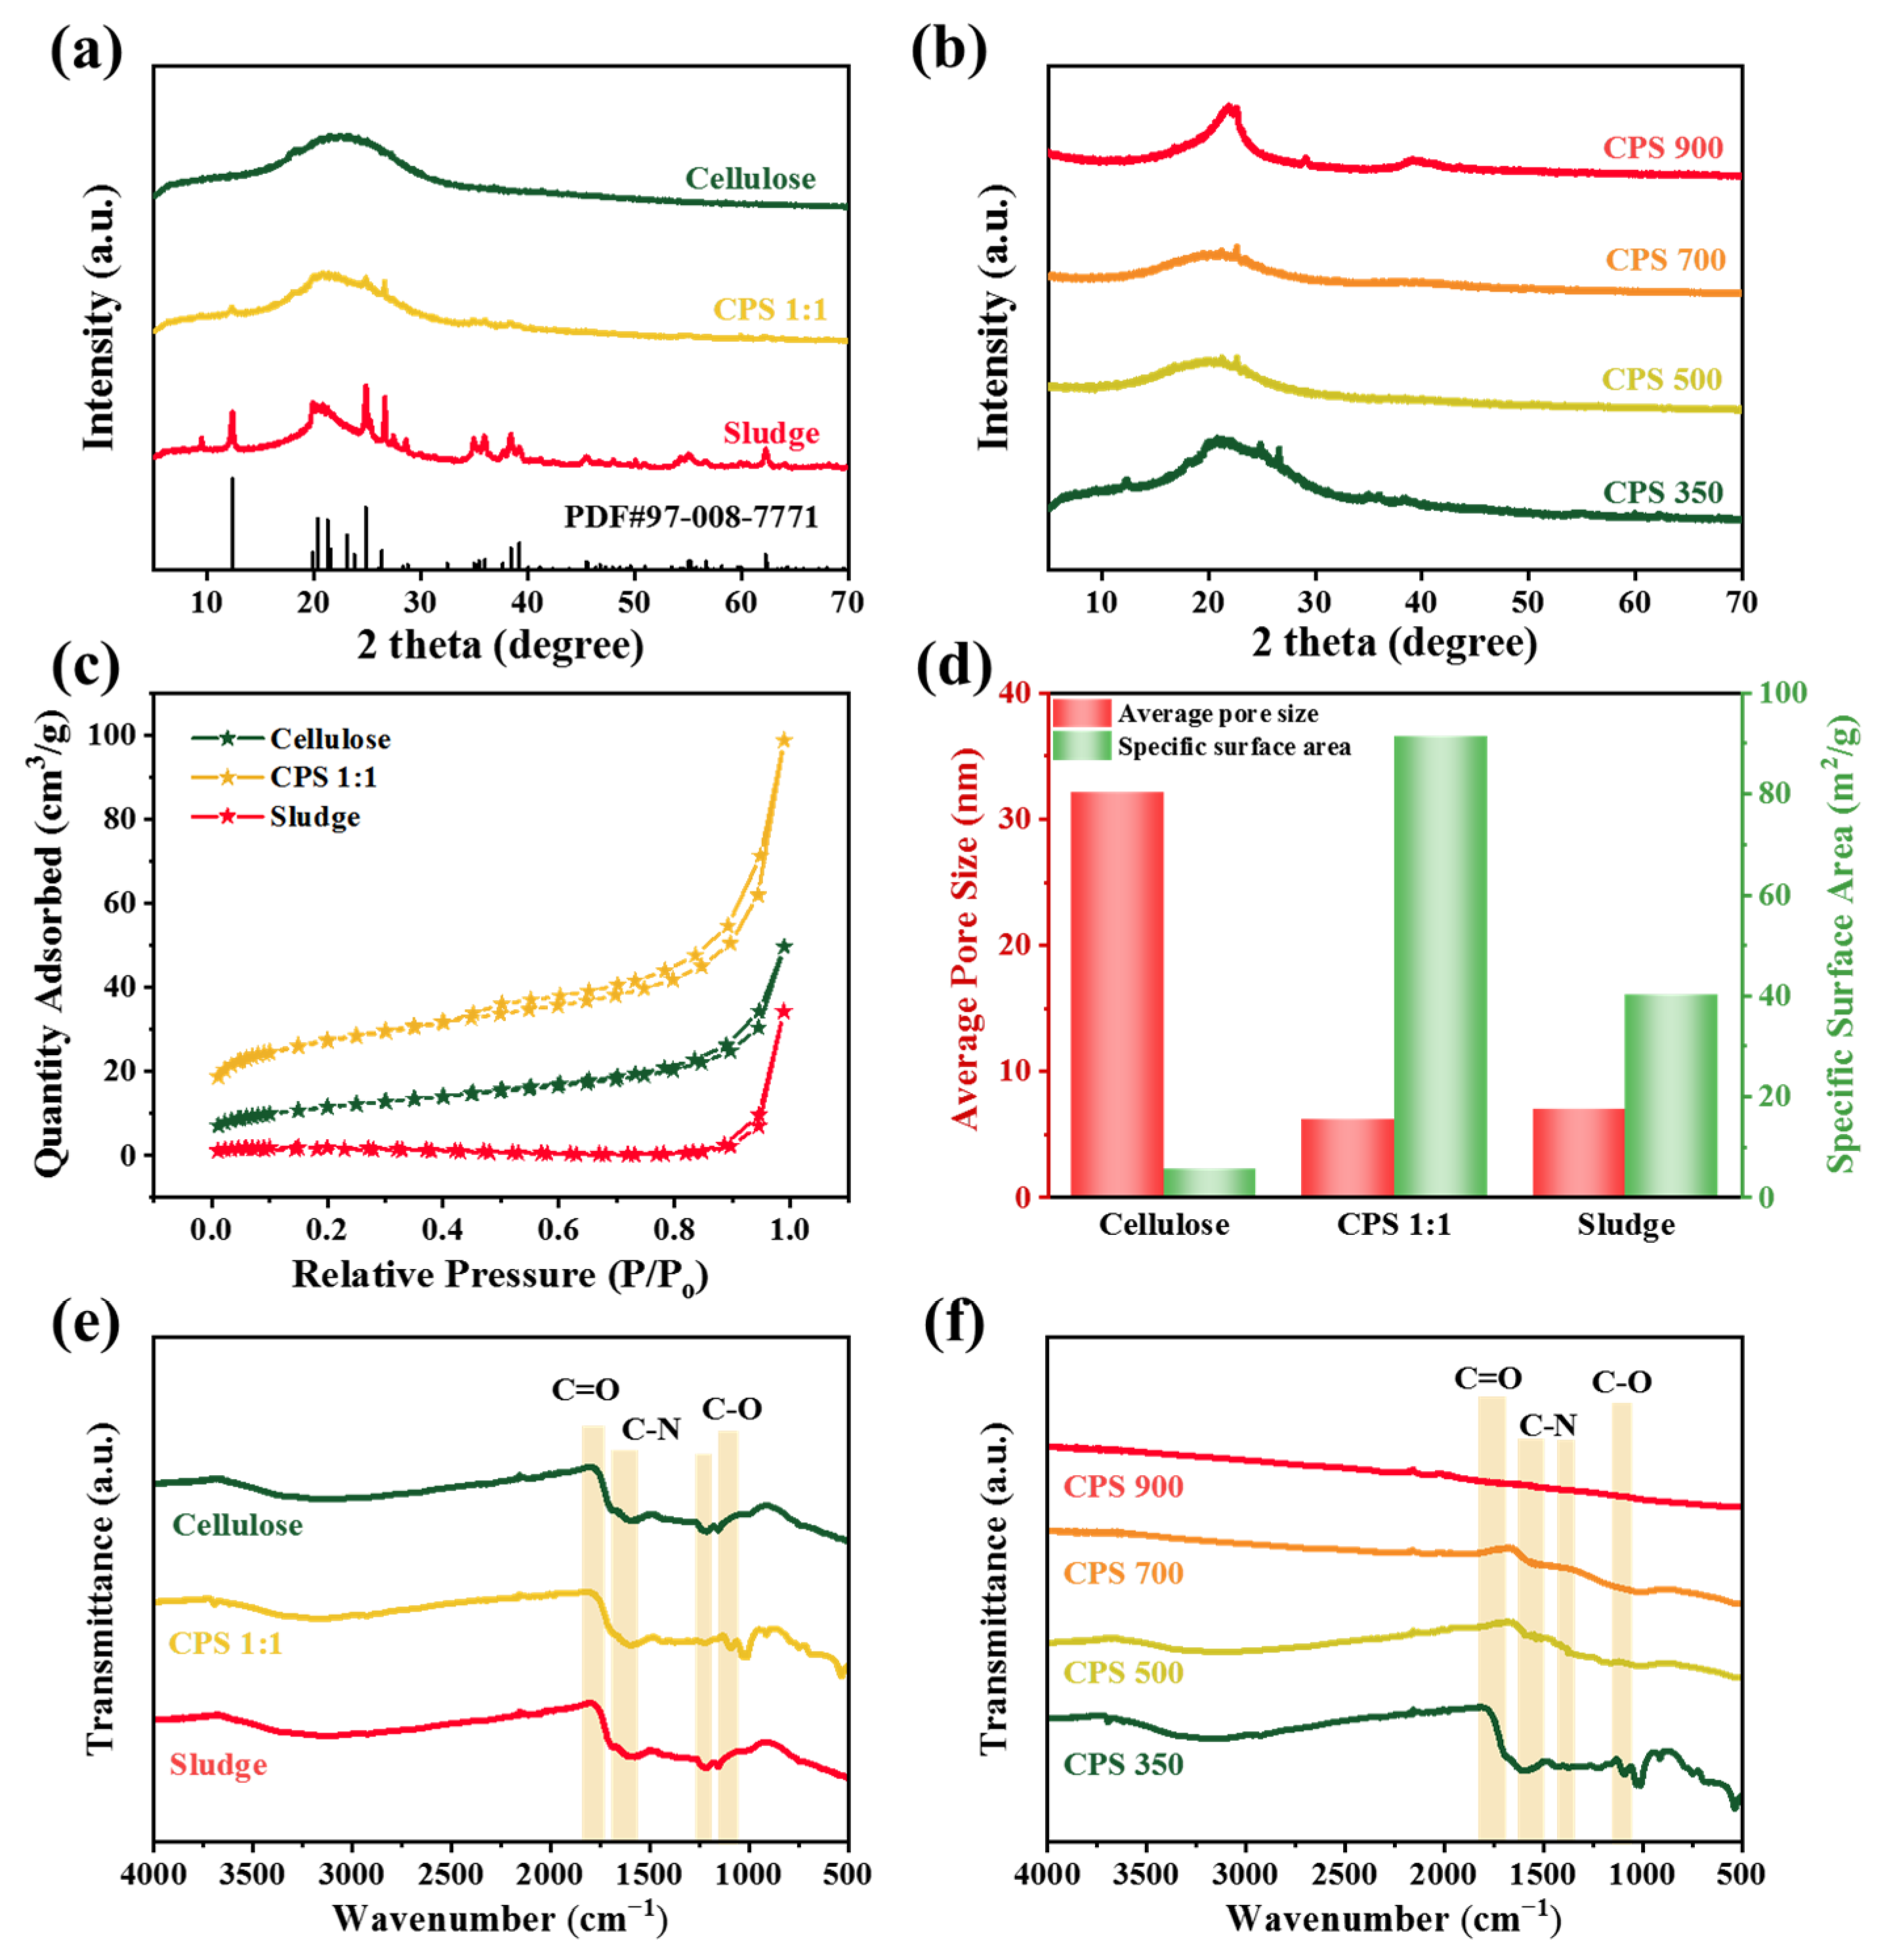
Figure 1. The X-ray diffraction (XRD) spectra of synthesized materials all exhibited a broad peak at 2θ = 22°, corresponding to the (002) plane, which was indicative of the presence of amorphous carbon [
29], thereby confirming the successful synthesis of carbonaceous structures (
Figure 2a). Notably, when the cellulose-to-sludge ratio was set at 1:1, prominent diffraction peaks were observed at 2θ = 12.3°, 24.8°, and 26.6°, which were attributable to the crystalline components of the sludge [
30]. This suggested that cellulose effectively infiltrated the pore structure of the sludge, resulting in the formation of a hybrid composite material.
Figure 2b illustrates that the (002) plane of carbon became narrower and more intense with increasing calcination temperature, demonstrating an enhancement in the crystallinity of the carbonaceous substrate in CPS materials. In contrast, the characteristic peaks of the sludge exhibited a diminishing trend with increasing calcination temperature, suggesting that excessively high calcination temperatures led to the loss of sludge components.
Figure 2c shows the N
2 adsorption–desorption isotherms of the three materials. It is evident that the CPS 1:1 material exhibited a significant increase in adsorption capacity in both the low- and high-pressure regions [
31]. According to the comparisons of the average pore size and specific surface area (
Figure 2d), it can be concluded that CPS 1:1 possessed a large specific surface area and an optimal pore structure [
32]. Fourier-transform infrared spectroscopy (FT-IR) was used to detect chemical functional groups on different materials. As shown in
Figure 2e, the stretching vibrations at 1050–1150 cm
−1 and 1600–1700 cm
−1 corresponded to the C–O and C=O bonds of oxygen-containing functional groups on the sample surface [
33,
34]. Compared to cellulose and sludge materials, the CPS 1:1 material exhibited a distinct stretching vibration at 1050–1150 cm
−1, indicating a higher content of C–O structures on its surface. The stretching vibrations at 1220 cm
−1 and 1435 cm
−1 are attributed to the C–N bond [
35,
36], confirming the successful formation of N-(C)
3 structures on all three materials. Further investigation into the effect of different calcination temperatures on the surface chemical functional groups of CPS materials (
Figure 2f) revealed that CPS 350 contained a substantial amount of C–O, C=O, and C–N functional groups. As the calcination temperature increased, the intensity of the C–O and C–N stretching vibrations decreased. CPS 900 presented no distinct peaks for functional groups, suggesting that elements such as oxygen and nitrogen were lost at elevated calcination temperature, resulting in a decrease of functional groups in CPS materials.
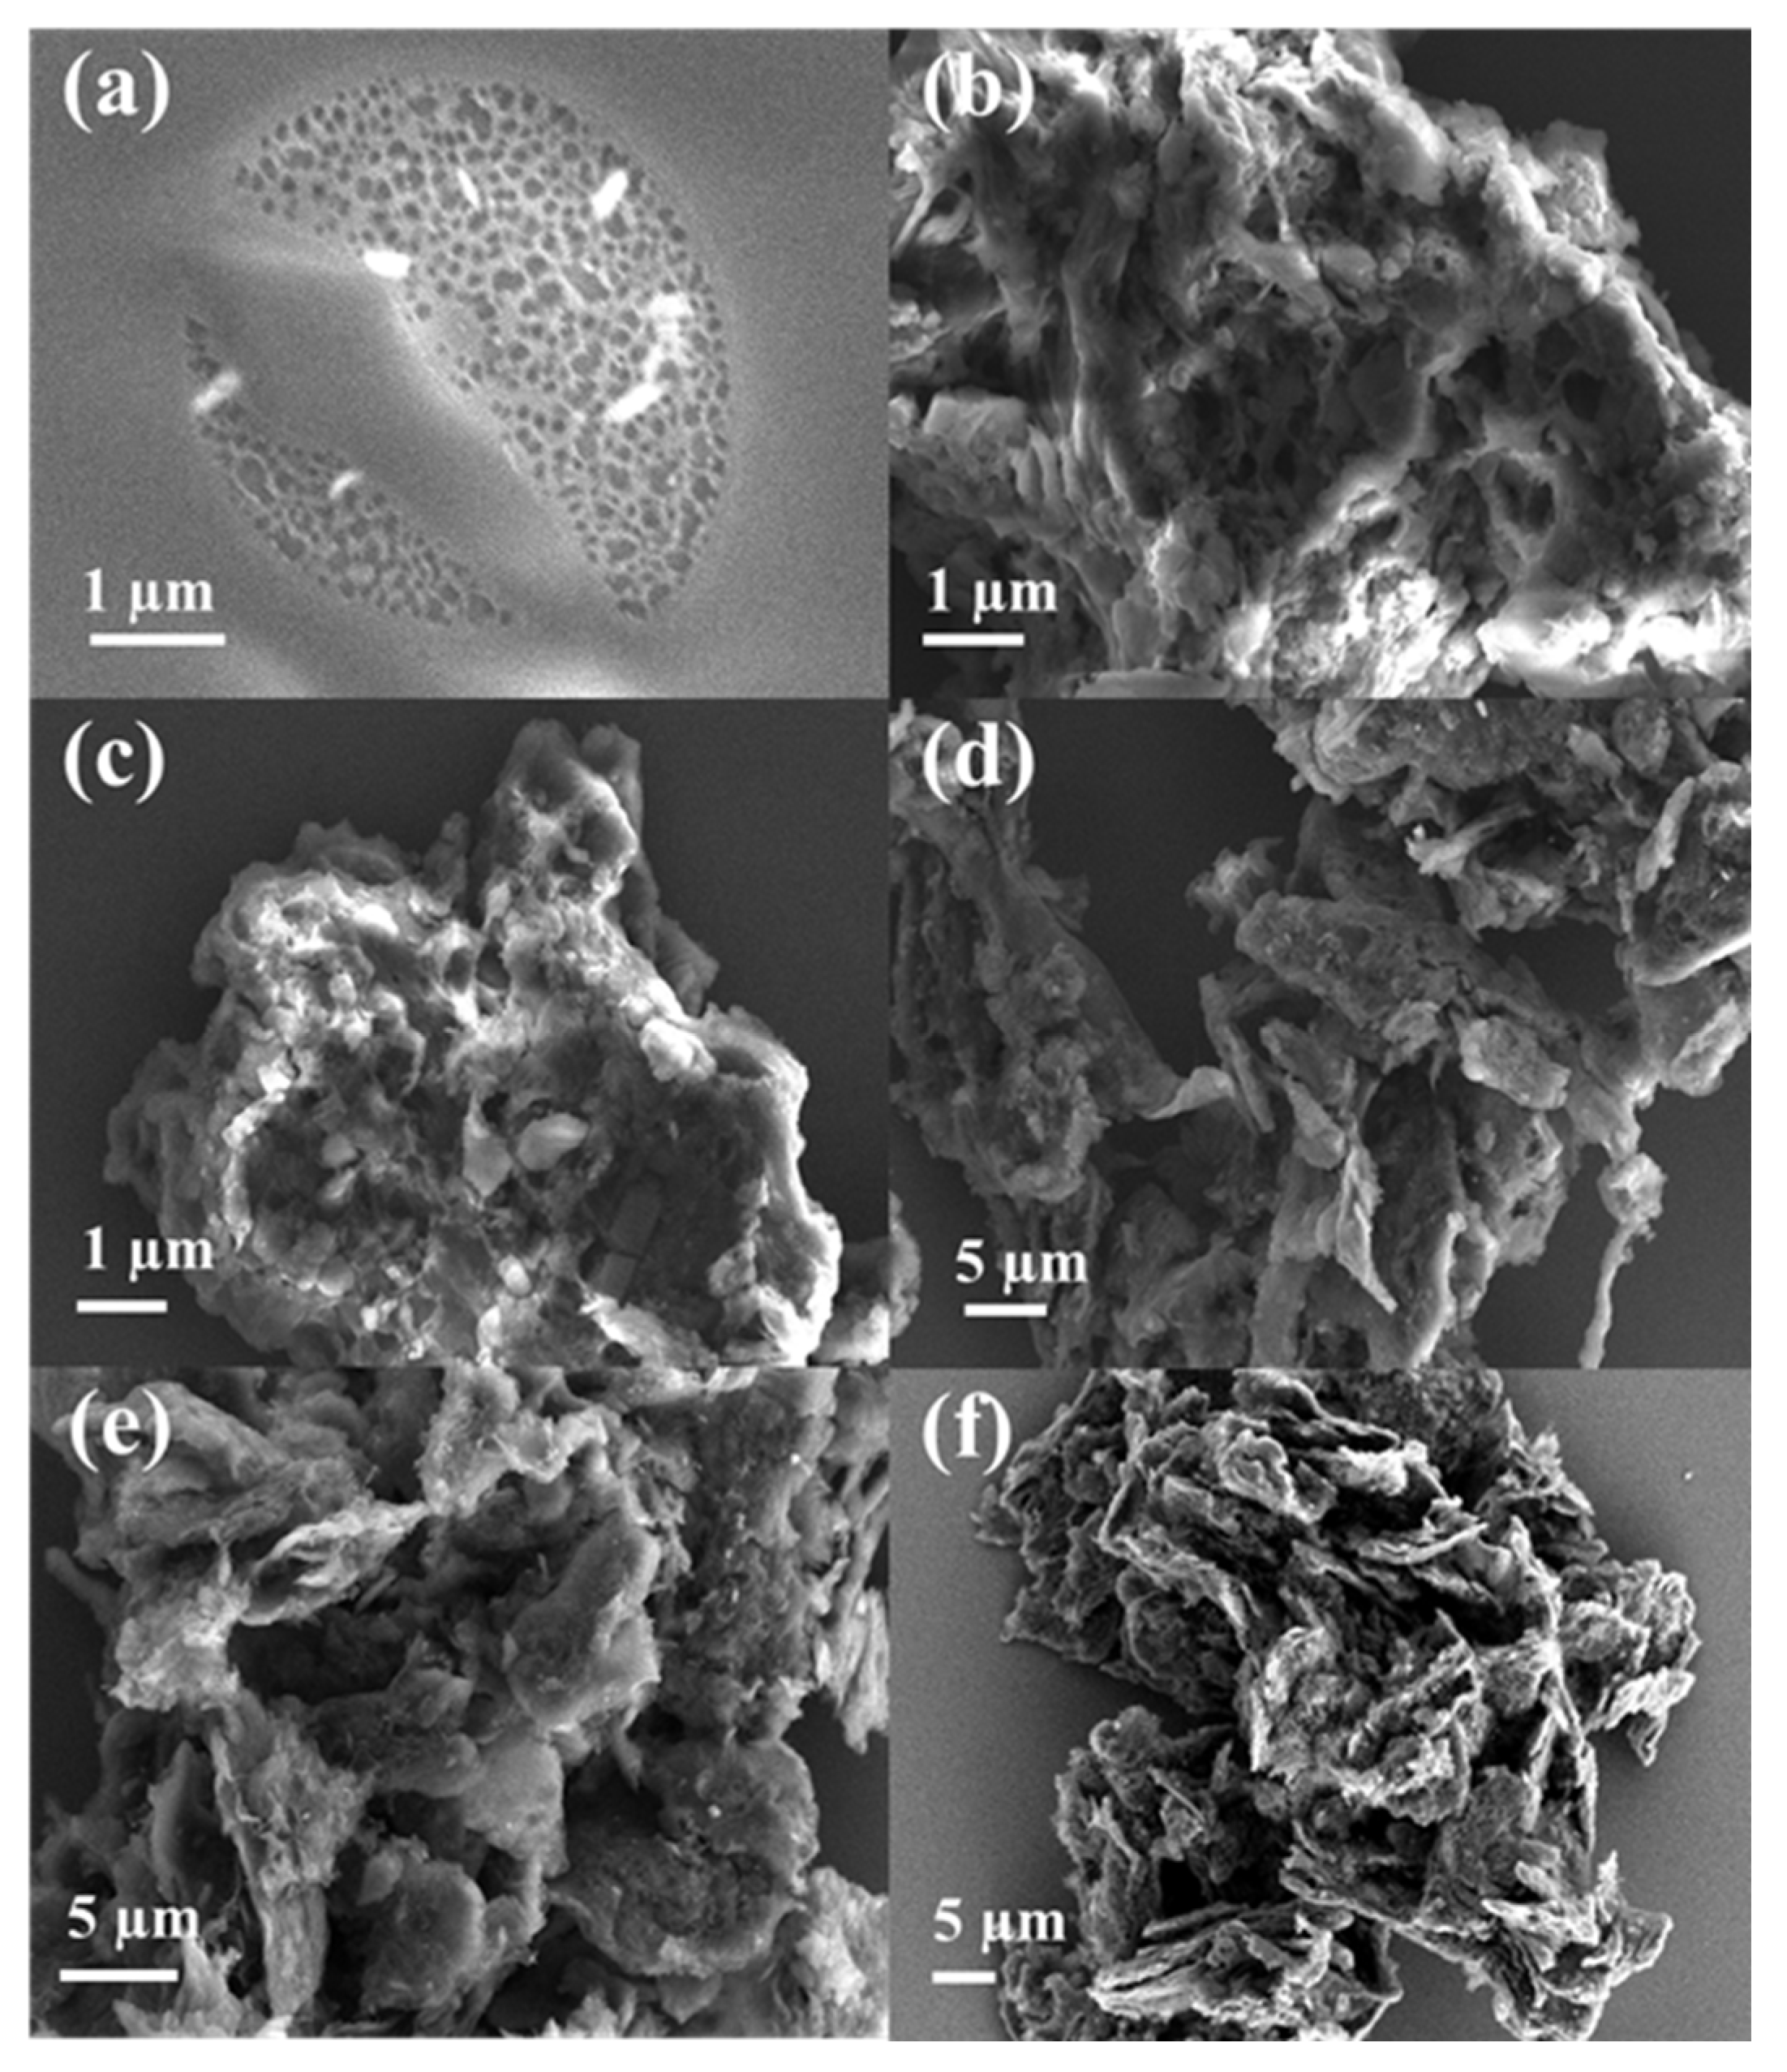
The morphology of the sample was analyzed by scanning electron microscopy (SEM).
Figure 3a,b shows the morphologies of pristine cellulose and sludge with distinct characteristics. As depicted in
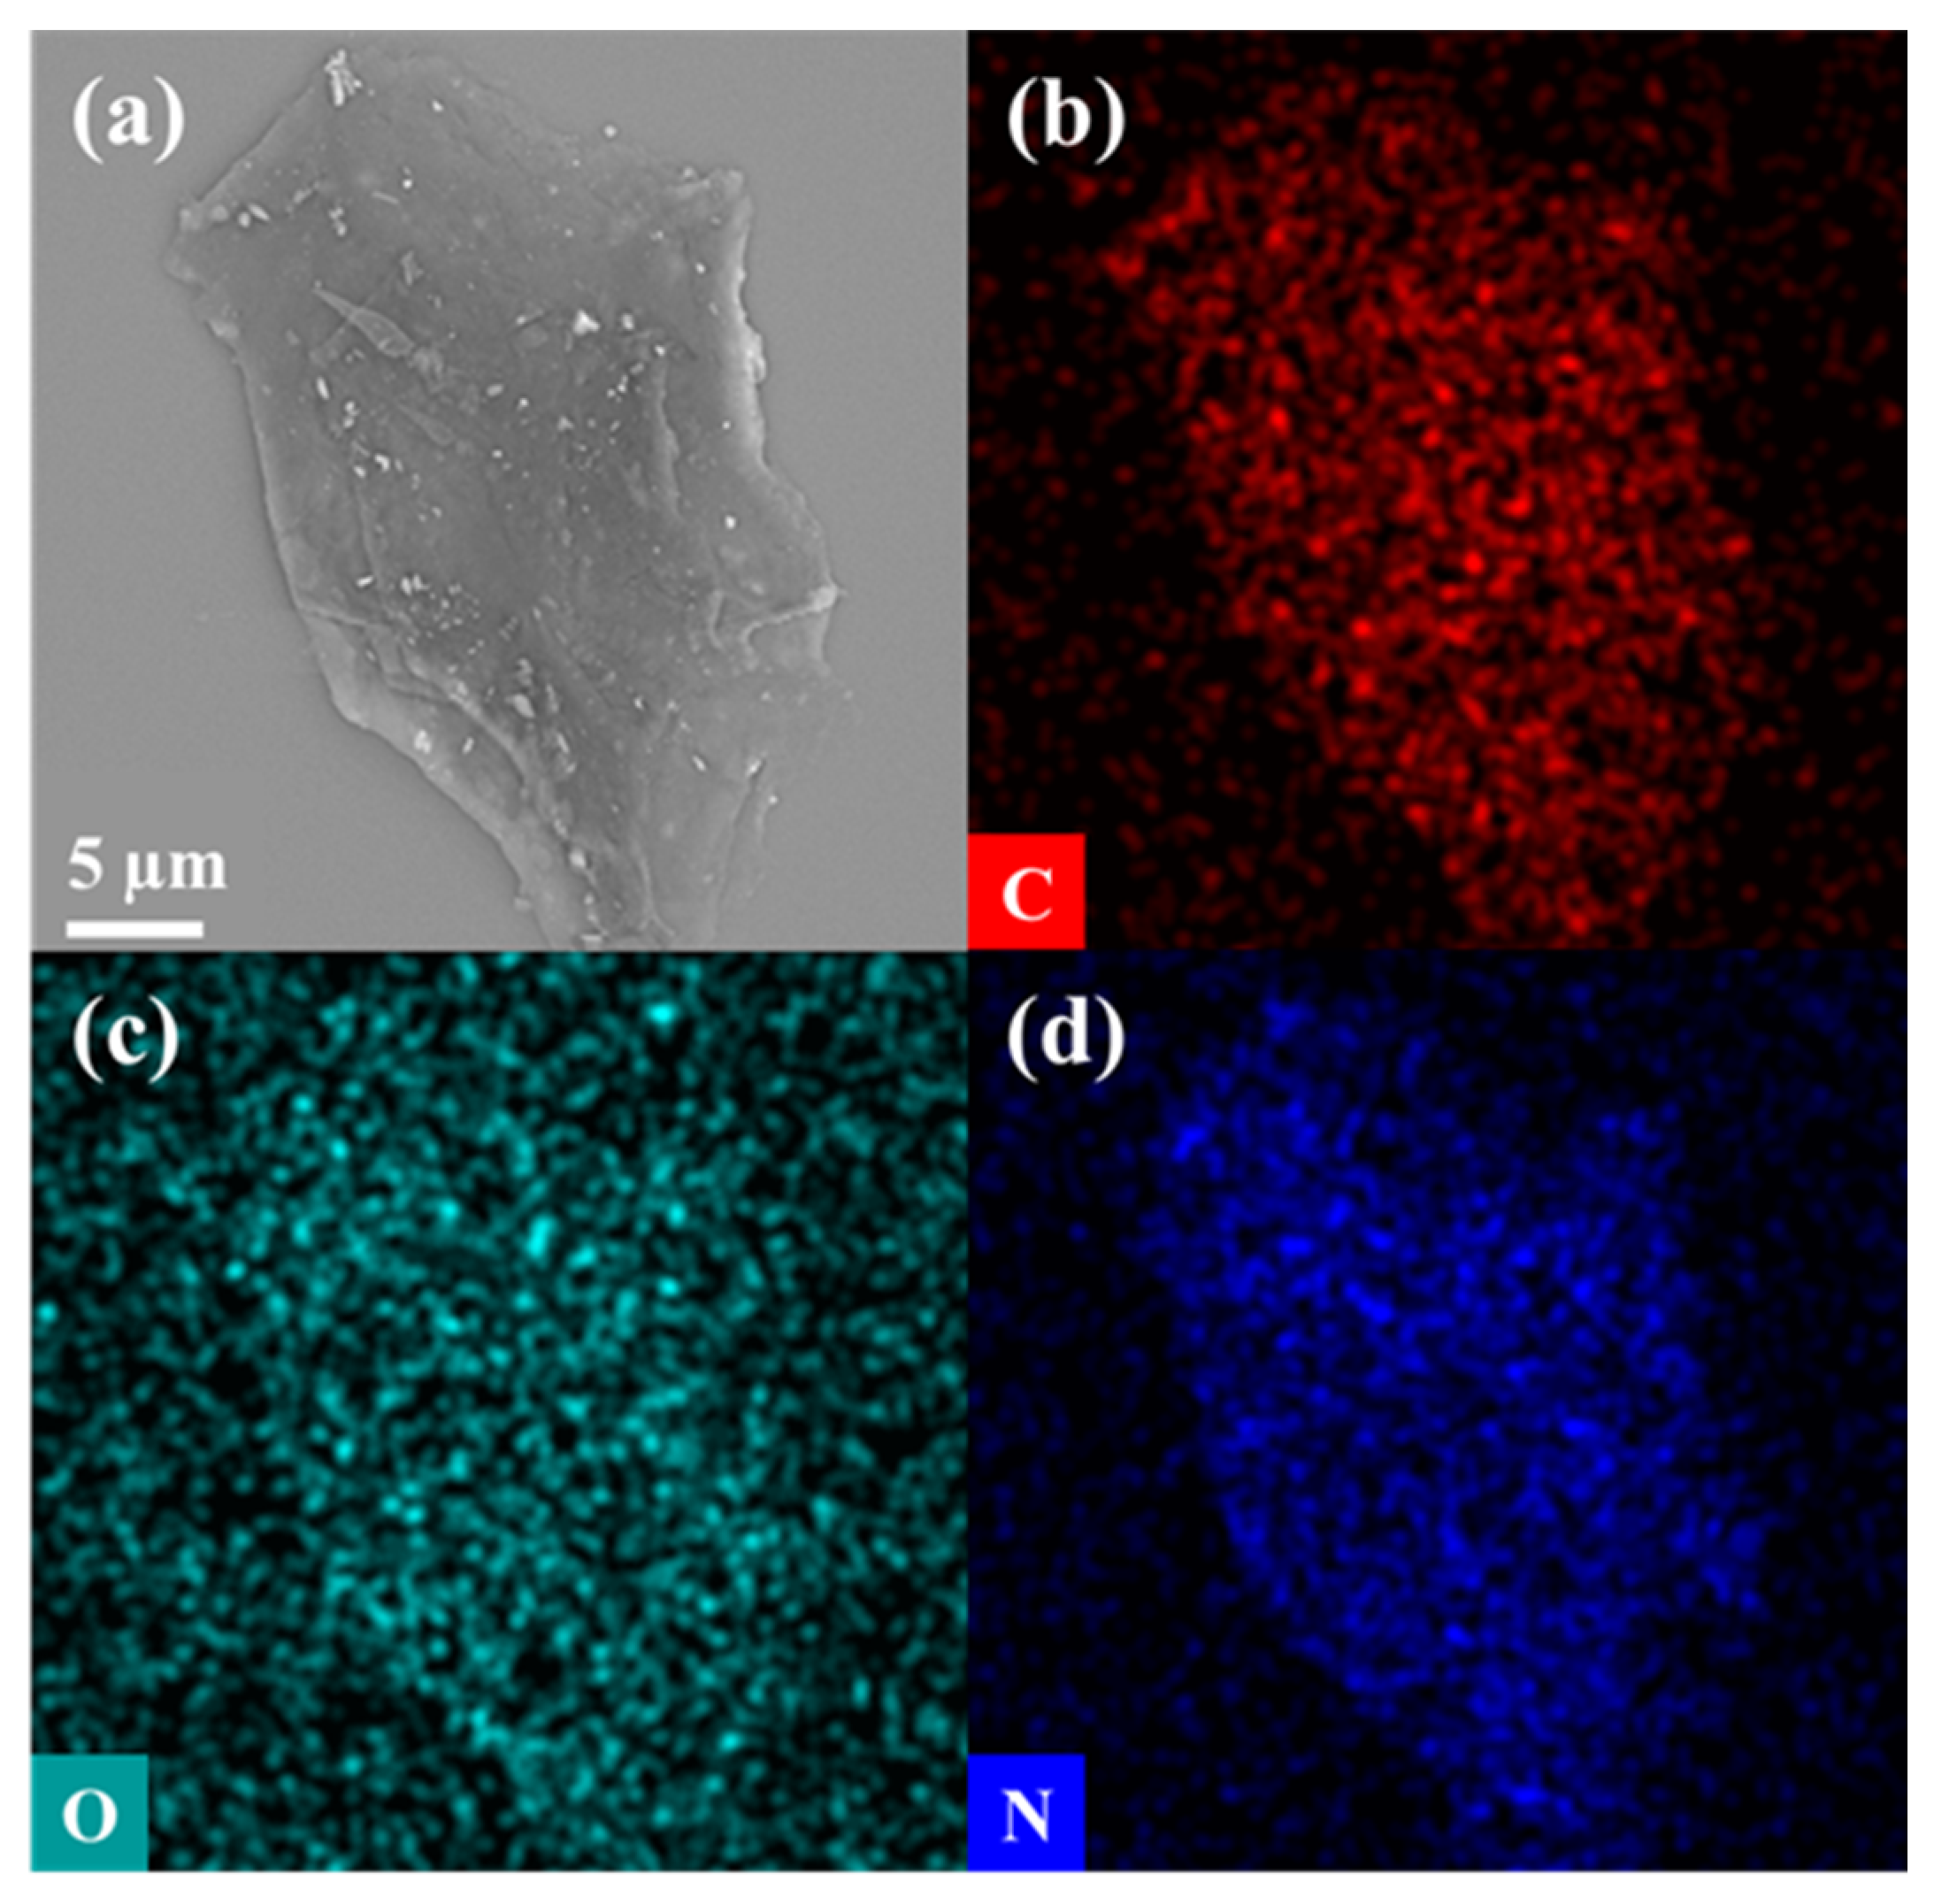
Figure 3c–f, SEM images of carbon materials treated at different pyrolysis temperatures showed irregular porous morphology. With the increase in pyrolysis temperature, the material structure tended to collapse and shrink. When the pyrolysis temperature was as high as 900 °C, CPS 900 was sheet-like and the structure was more compact, proving the high crystallinity of carbon material. Subsequently, energy dispersive spectrometer (EDS) images (
Figure 4) demonstrated a uniform distribution of the C, O, and N elements over the sample, confirming the successful doping of N element. In summary, the calcination temperature has a greater impact on the carbonization of materials. A higher calcination temperature resulted in a higher carbonization degree, a smaller specific surface area, and fewer functional groups, which may lead to poor removal of Cr. Thus, a low calcination temperature should be better for CPS materials.
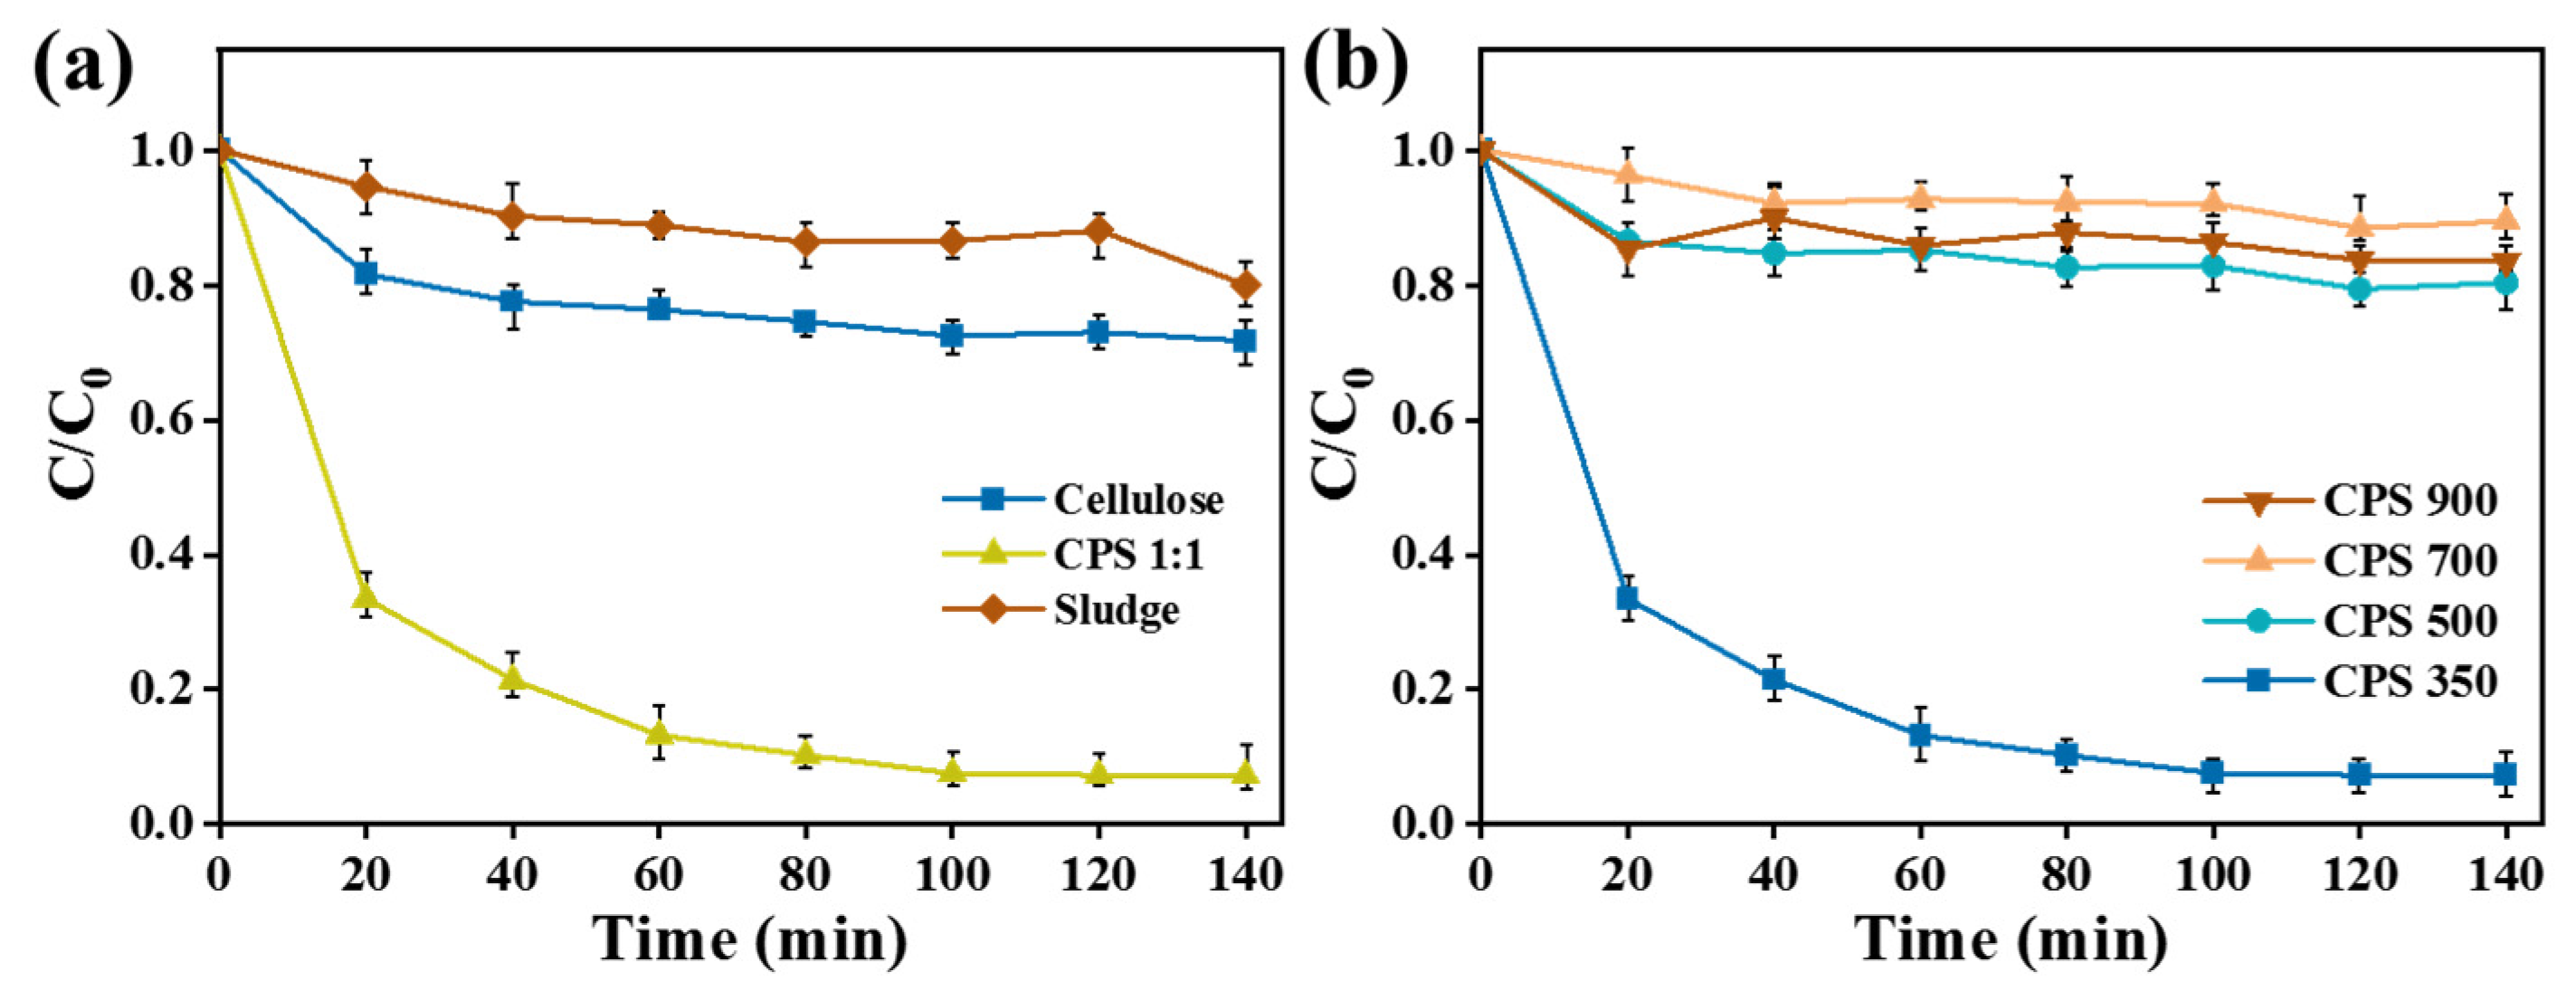
The removal efficiency of Cr(VI) through the combined adsorption and photocatalytic reduction of different materials is shown in
Figure 5a. The CPS 1:1 material demonstrated significantly better Cr(VI) removal performance compared to pure cellulose and sludge materials. In the dark, the removal of Cr(VI) was primarily attributed to the adsorption capacity of the material. After 160 min of light irradiation, the removal rate of Cr(VI) by CPS 1:1 reached 92.7%. In contrast, pure cellulose and sludge materials achieved removal rates of only 21.5% and 17.2%, respectively.
Figure 5b illustrates the Cr(VI) removal efficiency of materials treated at different pyrolysis temperatures. CPS 350 material exhibited the best Cr(VI) removal performance, achieving a removal rate of 92.7%. In contrast, CPS 500, CPS 700, and CPS 900 materials showed similarly low Cr(VI) removal efficiencies of 22.2%, 14.7%, and 17.7%, respectively. This decrease in performance was attributed to the collapse of the material’s porous structure, reduced specific surface area, and loss of functional groups as the pyrolysis temperature increased, resulting in a decreased Cr(VI) adsorption capacity. Additionally, the reusability of CPS 350 catalyst was evaluated. The Cr(VI) removal rate after five cycles was still higher than 80% (
Figure S1).
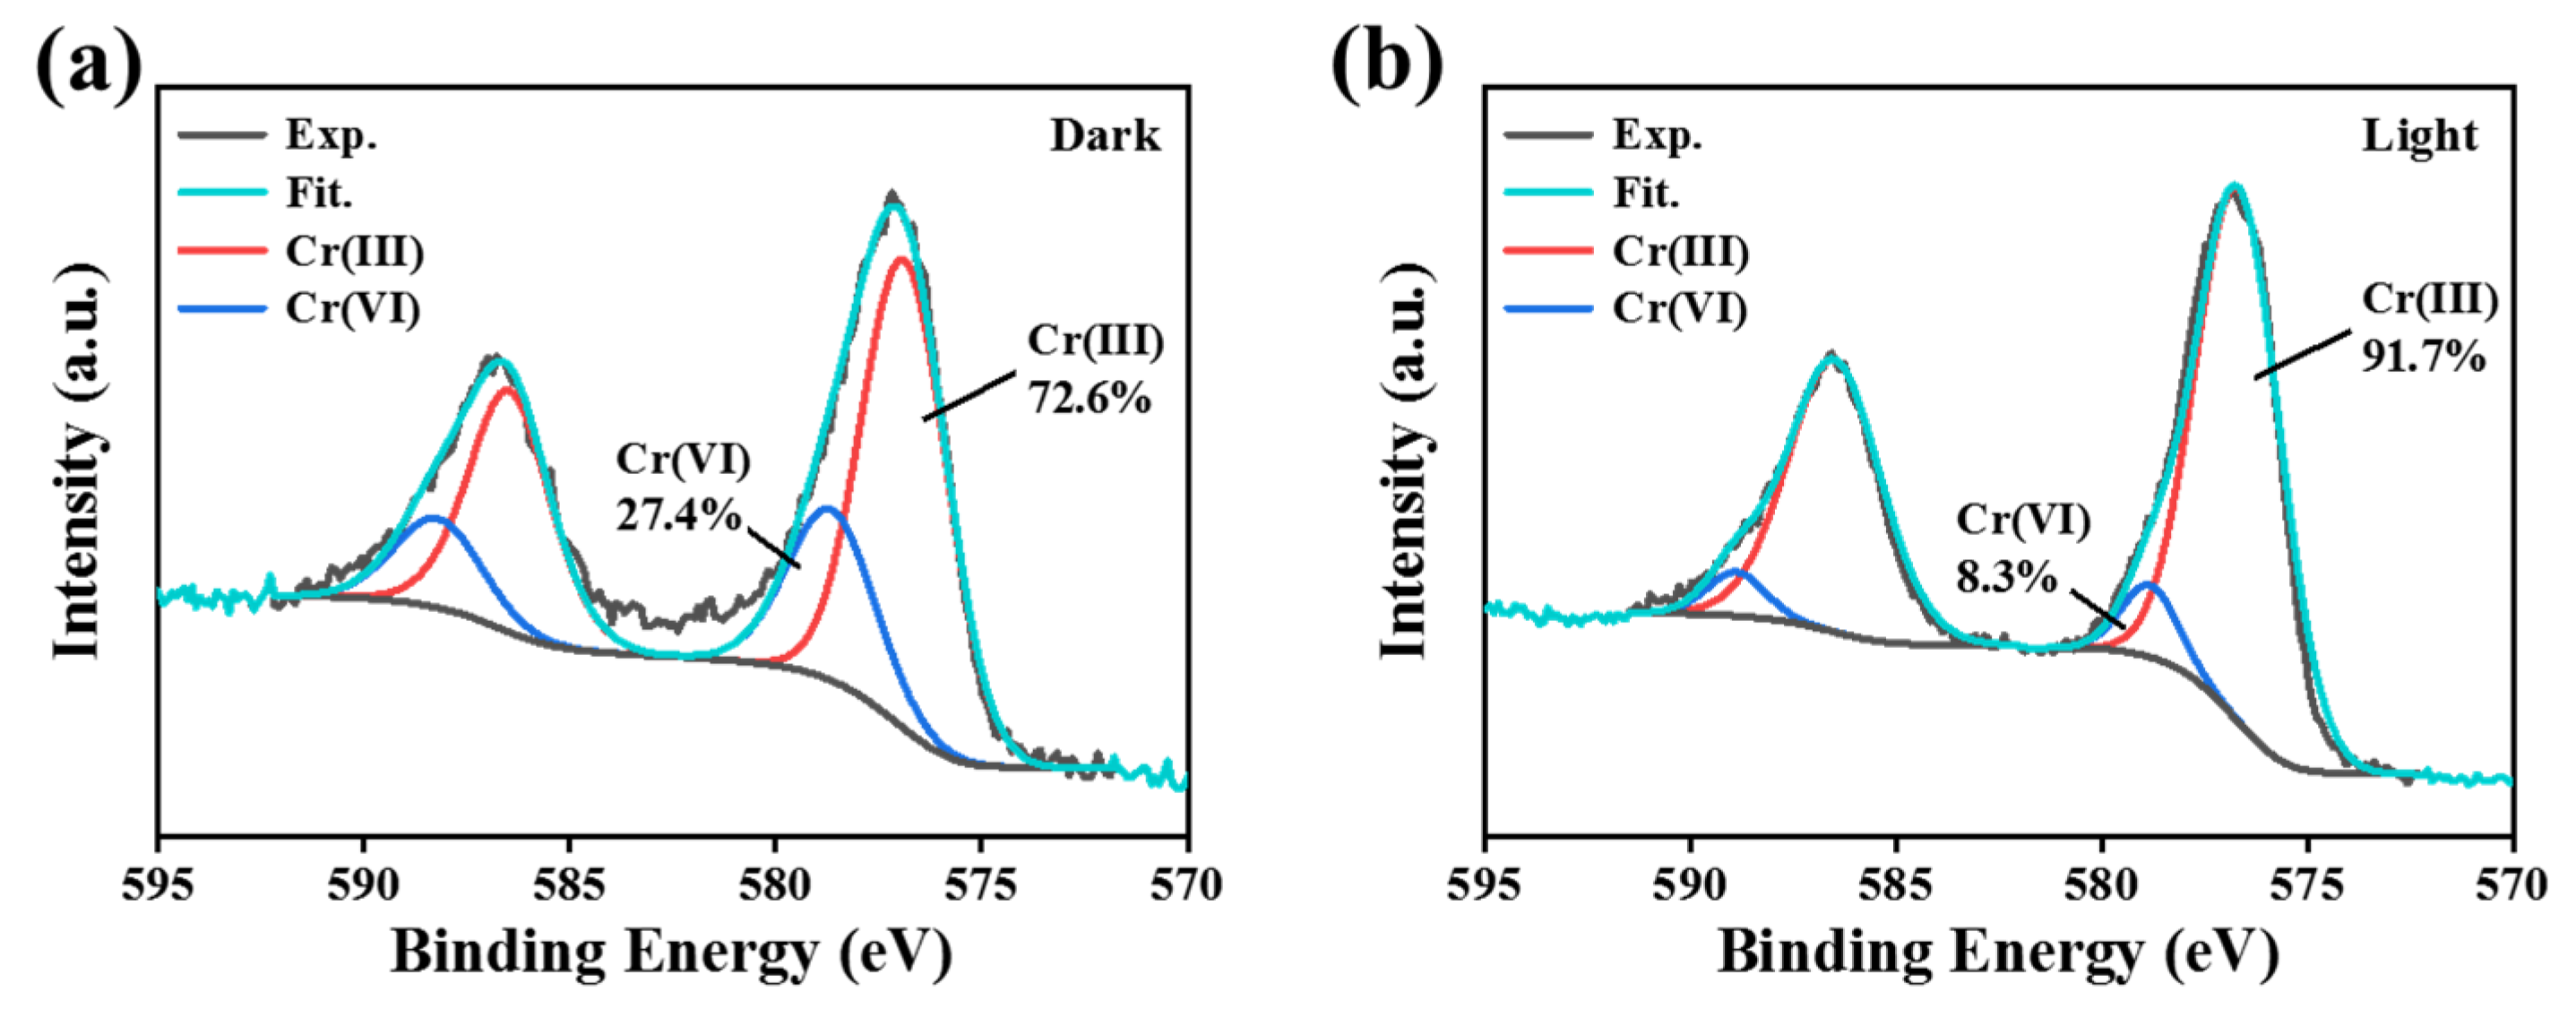
To further elucidate the synergistic mechanism of adsorption and photocatalysis, X-ray photoelectron spectroscopy (XPS) was employed to analyze the CPS 350 sample after reaction. The Cr 2p spectra revealed the coexistence of Cr(VI) and Cr(III) under both dark (
Figure 6a) and light irradiation (
Figure 6b) conditions. Under the dark condition, the adsorbed Cr(III) accounted for 72.6%, while the remaining Cr(VI) constituted 27.4%. Upon light irradiation, the proportion of Cr(III) increased significantly to 91.7%, which was a 19.1% enhancement compared to the dark condition, while the Cr(VI) content decreased to 8.3%. These results confirmed that the removal of Cr(VI) by CPS 350 involves a synergistic process combining adsorption and photoreduction, operative in both dark and illuminated environments. Specifically, under the dark condition, Cr(VI) primarily exists as Cr
2O
72− or HCrO
4−. The surface of CPS 350 becomes protonated and positively charged, facilitating the adsorption of Cr(VI) anions via electrostatic attraction. Meanwhile, reductive functional groups (e.g., phenolic, carboxylic, or amine groups) present on the carbon-based material facilitate the chemical reduction of Cr(VI) to Cr(III) even without light. The resulting Cr(III) is subsequently stabilized via complexation with these functional groups on the material surface. Thus, Cr(VI) removal under the dark condition is achieved not only through physical and chemical adsorption but also via surface-mediated chemical reduction. Under the light condition, electron-rich groups (mainly oxygen-containing functional groups) on the material’s surface absorb photons and generate electron–hole pairs. The photogenerated electrons are transferred to more electronegative nitrogen functional groups, directly reducing Cr(VI) to Cr(III). These Cr(III) ions are finally adsorbed on the surface of CPS 350 through complexation. Notably, protons (H
+) may serve as homogeneous catalysts in both dark and light conditions, further facilitating the reduction reaction.
Cr(VI) exists in different forms at different pH. Under acidic conditions (pH < 6.5), the main form is Cr
2O
72− or HCrO
4−. Under neutral and alkaline conditions (pH ≥ 6.5), the main form is CrO
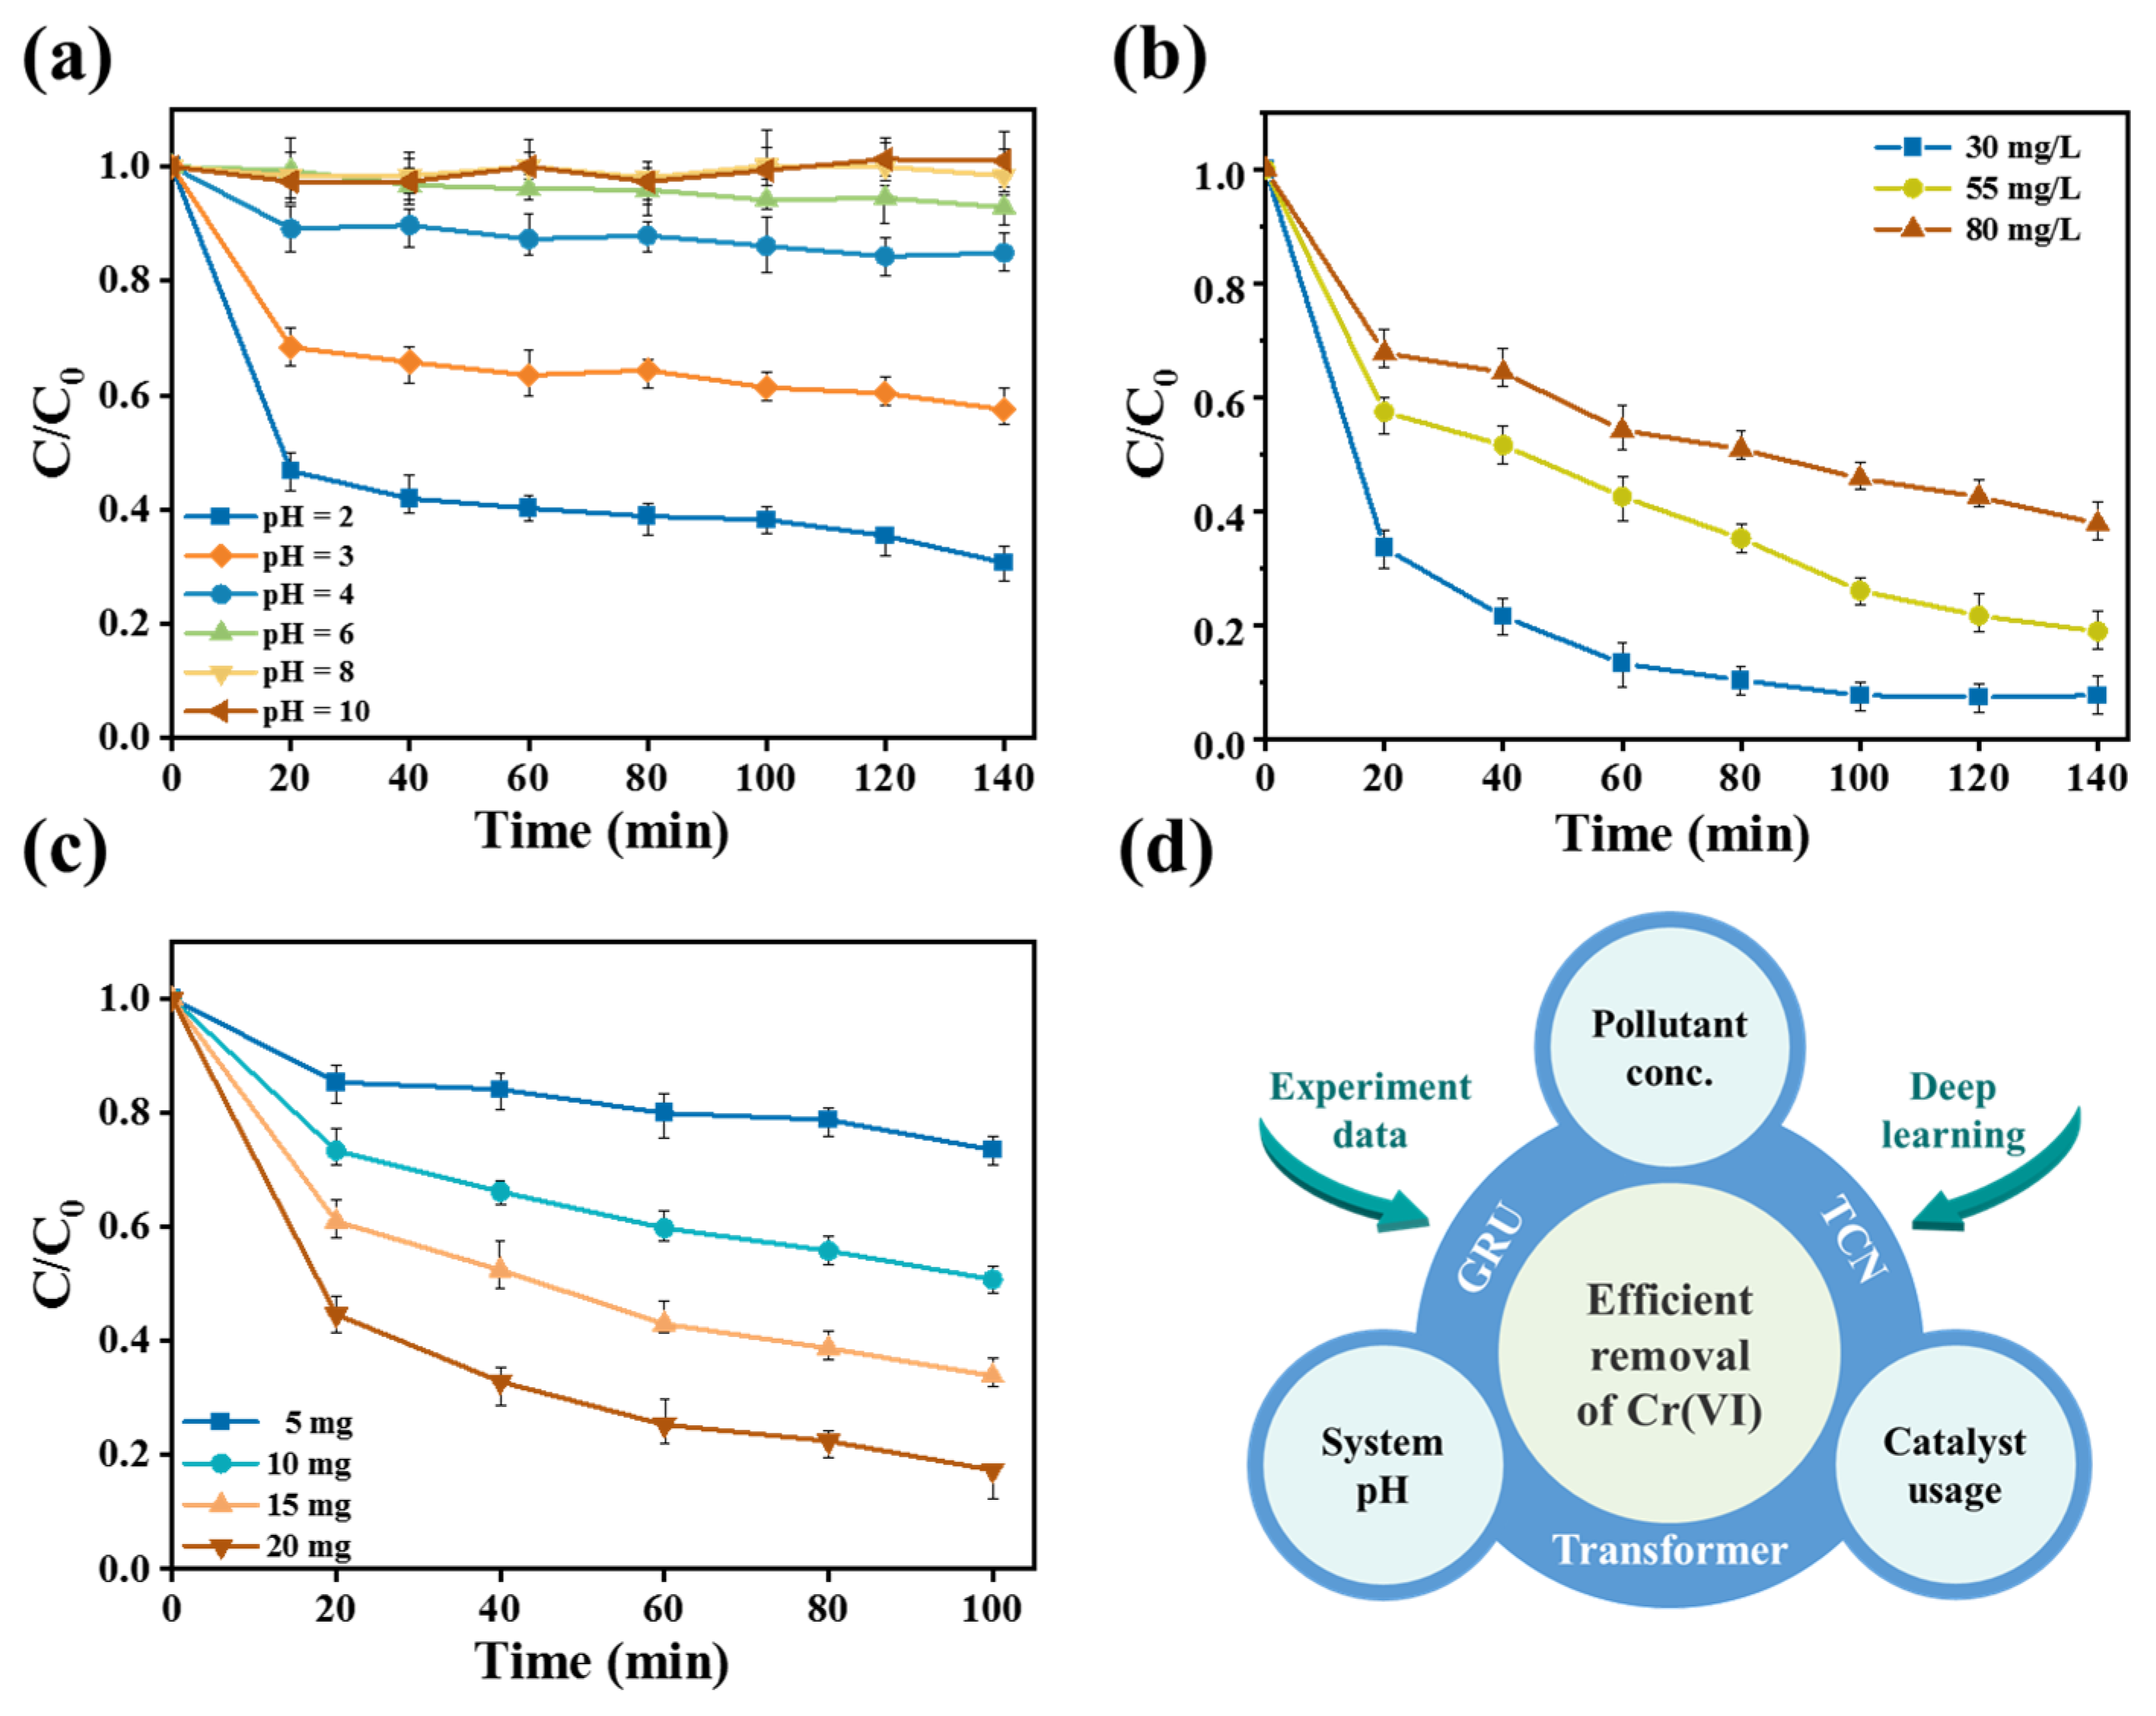
42−. In consequence, pH played a key role in the removal of Cr(VI) by CPS 350. The effect of pH on the Cr(VI) removal performance of CPS 350 material is shown in
Figure 7a. CPS 350 exhibited the best performance at pH = 2.0. This was mainly attributed to the abundance of H
+ in the acidic solution. Once the material surface combined with H
+, protonation occurred and caused the adsorbent surface to carry positive charges, which were conducive to the adsorption of Cr(VI) through electrostatic attraction [
37]. As the pH increased, the removal efficiency of Cr(VI) by CPS 350 material gradually decreased. When the pH value was 10.0, the CPS 350 material was almost inactive.
Figure 7b indicates the removal efficiency of Cr(VI) at different initial concentrations. At 140 min, when the Cr(VI) concentration in the water body was 30 mg/L and 55 mg/L, CPS 350 achieved an extremely high removal effect, removing almost all of it. When the concentration was 80 mg/L, the removal efficiency was slightly lower than for the former ones but still remained at a relatively high level. Meanwhile,
Figures S2 and S3 present the adsorption kinetic fitting curves of CPS 350. To better understand the adsorption mechanism and rate-controlling steps, pseudo-first-order and pseudo-second-order kinetic models were applied to analyze the adsorption behavior of CPS 350 toward Cr(VI). The kinetic curves were fitted under different initial pollutant concentrations (C
0 = 30 mg/L, 55 mg/L, and 80 mg/L), and the fitting results are summarized in
Tables S2–S4. For Cr(VI), the correlation coefficients of the pseudo-second-order model under all tested C
0 conditions were higher than those of the pseudo-first-order model. These results indicated that the adsorption of Cr(VI) onto CPS 350 is dominated by chemical adsorption, which may be attributed to the complexation between nitrogen-containing functional groups on the CPS 350 surface and Cr(VI), leading to the formation of corresponding chemical bonds.
Figure 7c elucidates the effect of CPS 350 usage on the removal efficiency of Cr(VI). At a usage of 20 mg, the CPS 350 material was capable of removing around 80.0% of Cr(VI) after 100 min. These findings collectively indicated that CPS 350 exhibited exceptional activity in the removal of Cr(VI). Based on the above experiments, the Cr(VI) removal performance of Cr(VI) under different conditions was used as data samples. Then, three different algorithms, GRU, TCN, and Transformer, were applied to conduct deep learning and simulated predictions, as shown in
Figure 7d, in order to find the best prediction algorithm.
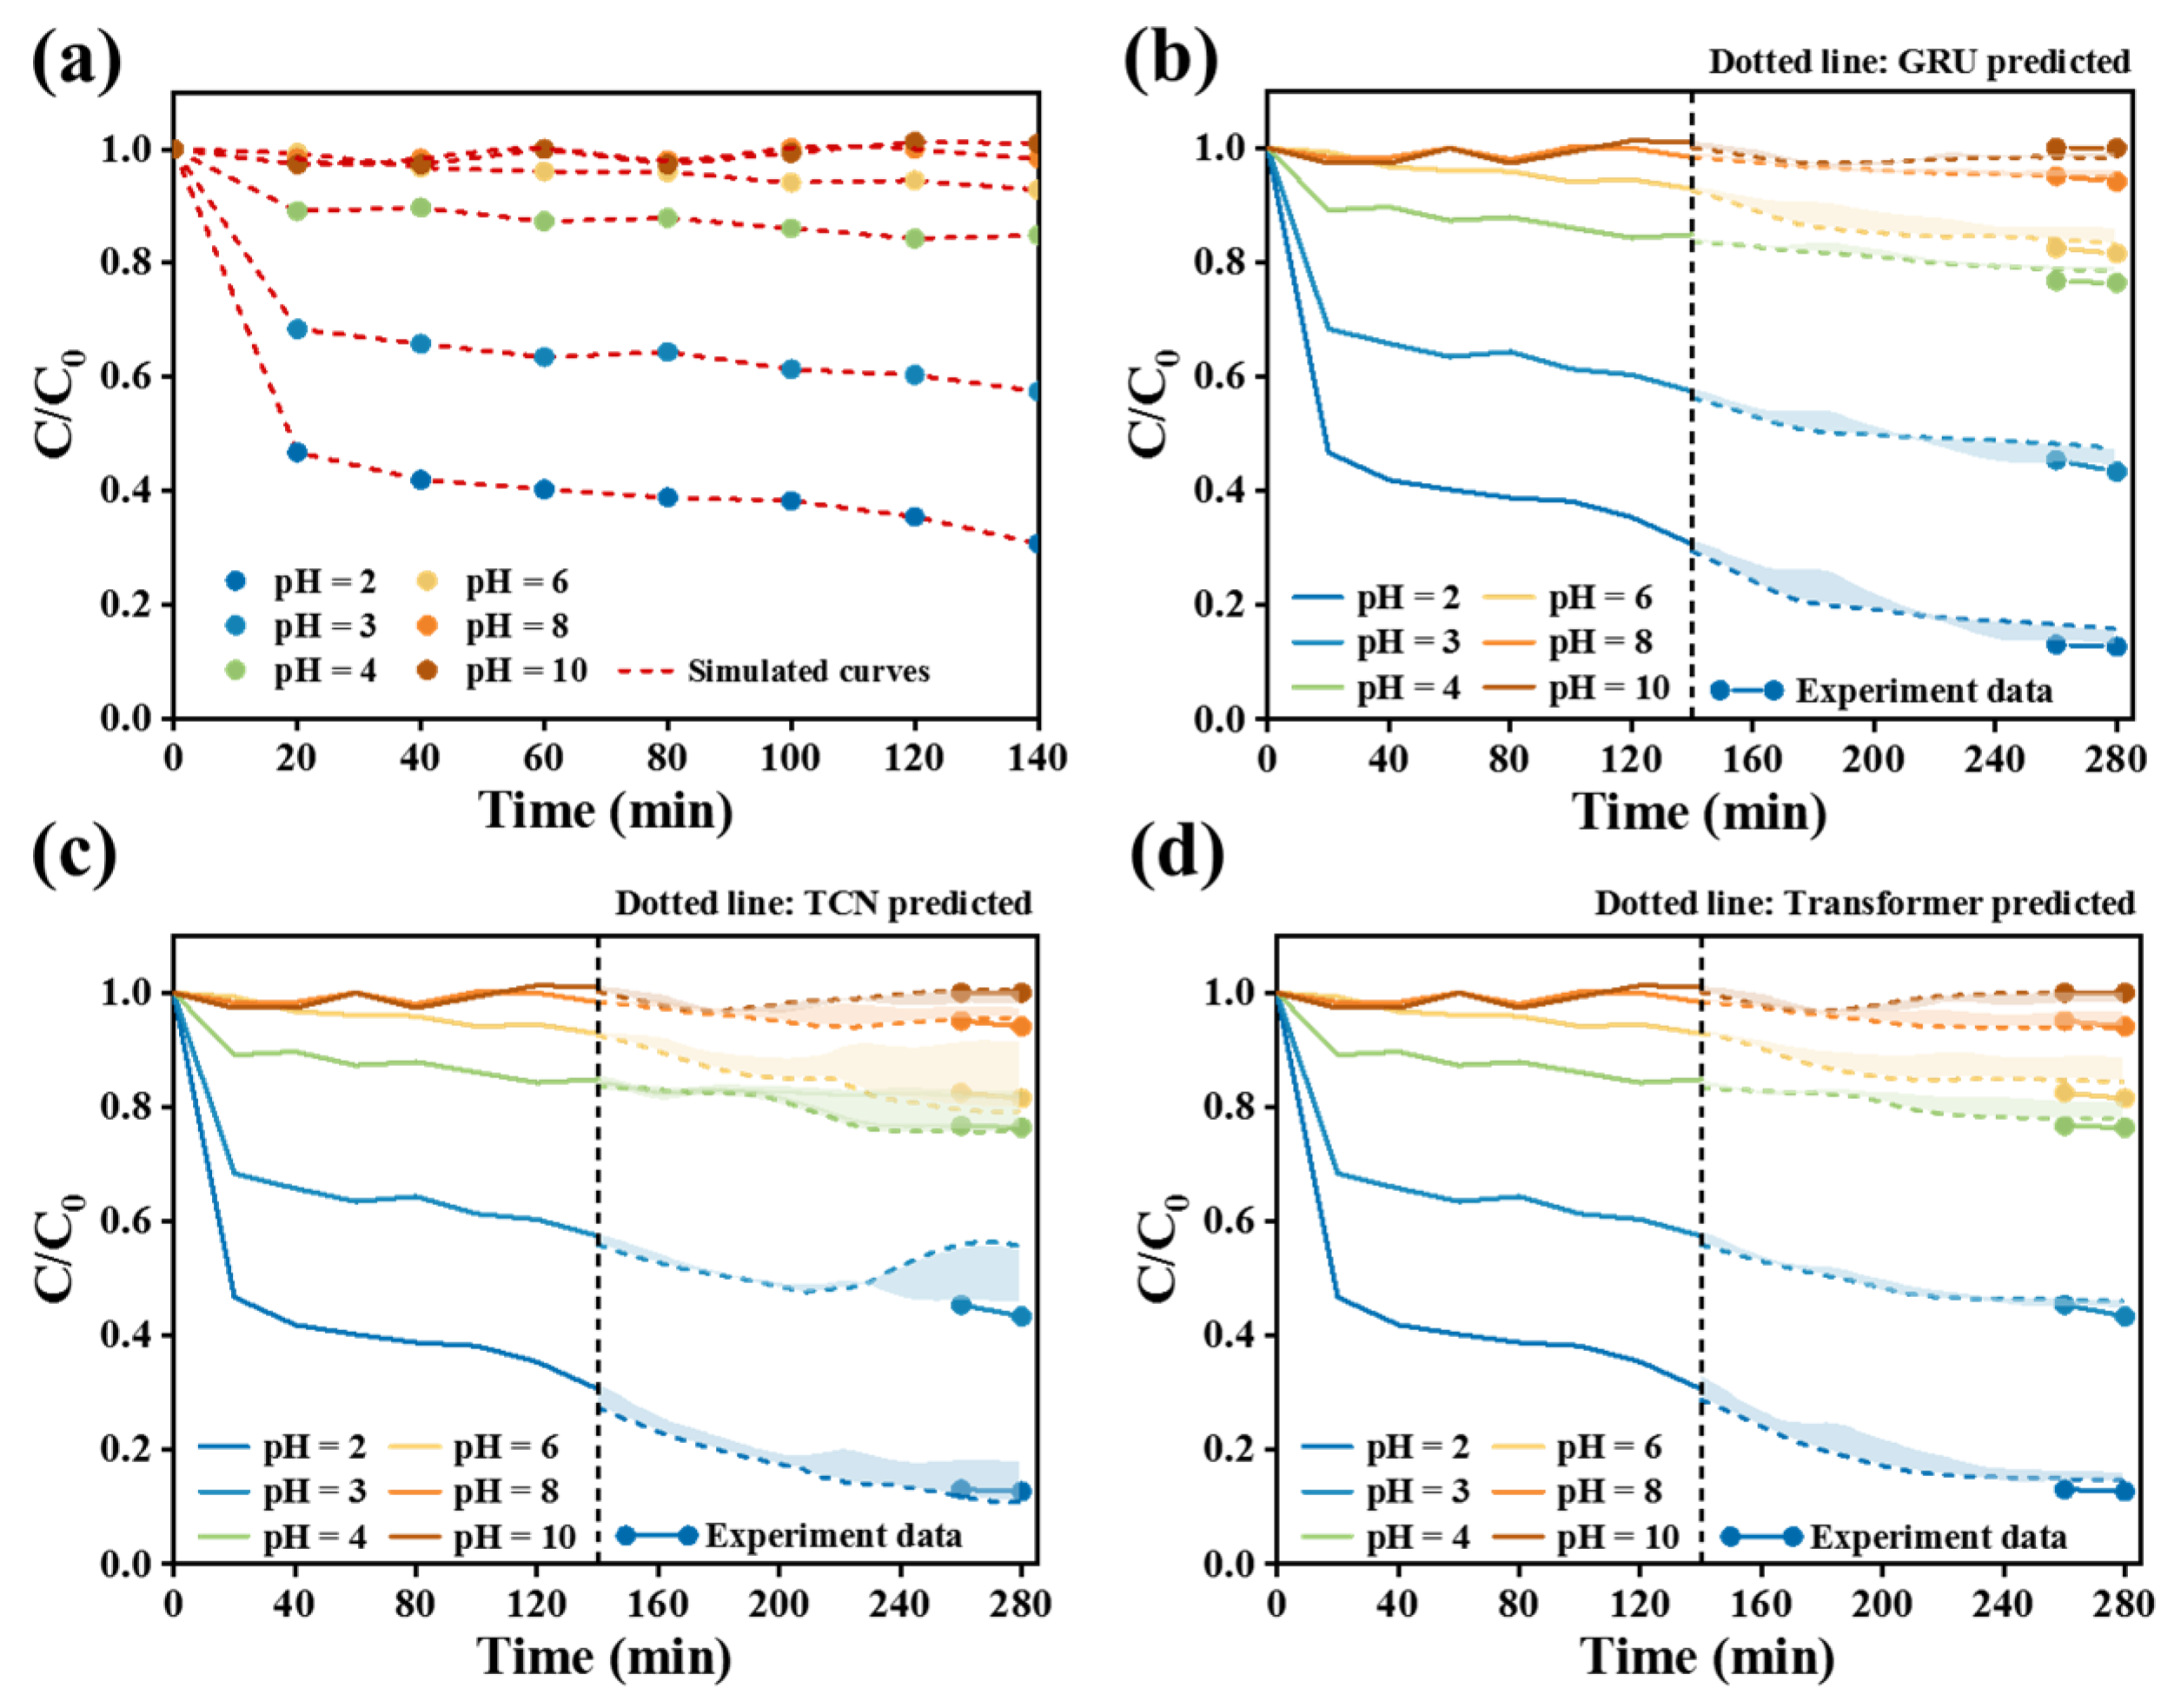
Figure 8 simulates the experiment of pH’s effect on the removal of Cr(VI). For the data pretreatment process, the data points were expanded from 14 original sampling points to 280. Among the three prediction models in
Figure 8b–d, the evaluation indicators of the Transformer model were MAE = 0.0086, R
2 = 0.945, RMSE = 0.0117. In comprehensive comparison of three indicators, the relative error absolute value of GRU (MAE = 0.0224, RMSE = 0.0273) was higher than that of the TCN model (MAE = 0.0131, RMSE = 0.0183), while the R
2 value of GRU (0.853) was lower than that of the TCN model (0.936). These indicated that the Transformer prediction model obviously was the best under the same amount of training data.
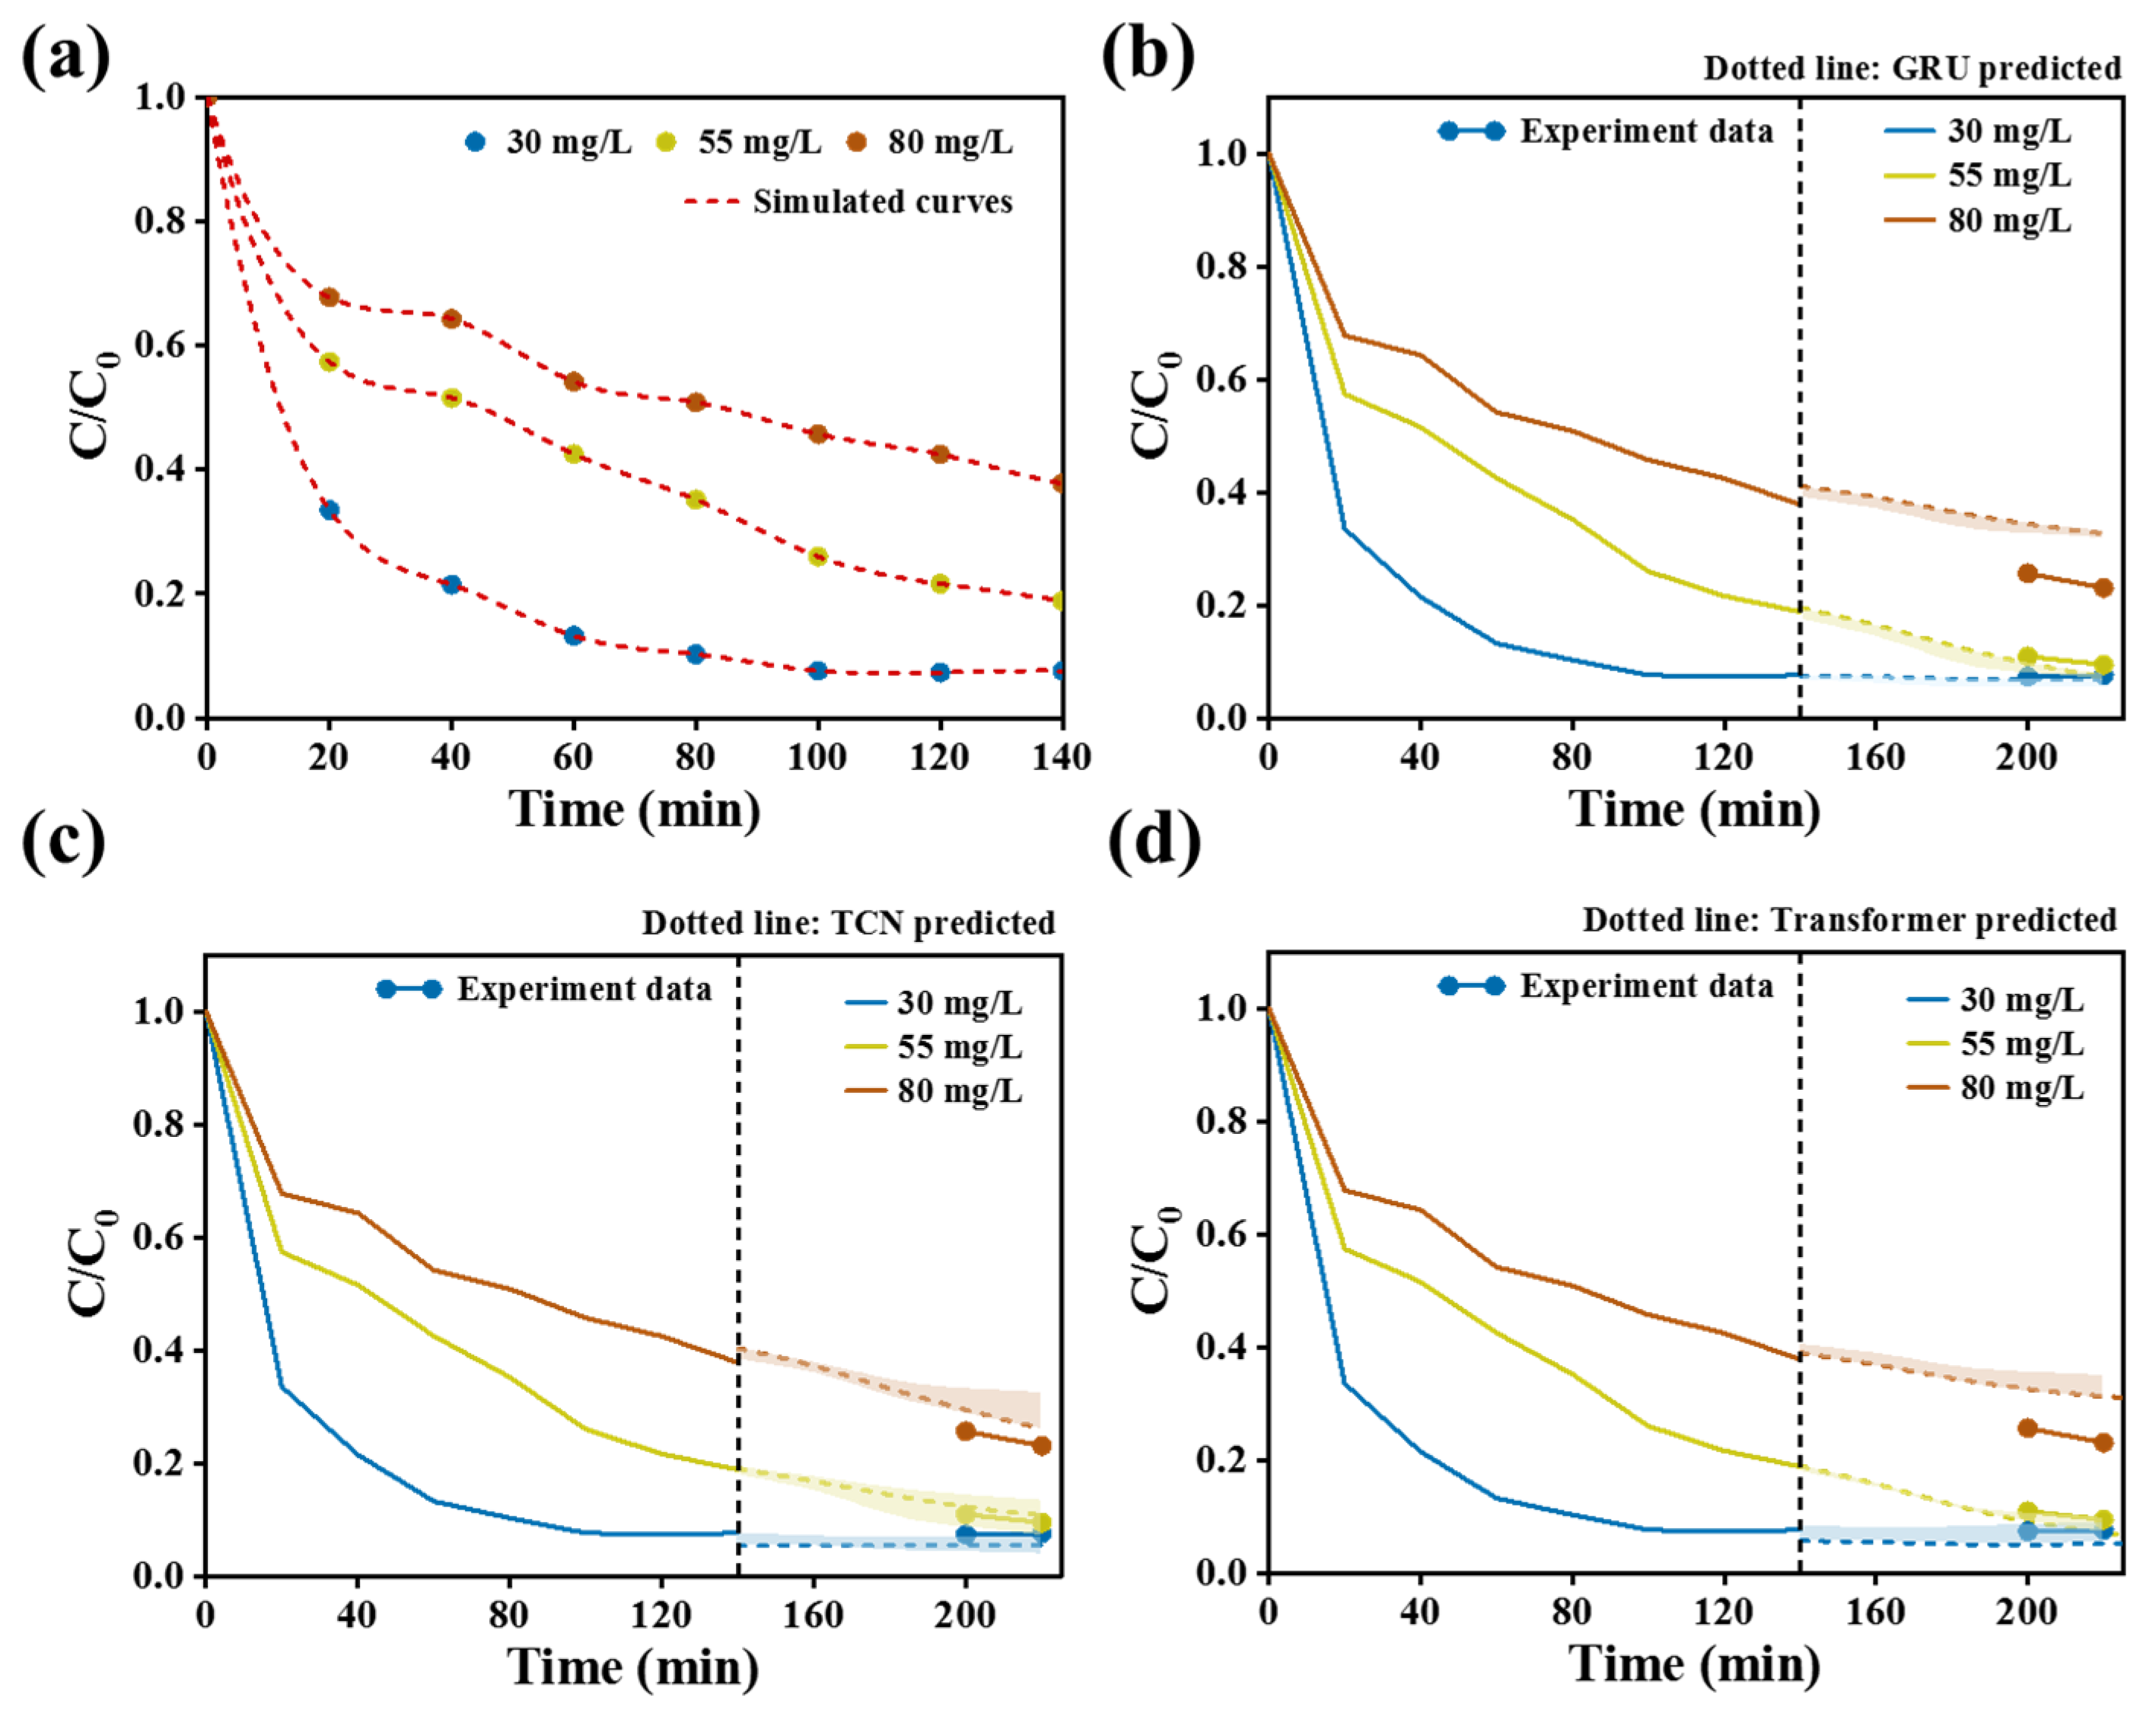
Figure 9 simulates the influence of initial Cr(VI) concentration on the removal of Cr(VI). For the data pretreatment process, the data points were expanded from 12 original sampling points to 240. Among the three prediction models in
Figure 9b–d, the TCN model showed better overall performance, with its mean absolute error (MAE = 0.460) reduced by 74.7% compared with GRU (1.822) and 72.1% compared with Transformer (1.652); the coefficient of determination (R
2 = 0.987) increased by 29.0% compared with GRU (0.765) and 21.5% compared with Transformer (0.812); the root mean square error (RMSE = 0.505) decreased by 53.2% compared with GRU (1.079) and 59.5% compared with Transformer (1.246). Overall, TCN presented a relatively comprehensive advantage in prediction accuracy and goodness of fit, while GRU and Transformer displayed complementary characteristics in different indicators. Comprehensive evaluation clearly demonstrated a relatively stable performance of TCN under the current experimental conditions.
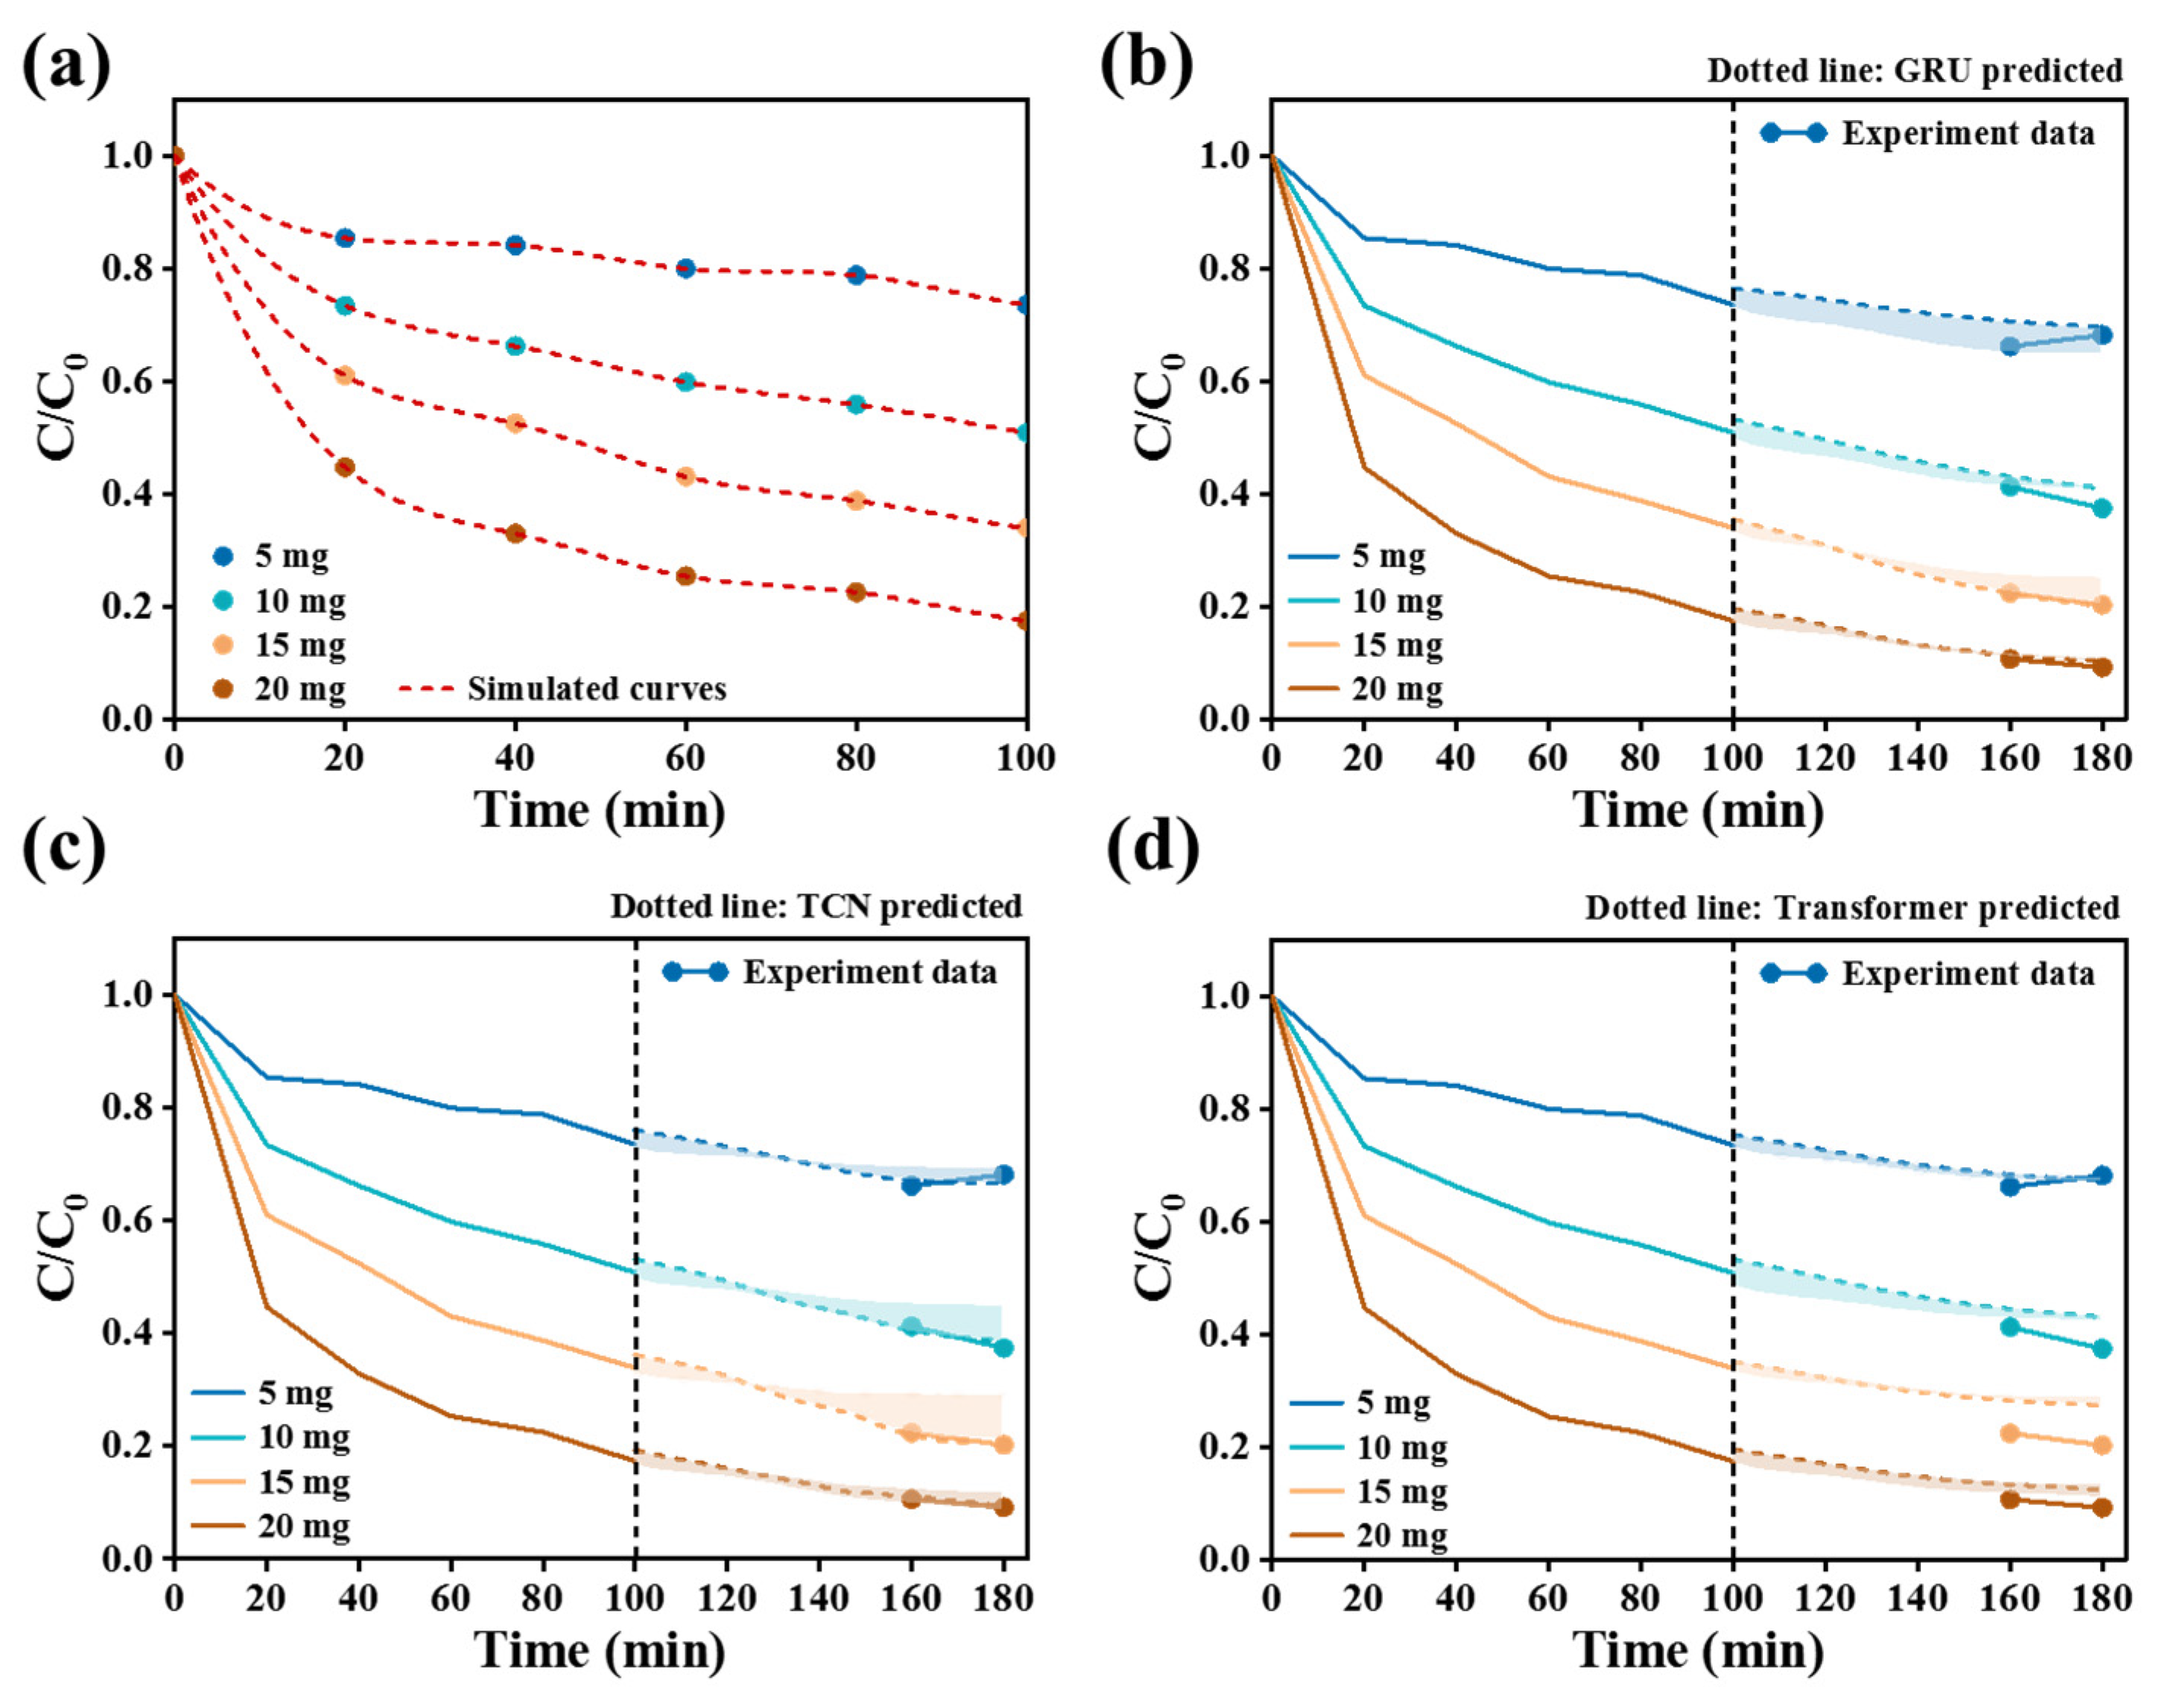
Figure 10 studies the effect of CPS catalyst amount on the removal of Cr(VI). For the data pretreatment process, the data points were expanded from 10 original sampling points to 200. Among the three prediction models in
Figure 10b–d, the TCN model had a relative advantage regarding the CPS catalyst usage effect on Cr(VI) removal data: its MAE (1.424) was 44.2% lower than that of Transformer (2.142), and its RMSE (3.422) was 52.2% lower than that of Transformer (7.160). It is worth noting that Transformer’s R
2 (0.826) was significantly lower than that of GRU (0.976) and TCN (0.990), reflecting its insufficient ability to explain data variability. GRU was relatively robust in terms of R
2 (0.976), but its MAE (2.554) and RMSE (7.502) values were relatively high, suggesting that the prediction accuracy may be limited. Although Transformer was slightly better than GRU in terms of MAE (2.142), its R
2 (0.826) was lower and its RMSE performance was weaker, revealing that the model fitting ability may be insufficient. Therefore, the TCN model showed a more obvious advantage in terms of prediction accuracy and model fit under the experimental conditions related to catalyst usage.
In general, in terms of predicting the removal of Cr(VI), the Transformer algorithm is suitable for predicting the degradation of Cr(VI) in water under different pH conditions, and the TCN algorithm is preferential for the prediction of Cr(VI) removal performance with different initial Cr(IV) concentrations and catalyst masses. The overall performance of GRU is not ideal. This work verifies the accuracy of the deep learning algorithm. In future test environments, algorithm prediction can replace experimental testing, saving time and resources. It also has important significance in the field of intelligent environmental monitoring. However, current remediation strategies cannot achieve complete removal of chromium species, as they primarily reduce toxic Cr(VI) to less harmful Cr(III). To enhance the practical value and sustainability of this technology, it is promising to integrate Cr(VI) reduction with other valuable processes, such as the hydrogen evolution reaction (HER) [
38,
39], thereby improving both economic and environmental outcomes.

