Article

A New Affinity Gel Synthesized for Phenylalanine Ammonia Lyase Isolated from Red Clover (Trifolium pratense L.) Leaf and an Investigation into Its Kinetic Properties †

Department of Chemistry, Yildiz Technical University, 34220 Esenler, Istanbul, Turkey
*
Authors to whom correspondence should be addressed.
This paper is an extended version of the conference paper published in Toksöz, Y.S.; Bilen Ç.; Karakuş, E. Purification of phenylalanine ammonium lyase enzyme from clover leaf and determination of its kinetic properties. In Proceedings of 12th Aegean Analytical Chemistry Days (AACD 2023), Yildiz Technical University, Istanbul, Turkey, 19–22 October 2023.
Separations 2025, 12(9), 241; https://doi.org/10.3390/separations12090241
Submission received: 7 August 2025 / Revised: 30 August 2025 / Accepted: 31 August 2025 / Published: 5 September 2025
(This article belongs to the Section Chromatographic Separations)

Abstract

Phenylalanine ammonia lyase (PAL) was first purified using affinity chromatography from the leaves of red-flowered clover, a highly antioxidant source. The characterization results of the PAL enzyme were determined, including the concentration of its activity buffer solution, pH, and temperature, which were 0.1 M, 7, and 25 °C, respectively. The Vmax and KM values of the enzyme were calculated to be 0.97 EU and 0.68 mM, respectively. L-phenylalanine was used as the substrate. All kinetic studies were performed spectrophotometrically with a wavelength of 283 nm. Sepharose-4B–L-tyrosine–4-aminocinnamic acid (S-4B-TACA) was also synthesized for the first time and used as an affinity gel. The activity of the PAL extract was measured as 267.9 (millienzyme unit) mU per mL. The yield % and purification fold in the purification step of affinity chromatography were determined to be 3.8% and 19.4, respectively. The experimental results indicate that the PAL enzyme was successfully purified using affinity chromatography. The purity of the enzyme was controlled via SDS-PAGE analysis, which indicated that PAL gave a clear, single band at the line of 45 kDa, while the PAL homogenate gave two bands at around 35 and 45 kDa. Enzyme stabilization was also investigated using PAL stored at 4 °C, which retained completely protected activity for the first 3 weeks. The synthesis of the S-4B-TACA affinity gel, the purification of PAL from red clover leaves using affinity chromatography, and its characterization and statistical analysis have not been previously investigated or reported in the literature.

Graphical Abstract

1. Introduction

Clover (Trifolium pratense L.) is one of the most important forage crops in temperate and moisture-rich regions due to its rich isoflavone content [1,2]. Clover is used for the treatment of wounds, especially around the mouth, and febrile diseases due to its antiseptic, analgesic, and tranquilizing properties [3,4]. In particular, red clover plants in various parts of Europe are used in beverages for the treatment of stomach and intestinal disorders [5]. Red clover is also preferred for the treatment of lung, neurological, and even reproductive disorders [6]. Trifolium pratense L. red clover includes the phenylalanine ammonia lyase (PAL) enzyme. It plays an important role in plant growth and develops its antioxidative defense mechanisms by tolerating oxidative stress [7,8,9,10]. In nature, plants are constantly exposed to a large variety of pathogens such as viruses, bacteria, and fungi, which are forms of biotic stress, while environmental factors include light and temperature and are considered abiotic stresses. As a result of these exposures, plant growth is negatively affected. PAL protects the plant against these factors and supports plant resistance [11]. PAL activity in plants also increases as a result of poor nutrition, low temperatures, high-intensity light, and microbial infection. Thus, the enzyme plays a key role in plant stress and defense mechanisms [12,13]. PAL is also included in the phenylpropanoid pathway, where lignin is synthesized. The initial stage of the phenylpropanoid pathway is formed by PAL, which catalyzes the non-oxidative deamination of L-phenylalanine (L-Phe) to form trans-cinnamic acid (t-CA) and ammonia with its highly electrophilic cofactor called 4-methyldiene-imidazol-5-one (MIO) in its catalytic center [14,15,16,17,18,19]. t-CA is also a phenylpropanoid used for the synthesis of thermoplastics, flavoring, cosmetics, and health products [20]. Another major metabolic pathway is the shikimate pathway, along with phenylpropanoid metabolism in plants. It involves the production of flavonoids, phenolic compounds, and antioxidants. The shikimate pathway produces precursors for glucosinolates and the phenylpropanoid pathway. The shikimate and phenylpropanoid pathways are connected to each other via a reaction catalyzed by the PAL enzyme. The PAL reaction is a rate-limiting step in phenylpropanoid biosynthesis [21,22,23,24]. PAL plays a crucial role in medicine due to the use of its product in the biosynthesis of phenolic compounds. In this way, plants gain high antioxidant properties as a result of having a high phenolic content [25]. A significant amount of the carbon assimilated in photosynthesis is used in Phe biosynthesis through the shikimate pathway, which is important for plant development and environmental adaptation [26]. It has been reported that the shikimate pathway and the PAL enzymatic reaction occur in the cytosol of microorganisms [11]. But in plants, the reaction series of the synthesis of aromatic amino acids, along with the shikimate pathway, is mainly localized in plastids [26]. Salicylic acid (SA), used as a signal molecule, is also crucially important for plant systemic tolerance and is synthesized by the catalysis of PAL products [27,28,29]. SA hormone, which protects plants against harmful microorganisms, is of high importance in plant metabolism. PAL takes part in the biosynthesis of SA as well as different phenylpropanoids in plants [18].
Characterization studies were also performed in this research because most industrial enzymes are active and stable under a narrow range of pH, temperature, and solvent concentrations [30,31,32,33]. Therefore, measurements of the maximum PAL activities are crucially important for the detection of optimum reaction conditions. Considering the usage potential of PAL in multidisciplinary fields, significant industrial gains can be provided to the literature by studying the characterization of PAL from red-flowered clover leaf, which is the aim of this study. PAL provides strong stability for the structure of plants due to its involvement in the biosynthesis of lignin, which consists of thirty percent of the dry biomass of plants in most vascular species, and PAL products are used in the treatment of dermatological disorders to block the progression of melanogenesis [26,34].
Enzyme production is a rapidly developing field in biotechnology with an extremely high financial value in the world market [35,36]. So, the purification of enzymes under in vitro conditions and their usage for advanced multidisciplinary studies will reduce costs and make valuable contributions to the country’s economy. PAL was purified from red clover leaves by affinity chromatography in this study. Affinity chromatography is an advanced purification technique that contains an enzyme-specific ligand, which is covalently attached to the stationary phase and is practical in application. The principle of this technique is based on the structural properties of an enzyme, resulting in the achievement of a high degree of purity. Reversible interactions occur between the enzyme and its ligand [37,38]. Advantages and purposes of affinity chromatography in practice include the removal of contaminants in industry, the preparation of samples for mass spectrometry, and the purification of molecules that have functions at low concentrations in organisms [39]. PAL was isolated from different sources by using various methods, such as gas, thin-layer, ion-exchange, and high-performance liquid chromatography, as demonstrated in the literature [40,41,42,43]. But there are no further details about the purification of PAL from red clover leaves by affinity chromatography. In our study, PAL was purified by affinity chromatography using Sepharose-4B-L-tyrosine-4-aminocinnamic acid (S-4B-TACA) affinity gel, which was synthesized for the first time. In light of this information, red clover leaves were used as the source of PAL, and affinity chromatography was used as the advanced purification technique in our research.

2. Materials and Methods

2.1. Chemicals and Instruments

Glycerol, methanol 99%, phosphoric acid 95%, L-tyrosine, L-ascorbic acid, sodium dodecyl sulfate, ammonium persulfate (APS), tetramethyl ethylene diamine (TEMED), glycine, Tris hydroxymethyl aminomethane (Tris BASE), Tris HCI, acrylamide/bis-acrylamide 30%, potassium hydrogen phosphate, and L-phenylalanine were purchased from Sigma-Aldrich (St. Louis, MO, USA). Sodium hydrogen phosphate, sodium bicarbonate, sodium nitrite, 2-mercaptoethanol, Coomassie brillant blue G-250 (CBB G-250), CBB R-250, and polyethylene glycol (PEG) were purchased from Merck (Darmstadt, Germany). Bromophenol blue was purchased from AFG Bioscience (Northbrook, IL, USA). Protein markers ranging from 10 to 260 kDa used in electrophoresis were purchased from Thermo Scientific (Waltham, MA, USA). The clover leaves used as the enzyme source were locally obtained from Istanbul Marmara University (Istanbul, Turkey). The UV-VIS and Fourier transform infrared (FT-IR) spectroscopic analyses were achieved in Shimadzu (Kyoto, Japan), and by using Thermo-Scientific spectrophotometers, (Waltham, MA, USA).

2.2. Methods

2.2.1. Partial Purification of Crude PAL Extract Isolated from Red Clover Leaf (RCL-PAL)

To obtain the crude RCL-PAL extract, 150 g of red clover leaves was homogenized in 0.1 M, 300 mL of potassium hydrogen phosphate buffer (pH: 7.3), including PEG (0.5%, w/v) and 10 mM L-ascorbic acid. The filtered RCL-PAL mixture was centrifuged at 4000 rpm and at 4 °C for 10 min to separate the cell walls of the red clover leaves from the supernatant. This liquid extract was used as the RCL-PAL extract.

2.2.2. Characterization Studies upon RCL-PAL

Characterization studies were performed for the determination of the maximum PAL activity under optimum conditions, such as concentration of the activity buffer, pH, and temperature values. RCL-PAL extract was used for the preparation of the solutions for characterization. Tris-HCl buffer solutions were first used for the detection of the optimum concentration, including 22 mM L-Phe (pH: 8.8) at seven different concentrations ranging from 5 to 300 mM. Following, the optimum pH was determined using nine different pH levels between 5 and 9. pH solutions were prepared in optimum buffer concentration. Lastly, the optimum temperature was examined by taking into account nine different temperature values ranging from 10 to 70 °C, considering the determined optimum concentration and pH. The detected optimum conditions were used for the following enzyme activity measurements and the experimental steps.

2.2.3. Determination of Kinetic Constants of RCL-PAL

The kinetic constants were calculated by using the Lineweaver–Burk method [44] at a wavelength of 283 nm. The activity measurements of the RCL-PAL extract were taken under optimum conditions. The enzyme activity was expressed as the enzyme unit (EU), which corresponded to the t-CA concentration (mM) as a product for RCL-PAL. Different substrate concentrations between 0.1 and 1.0 mM were prepared using the relationship between 1/[L-Phe] 1/[mM] and the enzyme activity 1/V 1/[EU]. The Vmax and KM values were determined from the Lineweaver–Burk graph.

2.2.4. Studies on Affinity Chromatography of RCL-PAL

4-aminocinnamic acid, which has a similar structure to t-CA, was used as the affinity ligand for the affinity chromatography-based purification of RCL-PAL extract. Sepharose-4B-L-tyrosine-4-aminocinnamic acid (S-4B-TACA) affinity gel was synthesized for the first time in this study. Sepharose 4B, L-Tyrosine, and 4-aminocinnamic acid were used as the solid matrix, spacer arm, and the enzyme ligand, respectively.

2.2.5. Synthesis of Affinity Gel for RCL-PAL Separation

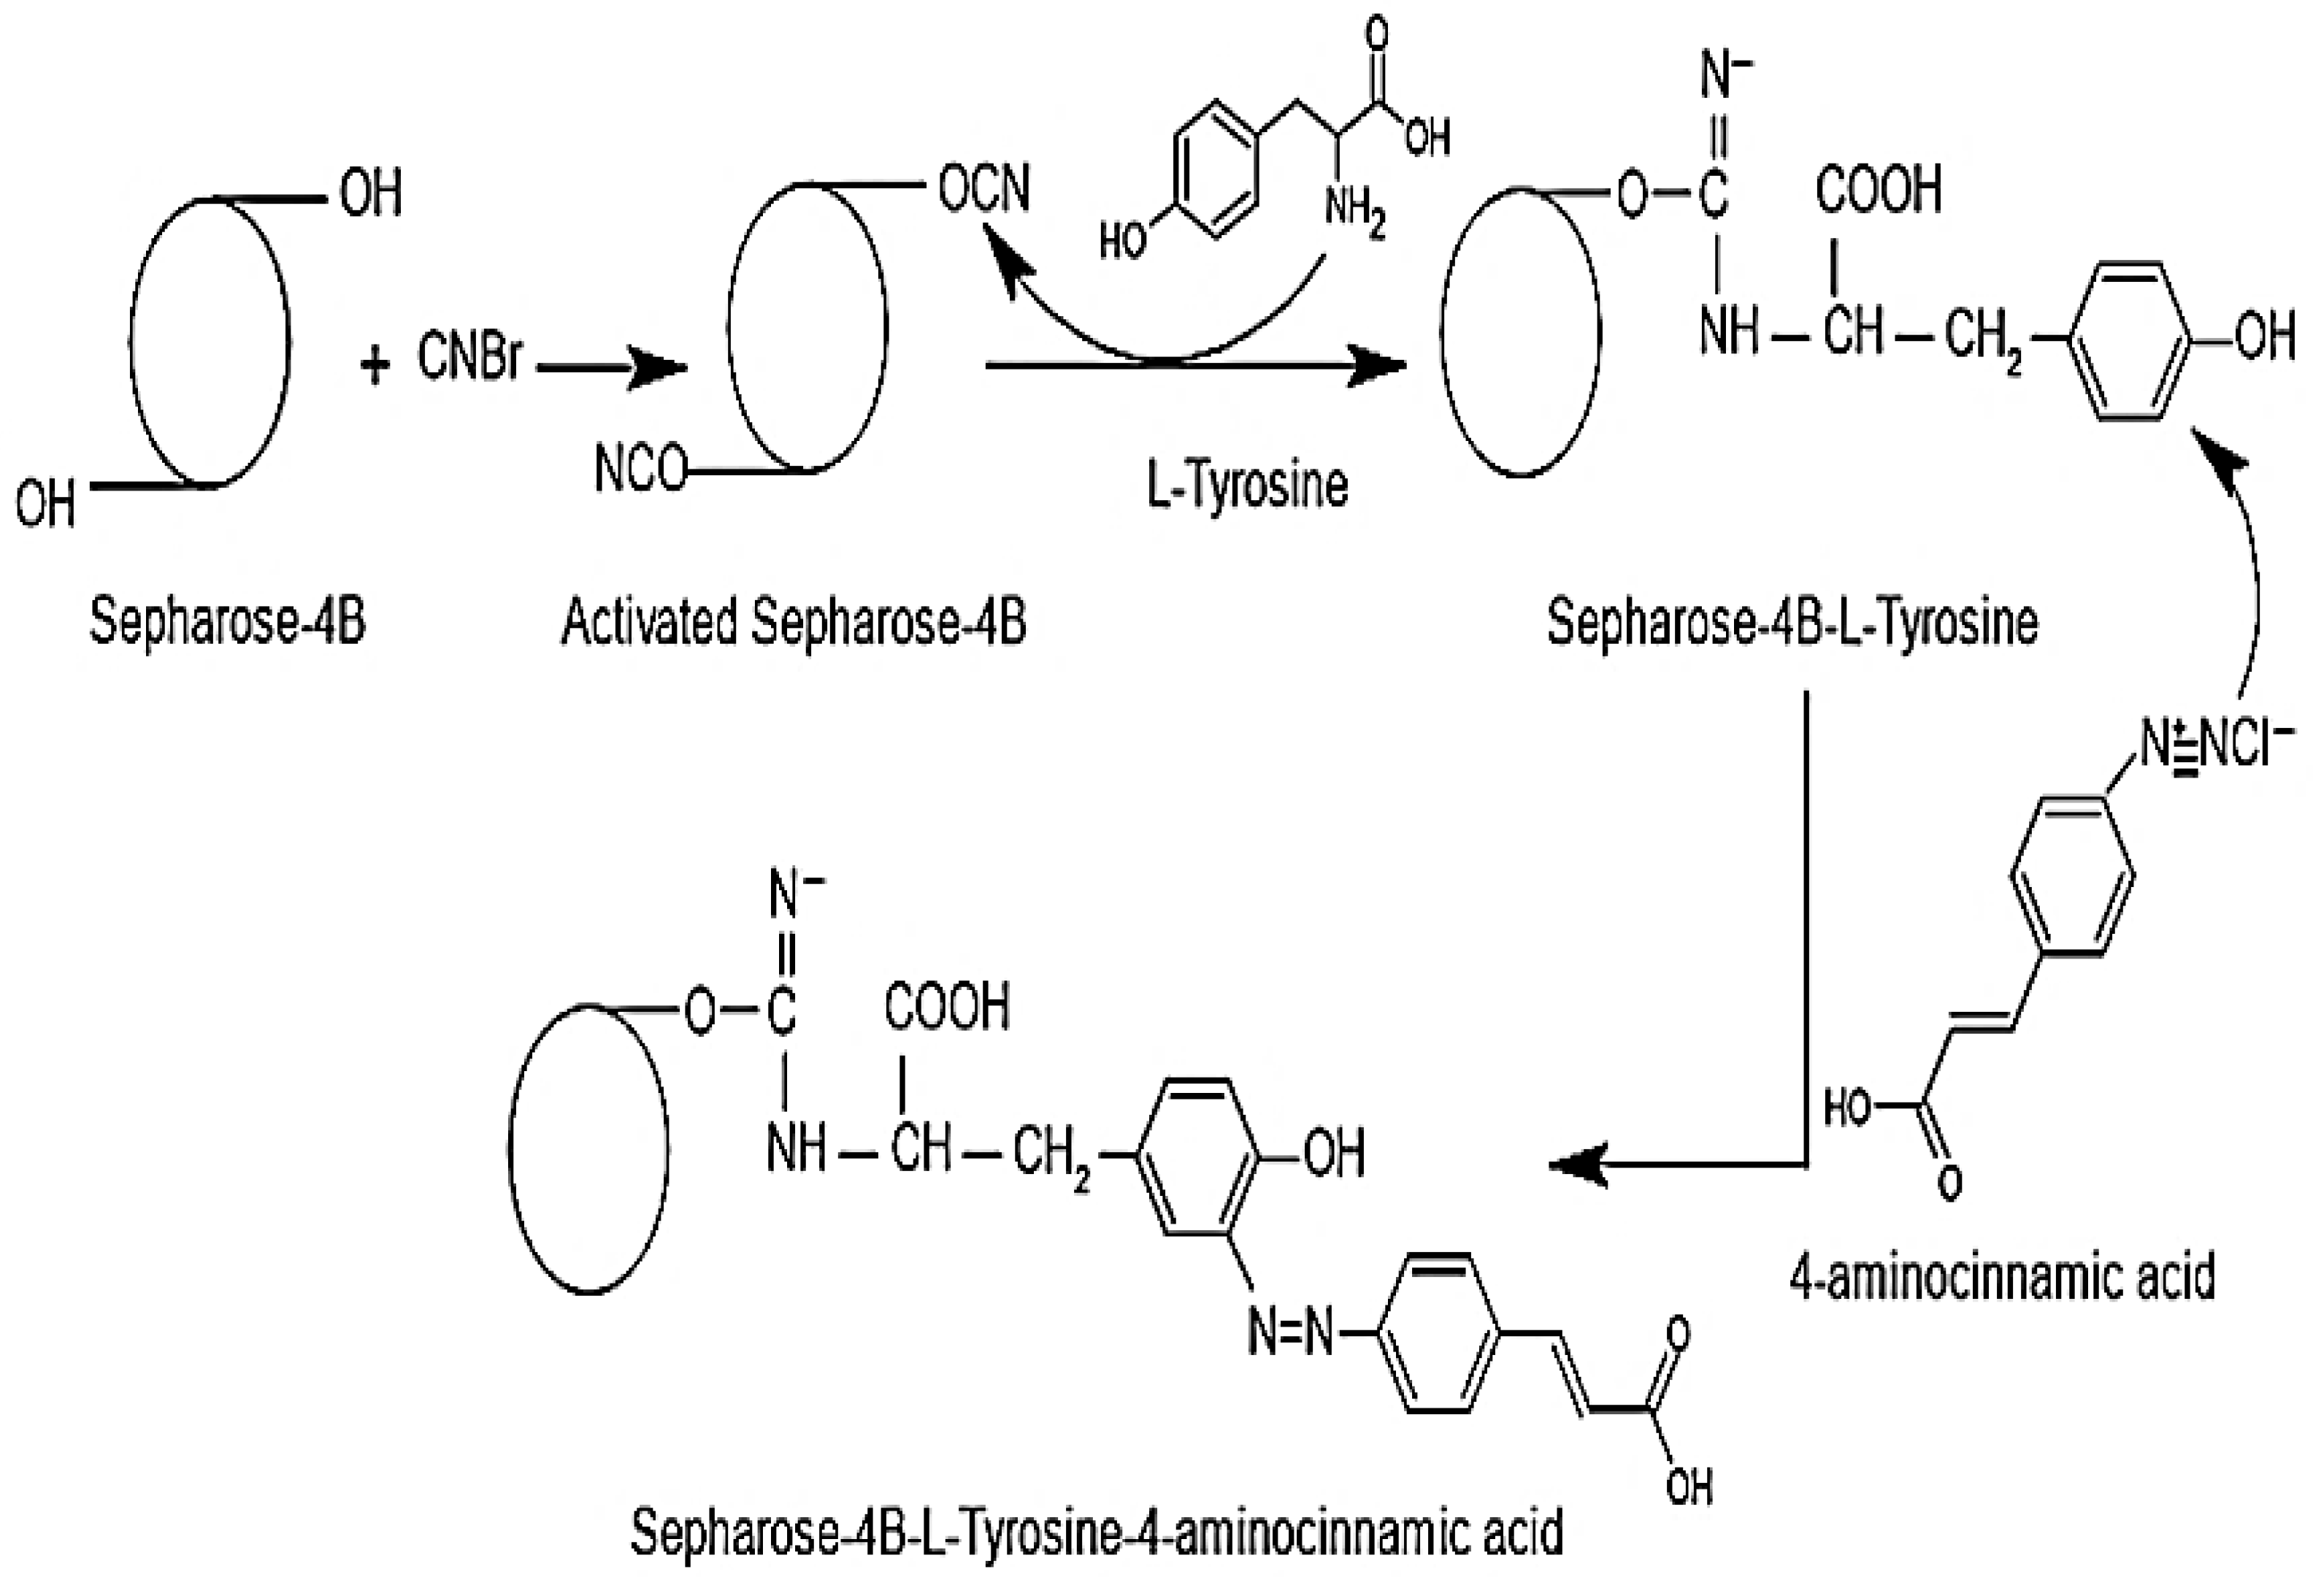
Sepharose 4B heterogen mixture was taken at a volume of 10 mL after shaking sufficiently and diluted two-fold by adding distilled water. The mixture was activated using 4.7 mM cyanogen bromide in a beaker in an ice bath. Since cyanogen bromide acidified the reaction medium, sodium hydroxide was quickly added so that the pH value was measured at around 11 L-Tyrosine, used as the spacer arm, was bound covalently to the solid matrix at high pH levels. CNBr-activated Sepharose 4B was taken to a Buchner funnel and washed with a cold 0.1 M, 250 mL NaHCO3 buffer solution (pH: 10) to remove unbound CNBr. An amount of 4.1 mM L-Tyrosine solution was prepared in 0.1 M, 20 mL sodium bicarbonate (pH: 10) as the spacer arm. This solution was mixed with activated Sepharose 4B at room temperature for 90 min to enable the formation of covalent attachment between the activated matrix and L-Tyrosine. The mixture was stored in a cold environment overnight. Following this, Sepharose-4B-L-Tyrosine was washed with 1 L of cold distilled water in a Buchner funnel, followed by 0.2 M, 100 mL NaHCO3 buffer solution (pH: 8.8). An amount of 25 mg of 4-aminocinnamic acid was dissolved in 10 mL of cold 1 M HCl as the enzyme ligand. An amount of 75 mg of sodium nitrite was added slowly to 5 mL of the cold ligand solution. Following this, the ligand solution, treated with sodium nitrite, was mixed with the gel suspension, and the pH value was adjusted to 9.5. In this way, 4-aminocinnamic acid was immobilized via the diazotization reaction by binding ortho-position to the hydroxyl group of the tyrosine ring used as the spacer arm. This reaction was completed in three hours by stirring at room temperature. Finally, the gel synthesis was completed as seen in Scheme 1.
The affinity gel was washed with 1 L of distilled water and 0.01 M, 200 mL sodium hydrogen phosphate-buffer solution (pH: 6) sequentially to remove the excess unbound ligand molecules. The gel mixture was stored at 4 °C.

2.2.6. FT-IR Analysis of the Original S-4B-TACA Affinity Gel

The results of the FT-IR analysis of the S-4B-TACA affinity gel were recorded in the wave number range of 450–4000 cm−1. The gel was stored in 0.05 M sodium hydrogen phosphate buffer, pH 5, until used.

2.2.7. Purification of RCL-PAL by Using the Affinity Gel

RCL-PAL was purified using S-4B-TACA, a new affinity gel. The affinity gel was packed into the column and washed with sodium hydrogen phosphate (0.05 M; pH: 5) equilibration buffer. The equilibrium step was continued until the absorbance of the solution flowing through the column decreased by about 0.020. The enzyme extract was uploaded to the equilibrated column in a volume of 10 mL. The washing step was applied using the same buffer solution until contaminants were removed from the column. Following this, RCL-PAL was eluted in 2 mL fractions by sodium hydrogen phosphate elution buffer (0.05 M, pH: 7), including 1 M sodium chloride. The gel was finally equilibrated after completion of the elution step. Based on the measurements taken at 280 nm on the UV-visible spectrophotometer, the tubes with high absorbances were used for the protein and PAL activity measurements.

2.2.8. Detection of RCL-PAL Amount

The Bradford method is based on the change in absorbance due to the electrostatic interactions between the enzyme and CBB G-250 dye under acidic conditions. Discoloration from red to blue was followed by photometric quantification at 595 nm [45]. This method is preferable since disruptive factors are eliminated during the reaction. Standard solution series were prepared with the aim of determining the protein amounts of the samples in mg/mL. Bovine serum albumin (BSA) was used as the stock solution at a concentration of 1 mg/mL. A standard linear graph was drawn between the equilibrium BSA concentrations of 0.6 and 19.6 μg/mL against their absorbances. Each standard tube contained 100 μL BSA solution in different concentrations and CBB G-250 dye in a volume of 5 mL. For pre-purified concentrated samples, appropriate dilutions were made, and the protein concentrations were calculated considering the dilution factor.

2.2.9. Activity Studies of RCL-PAL

The activity of the purified RCL-PAL was determined spectrophotometrically using a 0.1 M Tris-HCl activity buffer solution, including 22 mM L-Phe substrate solution, pH 7. Characterization results were taken into account. PAL activities were determined by using the modified method of Khan and Vaidyanathan [46]. The activity buffer solution and the enzyme extract were added at volumes of 2700 μL and 300 μL, respectively. According to the volumes, the reaction equilibrium concentration of L-Phe was recorded as 20 mM. The reaction mixtures were incubated at 25 °C for 1 h. Then, 2 N, 250 μL HCl was added to the reaction tubes to stop the enzymatic reaction. Toluene was added to each tube in a volume of 2 mL for the separation of t-CA from the reaction center to the organic phase. Each tube was violently mixed in a vortex and centrifuged at 4000 rpm for 10 min at 4 °C. The upper phase was collected, and the absorbance was measured at 283 nm against the toluene solution. PAL activity was measured by using absorbances taken at 283 nm. The EU was taken as the mM t-CA concentration from the standard linear graph.

2.2.10. Electrophoresis Studies of RCL-PAL

Sodium dodecyl sulfate polyacrylamide gel electrophoresis (SDS-PAGE) was applied to the PAL extracts and affinity samples for the determination of their molecular weights [47,48]. The purity of the RCL-PAL enzyme was verified by SDS-PAGE. Two glass plates were fixed to each other, and a plastic strip was used on the underside to prevent leakage. A multi-component solution for resolving gel was prepared to be poured between two glass plates. The 12% resolving gel was prepared based on the reagents and concentrations shown in Table 1.
The sample wells inserted into the gel were created by using a comb. Once polymerization was completed, the comb was carefully removed, and the glass plates were placed in the electrophoresis tank. Additionally, 0.02 M Tris BASE, including 0.19 M glycine and 3.5 × 10⁻³ M SDS, pH 8.3, was used as the running buffer in an approximate volume of 300 mL for the electrophoresis tank and gel system. Before loading the enzyme solutions into the wells, the solutions were mixed with a sample buffer, which was prepared by taking into account the chemicals and compositions specified in Table 2.
RCL-PAL extract and eluate were mixed with sample buffer in a 2:1 ratio and incubated for 5 min at 95 °C. Enzyme denaturation occurred due to the treatment of the proteins with SDS in a hot environment. It was accepted that the protein charges were negligible compared to the negative charges of SDS. This allowed the proteins to be separated solely based on their molecular weights. Following this, the samples loaded into the wells were run at 80 and 150 V, respectively. The process was stopped when the gel was approximately 1 cm from completion. The gel was carefully removed from the glass plates and put in 3.0 mM, 264 mL CBB R-250 staining solution, including 120 mL methanol and 24 mL acetic acid, for 7 minutes. The gel was incubated overnight in a destaining solution containing 7.5% acetic acid (v/v) and 5% methanol (v/v). This process allowed the stained protein bands to become visible.

2.2.11. Formation of Purification Table for RCL-PAL

Total volume of enzyme extract, total protein amount, and the enzyme activity values were calculated for both PAL crude extract and the affinity sample. To calculate specific activity, the total enzyme activity was proportioned to the total protein amount for the relevant purification step. The total activity % and yield % of the affinity sample were proportioned according to the first step. The final purification fold was calculated from the rations of specific activity values according to the first step [44].

2.2.12. Detection of RCL-PAL Stabilization

The storage stability of the RCL-PAL extract was investigated under optimum conditions. The enzyme extract was stored at 4 °C during stabilization studies. For this purpose, measurements were performed using L-Phe at an equilibrium concentration of 22 mM. A graph was created by calculating time-dependent activity %, which was based on the measurements taken at 3 months.

2.2.13. Statistical Analysis of RCL-PAL Stability

In order to perform a statistical analysis of the RCL-PAL extract, the activities of the enzyme measured at different times were used. RCL-PAL was stored at 4 °C for 3 months. Enzyme activity was measured under optimum RCL-PAL reaction conditions every week. In this way, a time-dependent enzyme stabilization study and statistical analysis were performed. For this purpose, the Microsoft Office Excel program was used. A statistical one-way analysis of variance (ANOVA) was applied to investigate whether there was a statistically significant difference between averages of the enzyme activities measured every week. This significant difference was compared with the significance level of α = 0.05 at a 95% confidence level [49].
For statistical analysis, two different hypotheses were established as H0 and H1. H0 states that there is no statistically significant difference between the average RCL-PAL activities measured each week. On the contrary, H1 is based on the observation of a statistically significant difference between the average values measured each week. The valid hypothesis was determined by looking at the p (significance) value. The p value was automatically calculated from the ratio between the average variance values of different weeks and the average variance values of the measurements from each week. This measured ratio is called the Fcalculated value, which was automatically calculated by taking into account the experimental RCL-PAL activity results in Excel. This experimental value was compared with a theoretical value called Fcritical, which was found according to α = 0.05 for this study. In cases where the Fcalculated value is smaller than the Fcritical value, the p value is greater than α = 0.05. In this case, H0 is accepted. Therefore, it is assumed that there is no statistically significant difference between the average RCL-PAL activities measured each week. However, if the Fcalculated value is greater than the Fcritical one, the p value is less than α = 0.05. In this case, H1 is accepted, and it is assumed that there is a statistically significant difference between the average RCL-PAL activities measured each week. The one-way ANOVA created two tables automatically. Average activity, variance, and standard deviation (SD) values were included in the first table. These values enabled us to compare the results statistically in the second table, including the Fcalculated, Fcritical and p values.

3. Results and Discussion

3.1. Partial Purification of RCL-PAL

The red clover leaf homogenate prepared at a concentration of 150 g/300 mL was used for the pre-purification step. The supernatant, which was called RCL-PAL extract, was obtained in a volume of 278 mL after centrifugation at 4000 rpm for 10 min at 4 °C. An amount of 2 mL was separated for two purification steps for the measurements of the activity and protein of the enzyme. The measured activity and protein values were used for the formation of the purification table. An amount of 10 mL of RCL-PAL extract was separated for loading onto the affinity column. The remaining extract was used for other kinetic studies and characterization experiments.

3.2. Characterization Studies of RCL-PAL

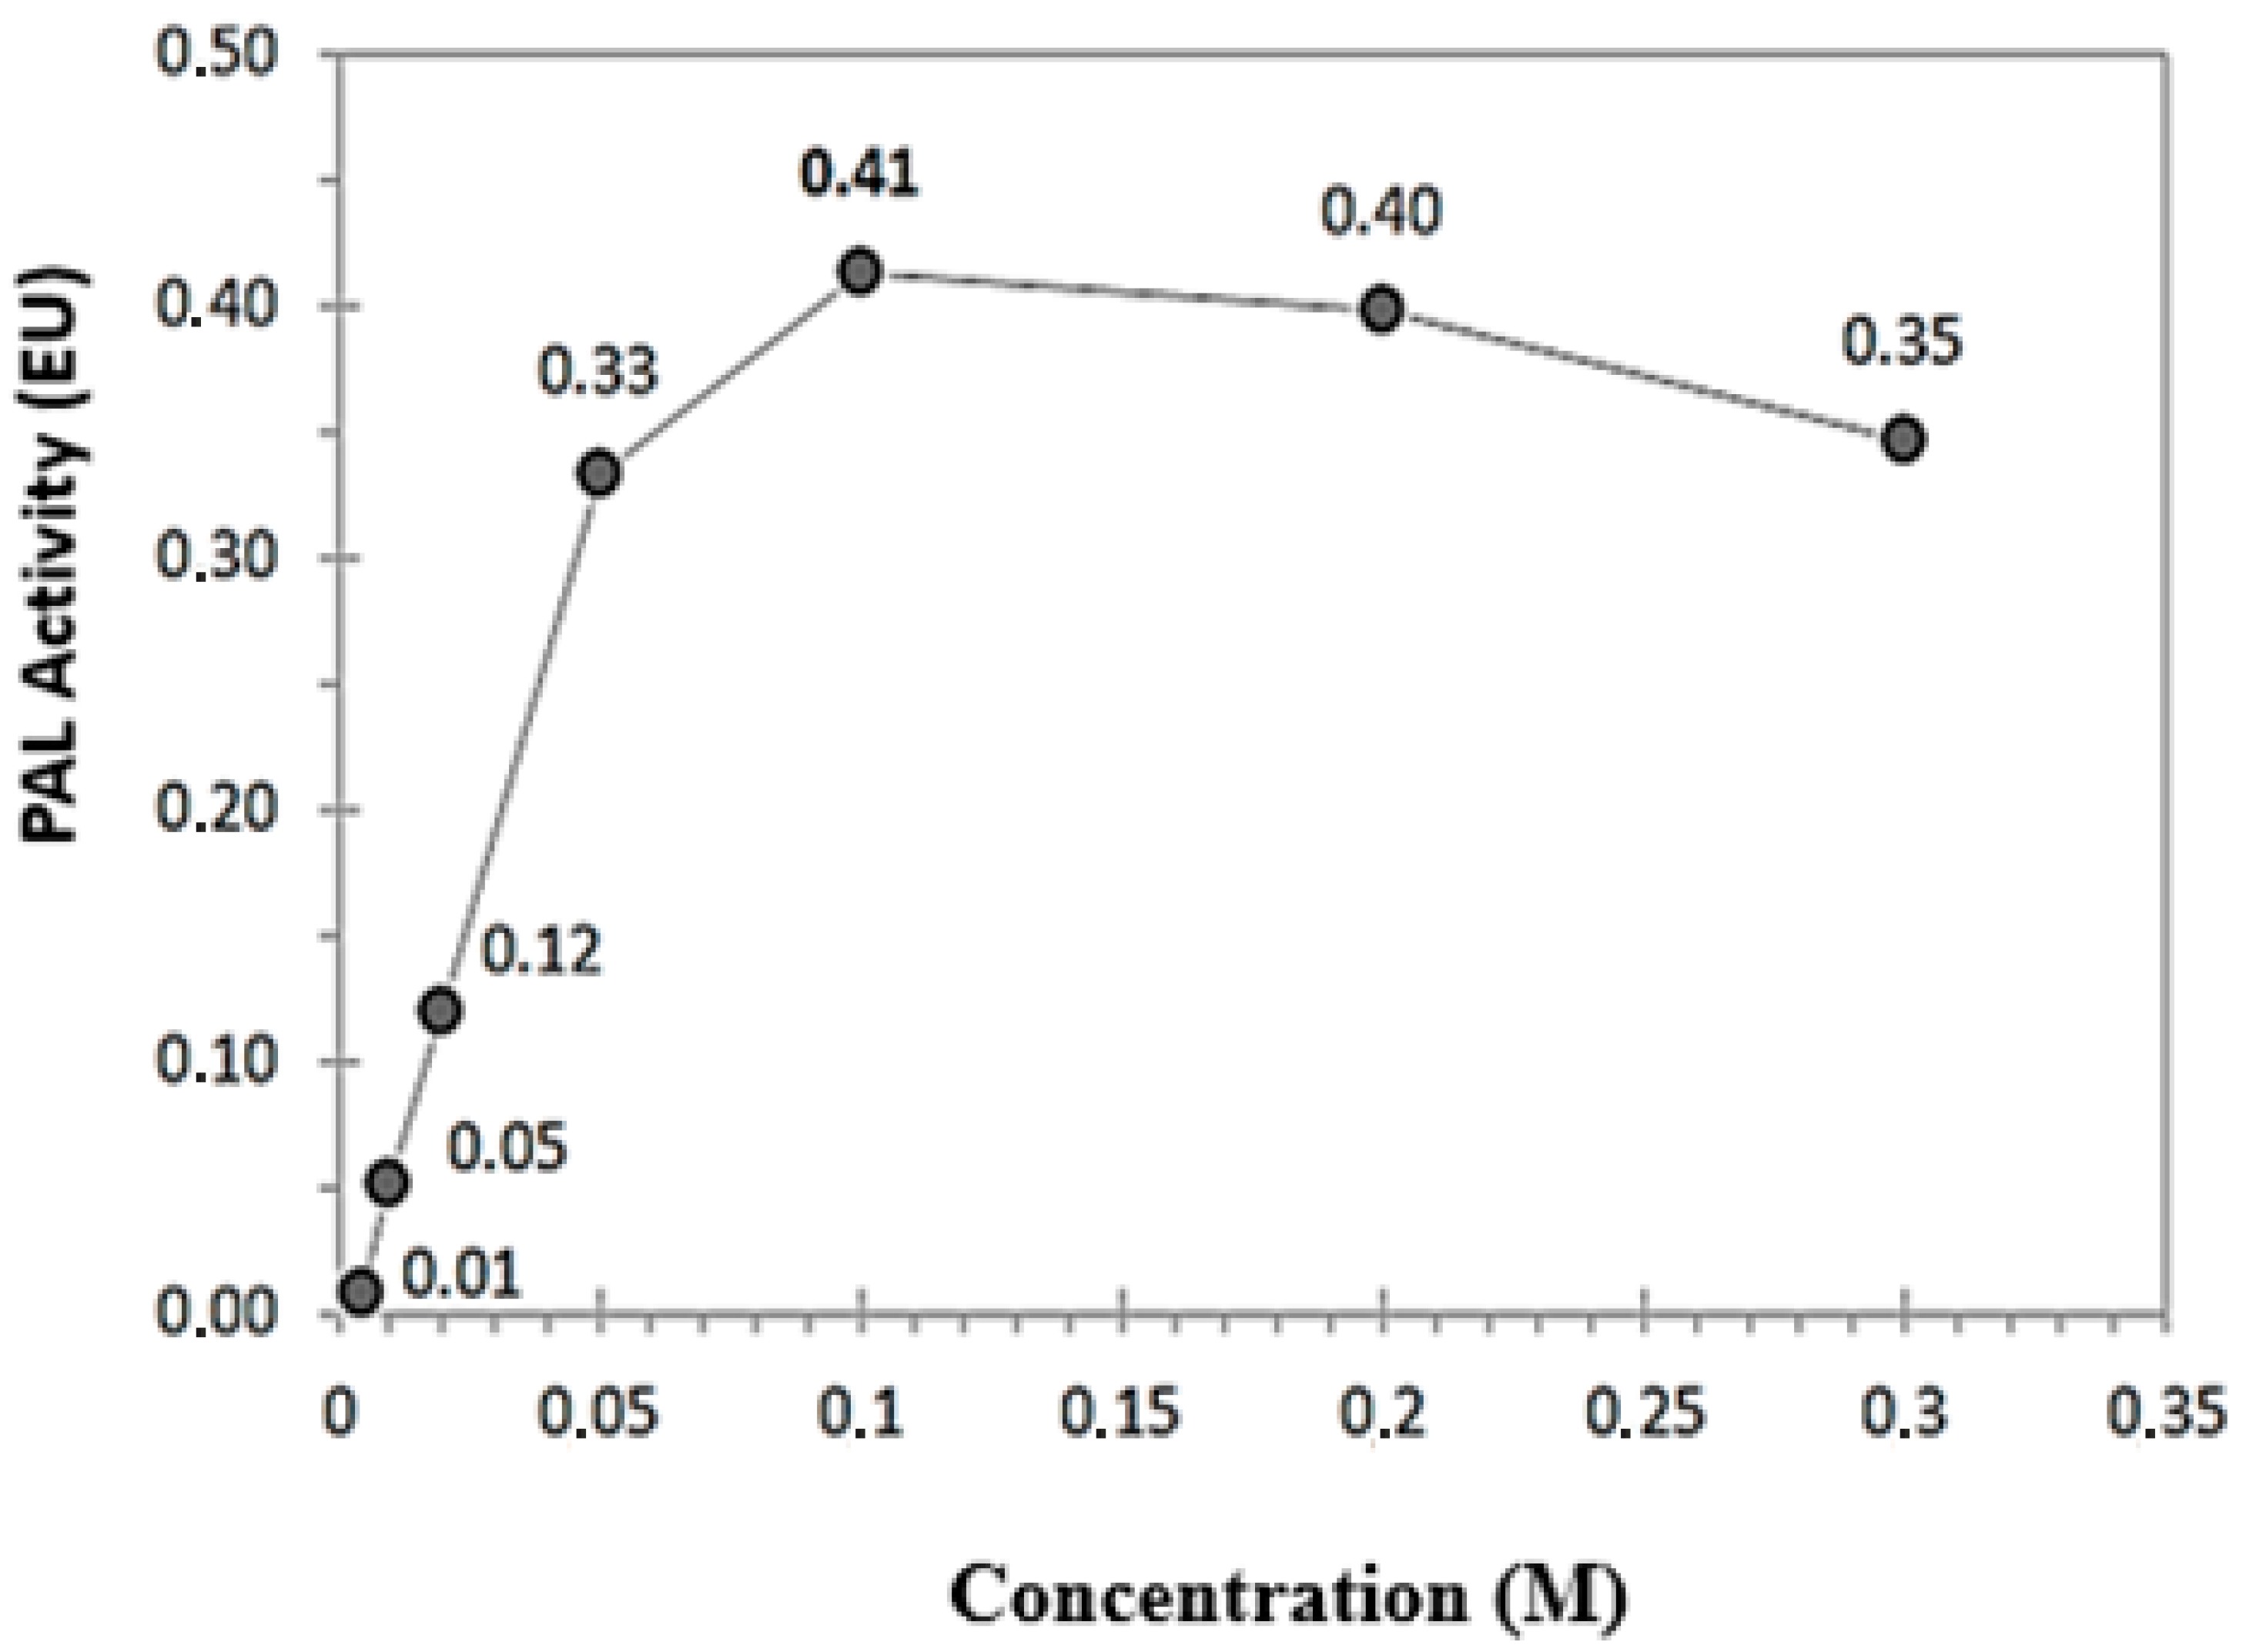
The optimum buffer concentration, pH, and temperature were recorded as the values at which the maximum RCL-PAL activities were measured. The optimum activity concentration was first determined for L-Phe spectrophotometrically (Figure 1).
Figure 1 shows that the maximum RCL-PAL activity was measured as 0.41 EU in a 0.1 M Tris-HCl activity buffer. RCL-PAL activities were measured at nine different pH values using the optimum concentration value (Figure 2).
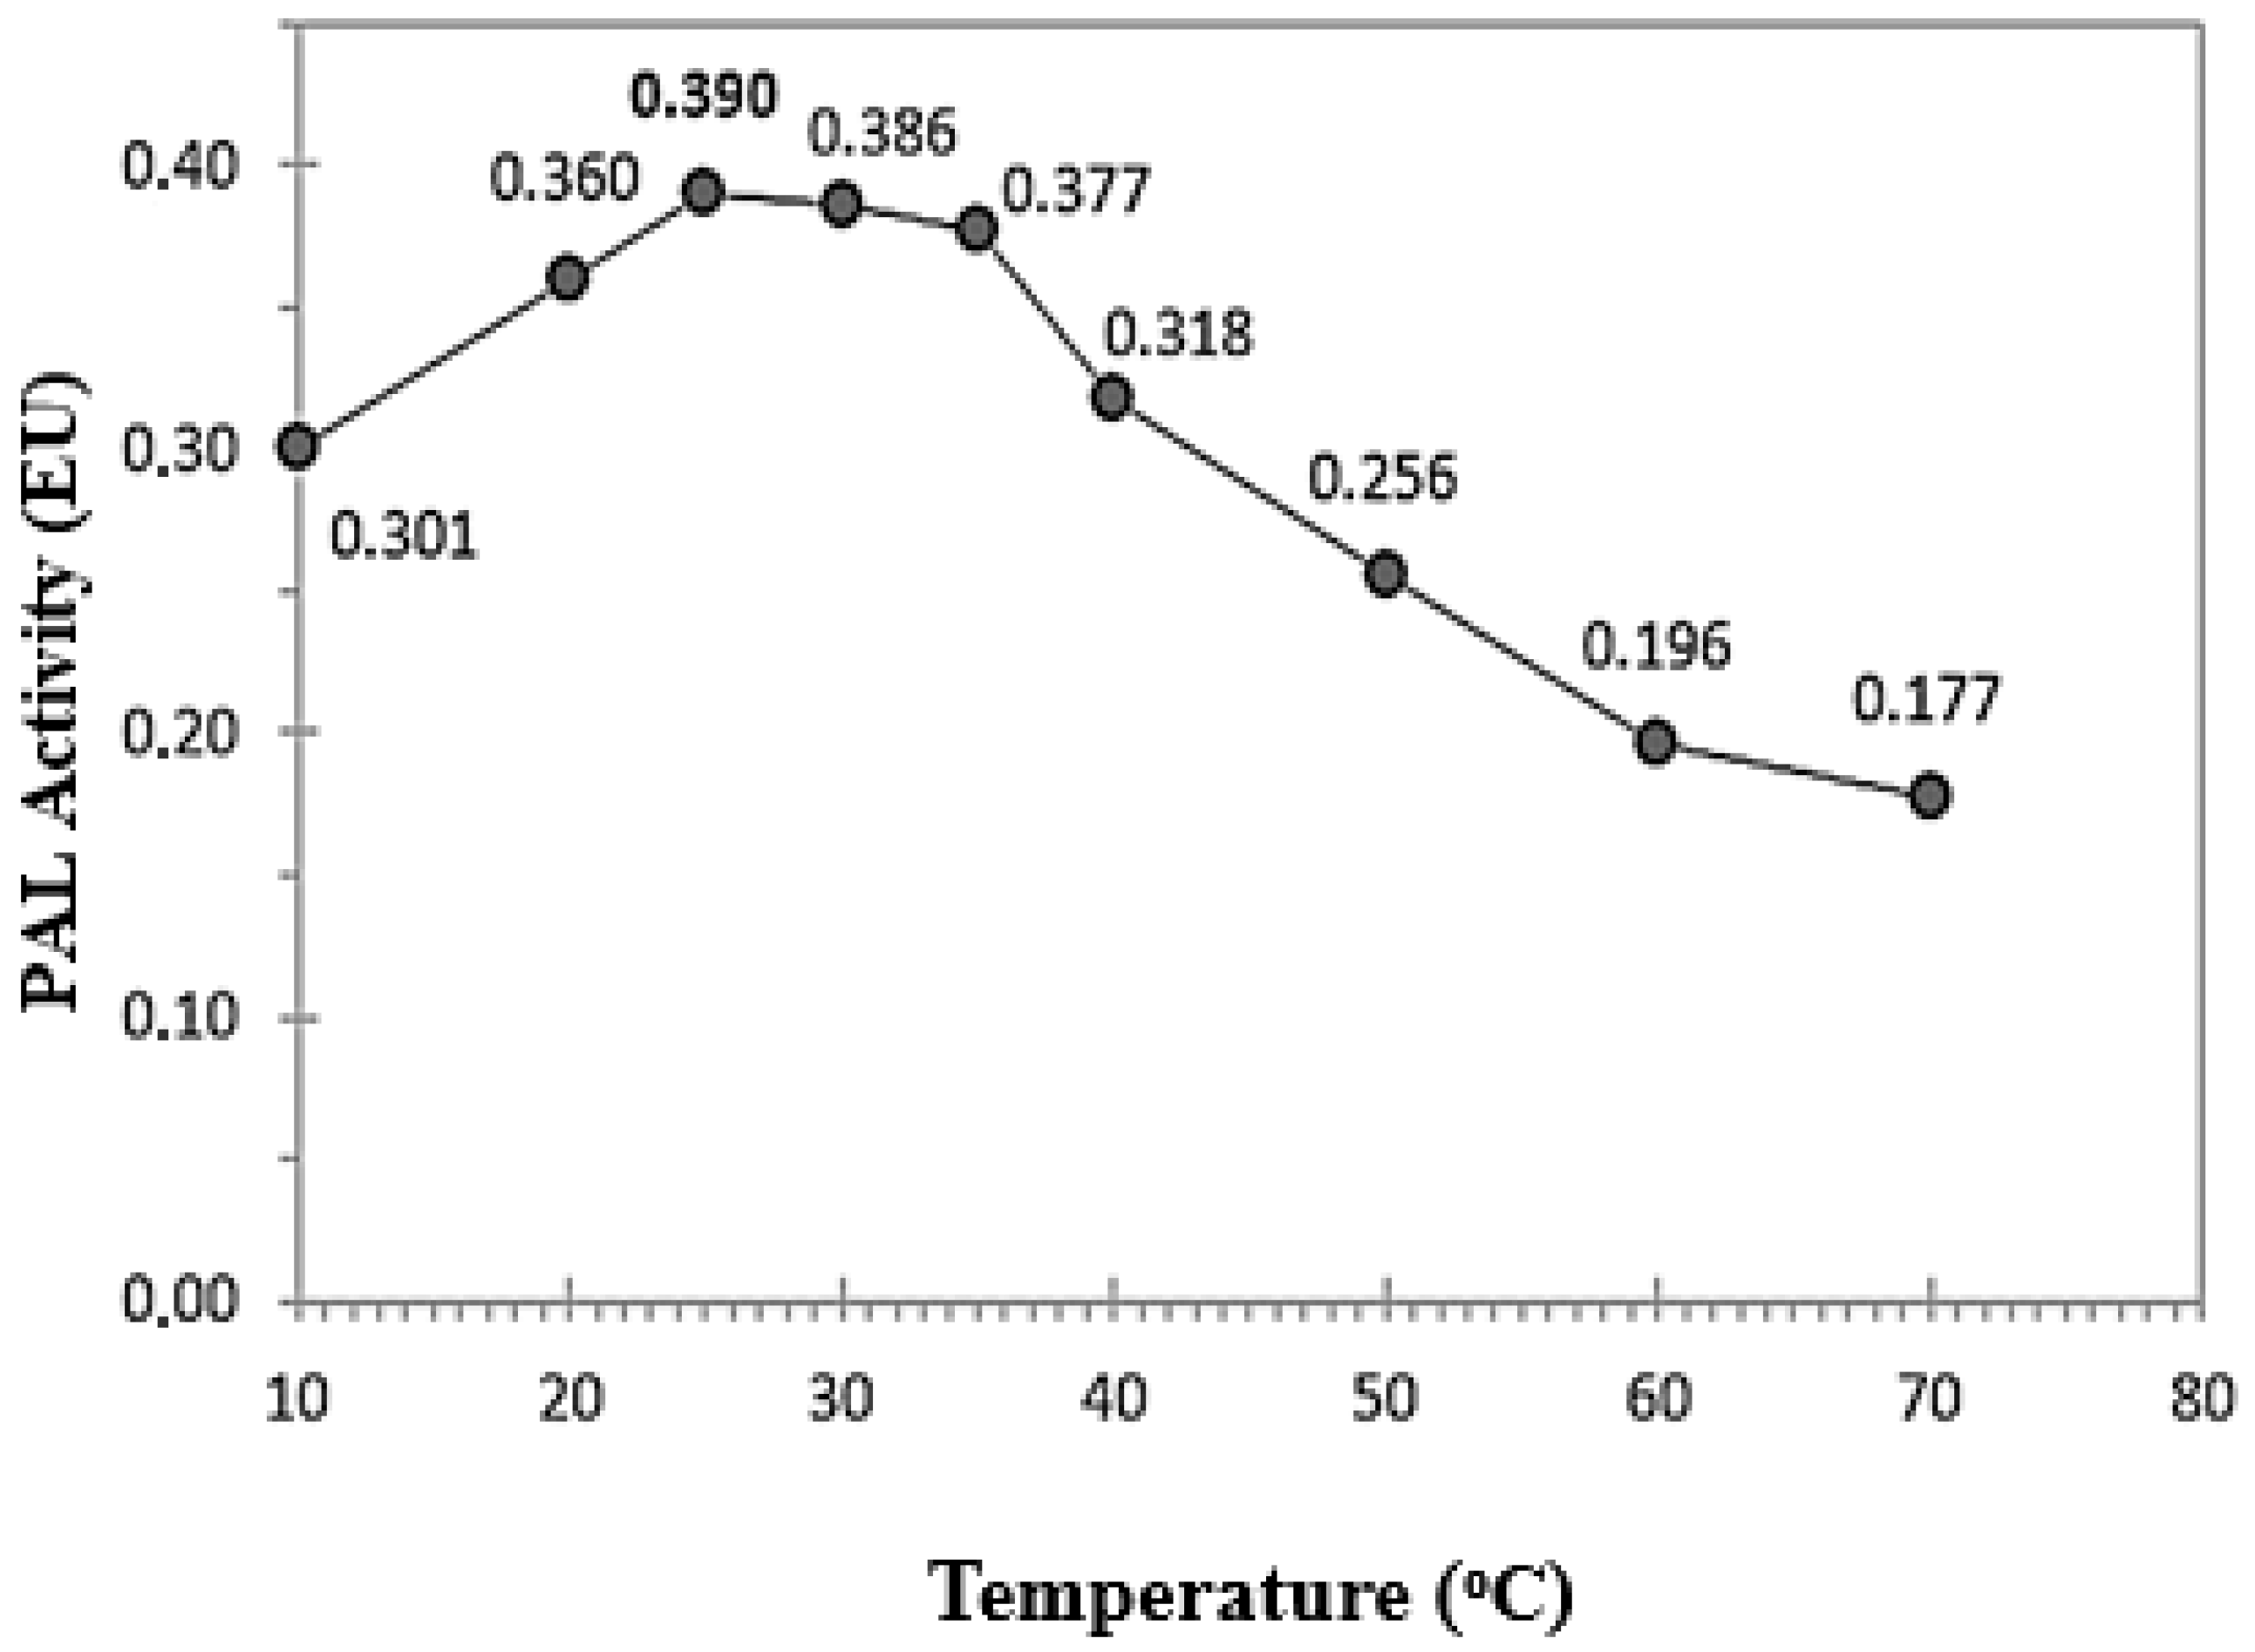
Figure 2 shows that the maximum RCL-PAL activity was measured as 0.39 EU in a 0.1 M Tris-HCl activity buffer (pH: 7). Following this, the optimum temperature value was determined according to the determined optimum concentration and pH values (Figure 3).
The reaction conditions for the RCL-PAL extract were finally determined as 0.1 M, pH 7, and 25 °C in the presence of L-Phe (Figure 1, Figure 2 and Figure 3). It was also observed that RCL-PAL activity decreased at lower and higher concentrations as compared to 0.1 M. In the pH study, the purified enzyme was found to have lower activity in the acidic and basic environments compared to pH 7. Additionally, the enzyme exhibited its maximum activity at 25 °C, whereas higher temperatures caused greater activity loss compared to lower temperatures (Figure 1, Figure 2 and Figure 3). Şirin et al. reported that PAL was isolated from Cyathobasis fruticulosa leaves. The maximum enzyme activity was found using 0.1 M Tris–HCl, pH 8.8, and activity buffer at 37 °C as optimum conditions [50]. Lim et al. reported that PAL isolated from leaf mustard showed maximum activity at pH 9.0 and 45 °C [51]. Aydaş et al. showed that PAL was partially purified from the leaves of Centaurea depressa. The optimum pH and temperature were detected as 8.8 and 37 °C, respectively [52]. Eissa and Ibrahim were informed that PAL isolated from banana fruit showed maximum activity at pH 8.8 and 37 °C in the presence of L-Phe at a concentration of 11 mM [53]. When the results were compared with the literature, differences were observed, especially in the substrate concentration, pH, and temperature values [50,51,52,53]. Following this, RCL-PAL kinetic constants were determined under optimum conditions.

3.3. Determination of Kinetic Constants of RCL-PAL

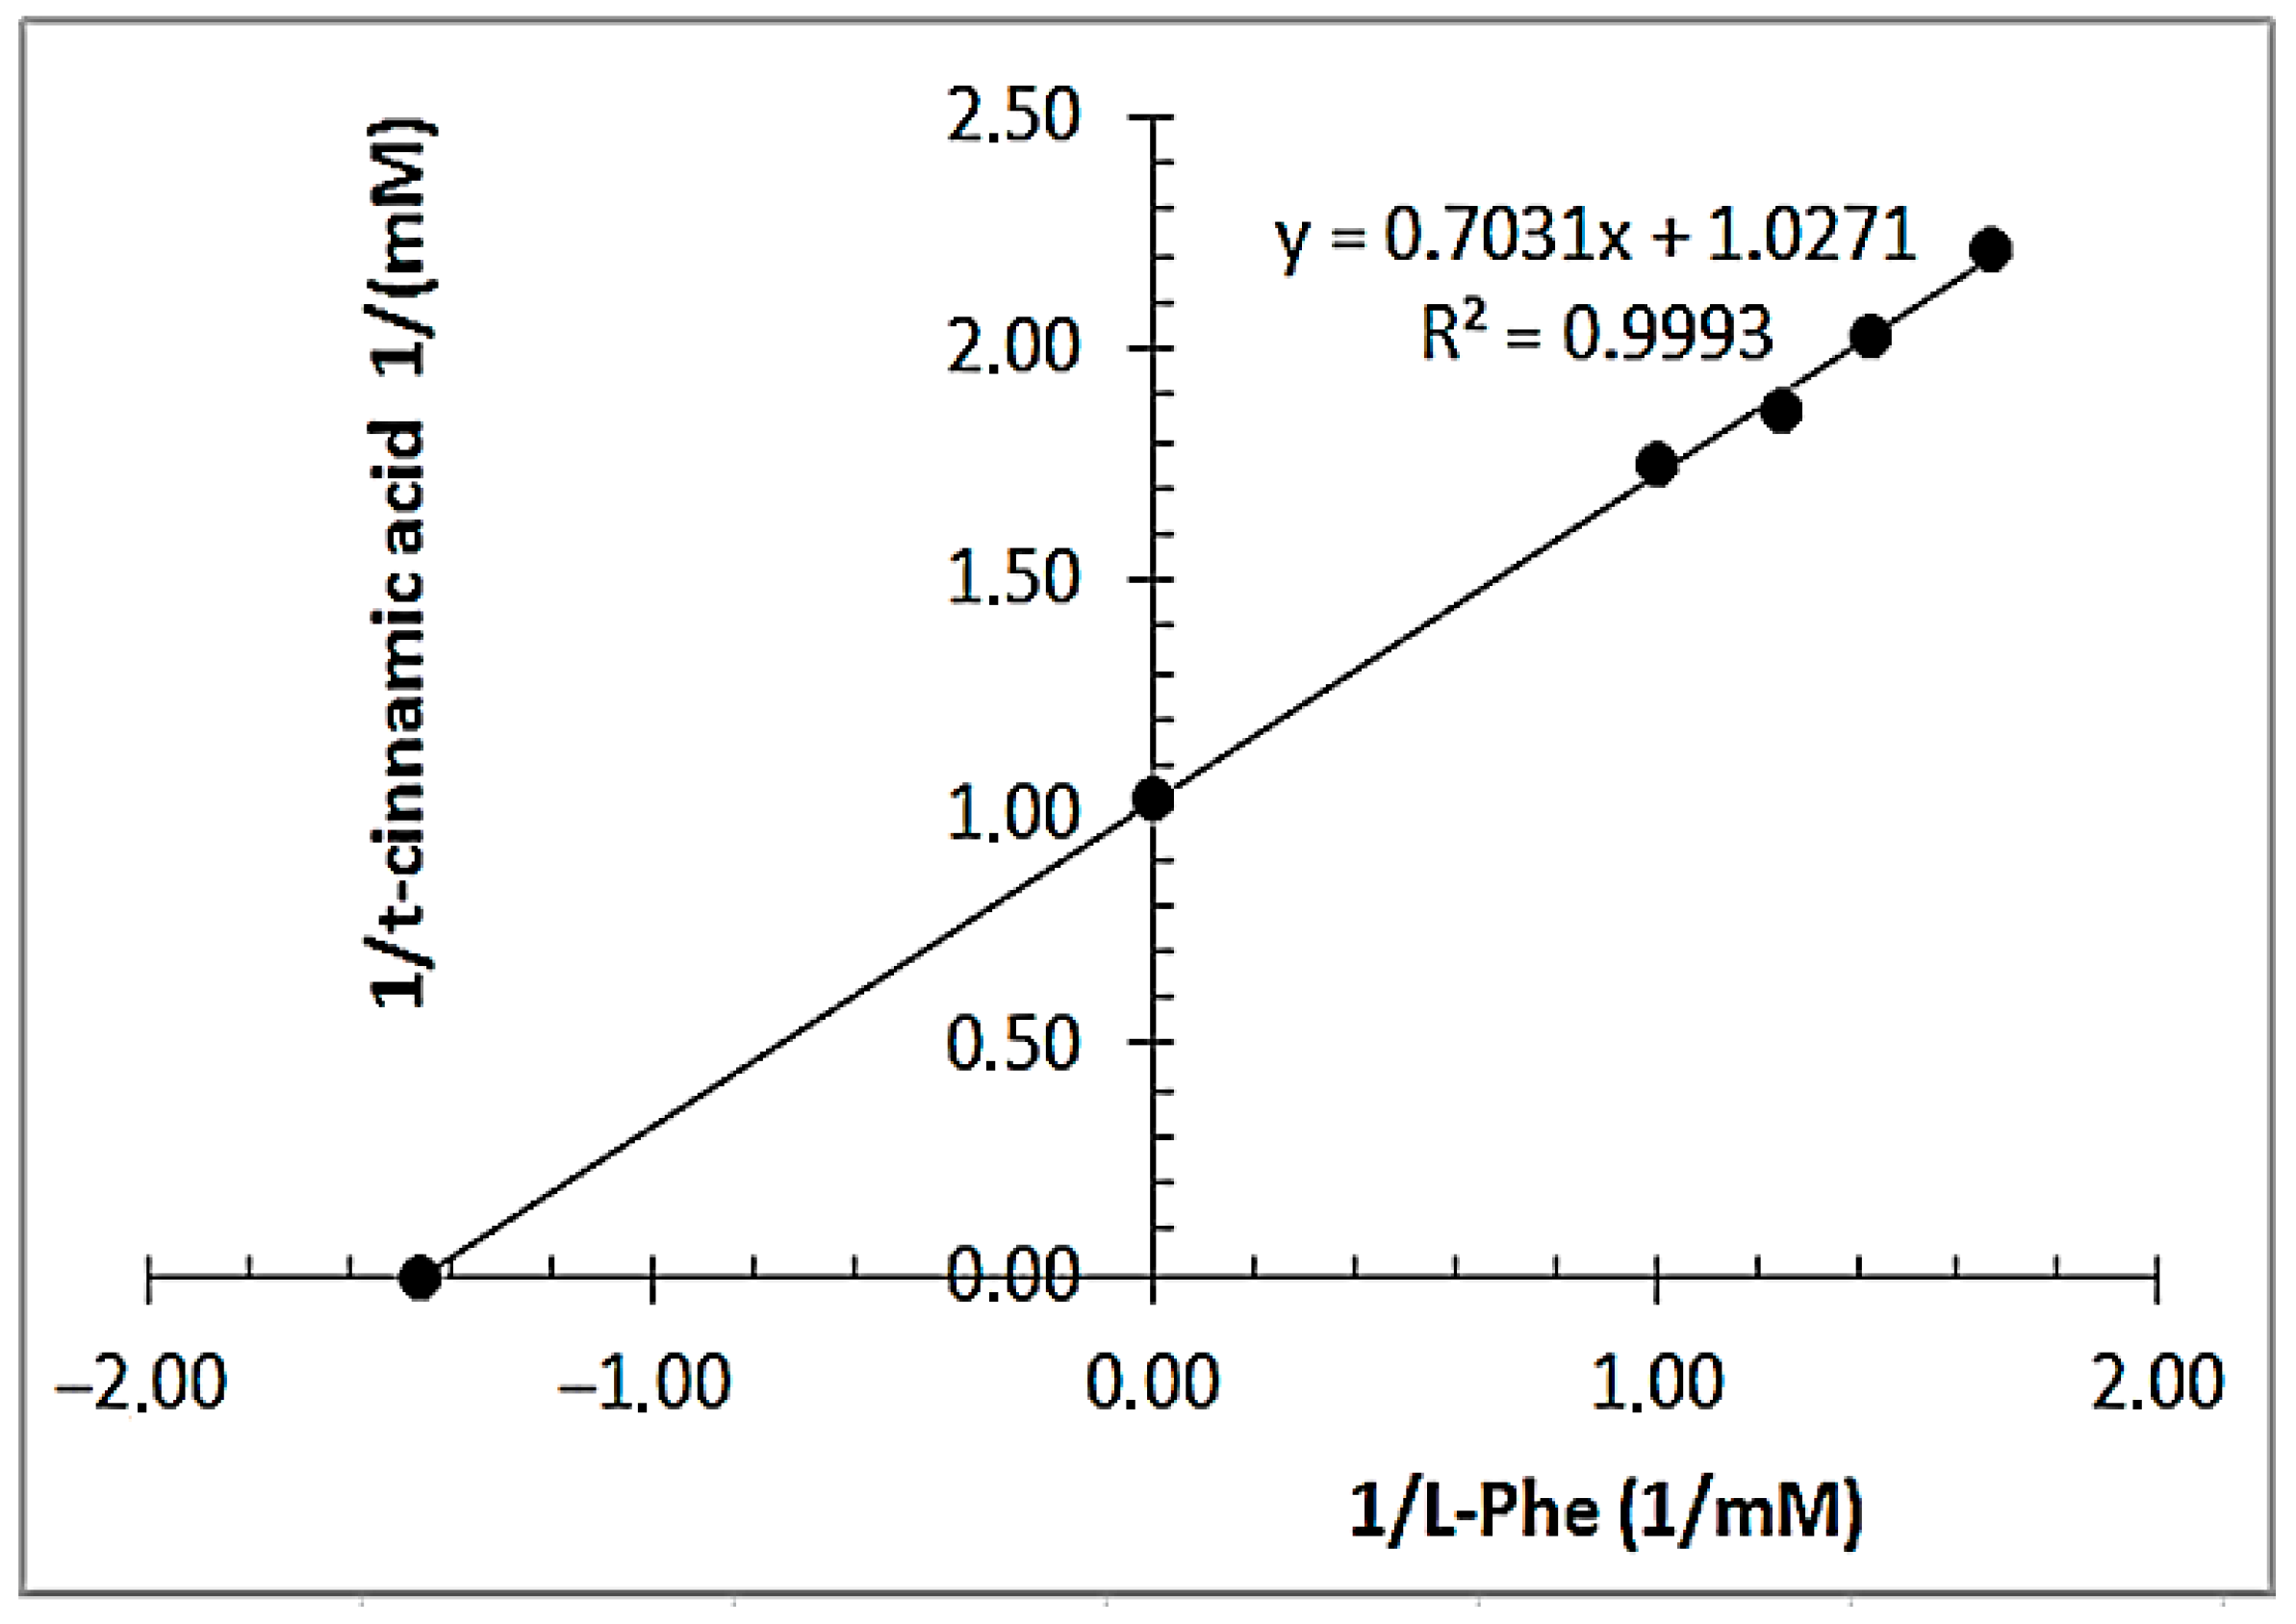
Kinetic constants of RCL-PAL were determined for L-Phe at 283 nm using a UV-Vis spectrophotometer. The linear graph was drawn according to the Lineweaver–Burk method [44]. Kinetic constants were calculated from the graph shown in Figure 4.
The KM and Vmax values of the enzyme were calculated as 0.68 mM and 0.97 EU, respectively (Figure 4). The results were compared with the literature [51,54,55,56]. The KM value of PAL isolated from leaf mustard was found to be 0.13 mM for L-Phe as a substrate [51]. Whetten and Sederoff reported that the KM value of PAL isolated from loblolly pine was found to be 27 μM for L-Phe [54]. Rhizoctoria solani PAL had a KM value of 0.81 mM for L-Phe [55]. On the other hand, Pyrus bretschneideri PAL had a KM value of 89.4 M for L-Phe [56]. Our results were found to be lower than the KM values of Rhizoctoria solani and Pyrus bretschneideri PALs in the presence of L-Phe. As a result of this, RCL-PAL has much more affinity compared to Rhizoctoria solani and Pyrus bretschneideri PALs [55,56].

3.4. FT-IR Analysis of the Original S-4B-TACA Affinity Gel

The FT-IR spectra of S-4B-TACA affinity gel were investigated between wavenumbers of 450 and 4000 cm−1 against transmittance % in a Thermo Scientific spectrophotometer (Figure 5).
Figure 5 shows a broad peak at 3292.98 cm−1 in the IR spectra of S-4B-TACA. It was explained that a hydroxyl functional group of an alcohol gives a broad peak between 3550 cm−1 and 3200 cm−1 in general [57]. But aromatic hydroxyl groups are expected to be observed at a wavenumber of around 1600 cm−1 [58]. S-4B-TACA gave a peak at 1634.29 cm−1 in our study. On the other hand, the peaks observed at wavenumbers of around 2200 cm−1 and 2000 cm−1 show ortho-, meta-, and para-aromatic structures and aromatic amines as the functional groups used in the binding of the affinity ligand, respectively [58]. The IR peaks of the S-4B-TACA affinity gel gave a wavenumber of 2161.41 cm−1. Moreover, the amount of agarose in Sepharose 4B is 4% [59]. So, it was thought that the matrix attached enough spacer arms depending on its aromatic hydroxyl groups.

3.5. Purification of RCL-PAL by Affinity Chromatography

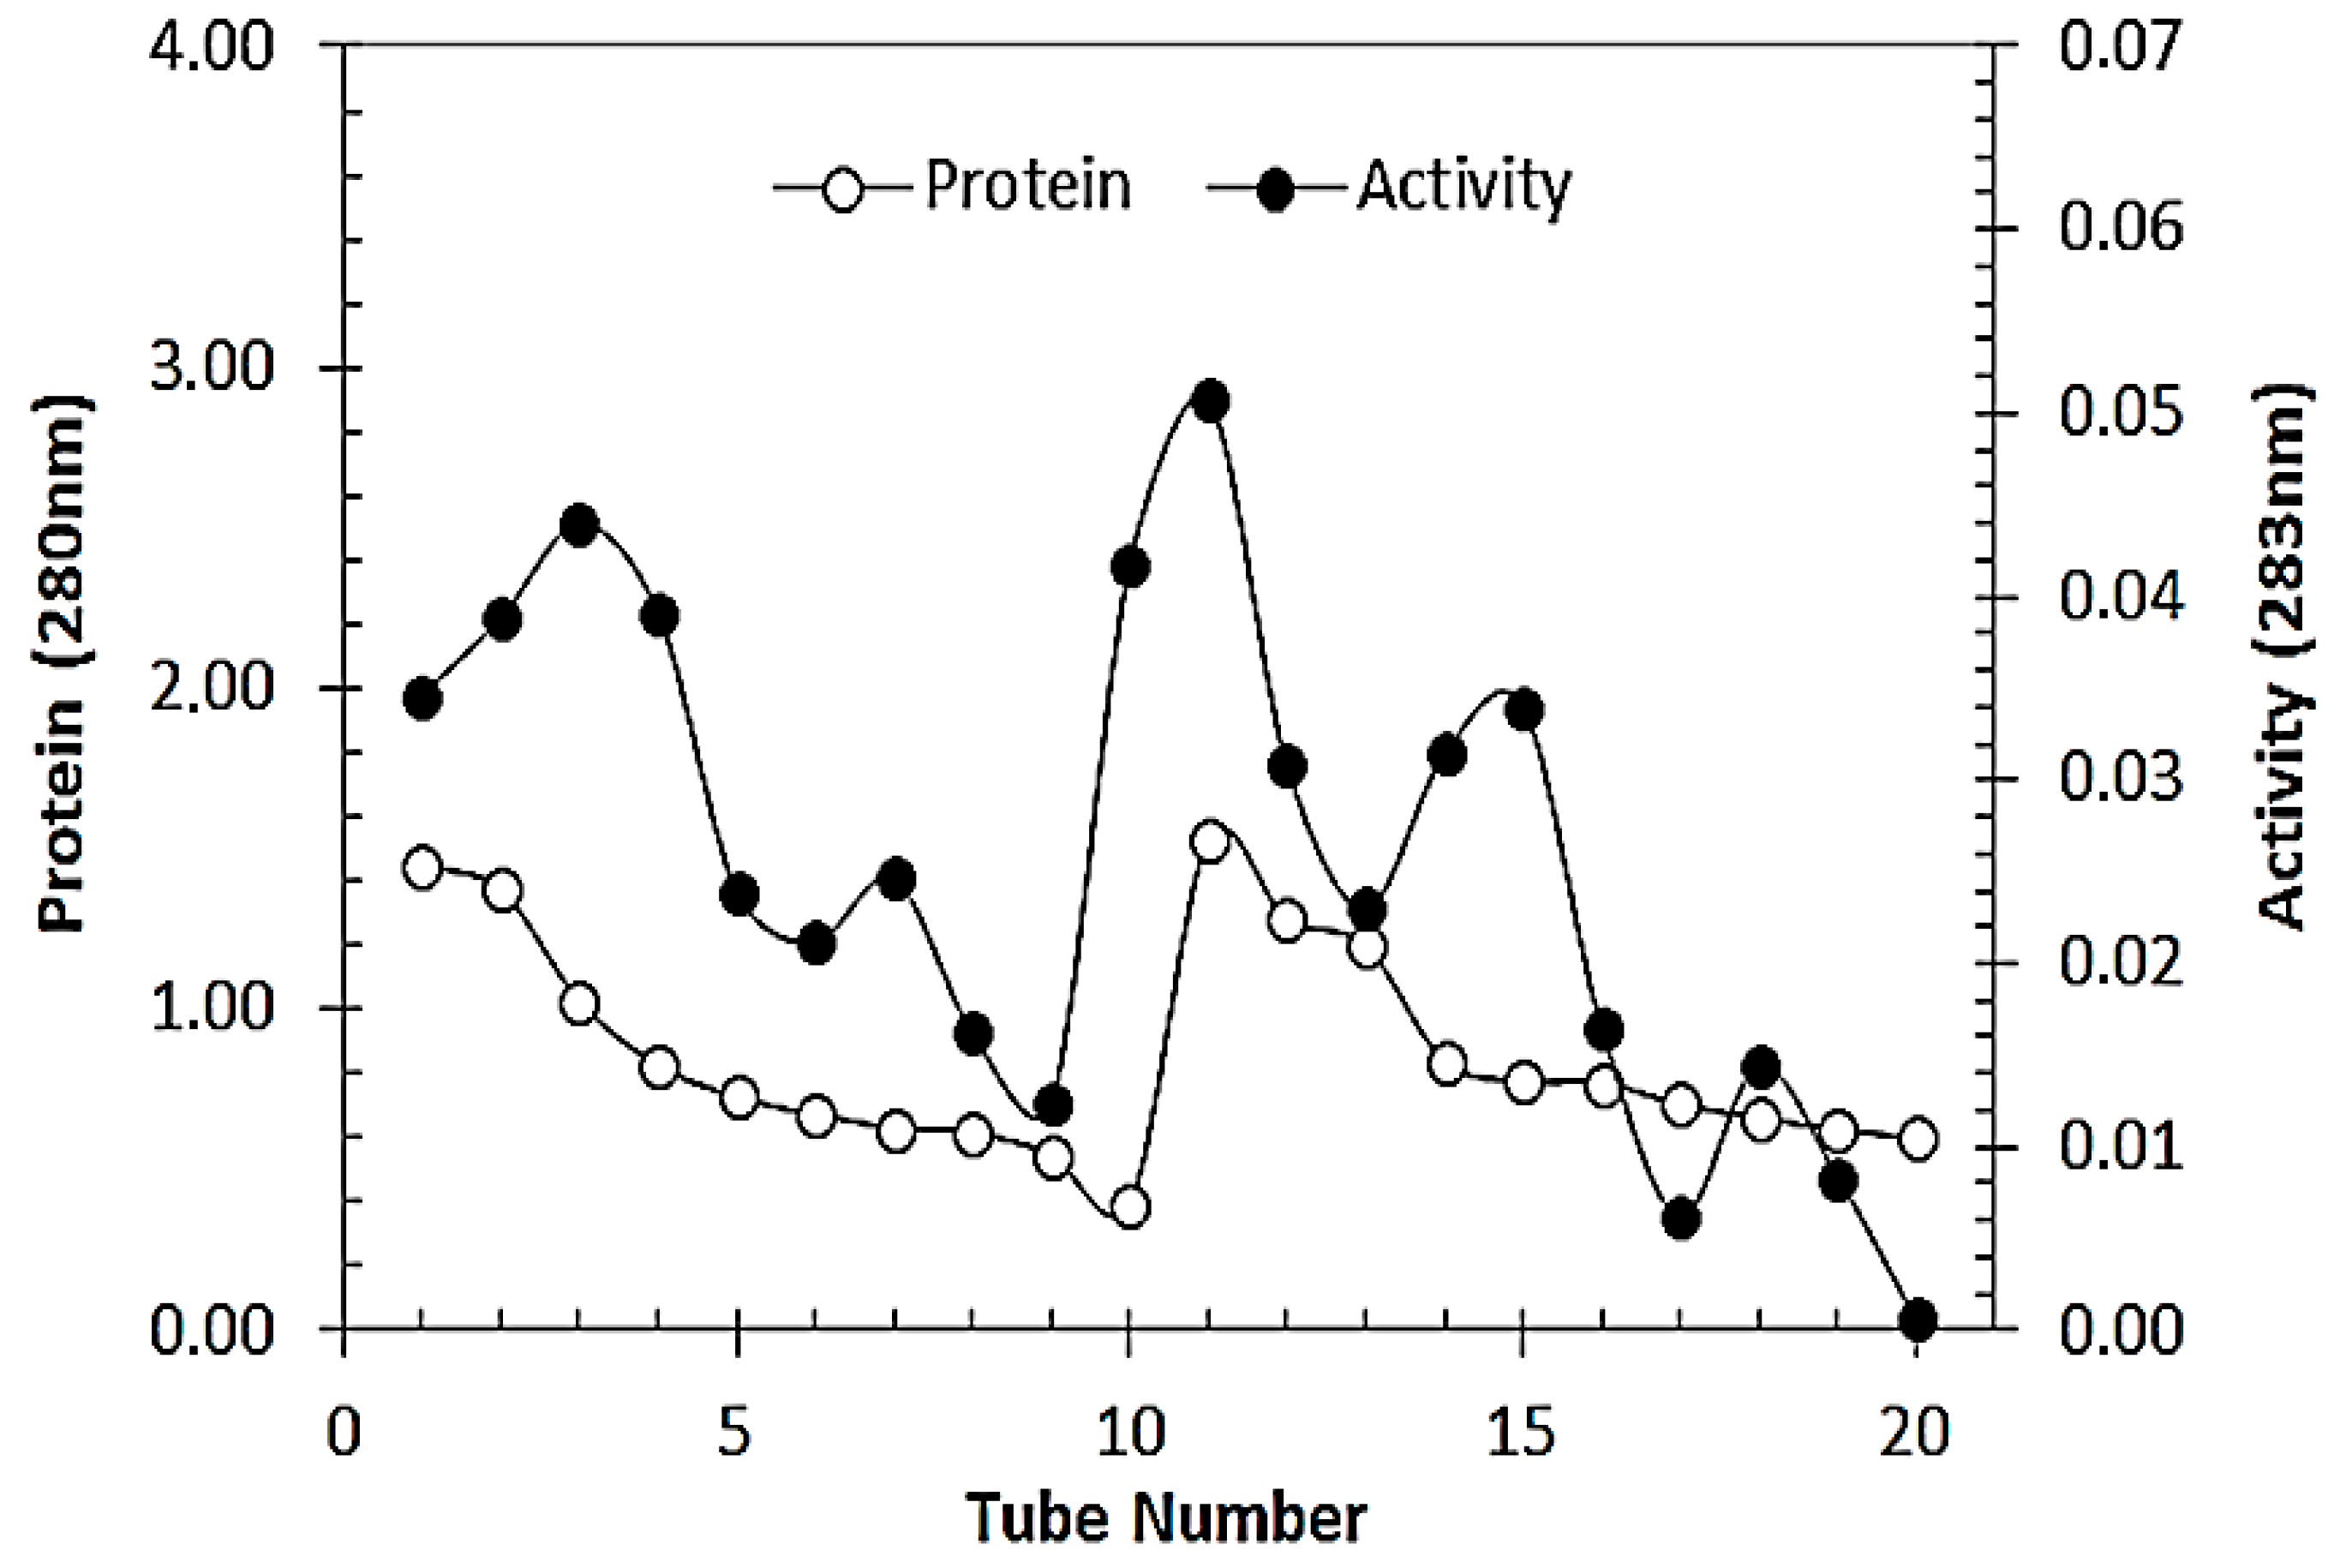
The RCL-PAL extract was loaded onto the S-4B-TACA affinity gel at a volume of 10 mL. An activity–protein graph was drawn, including each wash and elution tube (Figure 6).
Figure 6 shows the activity–elution graph where protein and activity values were given together for each tube at 280 and 283 nm, respectively. After foreign proteins were removed from the medium with the washing solution, RCL-PAL, bound reversibly to the 4-aminocinnamic acid affinity ligand, was eluted from the column using the elution buffer and collected in 2 mL fractions. Accordingly, the highest protein content and the enzyme activity were observed in the 11th tube compared to the others (Figure 6). The low absorbance at 280 nm stemmed from the low protein content in the eluted fractions, which was related to the amount of PAL enzyme in the leaf extract. While this affected the overall yield, it also demonstrated that the target enzyme was selectively bound and eluted. Following this, the protein and activity values of the RCL-PAL extract and eluate per mL were detected.

3.6. Determination of Protein Content of RCL-PAL

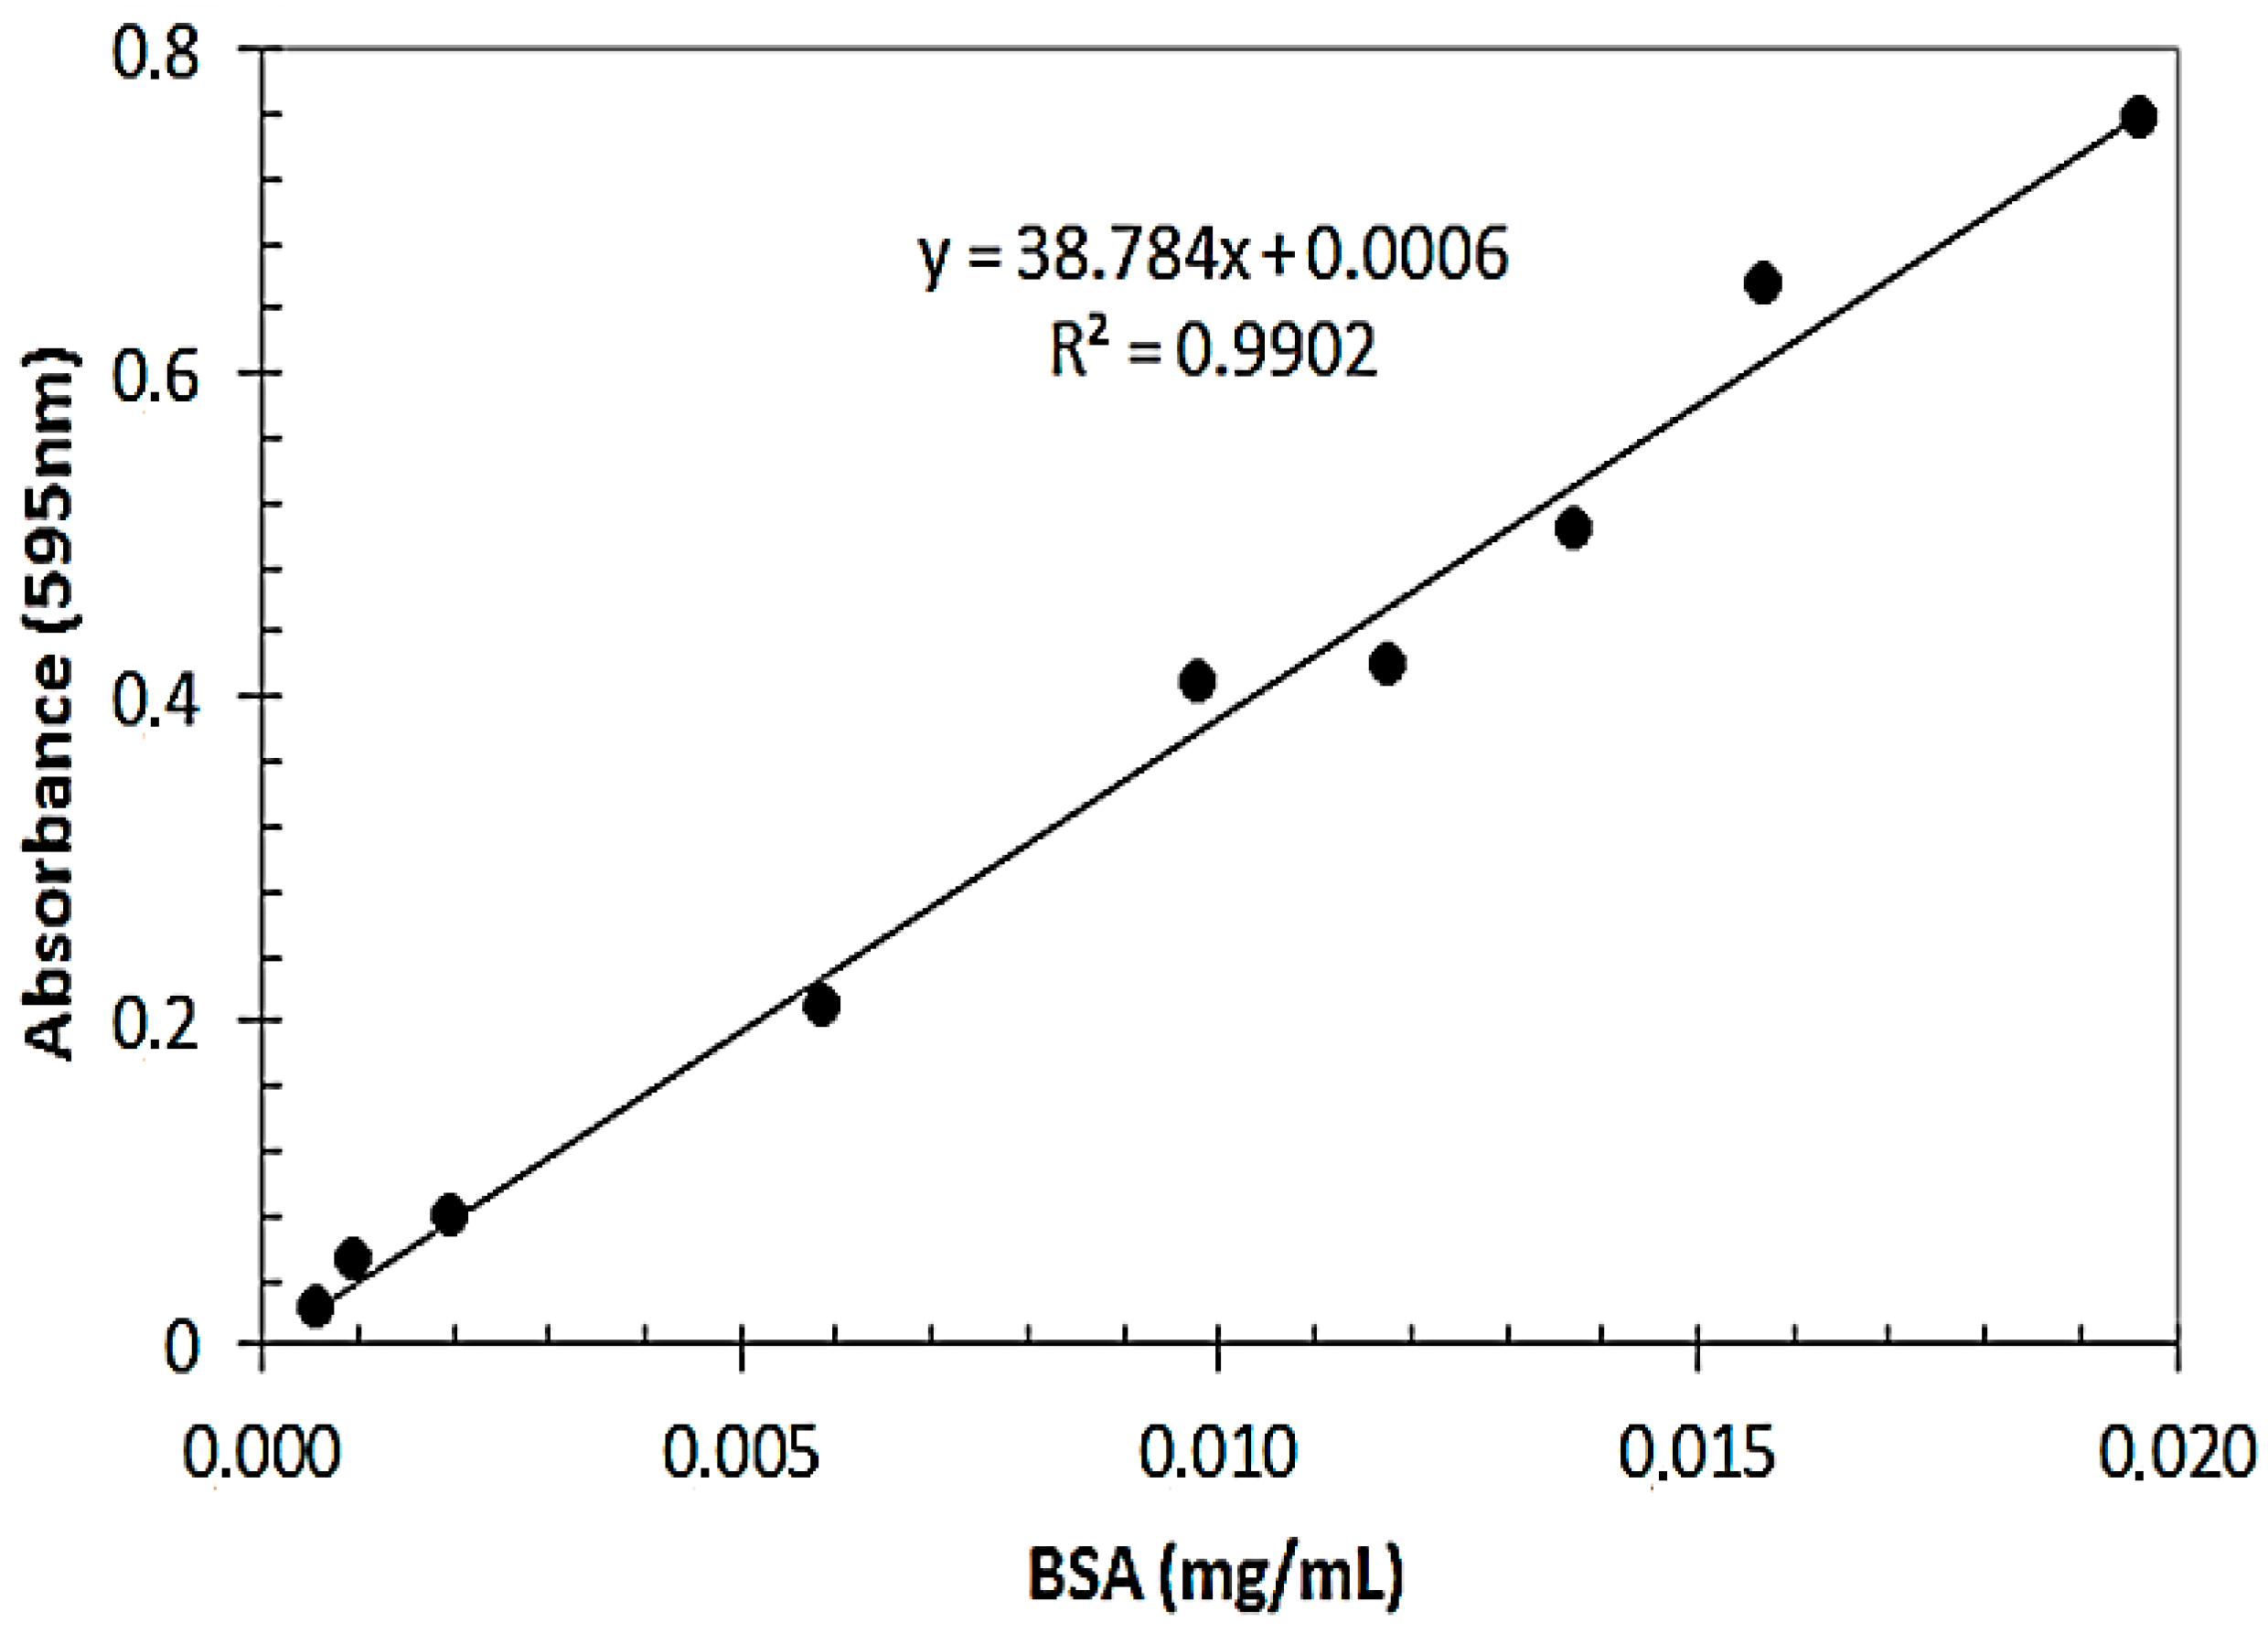
A standard linear graph was drawn using the BSA concentrations (mg/mL) corresponding to the absorbance values measured at 595 nm in a spectrophotometer (Figure 7).
For the preparation of the purification table, the amounts of enzyme obtained from two purification steps were calculated using the linear equation as follows: y = 38.784x + 0.0006 (Figure 7).

3.7. Determination of RCL-PAL Activity

The activities of RCL-PAL were found from the standard graph (Figure 8).
Figure 8 shows the different concentrations of t-CA solutions against their absorbance values measured at 283 nm. The relationship between the concentrations and absorbance values gave the following linear equation: y = 1.5809x + 0.018 (Figure 8).

3.8. Determination of the Molecular Weight of RCL-PAL by SDS-PAGE

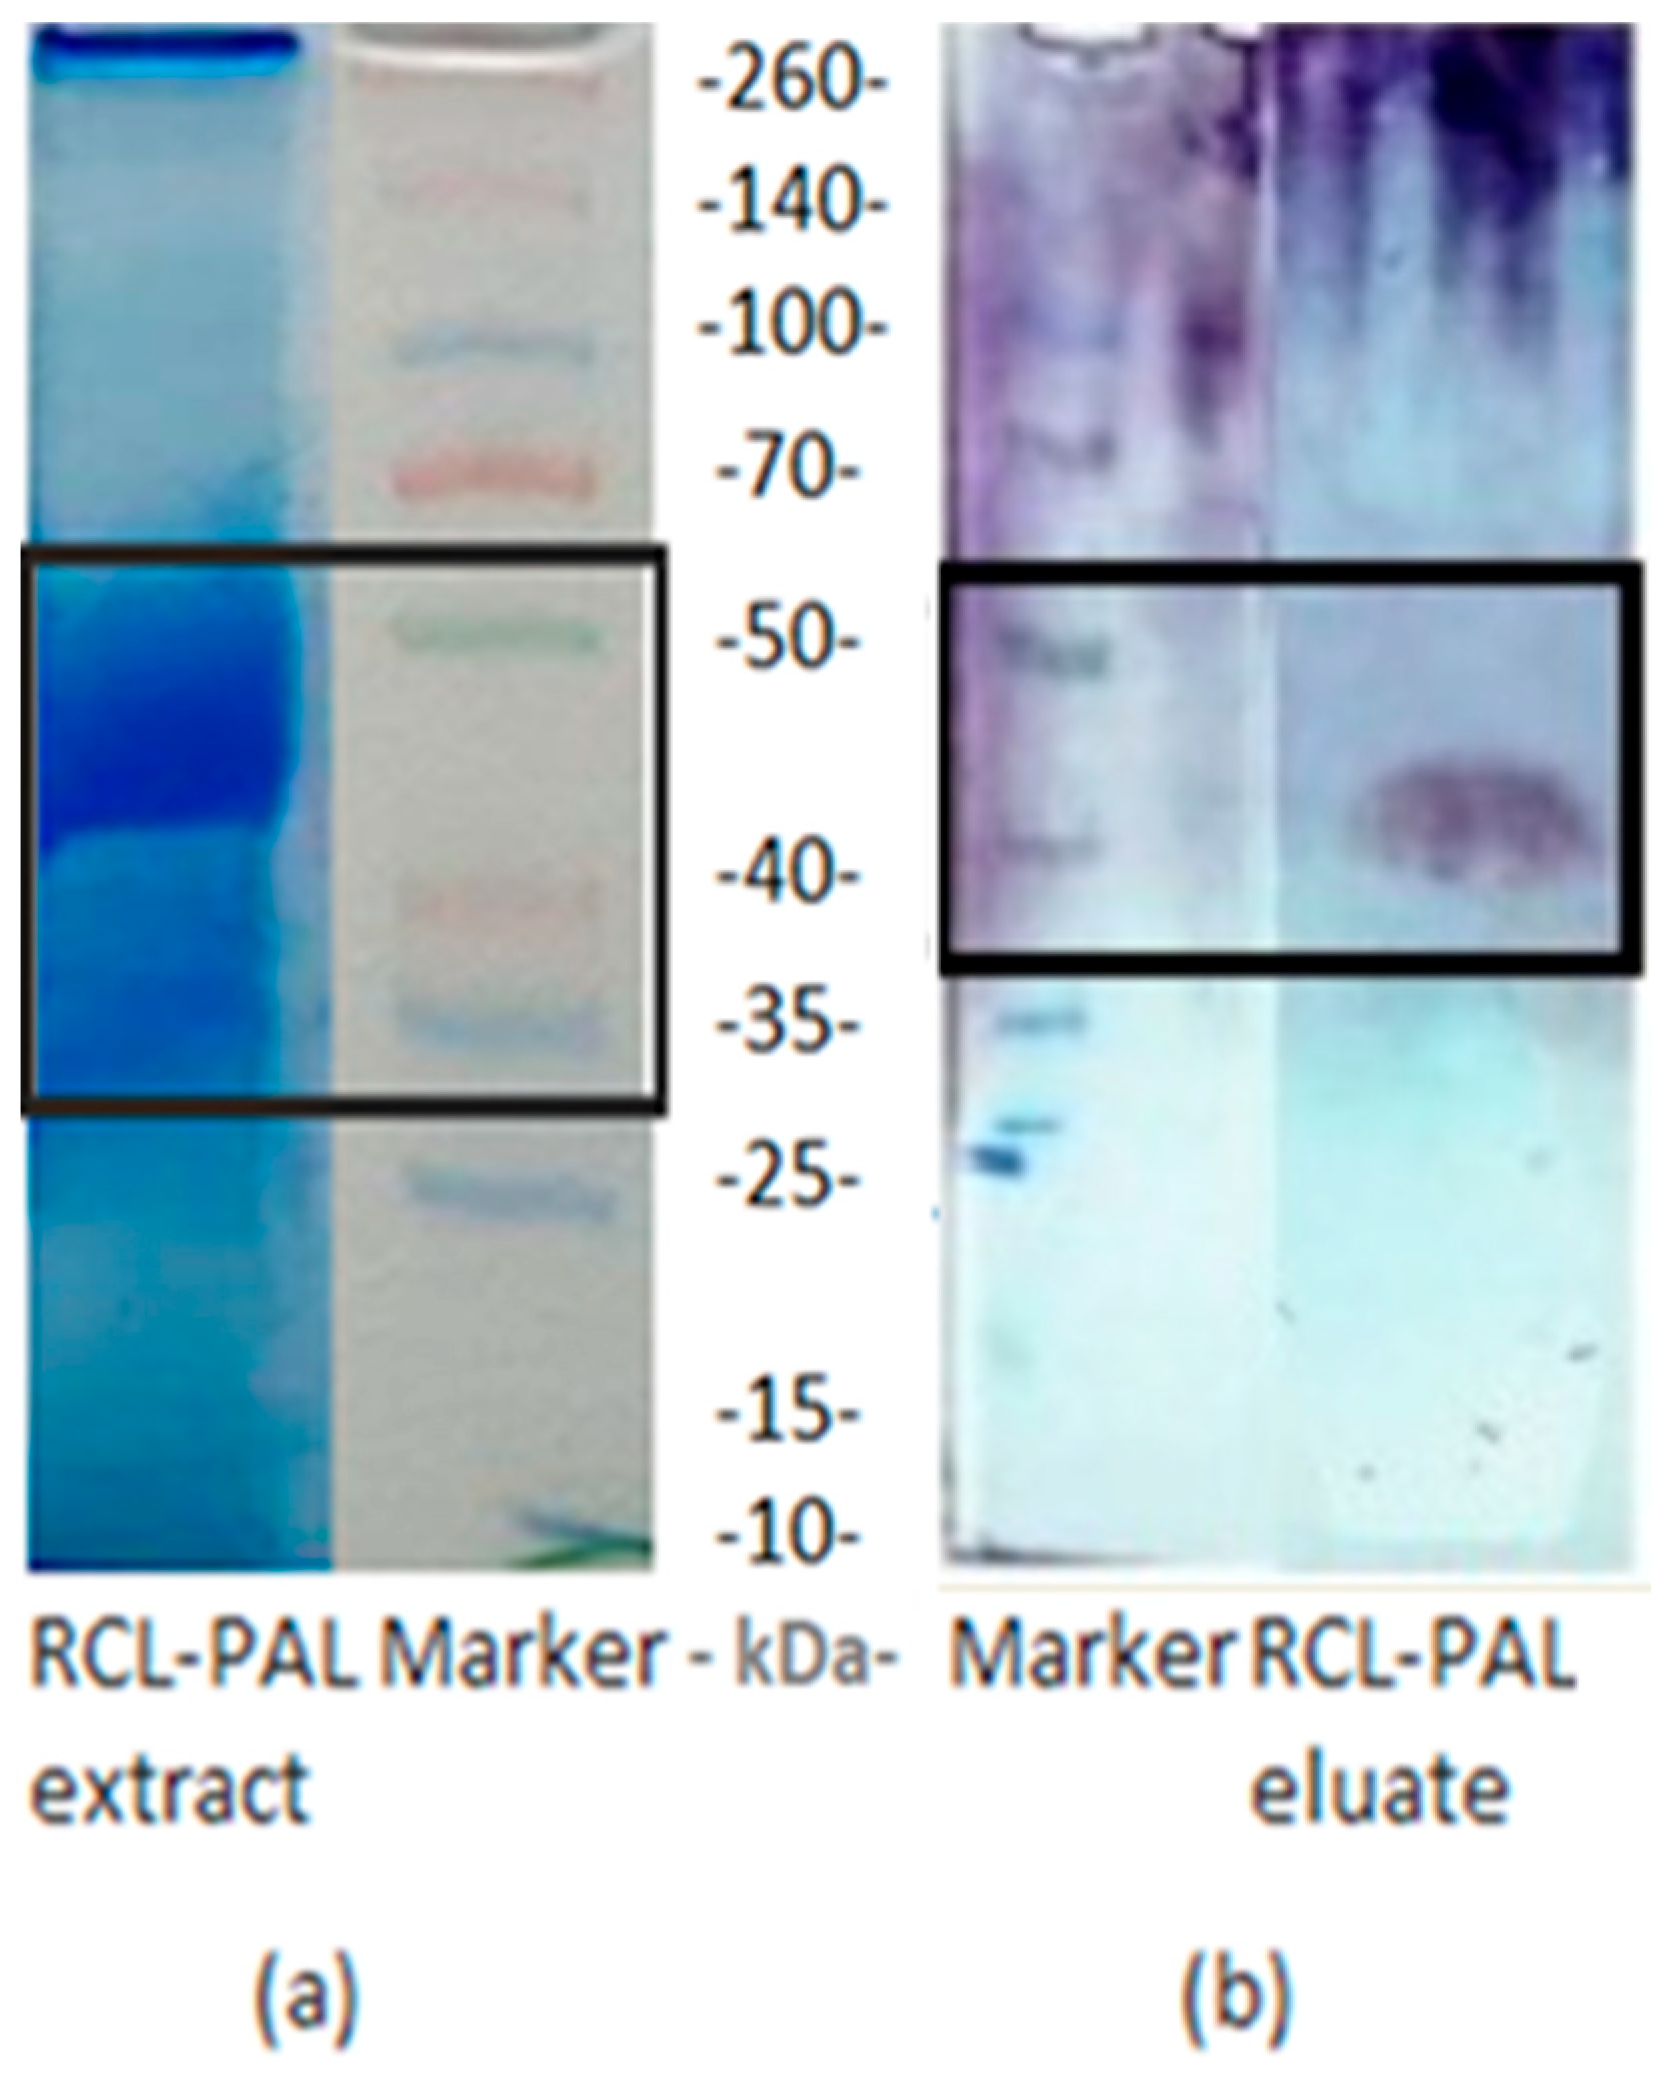
SDS-PAGE analyses of the RCL-PAL homogenate and the eluate obtained as a result of affinity chromatography are shown in Figure 9.
The experimental results indicate that RCL-PAL homogenate has two subunits at around 35 and 45 kDa, respectively. A distinct and thick protein band was obtained at the level of 45 kDa. RCL-PAL affinity eluate gave a single and clear band at the level of 45 kDa (Figure 9). Therefore, the observation of a single band in the enzyme sample eluted using the original S-4B-TACA affinity gel showed that RCL-PAL was first purified by affinity chromatography (Figure 9). When the results were compared with the literature, Cyathobasis fruticulosa PAL gave two protein bands via Western blot analysis at levels of 70 and 23 kDa, respectively [50]. Centaurea depressa PAL exhibited a 70 kDa protein band in SDS-PAGE [52]. S. platensis and A. flos-aquae PALs showed a single band at the level of molecular weight of 64 kDa in SDS-PAGE [60]. Trichosporon cutaneum and Rhodotorula glutinis PALs showed protein bands at 79 and 75 kDa, respectively [61,62]. The RCL-PAL eluate showed a single band at ~45 kDa, which differed from the protein band sizes reported in previous studies [52,60,61,62].

3.9. Formation of Purification Table of RCL-PAL

The enzyme’s yield %, specific activity, and purification fold were detected for two purification steps in a UV spectrophotometer. The RCL-PAL was purified in two steps, which involved obtaining the crude enzyme extract and affinity chromatography (Table 3).
Table 3 shows that RCL-PAL was purified by S-4B-TACA affinity gel with a purification fold of 19.4 in two steps. Cyathobasis fruticulosa PAL was partially purified by salt precipitation and dialysis, with the purification folds being 1.21 and 1.87, respectively [50]. S. platensis and A. flos-aquae PALs were reported to be purified by using acetone precipitation, gel filtration, and ion-exchange chromatography, respectively. The final purification folds for S. platensis and A. flos-aquae PAL derivatives were calculated as 3.9 and 4.3, respectively [60]. The overall recovery yield, 3.8%, was lower than typical for affinity chromatography. This was attributed to the relatively low abundance of PAL in red clover leaf and partial protein loss during extraction. When compared to the literature [50,60], the higher purification fold was determined as 19.4 by affinity chromatography in our study. Cunha reported that Phaseolus vulgaris PAL was purified at four purification steps: crude extracts, salt precipitation, Sephacryl S-200, and affinity chromatography, respectively [63]. In the last step, Phaseolus vulgaris PAL was purified by an affinity matrix called Sepharose-4B-succinyl-aminoelhylphenylalanine. The enzyme was eluted with purification folds of 2.4 and 23.8 in basic conditions and in the presence of L-Phe, respectively [63]. In our study, a higher purification fold was detected over the average purification fold in the literature [50,63].

3.10. Determination of RCL-PAL Stabilization

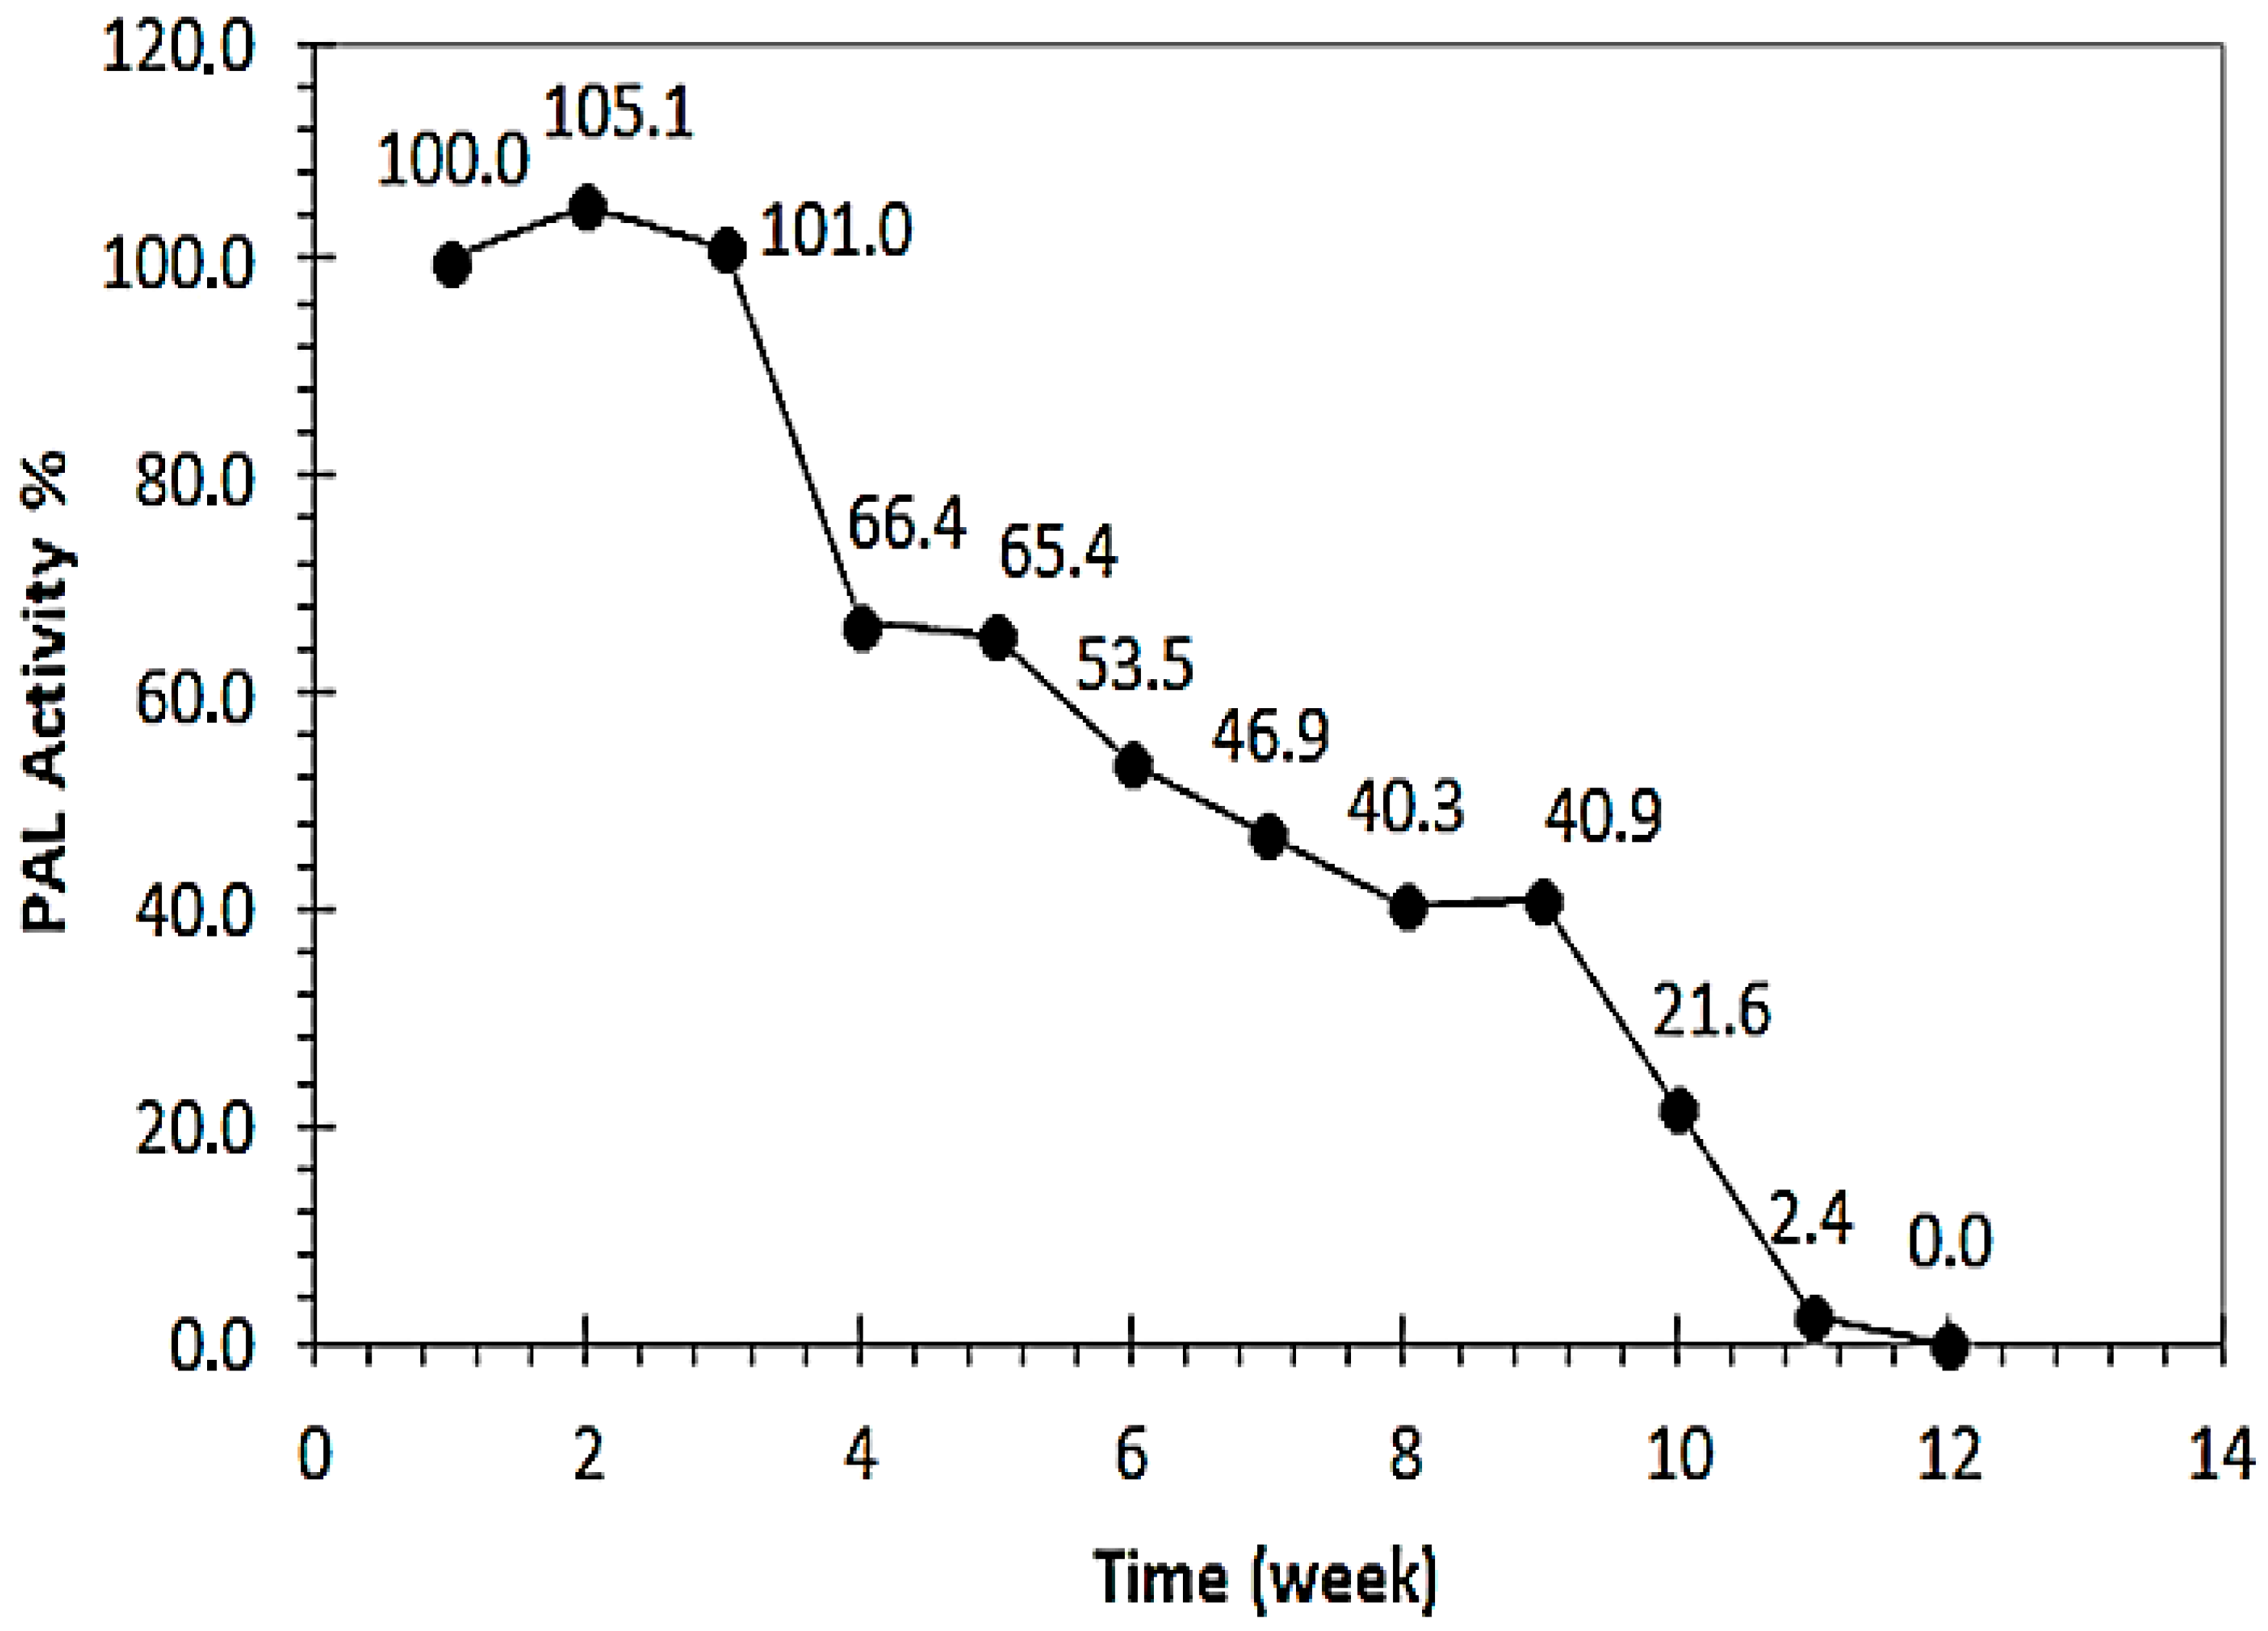
Storage measurements were performed using the RCL-PAL extract. The activities % of the RCL-PAL were compared against time. The activities were recorded every week for three months. The measurements were repeated in triplicate, and the average activity values were taken into account for the calculation of RCL-PAL activity. A graph was created to show the correlation between RCL-PAL activity % and time (Figure 10).
While RCL-PAL protected its activity at 100% for the first three weeks, decreases in activity to 34.6% and 60.7% were observed at the end of the first and second months, respectively. The activity was observed to have completely decreased at the end of the third month. Therefore, the storage period of the RCL-PAL at 4 °C storage conditions was determined as three weeks (Figure 10). We found that the enzyme remains highly active for at least three weeks. Therefore, it can be confirmed that the RCL-PAL enzyme can be stored at 4 °C for three weeks without decreasing its activity %, thus protecting its freshness, and it can be used easily for time-based studies.

3.11. Statistical Evaluation of RCL-PAL Stabilization

In this part of the study, a statistical one-way ANOVA was performed in the Microsoft Office Excel program, taking into account the RCL-PAL activity values measured each week. The measurements were performed in triplicate per week. Nine weeks out of a total of twelve were taken into account in the one-way ANOVA. The nine weeks were divided into three groups in total, with the closest measurements being included in a group (Table 4).
Table 4 shows the averages, SD values, and variances calculated each week. The first three weeks cover the first group, and the 4th–6th and the 7th–9th weeks covered the second and third groups’ measurements, respectively (Table 4). The basic statistical terms shown in Table 5 were determined according to the values presented in Table 4.
Table 5 shows the Fcalculated and p values according to the Fcritical value of 5.14. In three groups, the Fcalculated values were recorded automatically as 20.95, 8.25, and 91.50, respectively. It was observed that all Fcalculated values were bigger than the Fcritical value. Additionally, the p value was found to be smaller than the value of α = 0.05 at a 95% confidence level. Therefore, H1, which states that there is a statistically significant difference between the average values measured each week and between week groups, was accepted (Table 5). It was concluded that although the enzyme activity at 4 °C could be measured up to the end of the three months, statistically significant differences were observed between the measured activity values.

4. Conclusions

In this study, RCL-PAL was purified for the first time by affinity chromatography. S-4B-TACA was first synthesized as an original affinity gel, contributing to the literature. Since enzymes are specific biomolecules that are quite costly in very small amounts, obtaining the enzyme by purifying it with practical methods in a laboratory makes our work easy to apply and low-cost. It provides both financial and scientific contributions. These features are among the advantages of the affinity chromatography method. PAL is also an enzyme of critical importance in the plant world. The reaction catalyzed by PAL is the precursor reaction in phenylpropanoid metabolism and lignin synthesis.
Our research has clarified the structural and functional properties of RCL-PAL using L-Phe as the substrate. Storage measurements were taken to observe the stability of the enzyme, and the storage activity of RCL-PAL was evaluated at different time intervals. So, the potential usage of PAL is increased to a wide range of industrial applications by its ability to maintain high activity for approximately five weeks. In addition, this result supports the usage of RCL-PAL in various immobilization and biosensor studies. In the pharmaceutical industry, PAL has emerged as a major therapeutic enzyme with a wide range of biological properties, including its antitumor properties. It was also thought to be used in the treatment of metabolic diseases like tyrosinemia. On the other hand, the therapeutically valuable metabolites of the enzyme can be added to pharmaceuticals, food supplements, antimicrobial peptides, amino acids, and their derivatives to improve the pharmacokinetic characteristics of the metabolites. In conclusion, this study revealed the potential future usability of the PAL enzyme as well as its purification and characteristic properties.

Author Contributions

Conceptualization, Ç.B. and E.K.; methodology, Ç.B. and E.K.; software, Y.S.T. and Ç.B.; validation and statistical analyses, Ç.B.; formal analysis, Y.S.T., Ç.B., and E.K.; investigation, Ç.B. and E.K.; terms, Ç.B. and E.K.; resources, Y.S.T., Ç.B., and E.K.; affinity gel synthesis, Ç.B.; data curation, Y.S.T., Ç.B., and E.K.; writing—original draft preparation, Ç.B. and E.K.; writing—review and editing, Y.S.T., Ç.B., and E.K.; visualization, Y.S.T. and Ç.B.; supervision, Ç.B. and E.K.; project administration, E.K.; supervisor, E.K.; co-supervisor, Ç.B.; funding acquisition, Y.S.T. All authors have read and agreed to the published version of the manuscript.

Funding

This research was funded by Yildiz Technical University Science Research Projects Foundation, grant number FBA-2023-5527.

Data Availability Statement

The original contributions presented in this study are included in the article. Further inquiries can be directed to the corresponding authors.

Acknowledgments

The authors would like to acknowledge that this paper is submitted in partial fulfillment of the requirements for a PhD degree at Yildiz Technical University.

Conflicts of Interest

The authors declare no conflicts of interest.

Abbreviations

The following abbreviations are used in this manuscript:
PALPhenyalanine ammonia lyase
RCLRed clover leaf
t-CATrans-cinnamic acid
L-PheL-phenylalanine
SASalicylic acid
S-4B-TACASepharose-4B-L-tyrosine-4-aminocinnamic acid
PEGPolyethylene glycol
MIO4-methyldiene-imidazol-5-one
APSAmmonium persulfate
TEMEDTetramethyl ethylene diamine
Tris BASETris hydroxymethyl aminomethane
CBBCoomassie brillant blue
BSABovine serum albumin
SDS-PAGESodium dodecyl sulfate polyacrylamide gel electrophoresis
ANOVAAnalysis of variance
SDStandard deviation

References

  1. Sabudak, T.; Guler, N. Trifolium L.-A review on its phytochemical and pharmacological profile. Phytother. Res. 2009, 23, 439–446. [Google Scholar] [CrossRef]
  2. Vasiljevic, S.; Cupina, B.; Krstic, D.; Pataki, I.; Katanski, S.; Milosevic, B. Seasonal changes of proteins, structural carbohydrates, fats and minerals in herbage dry matter of red clover (Trifolium pratense L.). Biotechnol. Anim. Husb. 2011, 27, 1543–1550. [Google Scholar] [CrossRef]
  3. Sabudak, T.; Dokmeci, D.; Ozyigit, F.; Isik, E.; Aydogdu, N. Antiinflammatory and antioxidant activities of Trifolium resupinatum var. microcephalum extracts. Asian J. Chem. 2008, 20, 1491–1496. [Google Scholar]
  4. Khan, S.W.; Khatoon, S. Ethnobotanical studies on some useful herbs of Haramosh and Bugrote valleys in Gilgit, Northern Areas of Pakistan. Pak. J. Bot. 2008, 40, 43–58. [Google Scholar]
  5. Mustafa, B.; Hajdari, A.; Krasniqi, F.; Hoxha, E.; Ademi, H.; Quave, C.L.; Pieroni, A. Medical ethnobotany of the Albanian Alps in Kosovo. J. Ethnobiol. Ethnomed. 2012, 8, 6. [Google Scholar] [CrossRef]
  6. Nissan, H.P.; Lu, J.; Booth, N.L.; Yamamura, H.I.; Farnsworth, N.R.; Wang, Z.J. A red clover (Trifolium pratense) phase II clinical extract possesses opiate activity. J. Ethnopharmacol. 2007, 112, 207–210. [Google Scholar] [CrossRef]
  7. Barcelo, A.R. Lignification in plant cell walls. Int. Rev. Cytol. 1997, 176, 87–132. [Google Scholar] [CrossRef]
  8. Lee, B.R.; Kim, K.Y.; Jung, W.J.; Avice, J.C.; Ourry, A.; Kim, T.H. Peroxidases and lignification in relation to the intensity of water-deficit stress in white clover (Trifolium repens L.). J. Exp. Bot. 2007, 58, 1271–1279. [Google Scholar] [CrossRef]
  9. Flores, G.; Moreno, F.D.; Blanch, G.P.; del Castillo, M.L.R. Phenylalanine ammonia-lyase, flavanone 3 beta-hydroxylase and flavonol synthase enzyme activity by a new in vitro assay method in berry fruits. Food Chem. 2014, 153, 130–133. [Google Scholar] [CrossRef]
  10. Rai, P.K.; Sonne, C.; Kim, K.H. Heavy metals and arsenic stress in food crops: Elucidating antioxidative defense mechanisms in hyperaccumulators for food security, agricultural sustainability, and human health. Sci. Total Environ. 2023, 874, 162327. [Google Scholar] [CrossRef]
  11. Berens, M.L.; Berry, H.M.; Mine, A.; Argueso, C.T.; Tsuda, K. Evolution of Hormone Signaling Networks in Plant Defense. Annu. Rev. Phytopathol. 2017, 55, 401–425. [Google Scholar] [CrossRef]
  12. Yadav, V.; Wang, Z.; Wei, C.; Amo, A.; Ahmed, B.; Yang, X.; Zhang, X. Phenylpropanoid Pathway Engineering: An Emerging Approach towards Plant Defense. Pathogens 2020, 9, 312. [Google Scholar] [CrossRef]
  13. Wada, K.C.; Takeno, K. Stress-induced flowering. Plant Signal. Behav. 2010, 5, 944–947. [Google Scholar] [CrossRef]
  14. Koukol, J.; Conn, E.E. Metabolism of aromatic compounds in higher plants. IV. Purification and properties of phenylalanine deaminase of Horden vulgare. J. Biol. Chem. 1961, 236, 2692–2698. [Google Scholar] [CrossRef] [PubMed]
  15. Hahlbrock, K.; Scheel, D. Physiology and molecular biology of phenylpropanoid metabolism. Annu. Rev. Plant Physiol. Plant Mol. Biol. 1989, 40, 347–369. [Google Scholar] [CrossRef]
  16. Rieseberg, T.P.; Dadras, A.; Furst-Jansen, J.M.R.; Ashok, A.D.; Darienko, T.; De-Vries, S.; Irisarri, I.; De-Vries, J. Crossroads in the evolution of plant specialized metabolism. Semin. Cell Dev. Biol. 2023, 134, 37–58. [Google Scholar] [CrossRef]
  17. Tian, Y.; Jiang, X.; Guo, J.; Lu, H.; Xie, J.; Zhang, F.; Yao, C.; Hao, E. Pharmacological Potential of Cinnamic Acid and Derivatives: A Comprehensive Review. Pharmaceuticals 2025, 18, 1141. [Google Scholar] [CrossRef] [PubMed]
  18. Ding, P.T.; Ding, Y.L. Stories of Salicylic Acid: A Plant Defense Hormone. Trends Plant Sci. 2020, 25, 549–565. [Google Scholar] [CrossRef] [PubMed]
  19. Zhang, X.B.; Liu, C.J. Multifaceted Regulations of Gateway Enzyme Phenylalanine Ammonia-Lyase in the Biosynthesis of Phenylpropanoids. Mol. Plant. 2015, 8, 17–27. [Google Scholar] [CrossRef]
  20. Vargas-Tah, A.; Gosset, G. Production of cinnamic and p-hydroxycinnamic acids in engineered microbes. Front. Bioeng. Biotechnol. 2015, 3, 116. [Google Scholar] [CrossRef]
  21. Dong, N.-Q.; Lin, H.-X. Contribution of phenylpropanoid metabolism to plant development and plant–environment interactions. J. Integr. Plant Biol. 2021, 63, 180–209. [Google Scholar] [CrossRef]
  22. Peracchi, L.M.; Panahabadi, R.; Barros-Rios, J.; Bartley, L.E.; Sanguinet, K.A. Grass lignin: Biosynthesis, biological, roles, and industrial applications. Front. Plant Sci. 2024, 15, 1343097. [Google Scholar] [CrossRef]
  23. Liu, W.; Feng, Y.; Yu, S.; Fan, Z.; Li, X.; Li, J.; Yin, H. The Flavonoid Biosynthesis Network in Plants. Int. J. Mol. Sci. 2021, 22, 12824. [Google Scholar] [CrossRef]
  24. Wang, Y.-K.; Hu, S.-Y.; Xiao, F.-Y.; Dong, Z.-B.; Ye, J.-H.; Zheng, X.-Q.; Liang, Y.-R.; Lu, J.-L. Dihydrochalcones in Sweet Tea: Biosynthesis. Distribution and Neuroprotection Function. Molecules 2022, 27, 8794. [Google Scholar] [CrossRef] [PubMed]
  25. Vinogradova, N.; Vinogradova, E.; Chaplygin, V.; Mandzhieva, S.; Kumar, P.; Rajput, V.D.; Minkina, T.; Seth, C.S.; Burachevskaya, M.; Lysenko, D.; et al. Phenolic Compounds of the Medicinal Plants in an Anthropogenically Transformed Environment. Molecules 2023, 28, 6322. [Google Scholar] [CrossRef] [PubMed]
  26. Yokoyama, R. Evolution of aromatic amino acid metabolism in plants: A key driving force behind plant chemical diversity in aromatic natural products. Philos. Trans. R. Soc. B 2024, 379, 20230352. [Google Scholar] [CrossRef]
  27. Nugroho, L.H.; Verberne, M.C.; Verpoorte, R. Activities of enzymes involved in the phenylpropanoid pathway in constitutively salicylic acid-producing tobacco plants. Plant Physiol. Biochem. 2002, 40, 755–760. [Google Scholar] [CrossRef]
  28. Chaman, M.E.; Copaja, S.V.; Argandona, V.H. Relationships between salicylic acid content, phenylalanine ammonia-lyase (PAL) activity, and resistance of barley to aphid infestation. J. Agric. Food Chem. 2003, 51, 2227–2231. [Google Scholar] [CrossRef] [PubMed]
  29. Chen, Z.; Zheng, Z.; Huang, J.; Lai, Z.; Fan, B. Biosynthesis of salicylic acid in plants. Plant Signal. Behav. 2009, 4, 493–496. [Google Scholar] [CrossRef]
  30. Mesbah, N.M. Industrial Biotechnology Based on Enzymes From Extreme Environments. Front. Bioeng. Biotechnol. 2022, 10, 870083. [Google Scholar] [CrossRef]
  31. Chen, Z.; Song, Y.; Yan, Y.; Chen, W.; Ren, T.; Ma, A.; Li, S.; Jia, Y. Characterization of an epilactose-producing cellobiose 2-epimerase from Clostridium sp. TW13 and reutilization of waste milk. Food Chem. 2025, 480, 143948. [Google Scholar] [CrossRef] [PubMed]
  32. Chen, Z.; Yan, Y.; Wu, Z.; Song, Y.; Xu, J. Expression and Characterization of L-Arabinose Isomerase and Its Enzymatic Recycling of the Expired Milk. Foods 2025, 14, 1873. [Google Scholar] [CrossRef]
  33. Chen, Z.; Song, Y.; Yan, Y.; Wu, Z.; Xu, J. Simulative Fabrication of Milk Fortified with Sialyloligosaccharides and Its Prospective Applications. J. Agric. Food Chem. 2025, 73, 15835–15846. [Google Scholar] [CrossRef]
  34. Zhu, Z.; Chen, R.; Zhang, L. Simple phenylpropanoids: Recent advances in biological activities, biosynthetic pathways, and microbial production. Nat. Prod. Rep. 2024, 41, 6–24. [Google Scholar] [CrossRef]
  35. Viniegra-Gonzalez, G.; Favela-Torres, E.; Aguilar, C.N.; Romero-Gomes, S.J.; Diaz-Godinez, G.; Augur, C. Advantages of fungal enzyme production in solid state over liquid fermentation system. Biochem. Eng. J. 2003, 13, 157–167. [Google Scholar] [CrossRef]
  36. Rajasekaran, R.; Chandrasekaran, R.; Muthuselvam, M. Microbial biotechnology, rapid advances in an area of massive impact. Adv. Biotechnol. 2008, 7, 19–25. [Google Scholar]
  37. Singh, J.; Kaur, G.; Goyal, S.; Sooch, B.S. Purification Approaches of Biocatalyst Applied for Cellulosic Biomass Breakdown. Sep. Purif. Rev. 2024, 53, 475–486. [Google Scholar] [CrossRef]
  38. Ovbude, S.T.; Sharmeen, S.; Kyei, I.; Olupathage, H.; Jones, J.; Bell, R.J.; Powers, R.; Hage, D.S. Applications of chromatographic methods in metabolomics: A review. J. Chromatogr. B 2024, 1239, 124124. [Google Scholar] [CrossRef] [PubMed]
  39. Urh, M.; Simpson, D.; Zhao, K. Chapter 26, Affinity Chromatography: General Methods, Methods in Enzymology; Promega Corporation: Madison, WI, USA, 2009; Volume 463, pp. 417–438. ISSN 0076-6879. [Google Scholar] [CrossRef]
  40. Li, L.; Yan, K.Z.; Huang, S.H.; Pan, S.H.; Chen, G.G.; Liang, Z.Q. A Novel Phenylalanine Ammonia-Lyase Purified from Rhodosporidium paludigenum PT3. Chem. Nat. Compd. 2017, 53, 406–407. [Google Scholar] [CrossRef]
  41. Monge, R.I.; Lara, M.; Lopezmunguia, A. Purification and Stabilization of Phenylalanine Ammonia-lyase from Sporidiobolus-pararoseus. Biotechnol. Tech. 1995, 9, 423–428. [Google Scholar] [CrossRef]
  42. Hao, Z.G.; Charles, D.J.; Yu, L.L.; Simon, J.E. Purification and Characterization of A Phenylalanine Ammonia-Lyase from Ocimum basilicum. Phytochemistry 1996, 43, 735–739. [Google Scholar] [CrossRef]
  43. El-Shore, H.M. Properties of Phenylalanine Ammonia-Lyase from Marrow Cotyledons. Plant Sci. 2002, 162, 1–7. [Google Scholar] [CrossRef]
  44. Nelson, D.L.; Lehninger, A.L.; Cox, M.M. Lehninger, Principles of Biochemistry, 7th ed.; Freeman and Company: New York, NY, USA, 2017; pp. 1–2582. ISBN 978-1-4641-2611-6. [Google Scholar]
  45. Bradford, M.M. A rapid and sensitive method for the quantition of microgram quantities of protein utilizing the principle of protein-dye binding. Anal. Biochem. 1976, 72, 248–254. [Google Scholar] [CrossRef]
  46. Khan, N.U.; Vaidyanathan, C.S. A New Simple Spectrophotometric Assay of Phenylalanine Ammonia-Lyase. Curr. Sci. 1986, 55, 391–393. Available online: https://www.jstor.org/stable/24089938 (accessed on 1 August 2025).
  47. Laemmli, D.K. Cleavage of Structural Proteins during the Assembly of the Head of bacteriophage T4. Nature 1970, 227, 680–685. [Google Scholar] [CrossRef] [PubMed]
  48. Basic and Advanced Molecular Biology Methods, Genomic and Proteomic Analyses, 2nd ed.; Temizkan, G., Arda, N., Eds.; Nobel Medicine Bookstore: Istanbul, Turkey, 2021; ISBN 978-605-335-362-1. [Google Scholar]
  49. Berk, K.N.; Carey, P.M. Data Analysis with Microsoft Excel: Updated for Office 2007; Cengage Learning: Boston, MA, USA, 2009; ISBN 0-495-39178-6. [Google Scholar]
  50. Şirin, S.; Aydaş, S.B.; Aslım, B. Biochemical Evaluation of Phenylalanine Ammonia Lyase from Endemic Plant Cyathobasis fruticulosa (Bunge) Aellen for the Dietary Treatment of Phenylketonuria. Food Technol. Biotechnol. 2016, 54, 296–303. [Google Scholar] [CrossRef]
  51. Lim, H.-W.; Parkl, S.-S.; Lim, C.-J. Purification and Properties of Phenylalanine Ammonia-Lyase from Leaf Mustard. Mol. Cells 1997, 7, 715–720. [Google Scholar] [CrossRef]
  52. Aydaş, S.B.; Şirin, S.; Aslim, B. Biochemical analysis of Centaurea depressa phenylalanine ammonia lyase (PAL) for biotechnological applications in phenylketonuria (PKU). Pharm. Biol. 2016, 54, 2838–2844. [Google Scholar] [CrossRef]
  53. Eissa, H.A.; Ibrahim, W.A. Kinetics of phenylalanine and tyrosine ammonia-lyase enzymes activity of banana fruit (Musa cavendishii L., cv. Enana). Middle East J. Appl. Sci. 2018, 8, 680–689. [Google Scholar]
  54. Whetten, R.W.; Sederoff, R.R. Phenylalanine ammonia-lyase from loblolly pine: Purification of the enzyme and isolation of complementary DNA clones. Plant Physiol. 1992, 98, 380–386. [Google Scholar] [CrossRef] [PubMed]
  55. MacDonald, M.J.; D’Cunha, G.B. A modern view of phenylalanine ammonia lyase. Biochem. Cell Biol. 2007, 85, 273–282. [Google Scholar] [CrossRef] [PubMed]
  56. Li, G.; Song, C.; Manzoor, M.A.; Li, D.; Cao, Y.; Cai, Y. Functional and kinetics of two efficient phenylalanine ammonia lyase from Pyrus bretschneideri. BMC Plant Biol. 2023, 23, 612. [Google Scholar] [CrossRef]
  57. Guerrero-Perez, M.O.; Patience, G.S. Experimental methods in chemical engineering: Fourier transform infrared spectroscopy-FTIR. Can. J. Chem. Eng. 2020, 98, 25–33. [Google Scholar] [CrossRef]
  58. Skoog, D.A.; Holler, F.J.; Crouch, S.R. Principles of Instrumental Analysis, 7th ed.; Cengage Learning: Boston, MA, USA, 2016; ISBN 978-1-305-57721-3. [Google Scholar]
  59. Amersham Pharmacia Biotech. Affinity Chromatography, Principles and Methods, edition AC 18-1022-29, 2007. Available online: https://b3p.it.helsinki.fi/download/GE_Protein_Purification_Handbooks/Affinity_Chromatography_Handbook.pdf (accessed on 1 August 2025).
  60. Arafa, A.; Abdel-Ghani, A.; El-Dahmy, S.; Abdelaziz, S.; El-Ayouty, Y.; El-Sayed, A. Purification and Characterization of Anabaena flos-aquae Phenylalanine Ammonia-Lyase as a Novel Approach for Myristicin Biotransformation. J. Microbiol. Biotechnol. 2020, 30, 622–632. [Google Scholar] [CrossRef]
  61. Goldson-Barnaby, A.; Scaman, C.H. Purification and characterization of Phenylalanine ammonia lyase from Trichosporon cutaneum. Enzym. Res. 2013, 2013, 670702. [Google Scholar] [CrossRef]
  62. Zhu, L.; Cui, W.; Fang, Y.; Liu, Y.; Gao, X.; Zhou, Z. Cloning, expression and characterization of phenylalanine ammonia-lyase from Rhodotorula glutinis. Biotechnol. Lett. 2013, 35, 751–756. [Google Scholar] [CrossRef] [PubMed]
  63. Cunha, A. Purification, characterization and induction of L-phenylalanine ammonia-lyase in Phaseolus vulgaris. Eur. J. Biochem. 1988, 178, 243–248. [Google Scholar] [CrossRef] [PubMed]
Scheme 1. Synthesis mechanism of S-4B-TACA affinity gel.
Separations 12 00241 sch001
Figure 1. Effect of Tris-HCl buffer concentration (mM) on RCL-PAL activity (assay at 30 °C, pH: 8.8, [L-Phe]: 20 mM).
Separations 12 00241 g001
Figure 2. Effect of pH on RCL-PAL activity (assay at 30 °C, [Tris HCI]: 0.1 M, [L-Phe]: 20 mM).
Separations 12 00241 g002
Figure 3. Effect of temperature on RCL-PAL activity (assay at [Tris HCI]: 0.1 M, pH: 7, [L-Phe]: 20 mM).
Separations 12 00241 g003
Figure 4. Graph of 1/[L-Phe] (mM) against 1/RCL-PAL activity.
Separations 12 00241 g004
Figure 5. FT-IR analysis of the original S-4B-TACA affinity gel.
Separations 12 00241 g005
Figure 6. Elution graph of RCL-PAL purified by S-4B-TACA affinity gel.
Separations 12 00241 g006
Figure 7. Standard linear graph used in the determination of protein amount.
Separations 12 00241 g007
Figure 8. Standard linear graph used in the determination of RCL-PAL activity.
Separations 12 00241 g008
Figure 9. The images of (a) RCL-PAL extract and (b) RCL-PAL affinity eluate in SDS-PAGE.
Separations 12 00241 g009
Figure 10. Investigation of the storage stability of RCL-PAL.
Separations 12 00241 g010
Table 1. Components and chemical amounts of 12% resolving gel used in SDS-PAGE.
Component of the GelVolume
Acrylamide/bisacrylamide (30%, v/v)2.80 mL
Distilled water2.24 mL
1.5 M Tris-HCI (pH: 8.8) buffer solution1.82 mL
SDS: (10%, w/v)0.07 mL
TEMED7.00 μL
APS: (10%, w/v)70.00 μL
Table 2. Components and chemical amounts of the sample buffer in SDS-PAGE.
Component of the Sample BufferAmount
Bromophenol blue, mg3.00
1.0 M Tris BASE (pH: 6.8), mL3.75
SDS: (10%, w/v), g1.20
Glycerol, mL6.00
β-mercaptoethanol, mL1.00
Table 3. Purification table of RCL-PAL isolated by S-4B-TACA affinity gel.
Purification
Step
Volume
(mL)
Activity
(* mU/mL)
Total Activity (* mU)Protein
(μg/mL)
Total Protein
(μg)
Specific Activity
(mU/mg)
Yield
%
Purification Degree
Crude extract10.0267.92679.367.4673.73977.2100.01.0
Affinity
Chromatography
2.050.8101.60.71.377,341.43.819.4
* mU: milienzyme unit.
Table 4. Average, SD, and variance values of RCL-PAL activities measured each week.
Time Factor
(Week)
Number of MeasurementsAverage ± SDVariance
130.682 ± 0.0086.3 × 10−5
230.716 ± 0.0086.3 × 10−5
330.688 ± 0.0052.3 × 10−5
430.452 ± 0.0472.2 × 10−3
530.446 ± 0.0031.0 × 10−5
630.365 ± 0.0173.0 × 10−4
730.319 ± 0.0031.0 × 10−5
830.275 ± 0.0064.0 × 10−5
930.278 ± 0.0031.0 × 10−5
SD: standard deviation.
Table 5. Statistical analysis of RCL-PAL stability in terms of RCL-PAL activities measured each week (α = 0.05, Fcritical = 5.14).
Measurement NoWeek 1Week 2Week 3Fcalculatedp Value
10.6740.7080.683 1.97 × 10⁻³
20.6890.7240.69320.95
30.6820.7160.688
Measurement NoWeek 4Week 5Week 6Fcalculatedp Value
10.5000.4430.383 1.89 × 10⁻²
20.4050.4490.3488.25
30.4520.4460.365
Measurement NoWeek-7Week-8Week-9Fcalculatedp Value
10.3160.2810.281 3.2 × 10⁻⁵
20.3230.2690.27591.50
30.3190.2750.278
Disclaimer/Publisher’s Note: The statements, opinions and data contained in all publications are solely those of the individual author(s) and contributor(s) and not of MDPI and/or the editor(s). MDPI and/or the editor(s) disclaim responsibility for any injury to people or property resulting from any ideas, methods, instructions or products referred to in the content.