Article

Enhancing Copper Leaching from Refractory Copper Oxide Ore Using Organic Cationic Surfactant

School of Resources and Safety Engineering, University of Science and Technology Beijing, Beijing 100083, China
*
Author to whom correspondence should be addressed.
Separations 2025, 12(8), 212; https://doi.org/10.3390/separations12080212
Submission received: 3 July 2025 / Revised: 31 July 2025 / Accepted: 8 August 2025 / Published: 12 August 2025
(This article belongs to the Special Issue Advances in Novel Beneficiation Technology of Critical Minerals)

Abstract

The copper oxide ore in Zambia exhibits complex mineralogical characteristics, with copper primarily occurring in mica. The local hydrometallurgical plant employs heating–agitation acid leaching, which is hindered by a low leaching rate and prolonged leaching period, resulting in high energy consumption. To enhance the copper leaching efficiency, a systematic study was conducted on the use of organic cationic surfactants to enhance the leaching of the copper oxide ore. The results indicated that the primary copper-bearing mineral in the raw ore is cupriferous biotite, which is the reason for the difficulty in leaching. Under optimal conditions: a sulfuric acid dosage of 45 kg/t, a CTAB dosage of 75 g/t, a leaching temperature of 65 °C, a liquid-to-solid ratio of 2:1, and a leaching time of 120 min, the copper leaching rate reached 78.32%. Compared to the optimal result of regular heating–agitation acid leaching, this approach increased the copper leaching rate by 3.06%, reduced the leaching time by 80 min, and lowered leaching energy consumption without destroying the structure of cupriferous biotite. Mechanistic studies show that organic cations in CTAB neutralize excess anions, thereby weakening the electrostatic Coulomb forces between the interlayer cations and the hexagonal structure. This increases the interlayer spacing of biotite, facilitating the entry of H+ from sulfuric acid into the interlayer. The H+ then reacts with the copper in the biotite, enhancing the copper leaching rate and reducing leaching time. Because CTAB has high degradability, it will not cause persistent pollution to the environment. The use of CTAB as a leaching aid can reduce the energy consumption of heating–agitation acid leaching and reduce the heating cost per ton of ore by USD 6.11–9.36.

1. Introduction

The African continent is rich in copper resources, of which the Zambia copper belt is one of the world’s famous renowned copper-producing regions. The copper ore reserves in this belt total approximately 1.6 billion tons, accounting for about 15% of the global copper reserves [1,2]. As an example, a significant portion of copper oxide resources is located near the surface of the earth. The average copper grade in these ores is relatively high, but the ores are heavily weathered, with a complex copper occurrence state, including a high proportion of combined copper oxide. A large portion of the copper is found in the mica layer, forming cupriferous mica [3]. It is difficult to reach the ideal recovery by a conventional metallurgical process, which is suitable for the acid leaching–solvent extraction–electrolysis process. Currently, local hydrometallurgical plants use a heating–agitation acid leaching process, but the leaching rate remains below 75%. Moreover, this process requires high-temperature steam produced by electric boilers to heat the slurry to temperatures between 55 and 68 °C, and the agitation time extends up to 240–360 min [4,5,6]. Due to limited local power resources and high electricity costs, the production costs remain high. Therefore, improving the copper leaching rate, reducing the leaching temperature, shortening the leaching time, and controlling production costs are crucial for enhancing both the efficiency and economic viability of local enterprises [7,8].
Currently, research on copper extraction from mica is limited. The primary methods for extracting copper from mica involve concentrated sulfuric acid pre-acidification and heating leaching. Manchisi et al. [9] investigated cupriferous mica-type copper oxide deposits in Chingola, Zambia, conducting column immersion tests. Their results indicated that high-concentration sulfuric acid can destroy the mica structure, facilitating copper release. While this process significantly improves copper recovery, it has not been adopted industrially due to excessive acid consumption and challenges in continuous production. Whyte et al. [10] employed a two-stage leaching process to treat refractory copper oxide ores in Zambia’s Konkola and Chingola regions. The process first involves room-temperature leaching (around 30 °C), followed by a second leaching stage at 65 °C with an increased sulfuric acid concentration. This two-stage method enhances the leaching rate of copper from refractory cupriferous mica, achieving a final copper leaching rate of 75–80%. However, the process suffers from high acid and energy consumption. Yu et al. [11] investigated the use of ultrasonic-assisted acid leaching to treat cupriferous mica from Zambia. The results demonstrated that ultrasonic waves effectively disrupted the cupriferous mica structure, increasing its specific surface area and enhancing contact with sulfuric acid, thereby promoting copper leaching. Additionally, ultrasonic pretreatment accelerated the leaching reaction rate and reduced the required dosage of lixiviant. Nevertheless, the energy propagation efficiency of ultrasonic waves is low in ore piles, and the issue of large-scale industrial ultrasonic generators remains unresolved [12,13]. Li et al. conducted an enhanced leaching study on cupriferous mica-type copper oxide ore from Africa. The results indicated that the addition of calcium fluoride disrupts the crystal structure of cupriferous biotite, facilitating a direct reaction between sulfuric acid and copper within these minerals, thereby significantly improving the copper leaching rate [7]. However, some studies have shown that when fluoride ions degrade mica minerals, a significant amount of impurity elements enters the leaching solution. These impurities typically have a detrimental effect on subsequent extraction-electrowinning processes. Therefore, the industrial application of calcium fluoride requires further investigation [14,15]. Recently, surfactants have gained significant attention in hydrometallurgy. Studies have demonstrated that surfactants can enhance the leaching of target elements [16,17,18]. Consequently, further research into surfactant-enhanced leaching of cupriferous mica-type copper oxide ores is warranted. In addition, the ore is classified as high-bond copper oxide ore, making the investigation of the enhanced leaching process using organic cationic surfactants particularly significant. This approach not only facilitates the rational optimization of leaching parameters and elucidates the dissolution mechanisms of copper-bearing minerals, but also achieves a balance between heating costs and time efficiency in industrial applications [19,20].
Layered silicate minerals, such as biotite and muscovite, exhibit weak interaction forces between interlayer ions and intralayer atoms. The character allows organic cations to exchange with interlayer ions through processes such as insertion, intercalation, or pillaring, without altering the layer structure. This phenomenon is referred to as organic intercalation [21,22,23]. In the field of inorganic non-metallic materials, organic intercalation is commonly employed to modify layered silicate minerals, such as vermiculite, bentonite, and other similar minerals. Due to the strong electronegativity between the mica layers, it is difficult for organic anionic surfactants or non-ionic surfactants to enter the mica layers effectively. Therefore, organic cationic surfactants are often used for intercalation treatment [24]. The modification involves the exchange of organic cations with interlayer cations, which are then incorporated into the interlayer, acting as a pillar to support the structure. This process increases the interlayer spacing of these minerals, thereby enhancing their expansibility, adsorption capacity, and ion exchange capacity [25]. Ismail et al. [26] used CTAB (Cetyltrimethylammonium bromide) as an intercalator, expanding the layer spacing of muscovite from 0.99 nm to 2.82 nm. Similarly, Wei et al. [27] intercalated hydromica with octadecyl trimethylammonium ion, resulting in an increase in the basic layer spacing to 2.80 nm. Numerous studies have demonstrated that organic intercalation can effectively expand mica to a certain extent [28,29,30].
The study of metal extraction from mica, particularly through pillaring or intercalation, primarily focuses on the extraction of potassium from mica. Research by Hu et al. demonstrated that the potassium leaching rate can be enhanced by adding hydrochloric acid, sodium fluorosilicate, and CTAB to potassium-containing hydromica, followed by heating and stirring. Mechanistic studies show that CTAB can intercalate into the mica layers under specific temperature conditions, which increases the interlayer spacing of the hydromica structure, thereby improving the potassium leaching rate [31]. Yao et al. have shown that organic cations can enter the interlayer of hydromica, acting as pillars and expanding the interlayer spacing. Using this method, 98% of potassium can be extracted from potassium-containing hydromica associated with collophane-rich shale, yielding highly effective results. This demonstrates the feasibility of using organic cationic surfactants for metal extraction from mica [32].
The industrial application of organic cationic surfactants is often constrained by their high cost, making the efficient recovery of these surfactants a matter of considerable importance. Currently, the common methods of recycling surfactants include ultrafiltration, coagulation–sedimentation, foam separation, and adsorption. Ultrafiltration relies on the high selectivity of ultrafiltration membranes to separate surfactants from solution. The substance with a small relative molecular mass can pass through the ultrafiltration membrane, and various soluble macromolecular organics are retained, thereby achieving the purpose of recovering the surfactant [33]. However, this method may significantly impede solution flow, rendering it unsuitable for operations involving large volumetric throughput. The coagulation sedimentation involves the addition of coagulants to aggregate surfactants and micro-suspended particulates in the solution, followed by recovery through sedimentation, filtration, separation, and purification. Despite its effectiveness in certain contexts, this approach often introduces extraneous ions, so it is not suitable for the copper hydrometallurgical process [34]. Foam separation employs compressed air to generate a profusion of bubbles within the treatment solution. Surfactants present in the water are preferentially adsorbed at the interface between dispersed and continuous phases, allowing for their effective isolation. Although this method entails high energy consumption and necessitates the installation of specialized equipment, it has the characteristics of high efficiency and cleanliness [35,36]. The adsorption utilizes porous solid filter materials to recover surfactants via physical entrapment or electrostatic attraction. Common adsorbent materials include activated carbon, fiber balls, resins, and other materials with strong adsorbability. Among these, activated carbon and fiber balls are extensively used in copper hydrometallurgy, where they efficiently capture water-soluble surfactants, thereby enabling both recovery of the surfactant and purification of the leaching solution [37]. Therefore, the recovery of these surfactants from the leaching system is feasible from theoretical analysis.
This research focused on a refractory copper oxide ore from Africa, investigating the enhancement of leaching through the use of organic cationic surfactants. Firstly, the process mineralogy characteristics and ore leaching characteristics of the raw ore were studied. Secondly, the effects of various factors, including the type and dosage of surfactants, and the effect of surfactant addition on leaching time, were studied. Finally, the mechanisms underlying the enhancement of leaching by organic cationic surfactant were analyzed. The research successfully achieved its technological goals of increasing the leaching rate and reducing leaching time. Furthermore, the findings align with sustainable development and cleaner production principles, offering a novel approach for the efficient utilization of cupriferous mica-type refractory copper oxide ores.

2. Materials and Methods

2.1. Materials

2.1.1. Raw Ore Samples

The refractory copper oxide samples used in this research were provided by a hydrometallurgical plant in Zambia. It was collected from the overflow port of the cyclone, with particle distribution rate of the −0.074 mm fraction accounting for 69.11 wt%. After mixing and shrinking the ore, representative samples were selected for mineralogical analysis. The remaining samples were used for heating–agitation acid leaching.
A process mineralogical analysis was conducted on the raw ore sample. The results of the chemical multi-element analysis are presented in Table 1. The primary metal element with recovery potential in the raw ore is copper, with a content of 1.54 wt%. Other metal elements are present at relatively low concentrations and do not hold economic value for recovery. Chemical analysis was employed to investigate the existing state of copper in the copper oxide ore. As shown in Table 2, the ore exhibits a high degree of oxidation, with a total distribution rate of 86.14 wt% for copper oxide. Specifically, the distribution rate of combined copper oxide is 58.94 wt%. The total distribution rate of copper sulfide is 13.67 wt%, which includes 5.12 wt% primary copper sulfide and 8.55 wt% secondary copper sulfide, indicating a high combined ratio of copper oxide in this ore. Representative ore samples were analyzed using an X-ray diffractometer, and the XRD spectrum is illustrated in Figure 1. Analysis of the characteristic peaks from different minerals in the XRD spectrum reveals that the primary constituent minerals in the raw ore include mica, quartz, and feldspar, with the content of other minerals being relatively low.

2.1.2. Leaching Reagents

The leaching reagents included analytical-grade concentrated sulfuric acid and distilled water. The organic cationic surfactants used in the experiments were dodecyl trimethyl ammonium bromide (DTAB), tetradecyl trimethyl ammonium bromide (TTAB), cetyl trimethyl ammonium bromide (CTAB), dodecyl dimethyl ammonium chloride (DDAC), and dodecyl dimethyl amine oxide (DDAO). Table 3 shows the information of several organic cationic surfactants.

2.2. Experimental Procedure

The ore was dried at a low temperature, mixed, and further processed to obtain samples for the leaching experiments. The leaching tests were conducted in a constant-temperature water bath with stirring. The agitator speed was maintained at 400 r/min, and a 250 mL conical flask served as the reaction vessel. The water bath was heated to the predetermined temperature, and 50 g of the ground ore was added to the conical flask. Distilled water, organic cationic surfactant, and concentrated sulfuric acid were added sequentially from separate flasks to initiate the leaching. Upon completion of the experiment, the residue was filtered using a filtration apparatus and washed 3–5 times with distilled water. The filtered residue was then dried, evenly sampled, dissolved by mixed acid, and analyzed via ICP-OES (Inductively Coupled Plasma Optical Emission Spectrometry). The leaching rate of copper from the ore was calculated according to Equation (1). The process flowsheet for the experiment is shown in Figure 2.
r = 1 m 2 × β 2 m 1 × β 1 × 100 %
where r represents copper leaching rate (%); β1 (wt%) and m1 (g) represent the copper grade and mass of the sample before leaching, respectively; and β2 (wt%) and m2 (g) represent the copper grade and mass of the leaching residue after leaching [38], respectively.

2.3. Analysis and Characterization

(1) The chemical composition of the refractory copper oxide ore was analyzed using ICP-OES and an atomic absorption spectrometer (AAS, Z-2000, Hitachi, Tokyo, Japan). Microstructural images and energy spectroscopy of the raw ore and residue were obtained using scanning electron microscopy–energy-dispersive spectroscopy (SEM−EDS, EVO18, Gemini, Carl Zeiss, Jena, Germany). To further investigate the microstructure of cupriferous mica and estimate the thickness of its lattice, the crystal structure of cupriferous mica was examined using transmission electron microscopy (TEM, JEM-2100F, JEOL, Tokyo, Japan). The mineral composition of the representative ore samples was analyzed by using the process mineralogy automatic analysis system (BPMA) of Beijing Mining and Metallurgy Technology Group Co., Ltd., Beijing, China.
(2) The phases of the raw ore samples and residue were analyzed by X-ray diffraction (XRD, Rigaku-RA, Tokyo, Japan) at a scanning range of 5–90° and a scanning rate of 5°/min. The relative contents of main minerals were calculated quantitatively using the Rietveld full-spectrum fitting principle in the BGMN 2023 software. The mineral content is related to the scale factor S in the structural refinement as follows [39]:
W i = S i ρ i V i / j = 1 n S j ρ j V j
where W is the content of a mineral, S is the scale factor, ρ is the density, and V is the cell volume.
In addition, based on the XRD data of the test samples, the Bragg equation was used to calculate the change in interlayer spacing of mica under different leaching conditions. The analysis aimed to elucidate the leaching mechanism of the copper oxide ore enhanced by organic cationic surfactants [40].
2 d s i n θ = n λ
where d is the basal interlayer spacing, θ is the angle between the incident ray and the scattering planes, n is the integer determined by the order given, and λ is the length of the incident wave (λ = 0.15418 nm).
(3) The IS50 Fourier-transform infrared spectrometer (FTIR, Thermo Fisher Scientific, Waltham, MA, USA) was used to analyze the residue in the surfactant-enhanced leaching tests and pure biotite. The analysis was used to confirm that the surfactant could be adsorbed onto the biotite in the ore. The instrument operates within a wave number range of 4000 to 400 cm−1. To minimize detection errors caused by surfactant adsorption on the surface of the leaching residue, the residue containing CTAB was repeatedly washed with distilled water.
(4) Organic-intercalated cupriferous mica was extensively analyzed using a time-of-flight secondary ion mass spectrometer (TOF-SIMS, ION-TOF GmbH, Münster, Germany). The device is known for its high sensitivity and operates by bombarding the sample surface with primary ions, generating secondary ions. The flight time of these secondary ions to the detector correlates with their mass, enabling depth-specific analysis of the sample. The primary objective of using this equipment in the study was to demonstrate that organic cations can penetrate the interior of cupriferous mica, specifically adsorbing between its layers. During the analysis, it is essential to identify a biotite particle with a flat surface. The raster size is 50 μm × 50 μm, and the scanning position is selected at the center of the leaching residue particles. The sputter ion is Bi3+, with an energy of 30 keV, and the analysis depth is 2 μm.
(5) To investigate the effect of CTAB addition on the crystal structure of mica, molecular simulation methods were employed to analyze the changes in mica cell parameters resulting from the insertion of organic cations. First, the molecular model of CTAB was constructed using the Visualizer module of the Materials Studio 2024 software, followed by structure optimization with the CASTEP module. The Monkhorst–Pack method was applied to sample points in the Brillouin zone, using a K-point grid of 4 × 2 × 1. Structural optimization and electronic property calculations were subsequently performed. The geometric optimization of the mica crystal structure was carried out using the BFGS algorithm, with a total energy tolerance of 2 × 10⁻⁵ eV/atom, a maximum force tolerance of 0.05 eV/Å, a maximum stress of 0.1 GPa, and a maximum displacement of 0.002 Å.

3. Results and Discussion

3.1. Mineralogical Characterization of Raw Ore

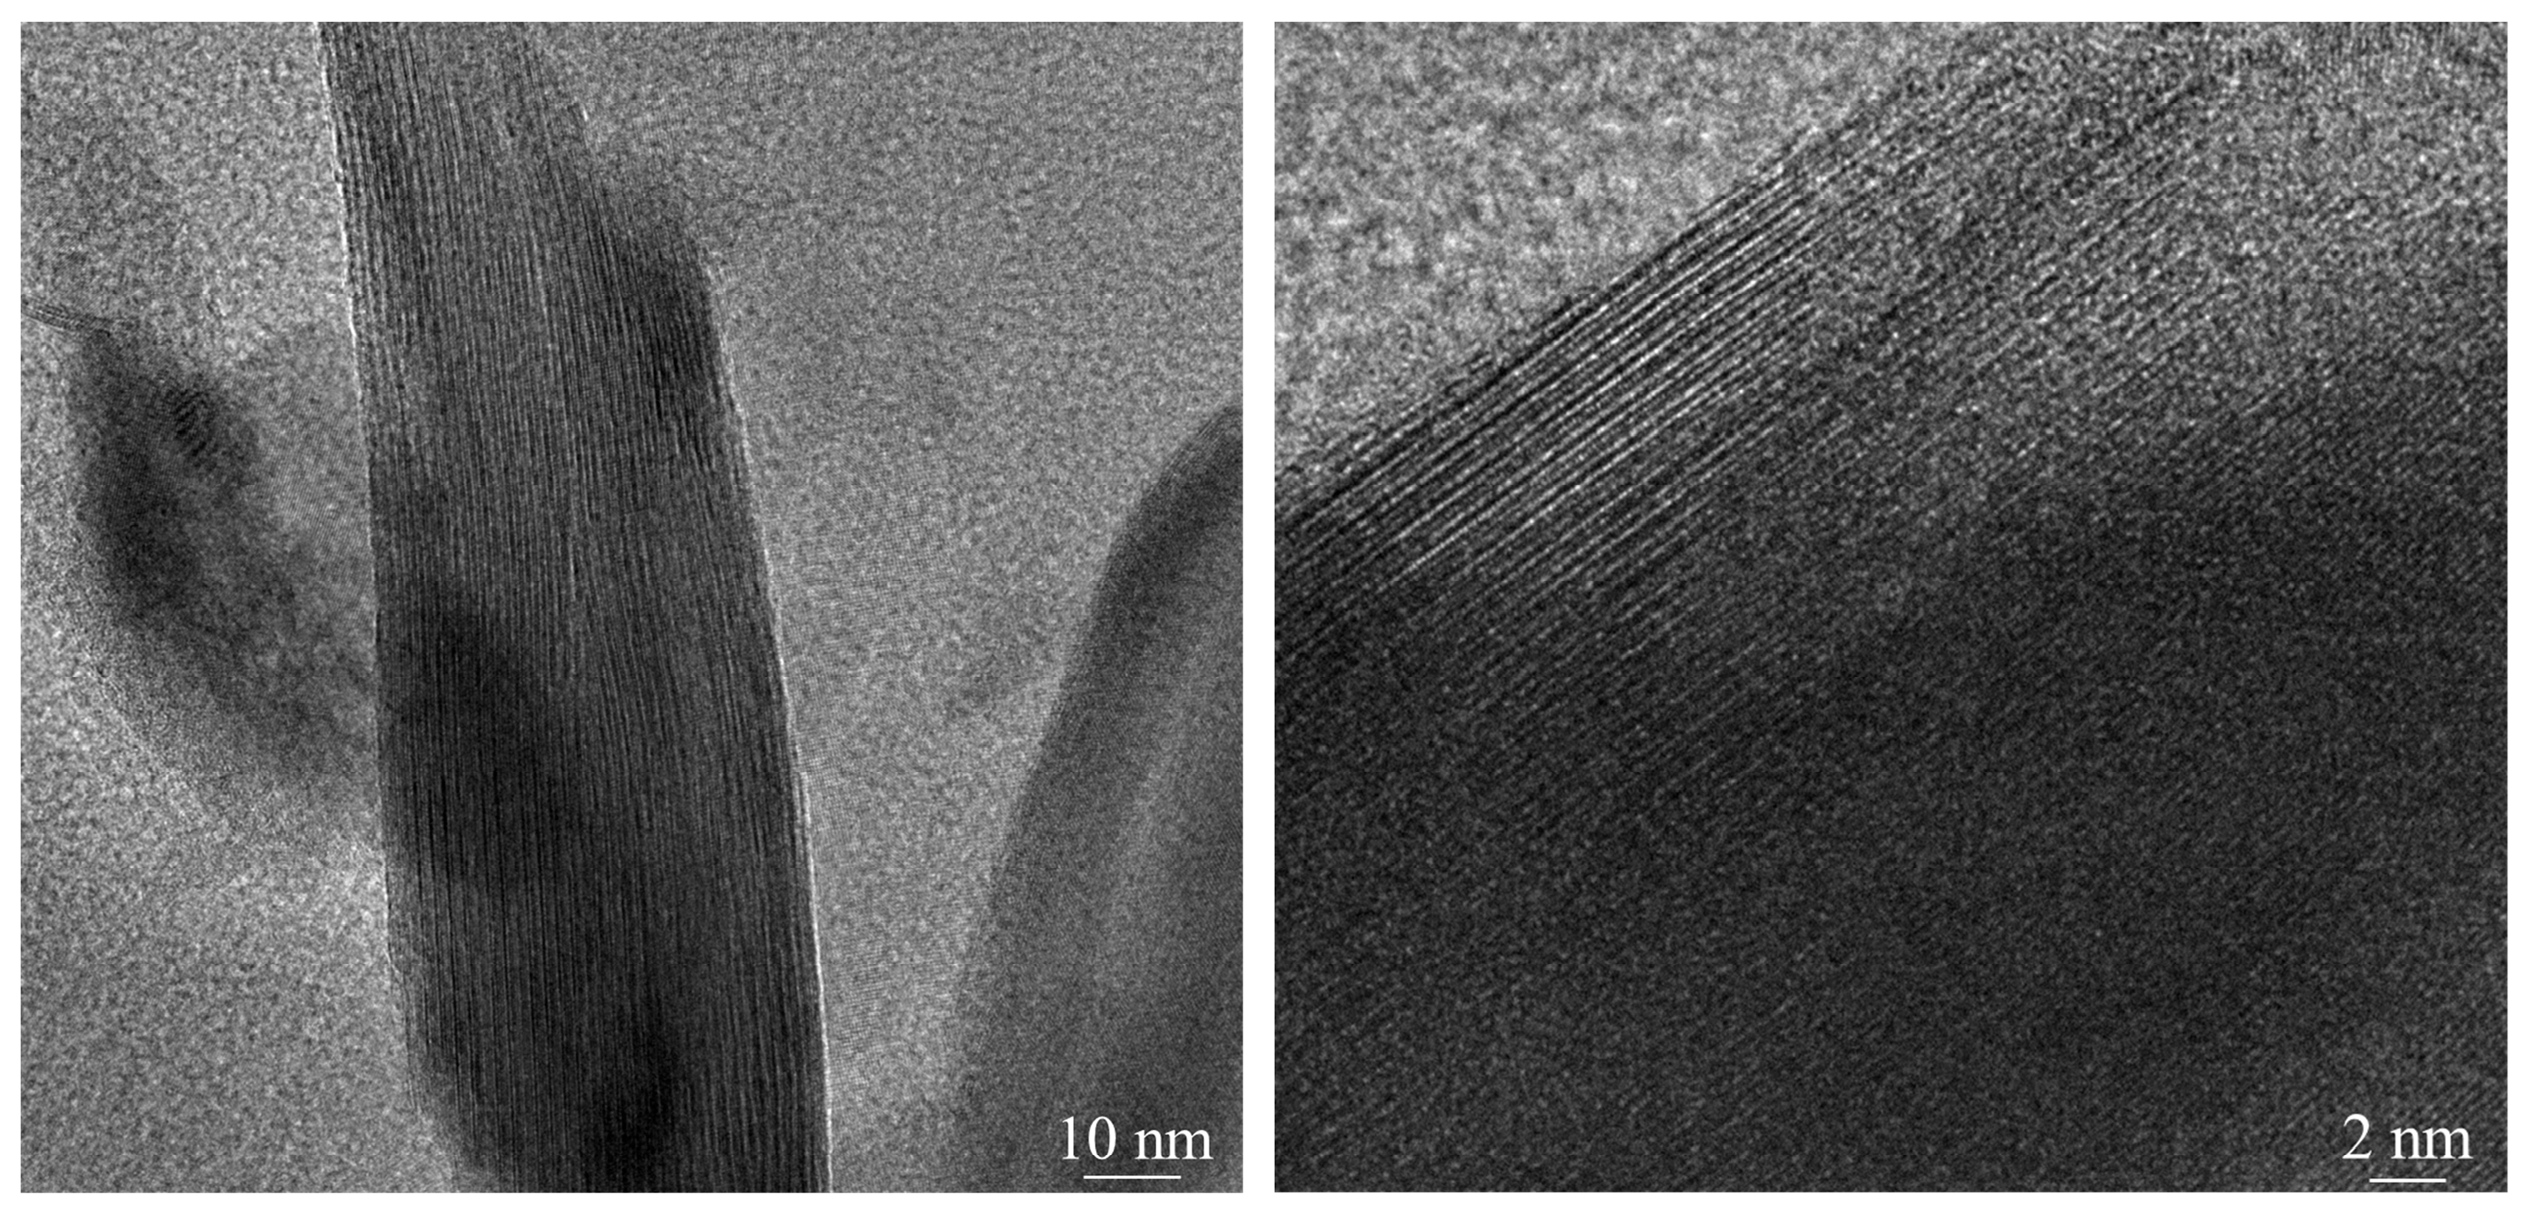
Table 4 presents the BPMA analysis results for the raw ore. In addition to quartz, mica, and feldspar detected by XRD, the ore contains small amounts of vermiculite, chlorite, and kaolinite. The mica group mainly includes biotite and sericite. Copper-bearing minerals present in the ore include tenorite, with minor amounts of cuprite, libethenite, and brochantite. Sulfide copper is present in negligible quantities, accounting for only 0.10 wt%, resulting in significantly lower cumulative copper grades compared to the total copper content of the ore. This discrepancy is attributed to the detection limits of the BPMA analysis, which prevent the identification of copper associated with mica. The SEM-EDS analysis results shown in Figure 3a reveal that copper is a major constituent element in biotite, along with K, Si, Mg, Al, Fe and O. The energy spectrum analysis of representative point of the raw ore shown in Figure 3b,c confirms that Cu primarily exists in biotite, whereas there is no Cu detected in sericite. Figure 4 shows the high-resolution micro-morphology of cupriferous biotite along its cleavage plane. It can be confirmed that the cupriferous biotite exhibits a layered structure, and the thickness of each unit lattice is much less than 0.5 nm.
To investigate the primary mineral types and their distributions across different particle sizes of the ground raw ores, the representative test samples were subjected to particle size analysis using standard sieves with various mesh sizes, resulting in eight distinct particle size fractions. The samples were then dried, weighed to determine their respective yields, and analyzed using XRD to examine the representative samples from each fraction. Data were refined using BGMN software for the quantitative analysis of the major mineral types and their content across the different particle sizes. It can be indicated from Figure 5a that the yield of fine-grained and coarse-grained fractions is higher, whereas the yield of medium-grained fractions is lower. Figure 5b illustrates that the primary minerals across the various particle size fractions of the raw ore include six types, with quartz, biotite, sericite, and feldspar exhibiting relatively high contents. Biotite is present in all particle size fractions, with the highest relative content observed in the −0.106 + 0.074 mm fraction. As the particle size decreases, the relative content of biotite also decreases. These results suggest that biotite has relatively poor grindability, as higher relative contents are observed in the coarser particle fractions.

3.2. Study on Leaching Characteristics of Raw Ore

3.2.1. Sulfuric Acid Dosage

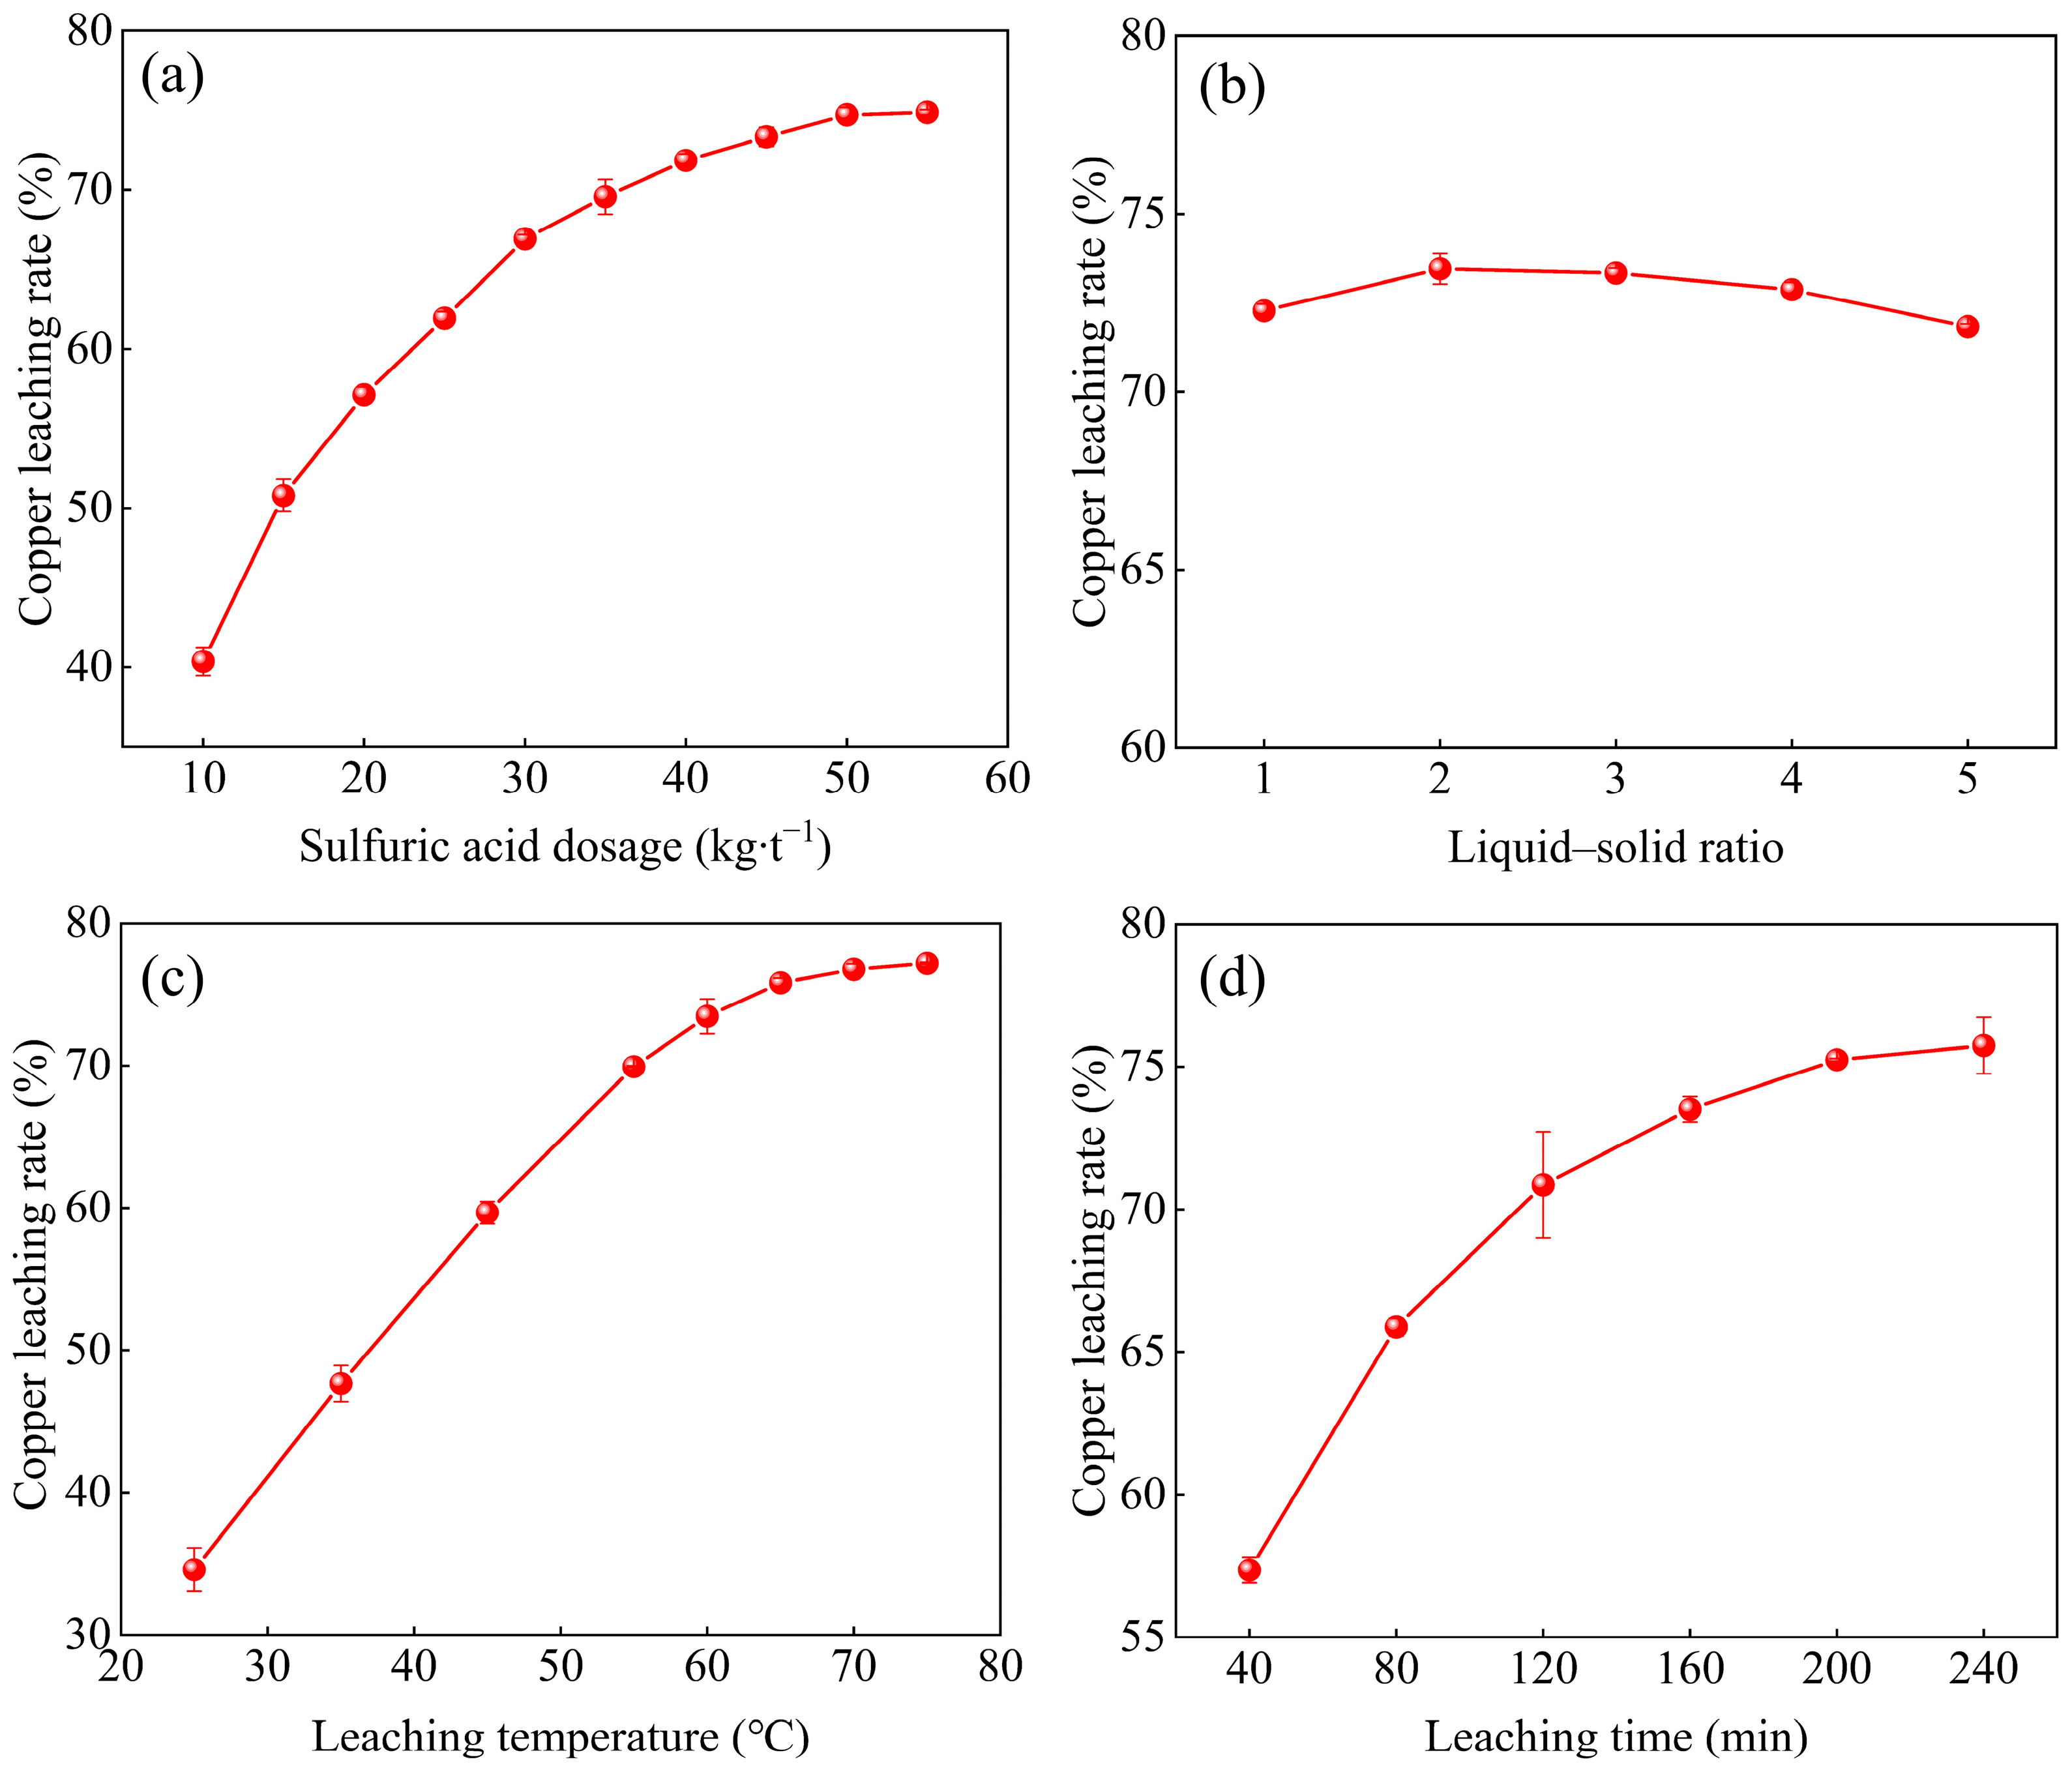
To investigate the effect of sulfuric acid dosage on copper leaching rate, experiments were conducted at a leaching temperature of 60 °C and a leaching time of 240 min, with a liquid-to-solid ratio of 3:1. As shown in Figure 6a, the copper leaching rate increased with increasing sulfuric acid dosage. At a dosage of 45 kg/t, the leaching rate of copper reached 73.34%. However, further increases in sulfuric acid dosage did not result in a significant change in copper leaching rate. These results suggest that an adequate sulfuric acid dosage is essential to achieve optimal leaching efficiency. The c(H+) (concentration of H+) between the leaching solution and the mineral particle surface is a crucial factor. A lower c(H+) not only reduces the leaching rate but also decreases the overall leaching efficiency. Therefore, the optimal sulfuric acid dosage for this ore is 45 kg/t.

3.2.2. Liquid–Solid Ratio

The effect of slurry liquid-to-solid ratio on copper leaching rate was investigated under the following conditions: sulfuric acid dosage of 45 kg/t, leaching temperature of 60 °C, and leaching time of 240 min. As shown in Figure 6b, at a liquid–solid ratio of 1:1, the copper leaching rate was 72.25%. There was minimal variation in copper leaching rate with liquid–solid ratios of 2:1 and 3:1, where the leaching rate reached 73.46% at 2:1. However, further increases in the liquid-to-solid ratio led to a decline in the copper leaching rate. At a ratio of 5:1, the copper leaching rate decreased to 70.83%. This decline is attributed to the reduction in sulfuric acid concentration at low slurry concentrations, which lowers the leaching rate. Conversely, high slurry concentrations may deteriorate the leaching environment, hindering the reaction between the lixiviant and the target mineral. Based on these observations, the optimal slurry liquid-to-solid ratio for the leaching is determined to be 2:1.

3.2.3. Leaching Temperature

To investigate the effect of leaching temperature on the copper leaching rate, leaching experiments were conducted under conditions of a sulfuric acid dosage of 45 kg/t, a liquid-to-solid ratio of 2:1, and a leaching time of 240 min. The results shown in Figure 6c indicate that temperature significantly influences copper leaching, with the leaching rate increasing noticeably as temperature rises. Specifically, at a leaching temperature of 65 °C, the copper leaching rate reached 75.82%. This improvement is primarily attributed to the increased energy available in the ore at higher temperatures, which facilitates the disruption or weakening of chemical bonds within the minerals. Additionally, higher temperatures promote deeper penetration of the sulfuric acid into the particles, enhancing reaction efficiency [41]. However, the increasing trend in the copper leaching rate was not obvious with further increases in the temperature. Therefore, the optimal leaching temperature for subsequent experiments was determined to be 65 °C.

3.2.4. Leaching Time

To investigate the effect of leaching time on the copper leaching rate, experiments were conducted under conditions of a sulfuric acid dosage of 45 kg/t, a liquid-to-solid ratio of 2:1, and a leaching temperature of 65 °C. As shown in Figure 6d, the copper leaching rate increased with the extension of time. During the initial 80 min, the leaching rate was notably rapid, showing a clear upward trend. However, after 120 min, the rate of increase in copper leaching began to slow down. At a leaching time of 200 min, the copper leaching rate reached 75.26%, with no significant change observed upon further extension of the leaching time. Prolonged leaching time results in reduced processing efficiency and higher production costs. Therefore, the optimal leaching time for the copper oxide ore was determined to be 200 min.

3.2.5. Analysis of the Reasons for the Difficulty in Leaching of Raw Ore

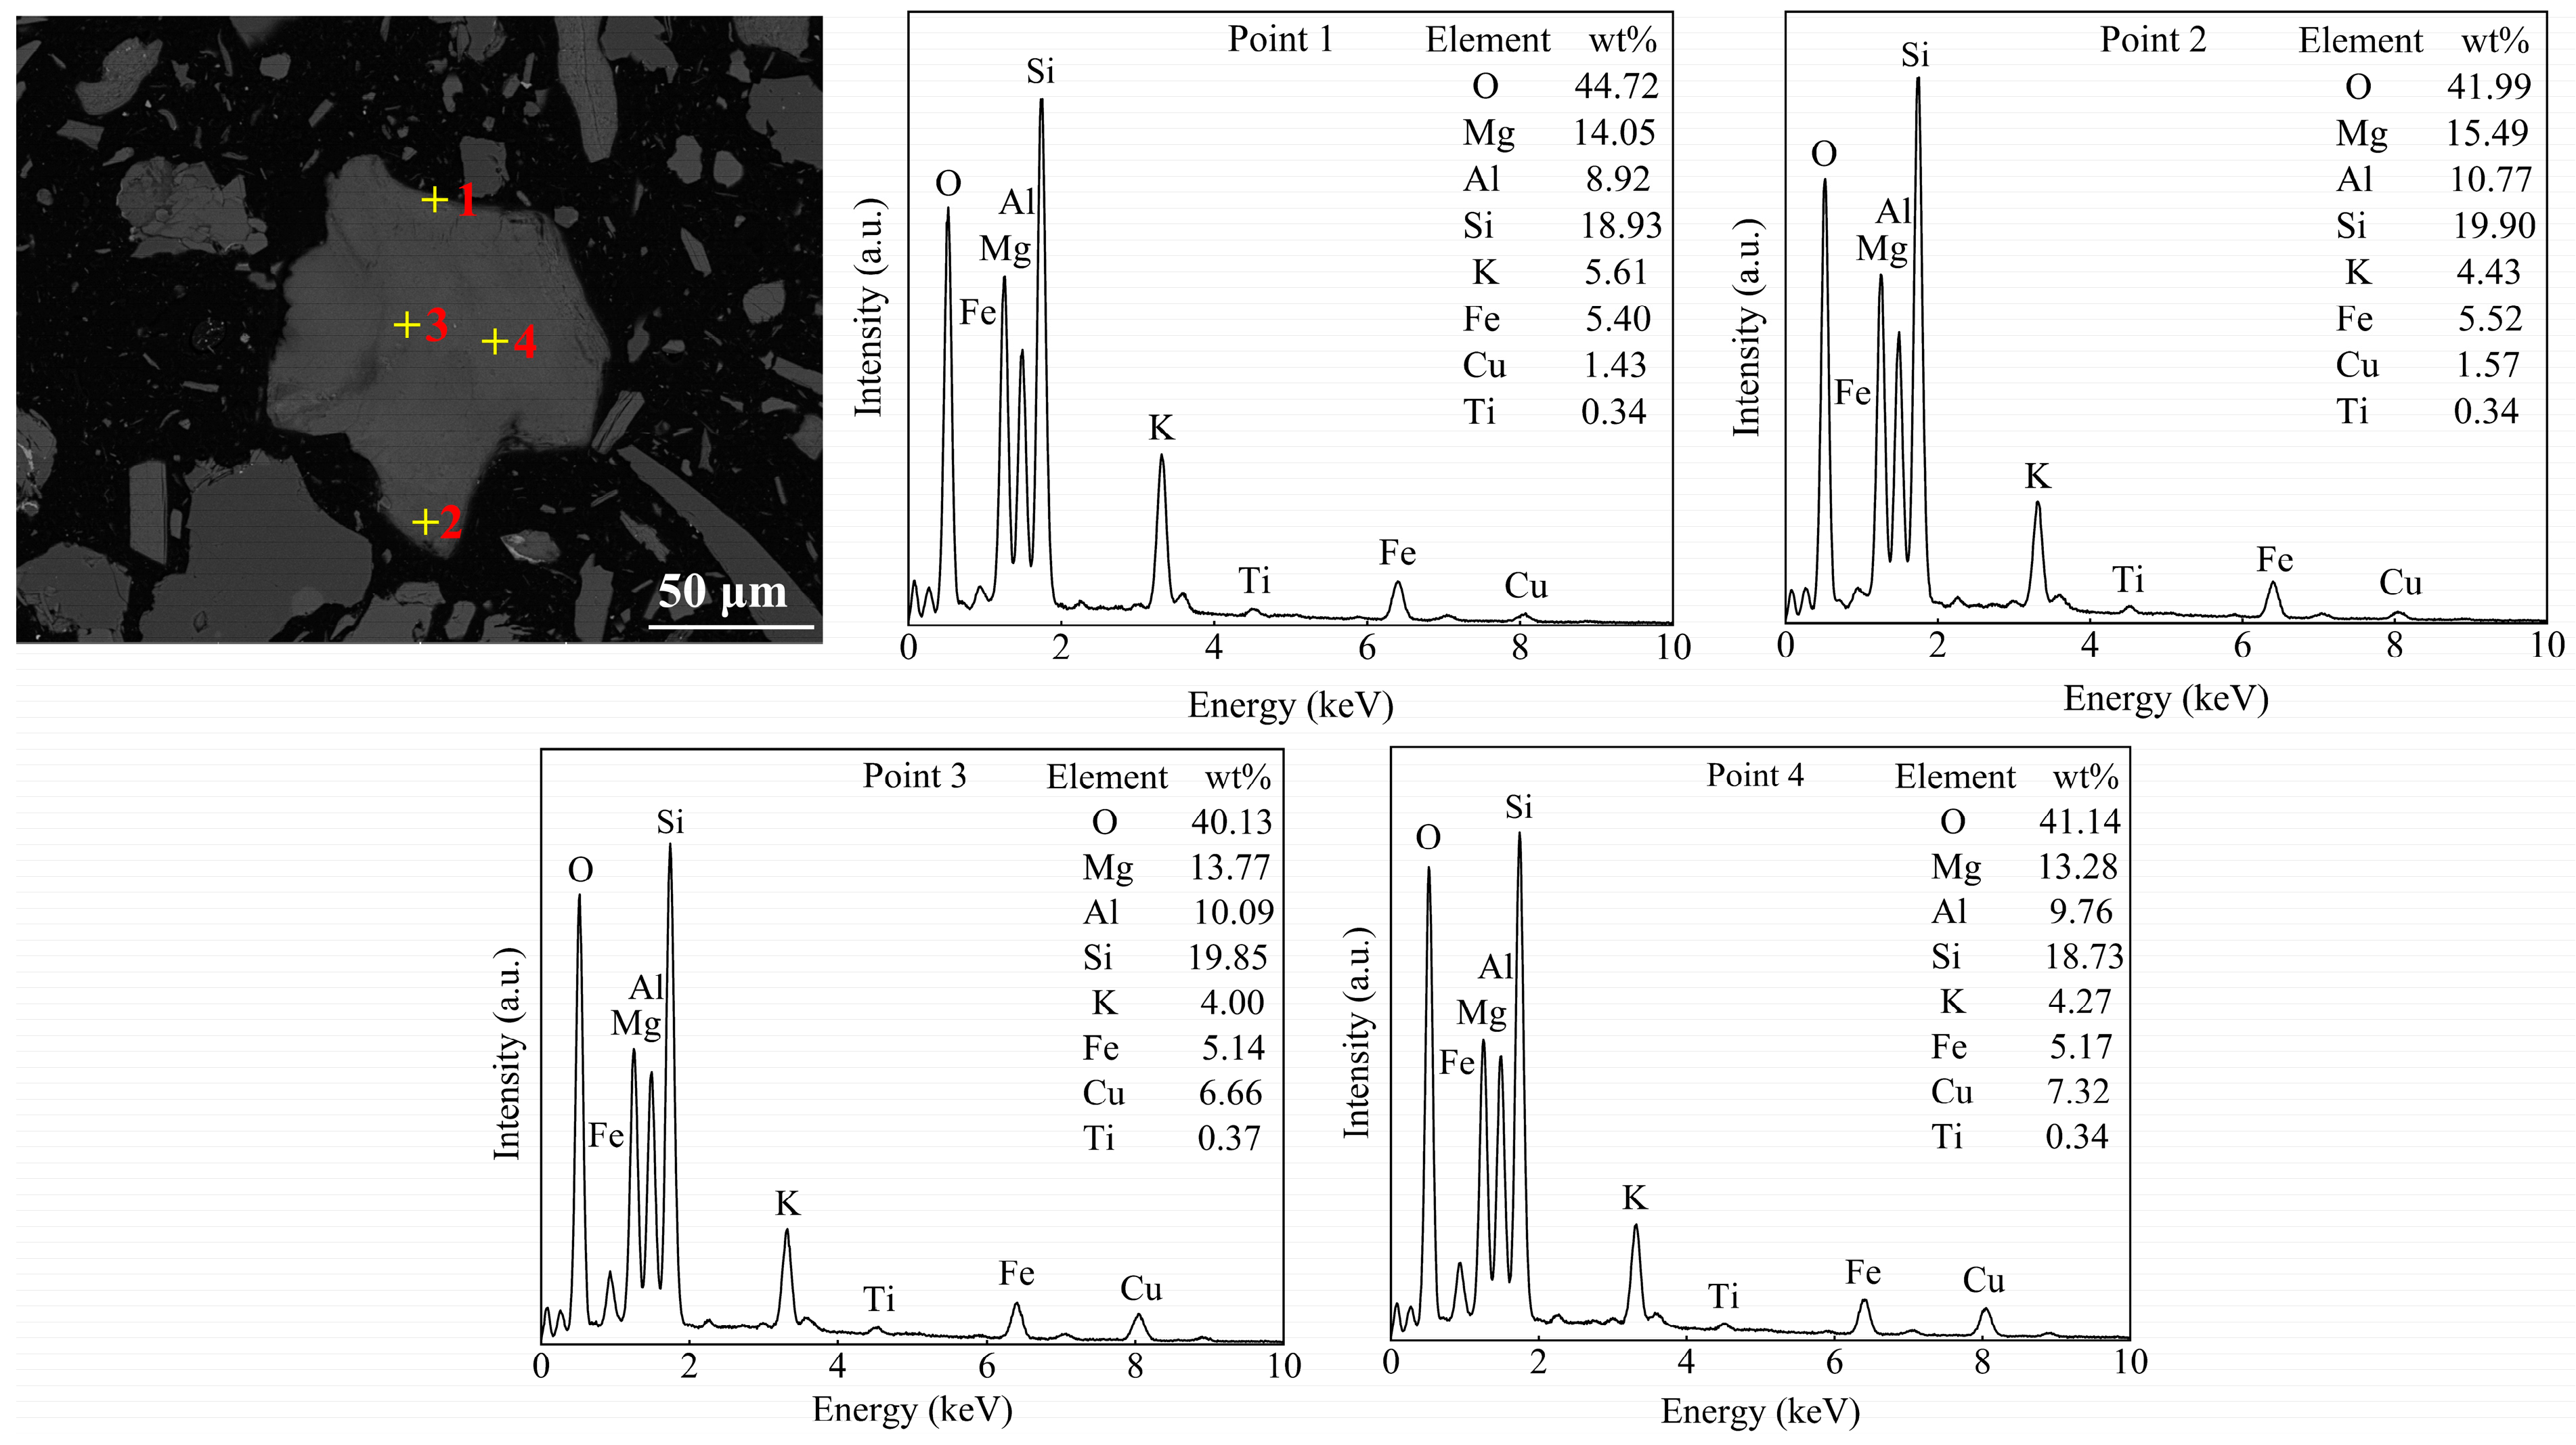
To investigate the factors limiting the final copper leaching rate, the existing state of copper and SEM-EDS analysis were conducted on the leaching residue, as presented in Table 5 and Figure 7. Table 5 shows that the copper grade in the residue is 0.39 wt%, with a distribution of 6.87 wt% for free copper oxide, 73.62 wt% for combined copper oxide ore, and 18.70% for copper sulfide. Most of the free copper oxide and a portion of the copper sulfide have been effectively leached. However, the significantly higher content and distribution of combined copper oxide indicate that some of them remain encapsulated within gangue minerals. This encapsulation limits further leaching and restricts the improvement in copper recovery, even with increasing temperature.
As shown in the SEM-EDS analysis in Figure 7, a small amount of copper remains un-leached within large biotite crystals in the raw ore. EDS analysis of representative points reveals a higher copper content at the center of the biotite and lower content at the edges. This suggests that sulfuric acid penetration into the interior of biotite is limited. Therefore, it is necessary to adopt enhanced leaching measures aimed at expanding the interlayer spacing of biotite, thereby facilitating deeper sulfuric acid diffusion and more complete copper extraction.

3.3. Enhanced Leaching Behavior of Ore by the Organic Cationic Surfactant

3.3.1. Effect of Type and Dosage of Organic Cationic Surfactant on Copper Leaching Rate

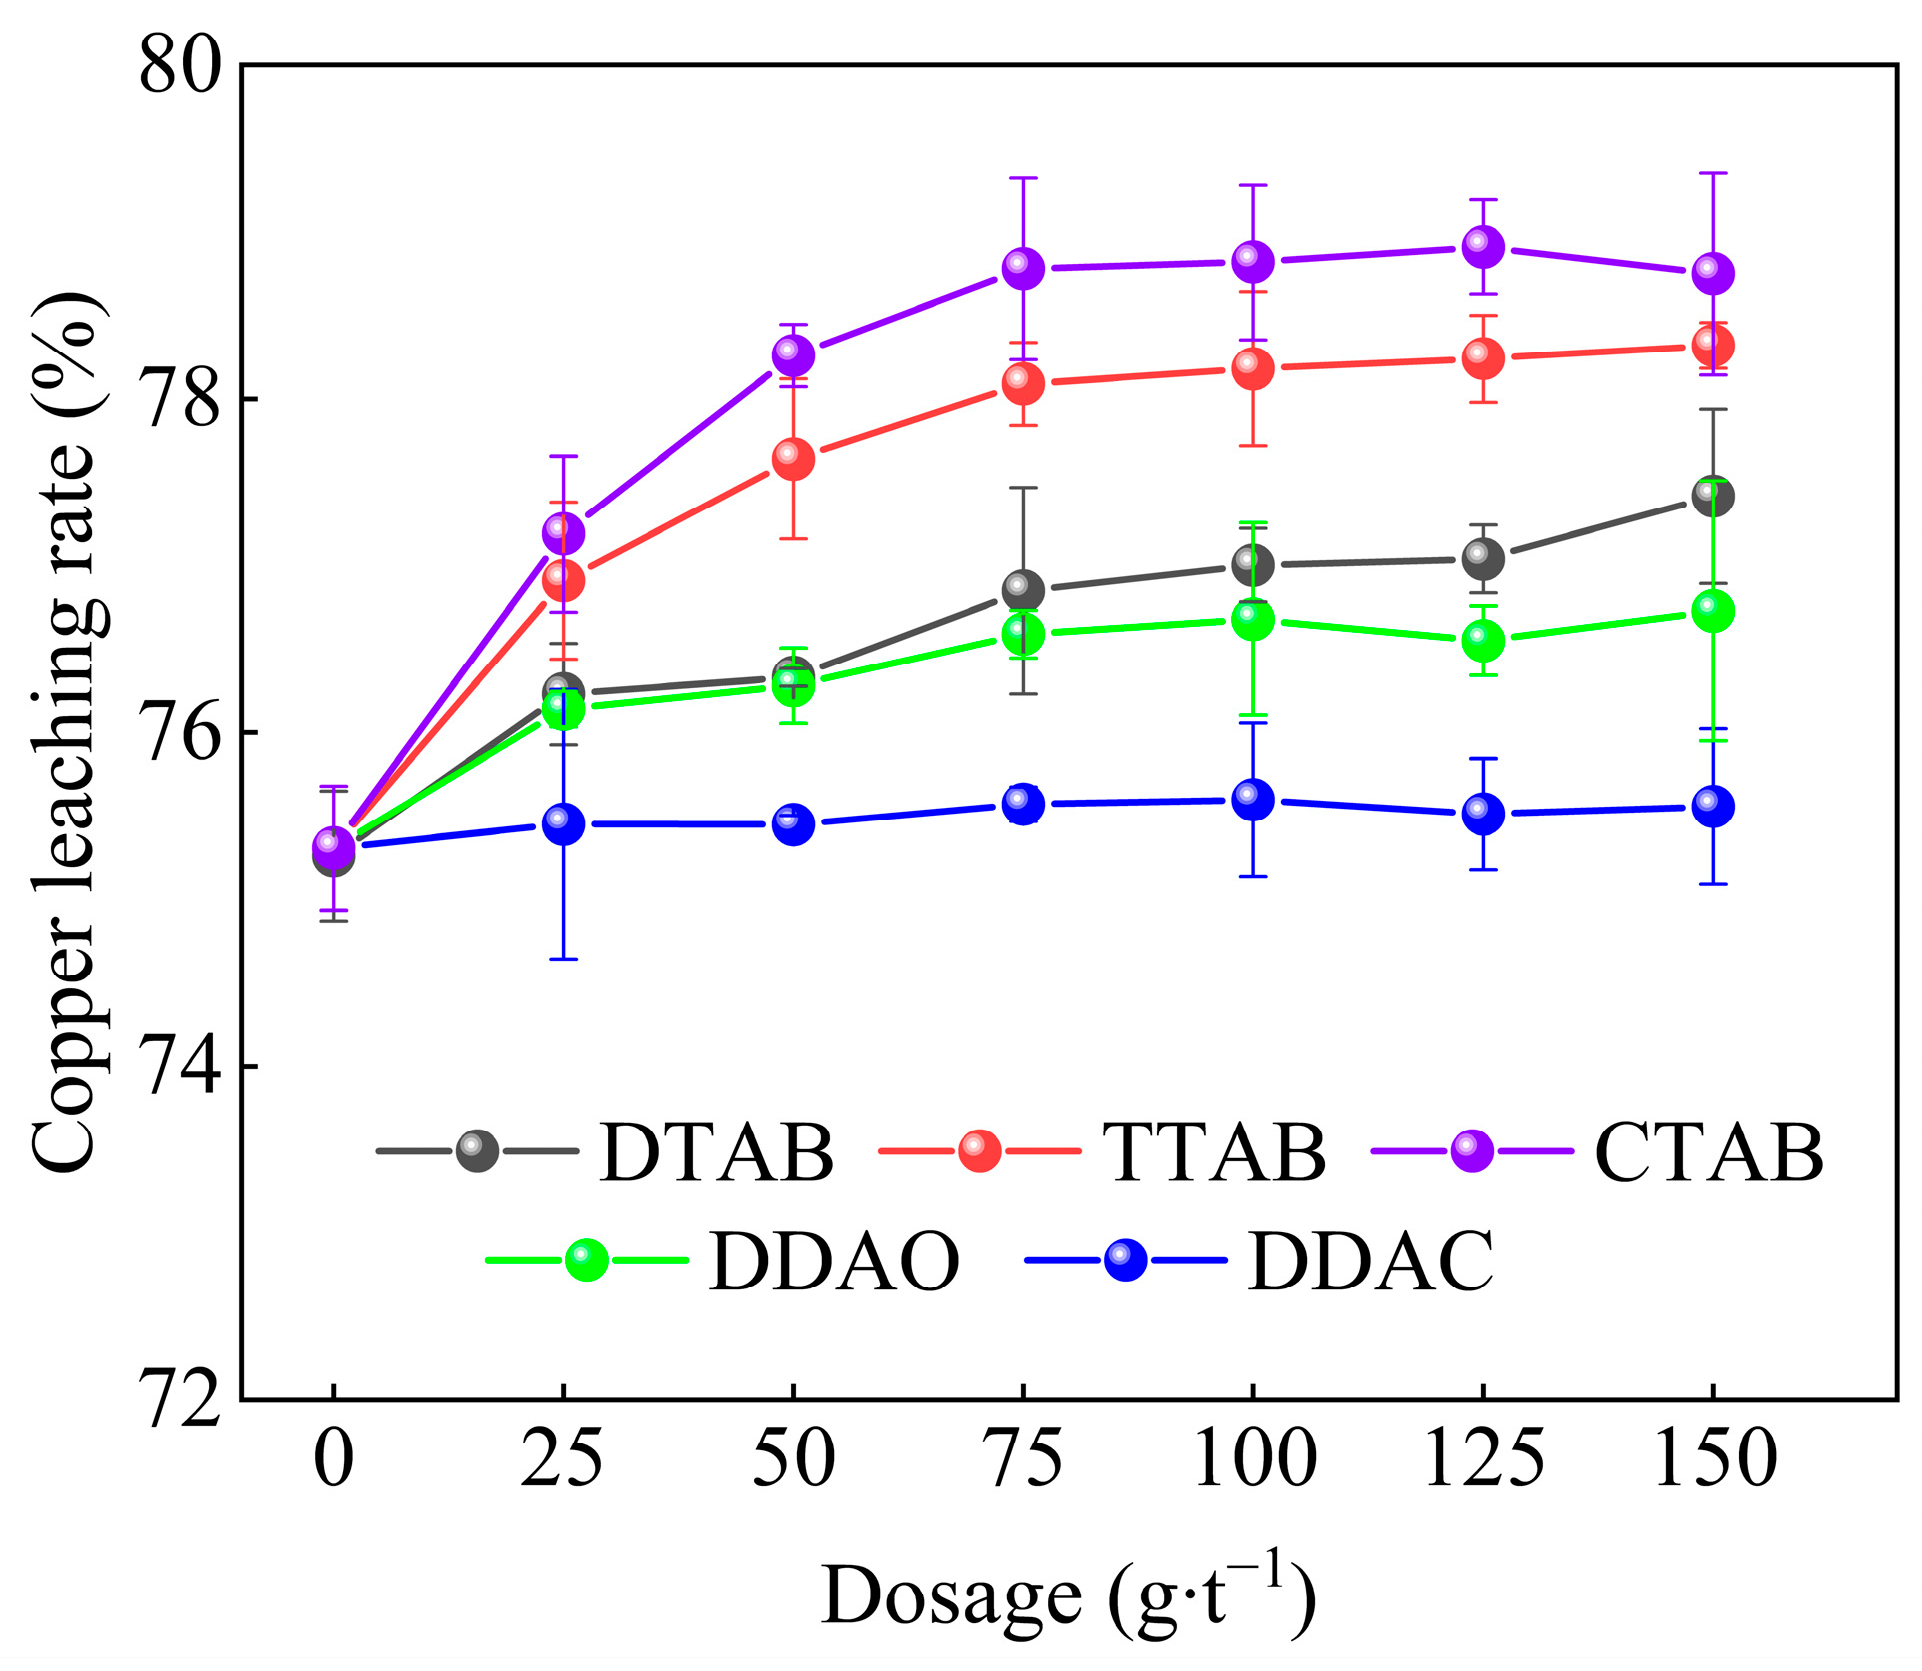
The effect of organic cationic surfactants on the copper leaching rate of ore was investigated under the following conditions: a sulfuric acid dosage of 45 kg/t, a liquid-to-solid ratio of 2:1, a leaching temperature of 65 °C, and a leaching time of 200 min. The organic cationic surfactants tested included common substances such as DTAB, TTAB, CTAB, DDAC, and DDAO. It can be indicated from Figure 8 that the use of DTAB, DDAC, and DDAO resulted in only marginal increases in the copper leaching rate, with the highest leaching rate being 76.15%. Compared to the control group without organic cationic surfactants, the increase in copper leaching rate was only 0.89%. DDAC exhibits negligible intercalation efficacy, indicating that double-chained organic cationic surfactants fail to facilitate mica leaching. This limitation likely stems from their structural configuration, which precludes effective “pillaring” between biotite interlayers. In contrast, the application of TTAB and CTAB as organic cationic surfactants led to more significant improvements. Specifically, with a CTAB dosage of 75 g/t, the copper leaching rate increased to 79.11%, which was 3.85% higher than the optimal result of the control group in Figure 6d. Further increases in the dosage of any of the five organic cationic surfactants did not result in a substantial enhancement of the copper leaching rate. These results indicate that the addition of an appropriate dosage of organic cationic surfactants during the leaching process can improve the copper leaching rate. Among the surfactants tested, CTAB exhibited the best leaching effect under identical dosage conditions. This enhanced leaching performance may be attributed to the relatively larger molecular structure of CTAB, which enhances its ability to intercalate within the biotite layers, thereby expanding the interlayer spacing of biotite more effectively [42]. The expansion promotes the swelling of biotite and improves the leaching rate of copper. Therefore, CTAB, at a dosage of 75 g/t, is considered the most effective organic cationic surfactant for enhancing copper leaching.

3.3.2. Effect of Organic Cationic Surfactant on Leaching Temperature

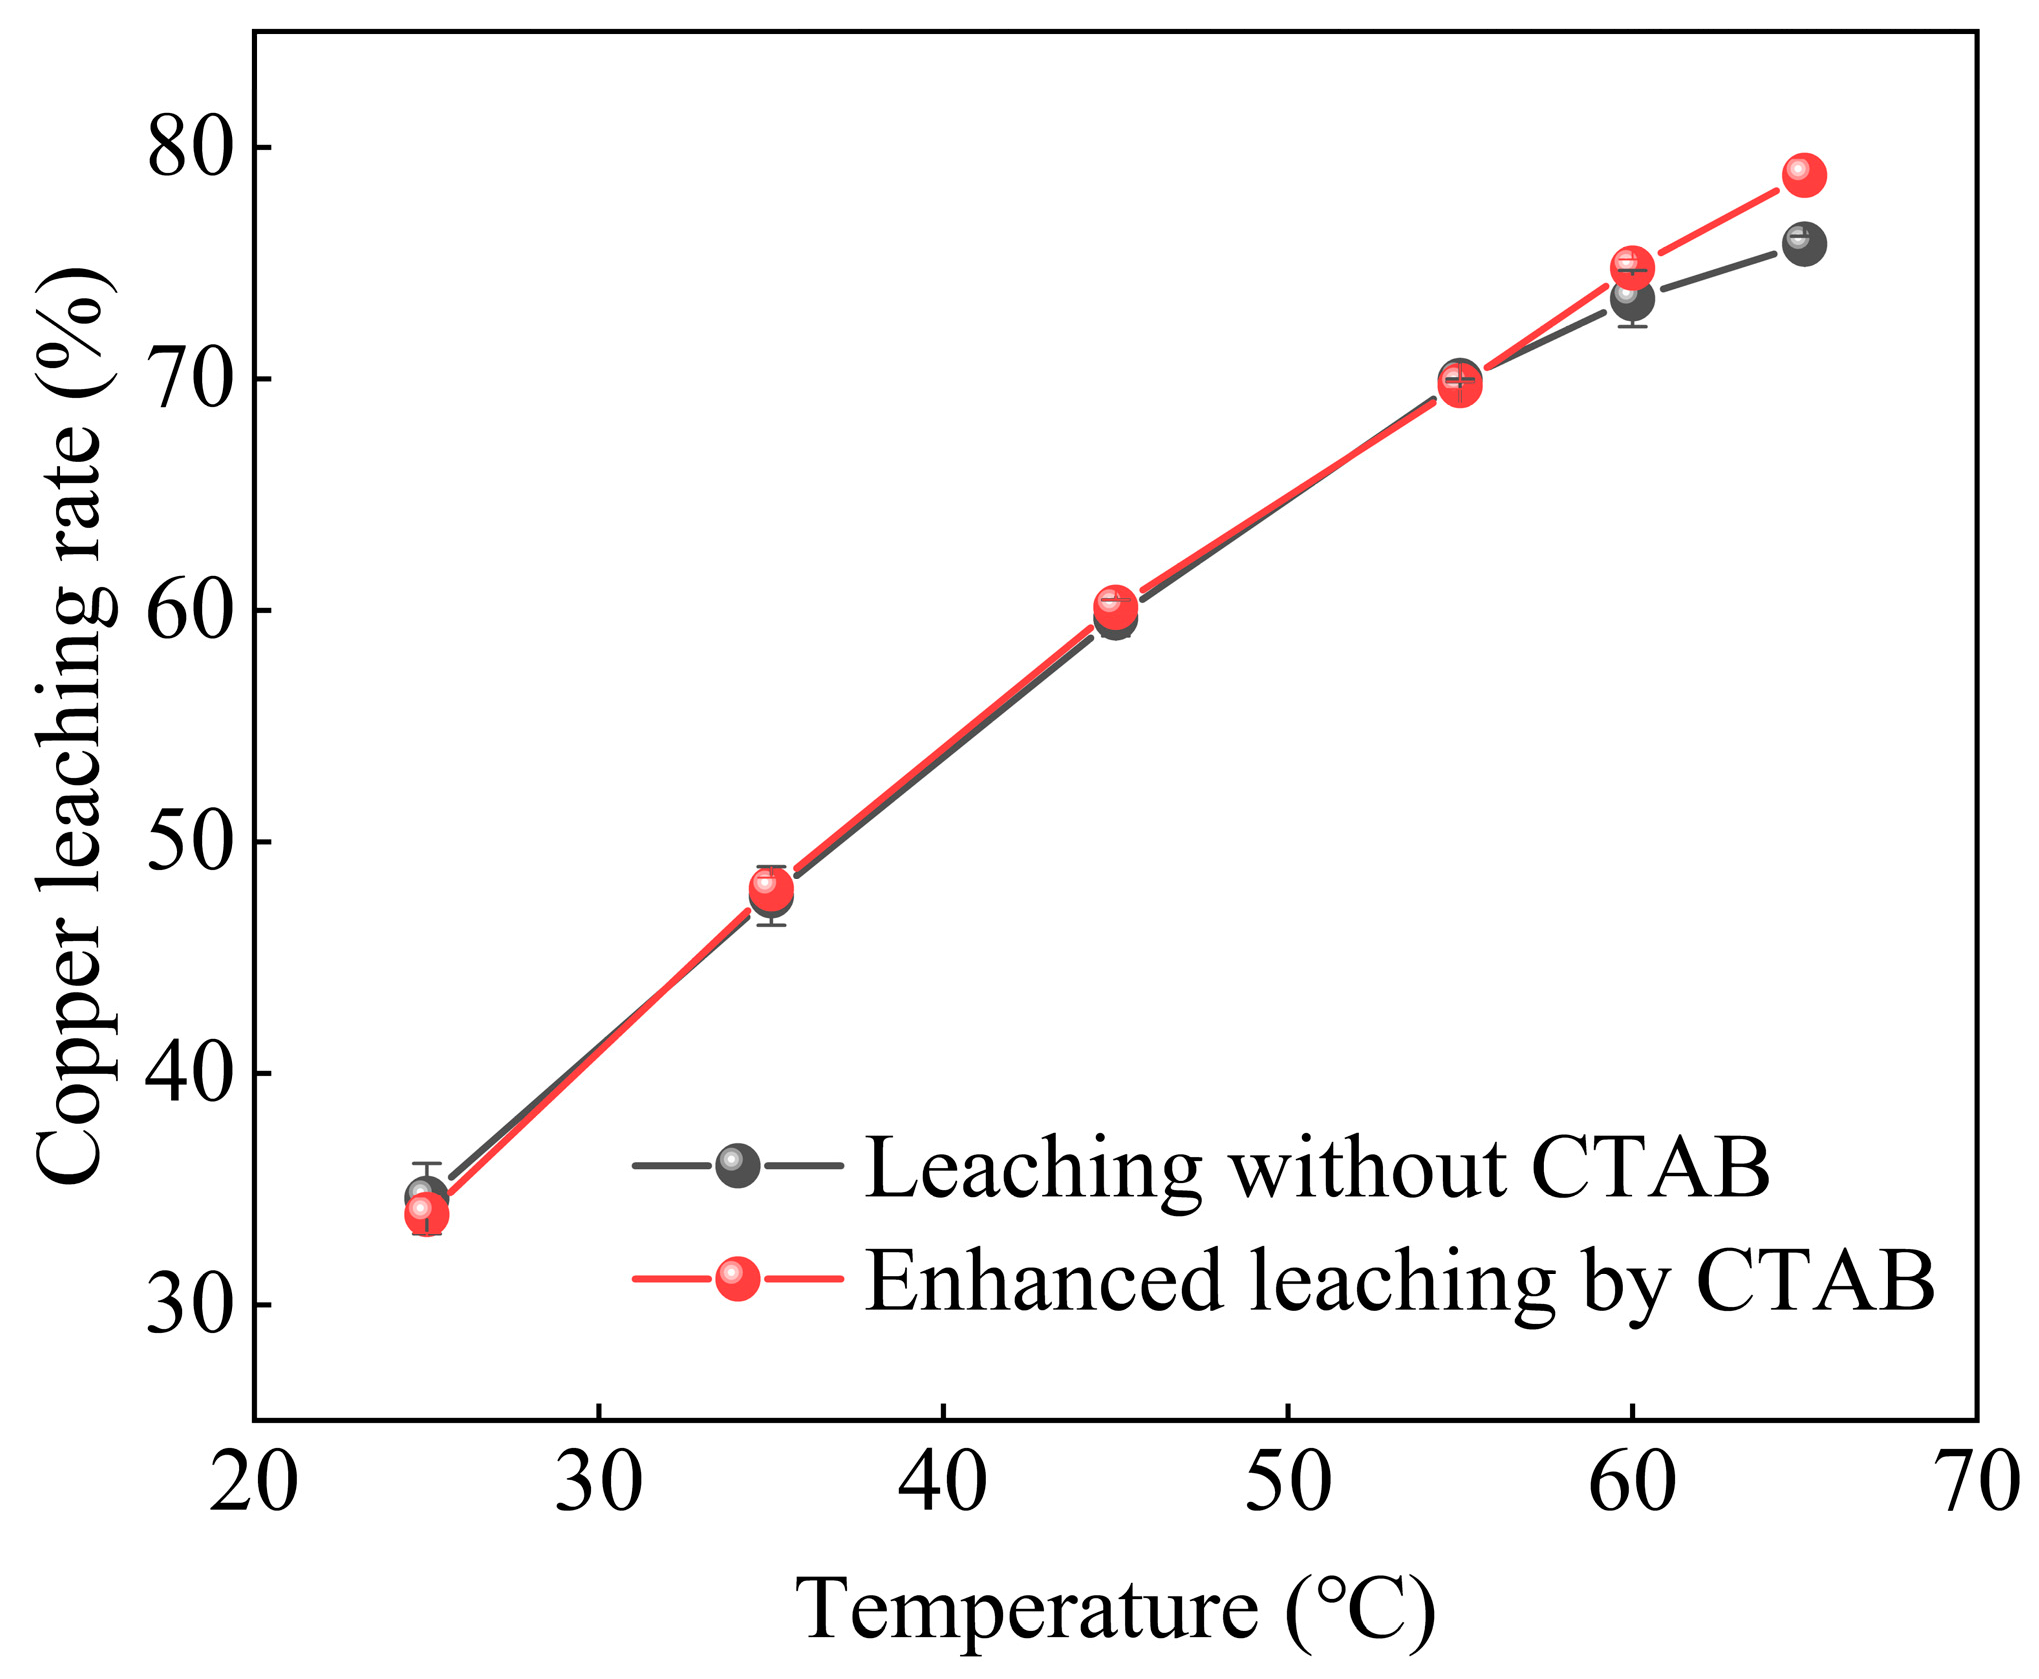
The effect of leaching temperature on the copper leaching rate of the ore with the addition of CTAB was investigated under the following conditions: sulfuric acid dosage of 45 kg/t, liquid–solid ratio of 2:1, leaching time of 200 min, and CTAB dosage of 75 g/t. As shown in Figure 9, at lower temperatures, the addition of CTAB has a minimal effect on the copper leaching rate. However, at higher temperatures, CTAB further enhances copper leaching. Specifically, at 60 °C, the copper leaching rate reaches 74.78%, which is only 1.32% higher than the control group without CTAB. The result suggests that the inclusion of organic cationic surfactant does not significantly lower the leaching temperature. It is likely that CTAB cannot effectively intercalate into cupriferous biotite at lower temperatures, preventing an expansion of the interlayer spacing. However, at higher temperatures, CTAB can successfully insert into the biotite layers, facilitating their expansion and improving the copper leaching rate [43].

3.3.3. Effect of Organic Cationic Surfactant on Leaching Time

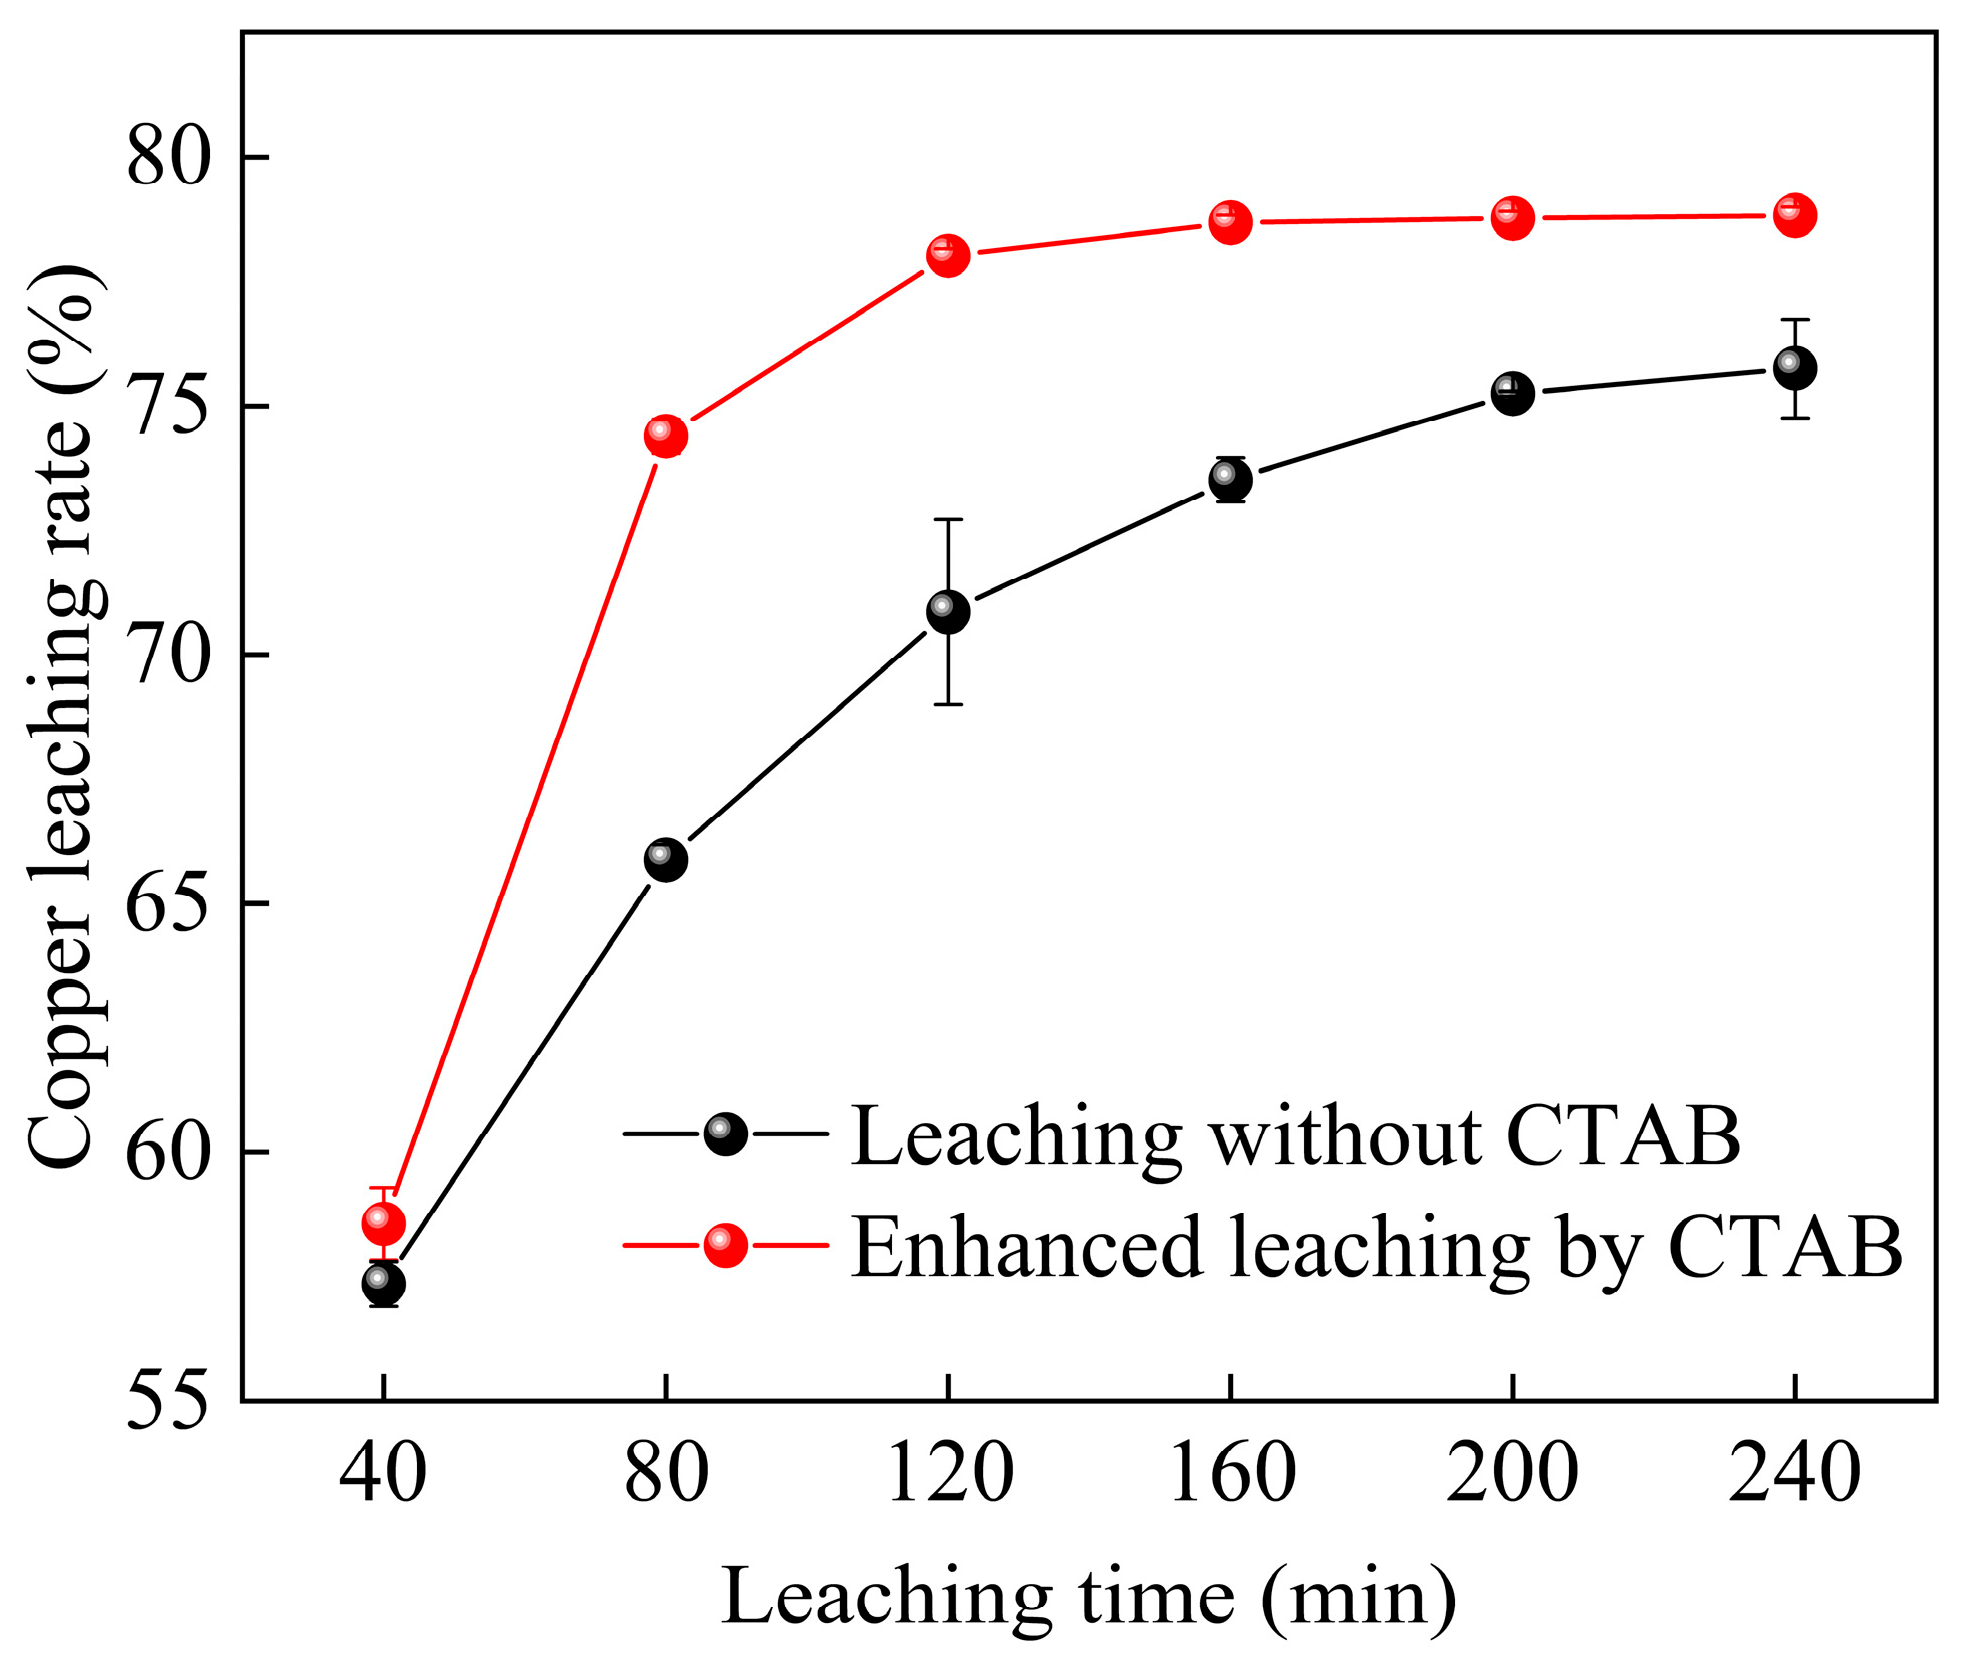
The effect of leaching time on the copper leaching rate of the ore with the addition of CTAB was investigated under the following conditions: sulfuric acid dosage of 45 kg/t, liquid–solid ratio of 2:1, leaching temperature of 65 °C, and CTAB dosage of 75 g/t. As shown in Figure 10, the copper leaching rate increased rapidly within the first 80 min after the addition of CTAB, but began to slow down thereafter. At 120 min, the copper leaching rate reached 78.32%. Further extension of the leaching time had no significant effect on the leaching rate of copper. Therefore, the optimal leaching time for the ore with CTAB addition is 120 min. Compared with the best experimental results without CTAB, the copper leaching rate increased by 3.06%, and the leaching time was reduced by 80 min. These results indicate that the addition of CTAB not only enhances the copper leaching rate but also shortens the required leaching time, thereby reducing the energy consumption of leaching.

3.4. Kinetic Analysis of Leaching

The sulfuric acid leaching of copper oxide ore typically involves a two-stage reaction, with the leaching kinetics elucidating the rate-controlling steps of the process. The unreacted shrinking core model is employed to characterize the leaching process, encompassing three principal mechanisms: chemically controlled, diffusion-controlled, and mixed-controlled models. The governing kinetic equations for each model are as follows:
1 1 x 1 3 = k 1 t
1 2 3 x 1 x 2 3 = k 2 t
ln 1 x 3 1 + 1 x 1 3 = k 3 t
where x is copper leaching rate (%); k1, k2 and k3 represent the chemical reaction constants; and t is the leaching time (min).
To further investigate the governing factors of the leaching process of raw ore and to elucidate the kinetics of the reaction, the chemical reaction control model, diffusion control model, and mixed control model were used to fit the relationship between the copper leaching rate and leaching time under varying temperatures. The results are presented in Figure 11.
As illustrated in Figure 11, the linear correlation coefficient R2 derived from the mixed control model exhibits a closer approximation to unity compared to the single chemical reaction control and diffusion control models, particularly at lower temperatures. Notably, the R2 obtained from the mixed control model in Figure 11c remains higher at elevated temperatures, suggesting that the leaching process of the ore is governed by both chemical reaction and diffusion. This further confirms that the kinetic equation of the mixed control model provides a more accurate representation of the ore leaching process.
According to the Arrhenius Equation (7), the leaching of the copper oxide ore can be obtained.
k = A e x p E a / R T
where k is the corresponding reaction rate constant at different temperatures (T), derived from the slope of the fitted line in Figure 11c; A represents the pre-exponential factor; Ea represents the apparent activation energy (kJ/mol); R represents the molar gas constant; and T represents the reaction temperature (K). The relationship between lnk and 1/T can be obtained by taking logarithms on both sides of Equation (7), as shown in Equation (8).
l n k = l n A E a / R T
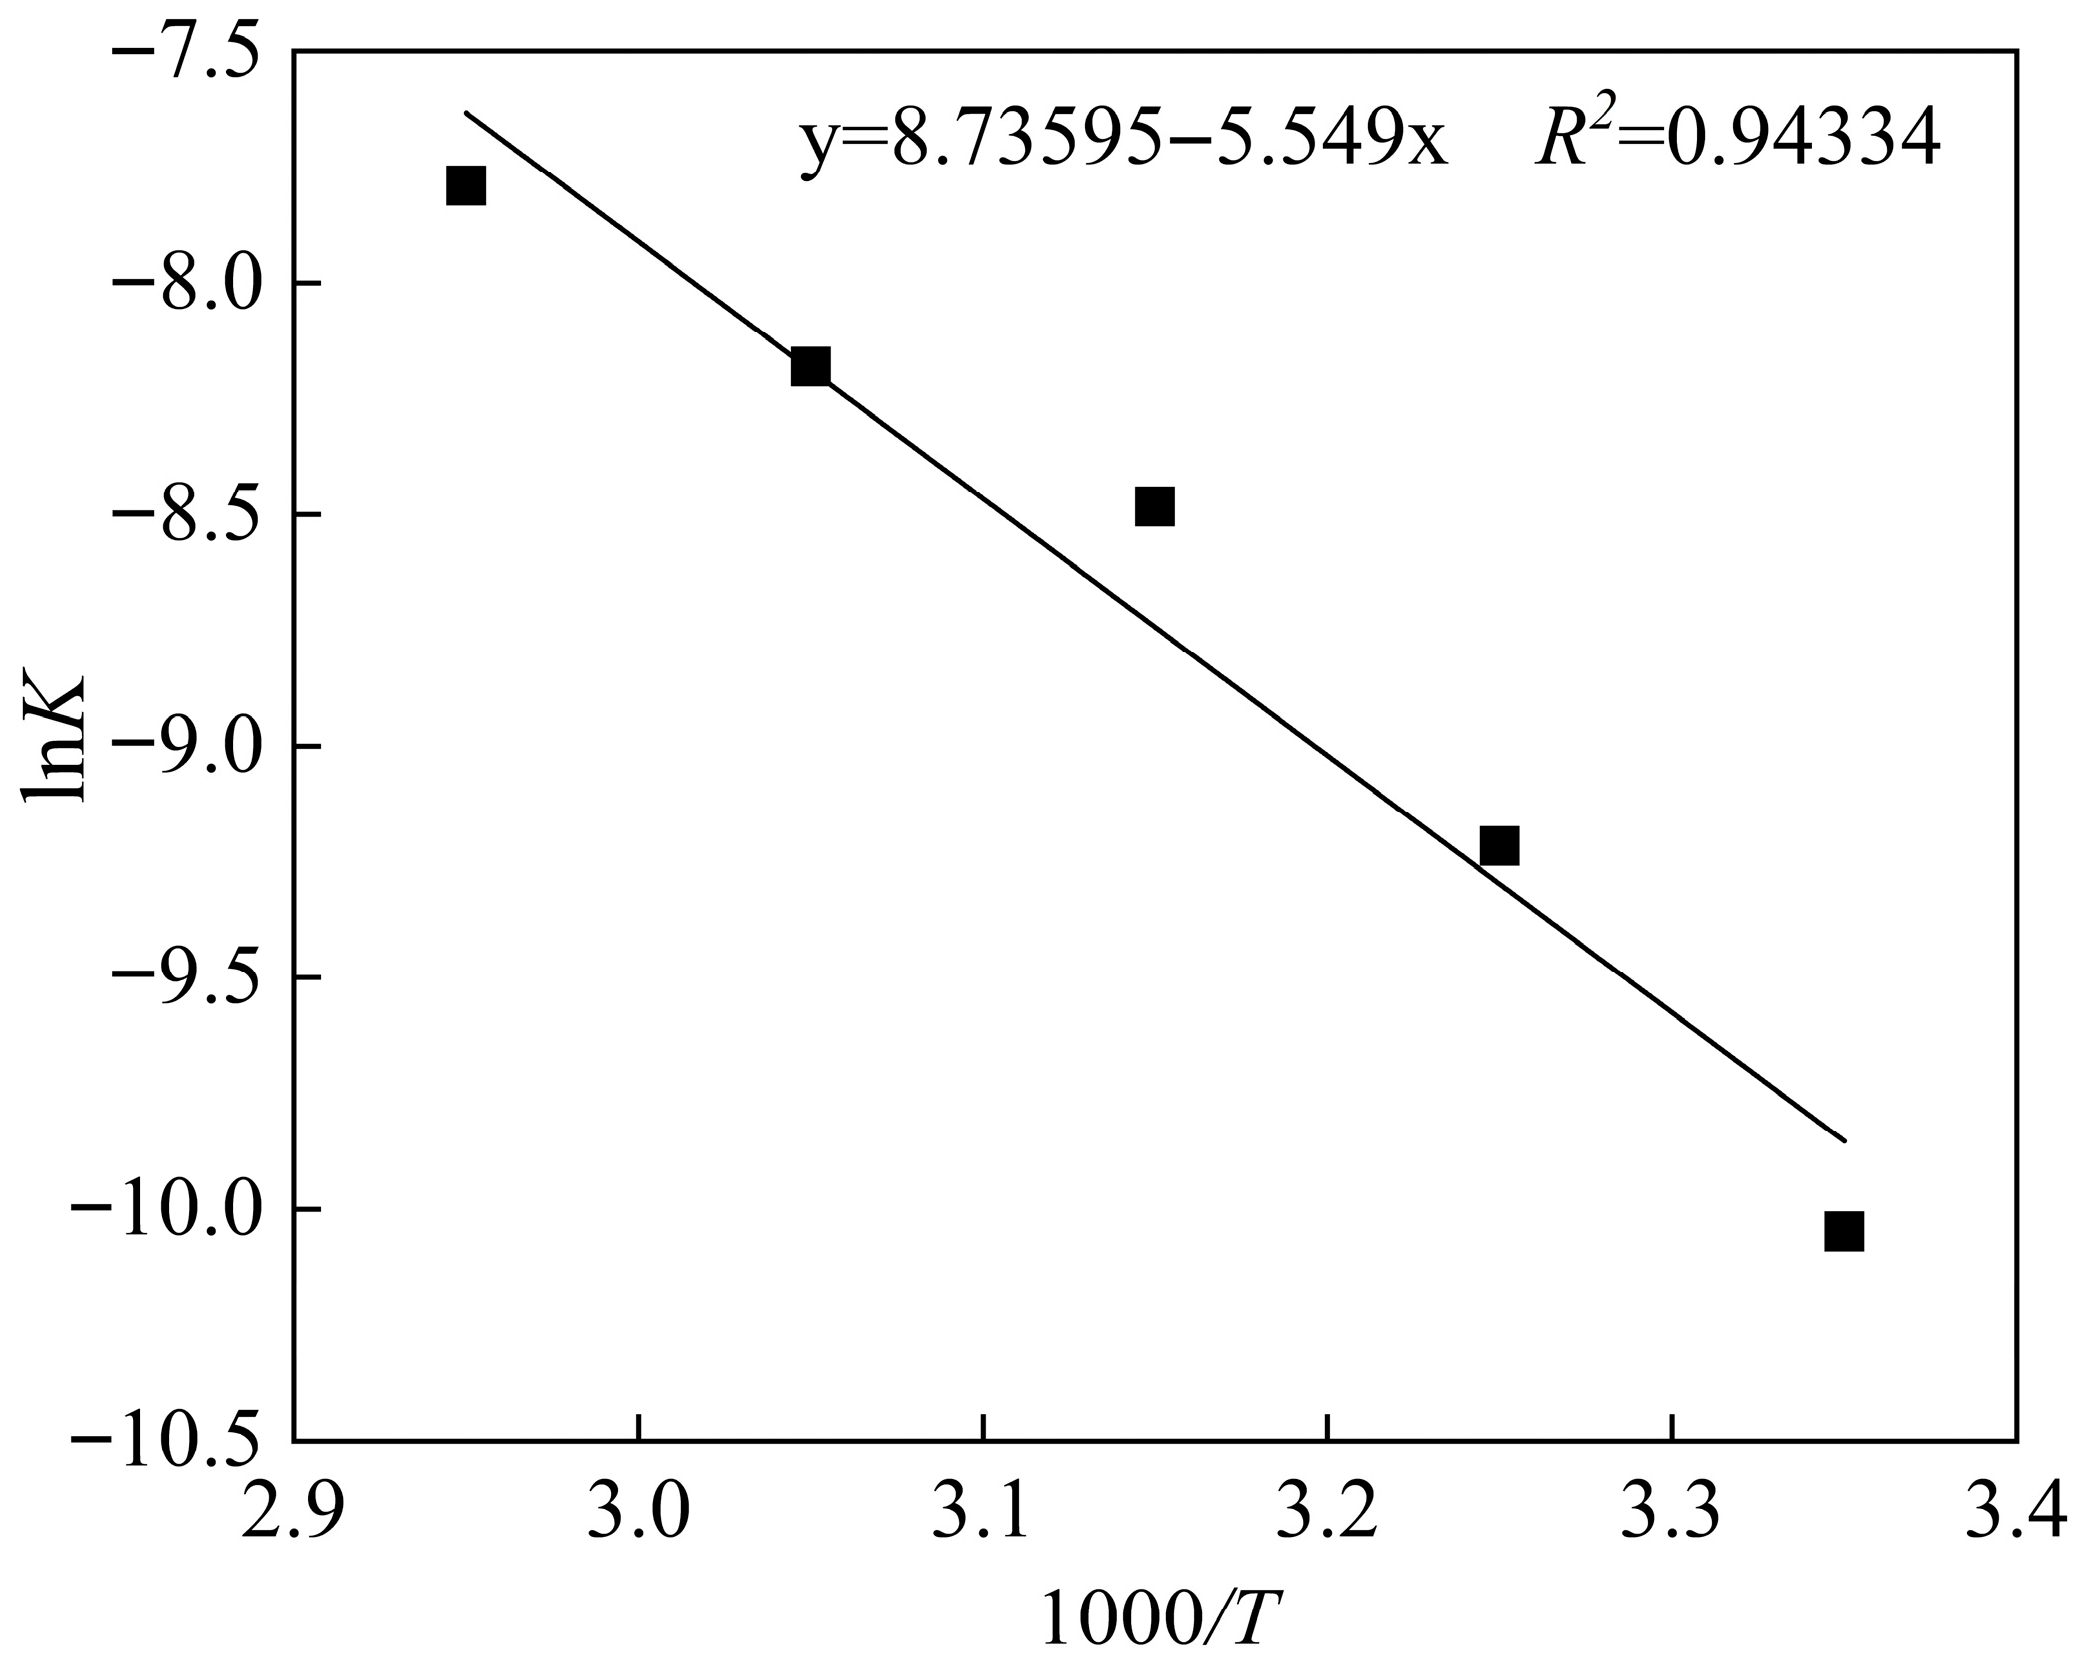
The Arrhenius curve was derived by substituting the temperature and the corresponding reaction rate constant into the aforementioned equation, as depicted in Figure 12. The slope of the fitted line represents the value of −Ea/R, from which the apparent activation energy of the CTAB-enhanced ore leaching reaction was calculated to be 46.13 kJ/mol.

3.5. Mechanism of CTAB-Enhanced Leaching

The results of the aforementioned experiments demonstrate that CTAB enhances the copper leaching efficiency of the refractory copper oxide ore. To elucidate the mechanism by which CTAB enhances copper leaching, some analytical methods, including FTIR, TOF-SIMS, molecular dynamics simulation, and XRD, were employed to analyze the representative samples of leaching residue and biotite.

3.5.1. Analysis of FTIR

According to the results in Figure 5, a sieve with a pore size of 0.074 mm was first used to screen the leaching residue, both with and without CTAB, in order to obtain a sample with a higher content of biotite on the sieve. In addition, the same leaching method was used to treat biotite. To confirm that the CTAB added during the leaching could be adsorbed by the biotite in the ore, an FTIR analysis was performed on the samples with particle size greater than 0.074 mm in the leaching residue and biotite. The results are shown in Figure 13.
Figure 13a presents the FTIR spectrum of the sample with a particle size greater than 0.074 mm from the leaching residue. The absorption peak at 460.42 cm−1 corresponds to the bending vibration of Si-O, while the absorption peaks at 693.76 cm−1, 777.17 cm−1, 1008.59 cm−1, and 1079.46 cm−1 are attributed to the stretching vibration of the Si-O-Si (Al) bond. The absorption peak at 3430.74 cm−1 is associated with the hydroxyl group. After the addition of CTAB, new absorption peaks appeared at 2851.72 cm−1 and 2921.63 cm−1. The peak at 2851.72 cm−1 corresponds to the stretching vibration of the C-H bond in -CH2−, while the peak at 2921.63 cm−1 represents the stretching vibration of the C-H bond in -CH3. These two characteristic bonds are present in the CTAB structure, indicating that CTAB can be adsorbed by certain minerals in the raw ore during the leaching [26]. Figure 13b shows the infrared spectrum of biotite before and after the addition of CTAB; the absorption peaks at 995.57 cm−1, 688.94 cm−1, and 459.93 cm−1 correspond to the Si-O-Si (Al) or Si-O bond. After the addition of CTAB, new absorption peaks appeared at 2921.63 cm−1 and 2851.72 cm−1, corresponding to the C-H stretching vibrations in -CH2− and -CH3, respectively. Based on these findings, it can be concluded that the cupriferous biotite in the raw ore is capable of adsorbing CTAB. Most importantly, no significant changes were observed in the other absorption peaks before and after the addition of CTAB, suggesting that the structure of biotite remains intact. It reveals that the addition of CTAB can enhance copper leaching without destroying the structure of cupriferous biotite.

3.5.2. Analysis of TOF-SIMS

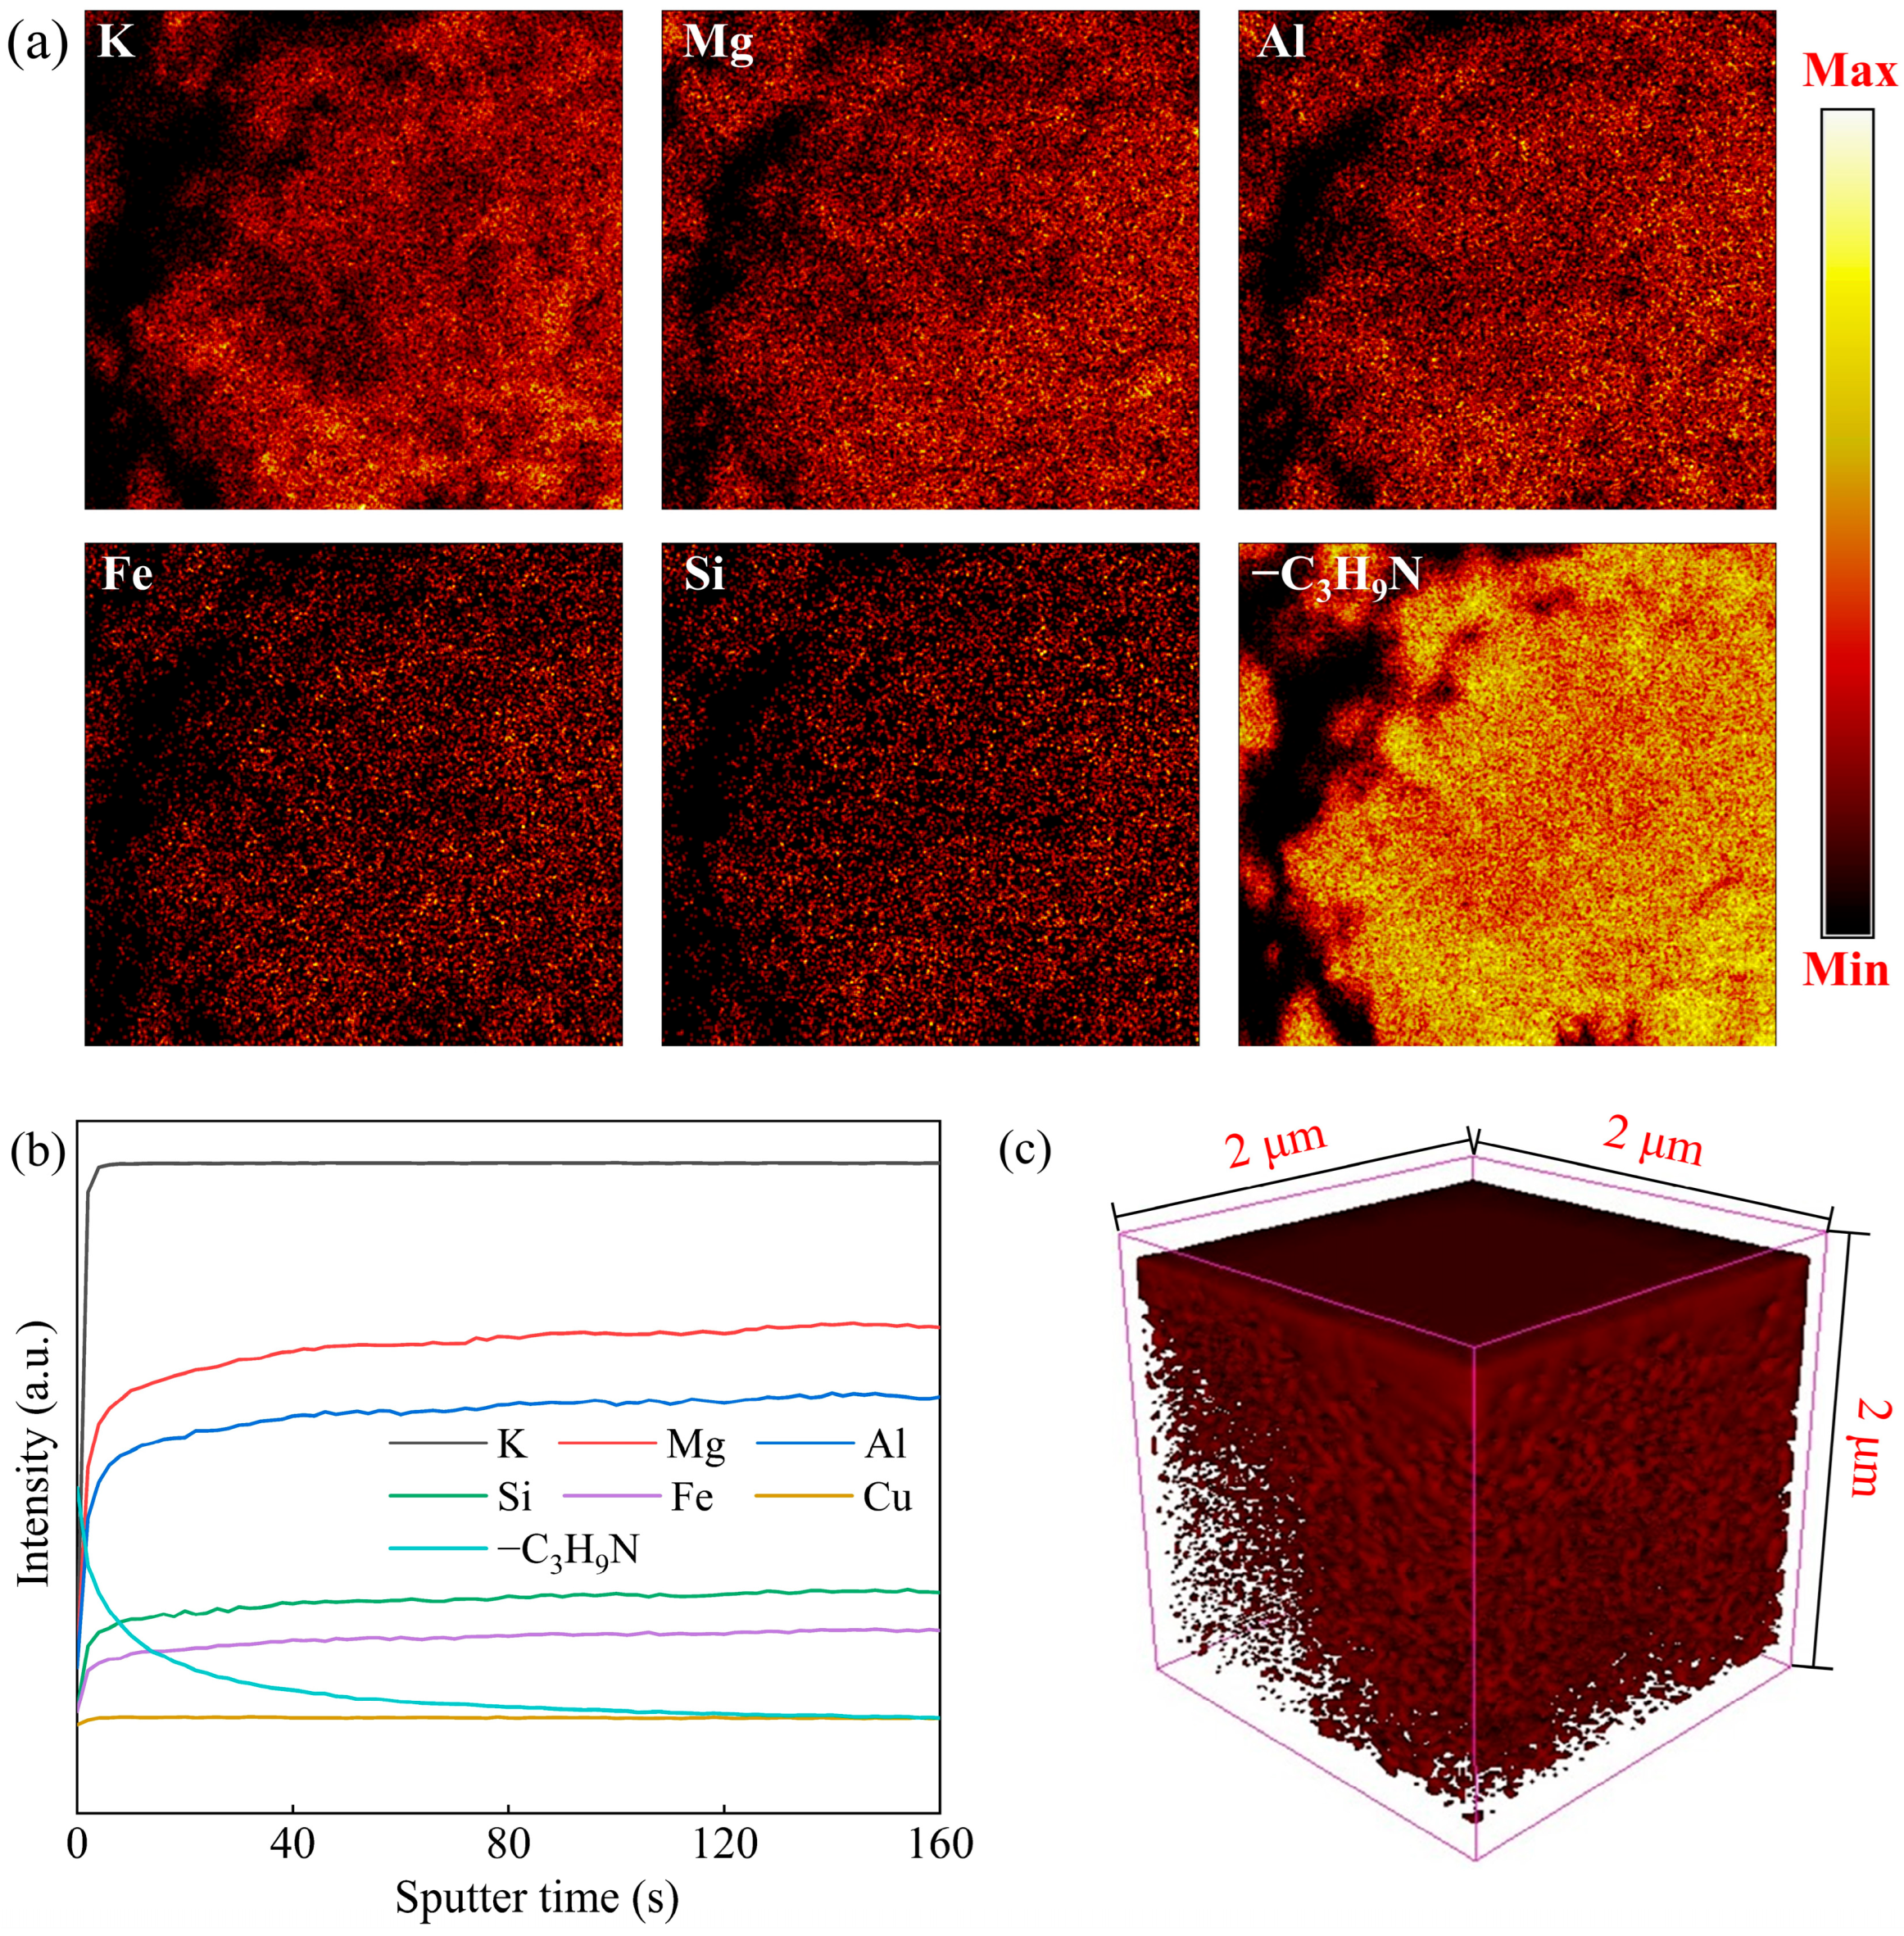
The FTIR analysis indicates that CTAB can be adsorbed by cupriferous biotite in the raw ore. However, it does not provide direct evidence that CTAB enters the interlayer of biotite. To confirm that the CTAB added during the leaching is adsorbed into the interlayer of biotite, the TOF-SIMS analysis was performed on the biotite of the leaching residue. Surface scanning using TOF-SIMS first identified biotite particles with flat surfaces in the residue. The surface scanning energy spectrum is shown in Figure 14a; in addition to the K, Mg, Al, Si, and Fe components of biotite, a significant amount of -C3H9N, corresponding to the CTAB structure, was detected on the surface. This result not only confirms the target biotite but also supports the FTIR findings, demonstrating that CTAB can be adsorbed onto the surface of biotite. As shown in Figure 14b, with increasing sputter time, the analysis depth gradually increased, and the secondary ion intensity of each element stabilized, indicating that the elemental content remained essentially stable throughout the depth. Additionally, small amounts of -C3H9N were detected. Its intensity was relatively high initially, but it gradually decreased and stabilized as the analysis depth increased, suggesting that -C3H9N is evenly distributed within the biotite. This result occurs because potassium typically exists in biotite in the form of ions. Under heating conditions, biotite reacts with sulfuric acid, allowing H+ to penetrate the mica interlayer and disrupt the K-O bond. Consequently, some K+ are released from the interlayer, while the tetrahedral-octahedral structure of the mica remains intact. This creates a “vacancy effect” between the biotite layers. The positive charge of the nitrogen atom in the organic cation, combined with the excess negative charge in the biotite interlayer, generates an electrostatic imbalance, facilitating the stable insertion of the organic cation into the biotite layers [22,44,45]. Figure 14c presents the 3D overlay of -C3H9N at depth after analysis of the position. From the image, it can be observed that the density of -C3H9N within the layers is lower but scattered and distributed. The density near the left side is notably lower, possibly due to the location of the region at the center of the biotite particles and the relatively short leaching time, which prevents CTAB from further penetrating the inner layers of the biotite [46,47]. In summary, the findings presented above provide evidence that CTAB can enter the interlayer of cupriferous biotite in the raw ore during the leaching, rather than merely adsorbing onto its surface.

3.5.3. Analysis of Molecular Dynamics Simulation

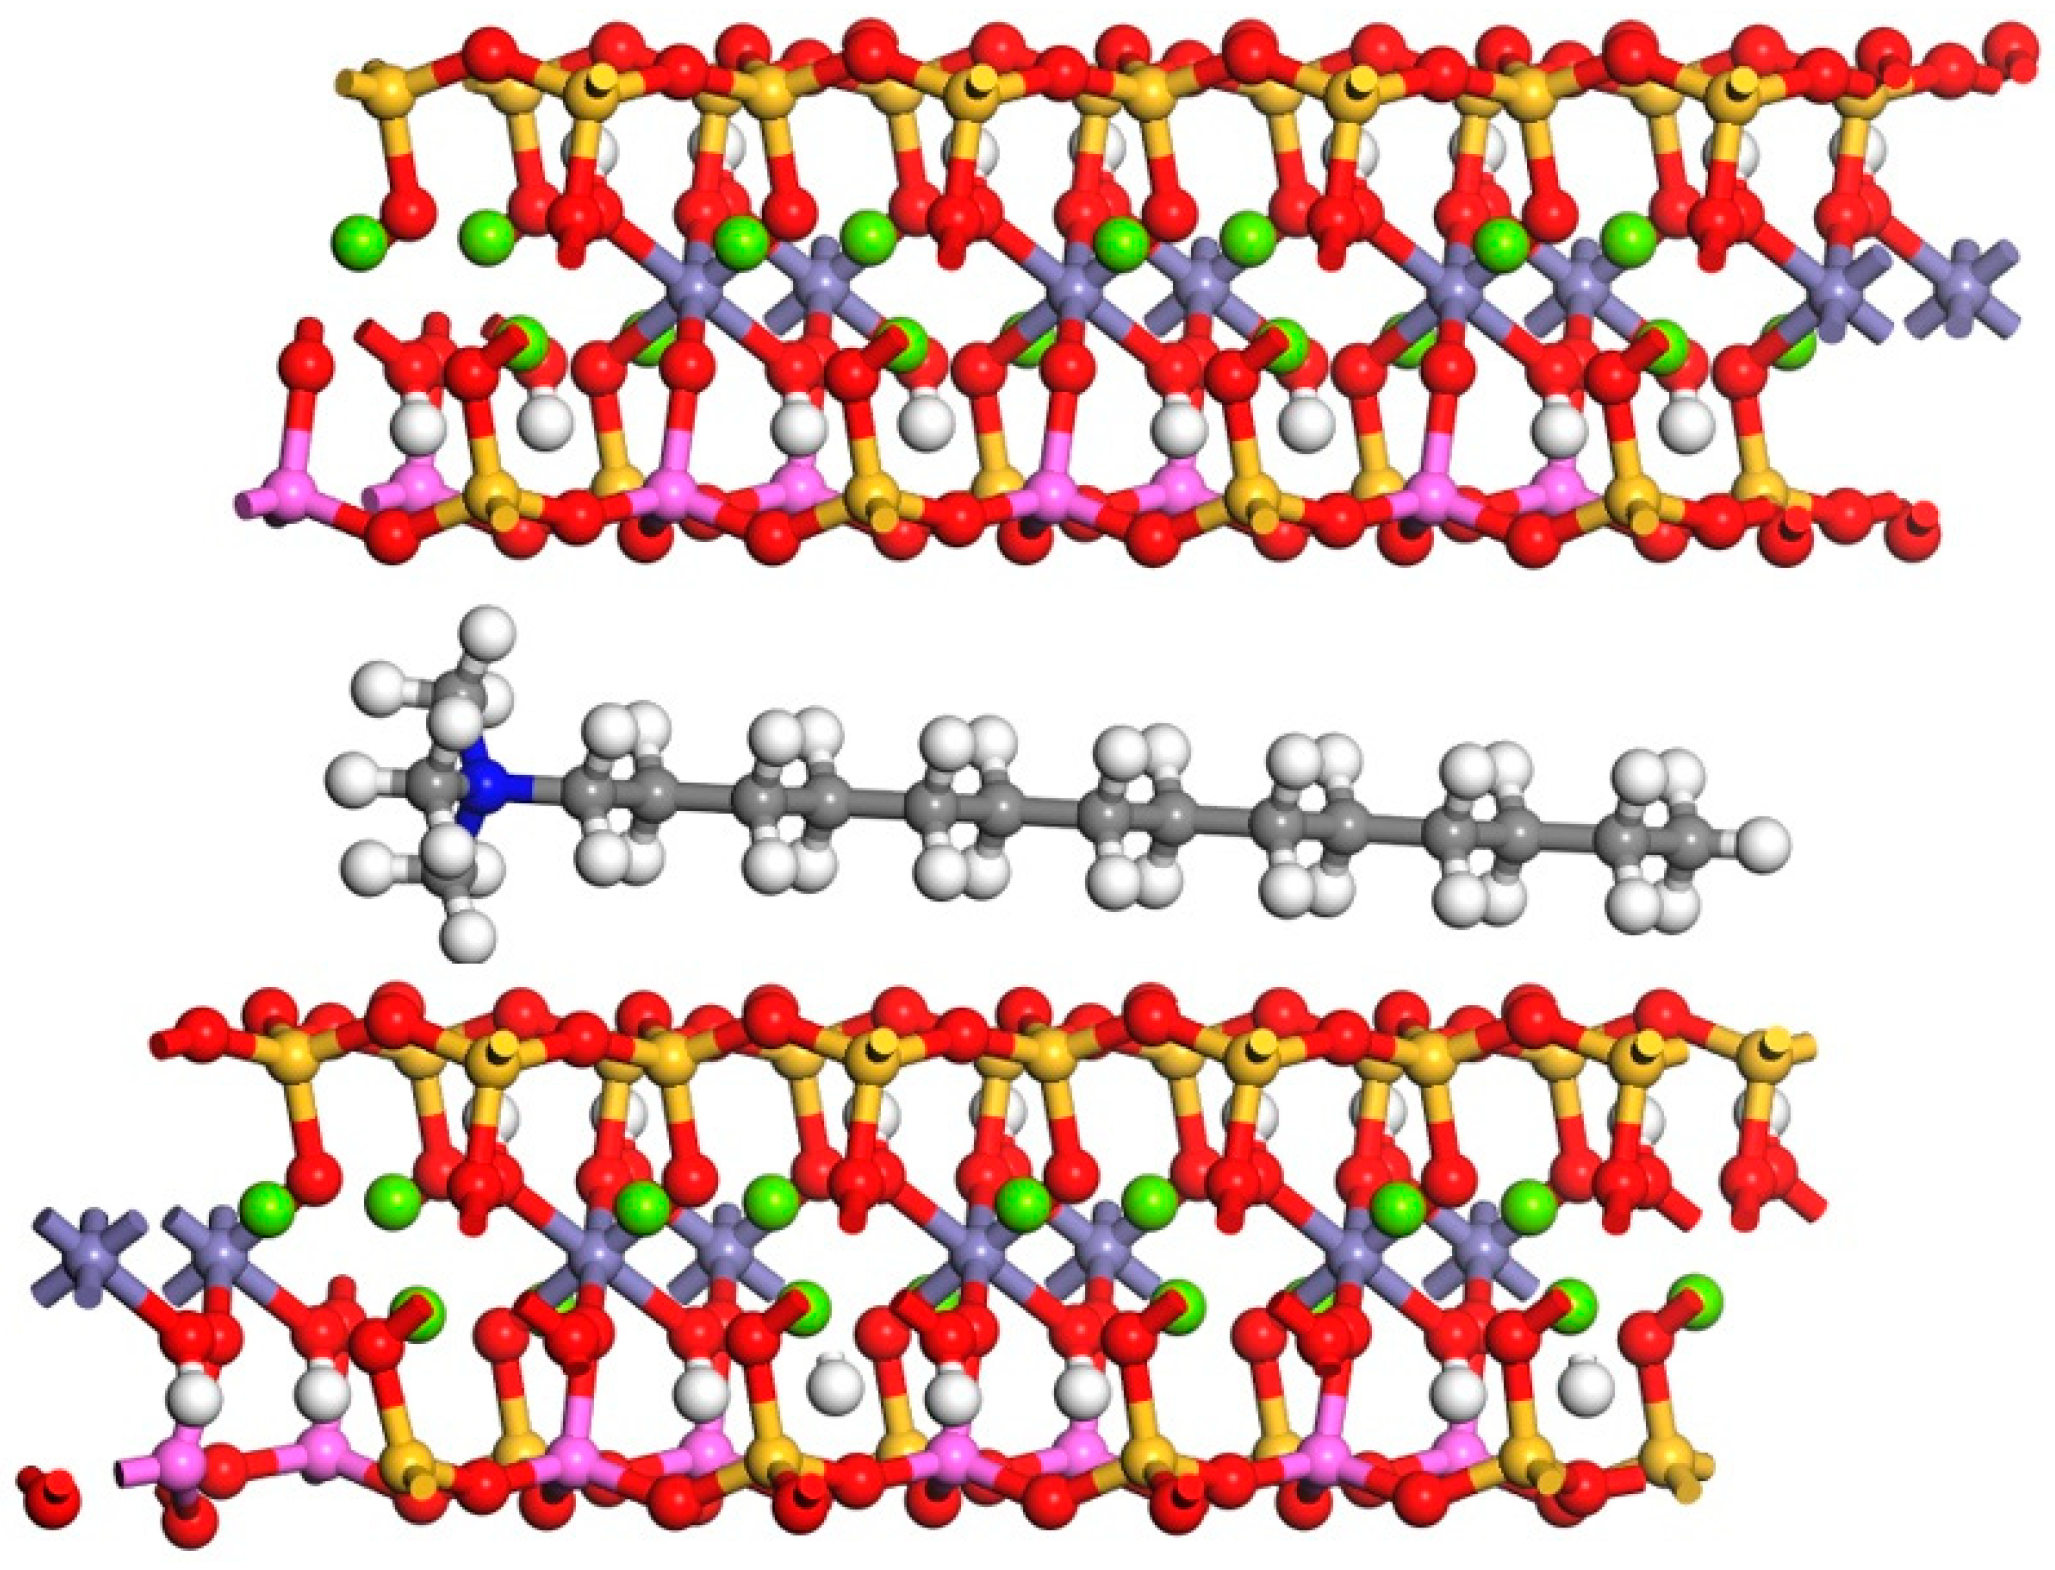
To investigate the effect of organic cation addition on the crystal structure of biotite, molecular simulations were employed to analyze changes in the cell parameters of biotite caused by the incorporation of organic cations in CTAB. The organic cation is inserted horizontally into the biotite layer. The resulting molecular model, after simulation and optimization, is shown in Figure 15. As depicted, the distribution of CTAB molecules in the interlayer shifts slightly, but the overall structure of both the organic cation and biotite remains unchanged. Table 6 presents the variations in the cell parameters of biotite before and after CTAB intercalation. The lengths of the a-axis and b-axis remain virtually unchanged, while the c-axis length increases from 20.39 Å to 23.43 Å, indicating that the intercalation of organic cations expands the interlayer spacing of biotite. This expansion occurs because the insertion of the organic cations weakens the electrostatic Coulomb interaction between the interlayer cations and the hexagonal epoxy, thereby reducing the attraction between the layers and increasing the interlayer spacing. Additionally, the organic cations shift within the layers, serving a “pillaring” function that further increases the interlayer spacing. The expanded spacing facilitates the exchange of organic cations and potassium ions, leading to the formation of more vacancies. Besides organic cations, other cations, such as H+, also obtained additional sites, which enhanced the reaction between H+ and copper in the biotite layer and accelerated the copper leaching [48].

3.5.4. XRD Analysis of Leaching Residues

To quantify the change in the spacing of biotite layers after the addition of CTAB, an XRD analysis was conducted on the samples with a particle size greater than 0.074 mm from the leaching residue treated with organic cationic surfactants (The dosage of each surfactant is 75 g/t) and a CTAB dosage test. As shown in Figure 16a,b, compared to the control group without surfactants, the 2θ diffraction peak of biotite shifted to the left upon the addition of surfactants. The 2θ diffraction peak shifted from 8.80° to 8.42°, with the largest shift observed when TTAB and CTAB were used. According to the Bragg equation, the interlayer spacing of biotite was found to increase from 0.509 nm to 0.521 nm and 0.522 nm, respectively, with TTAB and CTAB addition. These results demonstrate that the addition of organic cationic surfactant increases the interlayer spacing of biotite, with TTAB and CTAB showing the most obvious effect. As shown in Figure 16c, the diffraction peak of biotite in the leaching residue gradually shifted left as the CTAB dosage increased. When the CTAB dosage reached 100 g/t, the 2θ diffraction peak of biotite was 8.5°, and no significant further shift was observed with higher CTAB dosage. The interlayer spacing of biotite calculated using the Bragg equation is shown in Figure 16d. With increasing CTAB dosage, the interlayer spacing of biotite in the leaching residue increased from 0.509 nm to 0.524 nm. The expansion of the interlayer spacing facilitates the penetration of sulfuric acid, enhancing the contact between sulfuric acid and copper within the biotite and ultimately improving the copper leaching rate. When the CTAB dosage exceeded 100 g/t, no further increase in interlayer spacing was observed. This, together with the results of TOF-SIMS, suggests that the adsorption of CTAB on biotite may become saturated in a limited time, or there may be an upper limit to the interlayer spacing of biotite, particularly in the central layers.

3.6. Energy Consumption, Economy, and Potential Merit and Demerit Analysis

Based on the laboratory experimental results, an analysis was conducted to evaluate the energy consumption and heating costs associated with both regular leaching and leaching enhanced by organic cationic surfactant. The comparative results are detailed in Table 7. Although the application of organic cationic surfactants did not reduce the required sulfuric acid dosage or leaching temperature, it markedly shortened the leaching duration by 80 min. According to current industrial data of the hydrometallurgical plant, the ore heating energy consumption for the heating–agitation acid leaching is 81.91 kWh∙t−1. Under ideal industrial conditions, the total heating energy consumption per ton of ore can be reduced from 273.03 kWh to 163.82 kWh through the application of the enhanced leaching process. The current bulk purchase price of CTAB ranges from USD 50 to USD 100 per kilogram. Based on the required dosage determined in this study, the cost of CTAB per ton of ore is estimated to be approximately USD 3.75–7.00. Given the local electricity price of USD 0.12 per kWh, the heating cost per ton of ore is reduced from USD 32.76 to USD 19.65 following process optimization. Consequently, the implementation of CTAB-enhanced leaching yields cost savings of approximately USD 6.11–9.36 per ton of ore.
Since CTAB has not yet been industrially applied in the local copper hydrometallurgical plant, a preliminary assessment of its potential merits and demerits has been conducted based on the existing data and relevant literature, as outlined in Table 8.

4. Conclusions

(1)
The binding rate of copper in the refractory copper oxide ore studied in this research is high. Copper is predominantly present in biotite, forming significant amounts of cupriferous biotite, which results in a low leaching rate by regular heating–agitation acid leaching. Cupriferous biotite has poor grindability, and it is mainly distributed in the coarse fraction of grinding products.
(2)
Leaching tests indicated that when the dosage of sulfuric acid was 45 kg/t, the liquid–solid ratio was 2:1, the leaching temperature was 65 °C, with a leaching time of 200 min, the copper leaching rate was 75.26%. When the organic cationic surfactant CTAB was used as the leaching agent at a dosage of 75 g/t, the copper leaching rate increased to 78.32%. Compared to the optimal result of the regular heating–agitation acid leaching test, the leaching rate of copper increased by 3.06% and the leaching time was shortened by 80 min. The leaching process is aptly characterized by a mixed control model, wherein the reaction rate is governed by both chemical reaction and diffusion. The activation energy of the leaching process is 46.13 kJ/mol.
(3)
The results of the mechanistic study indicate that the organic cations in CTAB can replace potassium ions within the biotite interlayer, neutralizing excess anions and weakening the electrostatic Coulomb forces between the interlayer cations and the hexagonal structure, increasing the interlayer spacing. During the process of increasing the distance between the biotite layers, the organic cations will gradually shift from the horizontal direction to the vertical direction, and play a “pillaring” role between the biotite layers. The expanded interlayer spacing generates more vacancies, providing additional sites for organic cations and H+. This facilitates the entry of H+ from the sulfuric acid solution into the biotite interlayer, where they react with copper within the biotite, enhancing the copper leaching rate, accelerating copper extraction, and shortening the leaching time.
(4)
Although CTAB exhibits a certain level of toxicity, it possesses excellent degradability and the feasibility of being recycled, and generally does not pose a significant threat to the environment. When used as a leaching aid, CTAB can contribute to substantial energy savings. Under ideal industrial conditions, its application in the heating–agitation acid leaching at the local hydrometallurgical plant can reduce the cost by approximately USD 6.11–9.36 per ton of ore.

Author Contributions

Y.L.: data curation, investigation, writing—original draft, and writing—review and editing. J.K.: conceptualization, supervision, and funding acquisition. C.S.: methodology, supervision, and funding acquisition. P.W.: software. X.W.: validation. All authors have read and agreed to the published version of the manuscript.

Funding

This research was funded by the National Natural Science Foundation of China (No. 51974016), and the National Key Research & Development Program of China (No. 2022YFC2904502).

Conflicts of Interest

The authors declare no conflicts of interest.

References

  1. Wang, G.R.; Yang, H.Y.; Tong, L.L.; Liu, Y.Y. Research on technological mineralogy of copper oxide ore in Luanshya, Zambia. J. Northeast. Univ. Nat. Sci. 2019, 40, 350–355. (In Chinese) [Google Scholar] [CrossRef]
  2. Ettler, V.; Mihaljevič, M.; Drahota, P.; Kříbek, B.; Nyambe, I.; Vaněk, A.; Penížek, V.; Sracek, O.; Natherová, V. Cobalt-bearing copper slags from Luanshya (Zambian Copperbelt): Mineralogy, geochemistry, and potential recovery of critical metals. J. Geochem. Explor. 2022, 237, 106987. [Google Scholar] [CrossRef]
  3. Yu, B.Q.; Sun, C.B.; Kou, J. Process mineralogical study on refractory copper oxide ore in Zambia. Met. Min. 2021, 2, 110–114. [Google Scholar] [CrossRef]
  4. Wang, G.R.; Yang, H.Y.; Liu, Y.Y.; Tong, L.L.; Auwalu, A. The alteration mechanism of copper-bearing biotite and leachable property of copper-bearing minerals in Mulyashy copper mine, Zambia. Sci. Rep. 2019, 9, 15040. [Google Scholar] [CrossRef]
  5. Wang, G.R.; Liu, Y.Y.; Tong, L.L.; Jin, Z.N.; Chen, G.B.; Yang, H.Y. Effect of temperature on leaching behavior of copper minerals with different occurrence states in complex copper oxide ores. Trans. Nonferrous Met. Soc. China 2019, 29, 2192–2201. [Google Scholar] [CrossRef]
  6. Liu, Y.P. Application of novel technology in zambia luanshya Muliashi copper hydrometallurgical plant. Nonferr. Met. Eng. 2015, 5, 36–40. [Google Scholar] [CrossRef]
  7. Li, Y.; Liu, Y.P.; Fu, Y.H.; Liu, Z.L.; Wang, P.L.; Yin, J.; Kou, J.; Sun, C.B.; Liu, W.X. Enhanced leaching of copper from refractory oxidized copper ore by calcium fluoride: Behavior and mechanism. Green Smart Min. Eng. 2024, 1, 85–95. [Google Scholar] [CrossRef]
  8. Liu, Y.P. Study on the test of enhanced agitation leaching of Muliashi low-grade complex copper oxide ore. Nonferr. Min. Metall. 2018, 34, 32–37. [Google Scholar]
  9. Manchisi, J.; Mhandu, T.J.; Kane, J.; Ndlovu, S. A hybrid leaching process to enhance the dissolution of cupriferous micas in the Chingola refractory ore. Hydrometallurgy 2019, 186, 151–161. [Google Scholar] [CrossRef]
  10. Whyte, R.M.; Schoeman, N.; Bowes, K.G. Processing of Konkola copper concentrates and Chingola refractory ore in a fully integrated hydrometallurgical pilot plant circuit. J. South. Afr. Inst. Min. Metall. 2001, 101, 427–436. [Google Scholar]
  11. Yu, B.Q.; Kou, J.; Sun, C.B.; Xing, Y. Extraction of copper from copper-bearing biotite by ultrasonic-assisted leaching. Int. J. Miner. Metall. Mater. 2022, 29, 212–217. [Google Scholar] [CrossRef]
  12. Yan, J.W.; Pan, D.A.; Li, B. Application of ultrasonic intensification in hydrometallurgy leaching process. Chin. J. Process. Eng. 2020, 20, 1241–1247. [Google Scholar] [CrossRef]
  13. Sun, G.R.; Jiang, M.Q.; Wang, S.X.; Fu, L.K.; Zuo, J.G.; Zhang, G.W.; Hu, Z.K.; Zhang, L.B. Enhancement of copper metal dissolution in sulfuric acid solution with oxygen and ultrasound. J. Mater. Res. Technol. 2023, 16, 5016–5027. [Google Scholar] [CrossRef]
  14. Wang, F.; Zhang, Y.M.; Huang, J.; Liu, T.; Zhao, J.; Zhang, G.B. Acid-Leaching of vanadium from stone coal with calcium fluoride addition. Chin. J. Rare Met. 2013, 37, 628–632. [Google Scholar] [CrossRef]
  15. Zeng, S.Y.; Liu, J.E.; Zhou, J.W. Research progress on the influence of impurity ions on the corrosion resistance of anodes in zinc electrodeposition. Chin. Nonferrous Met. 2024, 53, 24–32. [Google Scholar]
  16. Zhou, F.; Zhang, L.S.; Wang, Z.W.; Zhang, Y.X.; Chi, R.A. Effect of surfactant addition on leaching process of weathered crust elution-deposited rare earth ores with magnesium sulfate. Int. J. Min. Sci. Technol. 2023, 33, 1045–1053. [Google Scholar] [CrossRef]
  17. Cai, Z.L.; Wang, Y.; Zhang, Y.M.; Tian, H.Q. Effects of surfactant on Bacillus mucilaginosus adsorption characteristics during vanadium bioleaching process. J. Environ. Chem. Eng. 2022, 10, 108961. [Google Scholar] [CrossRef]
  18. Ai, C.M.; Wu, A.X.; Wang, Y.M.; Hou, C.L. Optimization and mechanism analysis of surfactant accelerating leaching test. J. Cent. South. Univ. Technol. 2016, 23, 1032–1039. [Google Scholar] [CrossRef]
  19. Huang, Y.K.; Wang, D.S.; Liu, H.T.; Fan, G.X.; Peng, W.J.; Cao, Y.J. Selective complexation leaching of copper from copper smelting slag with the alkaline glycine solution: An effective recovery method of copper from secondary resource. Sep. Purif. Technol. 2023, 326, 124619. [Google Scholar] [CrossRef]
  20. Zhang, L.M.; Wang, Y.Y.; Ke, Y.; Sun, Z.M.; Li, Y.; Peng, C.; Zhu, M.F.; Luo, Y.J.; Min, X.B. Facile and complete sulfuric acid leaching of zinc ferrite assisted by copper powder: Leaching mechanism and kinetics investigation. Sep. Purif. Technol. 2024, 328, 125090. [Google Scholar] [CrossRef]
  21. Li, Y.K.; Hou, D.S.; Ding, X.Y.; Kang, X.J.; Liu, Q.F. Influence of coal-measure kaolinite with different types on the preparation of kaolinite nanotube. Appl. Clay Sci. 2023, 246, 107179. [Google Scholar] [CrossRef]
  22. Wu, S.N.; Wu, P. Energetic and configurational mechanisms to facilitate mica nanosheets synthesis by organo-ammonium cation intercalation. Comput. Mater. Sci. 2023, 224, 112162. [Google Scholar] [CrossRef]
  23. Tamesue, S.; Saito, Y.; Toita, R. Salinity durable self-healing hydrogels as functional biomimetic systems based on the intercalation of polymer ions into mica. Polymer 2021, 228, 123870. [Google Scholar] [CrossRef]
  24. Alba, M.D.; Cota, A.; Osuna, F.J.; Pavón, E.; Perdigón, A.C.; Raffin, F. Bionanocomposites based on chitosan intercalation in designed swelling high-charged micas. Sci. Rep. 2019, 9, 10265. [Google Scholar] [CrossRef]
  25. Arslan, H.K.; Shekhah, O.; Wieland, D.C.F.; Paulus, M.; Sternemann, C.; Schroer, M.A.; Tiemeyer, S.; Tolan, M.; Fischer, R.A.; Wöll, C. Intercalation in layered metal-organic frameworks: Reversible inclusion of an extended π-system. J. Am. Chem. Soc. 2011, 13, 8158–8161. [Google Scholar] [CrossRef]
  26. Ismail, N.H.C.; Hashim, F.; Akil, H.M.; Salim, Z.A.S.A. Novel intercalation mechanism of cationic surfactants modified muscovite. Mater. Today Proc. 2022, 66, 4084–4087. [Google Scholar] [CrossRef]
  27. Wei, Y.; Huang, Z.L.; Li, Z.Q.; Huang, X.Y.; Xu, W.R.; Qi, T.G. Preparation and characterization of organic pillared hydromica. J. Wuhan Inst. Technol. 2017, 39, 243–247. [Google Scholar]
  28. Tomohiko, O.; Takumi, Y.; Taku, L. Kinetics of interlayer expansion of a layered silicate driven by caffeine intercalation in the water phase using transmission X-ray diffraction. J. Phys. Chem. 2017, 121, 6919–6925. [Google Scholar] [CrossRef]
  29. Sarkar, M.; Dana, K.; Ghatak, S. Evolution of molecular structure and conformation of n-alkylammonium intercalated iron rich bentonites. J. Mol. Struct. 2011, 1005, 161–166. [Google Scholar] [CrossRef]
  30. Smith, R.B.; Khoo, E.; Bazant, M.S. Intercalation kinetics in multiphase-layered materials. J. Phys. Chem. 2017, 121, 12505–12523. [Google Scholar] [CrossRef]
  31. Yao, D.H.; Huang, Z.L.; Li, Z.Q.; Wei, Y. Extracting potassium from hydromica by oxidation-pillar/ion exchange method. J. Wuhan Inst. Technol. 2017, 36, 607–610. [Google Scholar]
  32. Hu, M.W.; Wang, H.Q.; Xia, H.F.; Meng, P.; Luo, J.; Chen, Y.Q.; Chen, C.L.; Huang, Z.L. Potassium extraction from insoluble potassium mica mine with pillaring method. Non-Met. Min. 2014, 37, 14–18. [Google Scholar]
  33. Klimonda, A.; Kowalska, I. Application of polymeric membranes for the purification of solutions containing cationic surfactants. Water Sci. Technol. 2019, 79, 1241–1252. [Google Scholar] [CrossRef]
  34. Ye, X. Environmental harm of surfactant wastewater and its treatment technology. Sichuan Chem. Ind. 2019, 22, 11–13. [Google Scholar] [CrossRef]
  35. Srient, S.S.; Basak, A.; Ghosh, P.; Chatterjee, J. Separation of anionic surfactant in paste form from its aqueous solutions using foam fractionation. J. Environ. Chem. Eng. 2017, 5, 1586–1598. [Google Scholar] [CrossRef]
  36. Kumar, A.K.; Rawat, N.; Ghosh, P. Removal and recovery of a cationic surfactant from its aqueous solution by foam fractionation. J. Environ. Chem. Eng. 2020, 8, 103555. [Google Scholar] [CrossRef]
  37. Azar, E.; Blanc, C.; Mehdi, A.; Nobili, M.; Stocco, A. Mesoporous Silica Colloids: Wetting, Surface Diffusion, and Cationic Surfactant Adsorption. J. Phys. Chem. C 2019, 123, 26226–26235. [Google Scholar] [CrossRef]
  38. Liu, Y.P.; Fu, Y.H.; Yin, J.; Li, Y.; Deng, J.; Sun, C.B.; Kou, J. Study on leaching technology of acid and impurity control of refractory copper oxide from Luanshya. Met. Min. 2024, 8, 100–105. [Google Scholar] [CrossRef]
  39. Chen, A.Q.; Zhang, L.X.; Li, Q.; Zhu, J.X.; Li, S.Y.; He, H.P. Accuracy and error sources of the Rietveld Full Pattern Fitting method in quantitative analysis of illite ores. Rock. Miner. Anal. 2022, 41, 291–299. [Google Scholar] [CrossRef]
  40. Wei, Y. Research on Barium-Treatment and Organic Intercalation of Biotite. Master’s Dissertation, Wuhan Institute of Technology, Wuhan, China, 2018. [Google Scholar]
  41. Zhang, Y.; Wen, S.M. Copper Hydrometallurgy Theory and Practice, 1st ed.; Metallurgical Industry Press: Beijing, China, 2014. [Google Scholar]
  42. Zhu, R.L.; Zhu, L.Z.; Zhu, J.X.; Xu, L.H. Structure of cetyltrimethylammonium intercalated hydrobiotite. Appl. Clay Sci. 2007, 42, 224–231. [Google Scholar] [CrossRef]
  43. Li, Z.Q.; Wei, Y.; Meng, P.; Huang, Z.L. Effect of reaction temperature and time on biotite pillaring. J. Wuhan Inst. Technol. 2016, 38, 461–464. [Google Scholar] [CrossRef]
  44. Yu, B.Q. Mechanism Study on Heated Leaching of Cupriferous Mica-Type Copper Oxide Ore and Its Leaching Enhancement. Ph.D. Dissertation, University of Science and Technology Beijing, Beijing, China, 2022. [Google Scholar]
  45. Yuan, H.Y.; Dubbink, D.; Besselink, R.; Elshof, J.E. The rapid exfoliation and subsequent restacking of layered titanates driven by an acid–base reaction. Angew. Chem. Int. Ed. 2015, 54, 9239–9243. [Google Scholar] [CrossRef]
  46. Huang, Z.L.; Meng, P.; Li, Z.Q.; Chen, C.L.; Zhang, Z.L. Effect of different concentrations of pillared-reagent on biotite pillaring. J. Wuhan Inst. Technol. 2015, 37, 53–57. [Google Scholar]
  47. Meng, P.; Huang, Z.L.; Li, Z.Q.; Hu, M.W.; Chen, C.L.; Chi, R. Conditions and mechanism for extracting potassium from muscovite in potassium-bearing shale by the barium ion-exchange method. Int. J. Miner. Process. 2015, 142, 107–112. [Google Scholar] [CrossRef]
  48. Meng, P.; Huang, Z.L.; Li, Z.Q.; Wei, Y. Extraction of potassium from potassium-bearing hydromica by barium ion exchange/pillaring method, Collection. In Proceedings of the 15th Annual Symposium of Chinese Society of Mineral and Rock Geochemistry, Changchun, China, 23–29 June 2015; pp. 1–2. [Google Scholar]
  49. Zeng, G.M.; Bao, H.J.; Zhou, H.Y.; Huang, R.Q.; Chen, C.; Xu, Y.Q.; Ning, A. Study on the photo-degradation of cetyltrimethylammonium bromide. Chin. J. Pestic. Sci. 2012, 14, 229–232. [Google Scholar] [CrossRef]
  50. Wang, X.K.; Cheng, S.; Chen, B.M.; He, Y.P.; Huang, H.; Guo, Z.C. Study Status of Energy Saving Anodes and Electrolyte Ions for Copper Electrowinning. Mater. Prot. 2012, 14, 117–121. [Google Scholar] [CrossRef]
  51. Kuosa, M.; Ekberg, B.; Tanttu, L.; Häkkinen, A. Performance comparison of anthracite filter media of different origin in the removal of organic traces from copper electrolyte. Int. J. Miner. Process. 2017, 163, 24–34. [Google Scholar] [CrossRef]
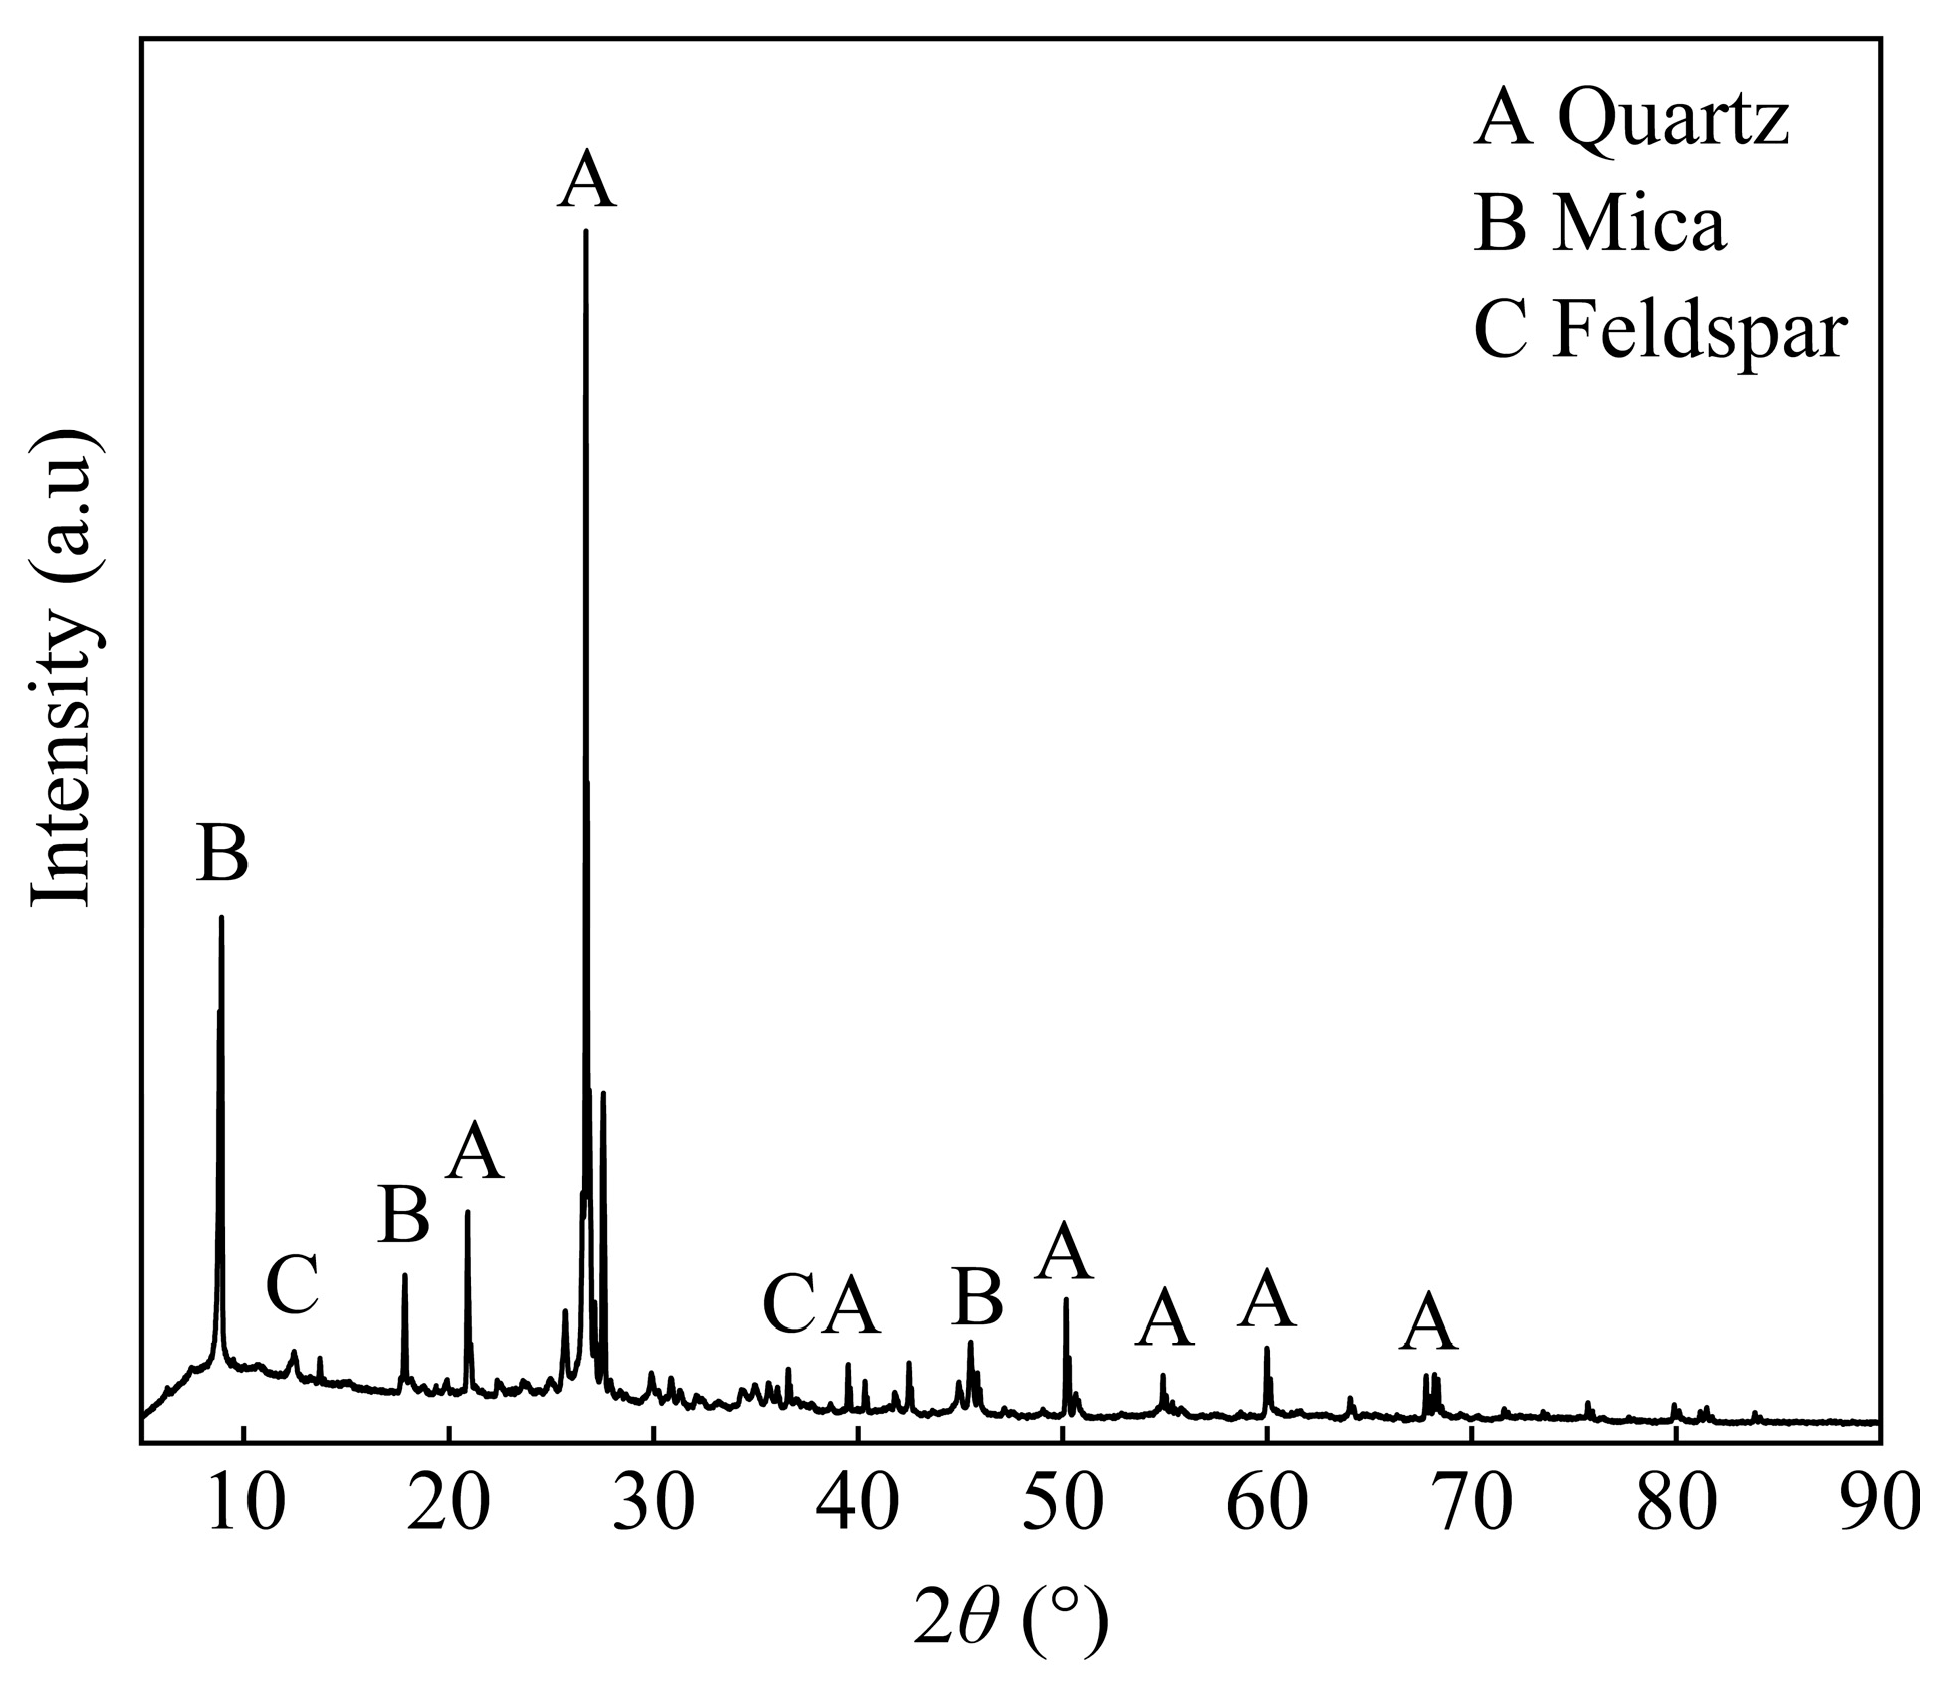
Figure 1. XRD spectrum of raw ore.
Separations 12 00212 g001
Figure 2. Process chart of the experiment.
Separations 12 00212 g002
Figure 3. SEM image and EDS pattern of the raw ore: (a) the element mapping of K, Al, Mg, Si, O, Fe, Cu, and Mn; (b) EDS pattern of point 1; (c) EDS pattern of point 2.
Separations 12 00212 g003
Figure 4. TEM images of nano-sized cupriferous biotite particles.
Separations 12 00212 g004
Figure 5. The yield of each fraction (a) and the main minerals distribution in each fraction (b) of the raw ores.
Separations 12 00212 g005
Figure 6. Leaching characteristics of raw ore: (a) sulfuric acid dosage, (b) liquid-to-solid, (c) leaching temperature, (d) leaching time.
Separations 12 00212 g006
Figure 7. SEM image and EDS pattern of large particle biotite in the residue.
Separations 12 00212 g007
Figure 8. Effect of type and dosage of organic cationic surfactants on copper leaching rate.
Separations 12 00212 g008
Figure 9. Effect of CTAB on leaching temperature.
Separations 12 00212 g009
Figure 10. Effect of CTAB on leaching time.
Separations 12 00212 g010
Figure 11. The fitting results of the relationship between copper leaching rate and time by three control models at different temperatures: (a) chemical reaction control model, (b) diffusion control model, (c) mixed control model.
Separations 12 00212 g011
Figure 12. CTAB-enhanced raw ore acid leaching reaction Arrhenius curve.
Separations 12 00212 g012
Figure 13. The FTIR spectra of leaching residue (a) and biotite (b) before and after adding CTAB.
Separations 12 00212 g013
Figure 14. The secondary ion mass spectra of leaching residue after adding CTAB: (a) positive ion mapping-surface, (b) ion mapping-surface, (c) 3D overlay of -C3H9N.
Separations 12 00212 g014
Figure 15. The optimized molecular model of biotite-CTAB intercalation complex.
Separations 12 00212 g015
Figure 16. The effect of different organic cationic surfactants and CTAB dosage on the 2θ diffraction peak and interlayer spacing of biotite in the leaching residue: (a) different surfactants to 2θ diffraction peak, (b) different surfactants to interlayer spacing, (c) CTAB dosage to 2θ diffraction peak, (d) CTAB dosage to interlayer spacing.
Separations 12 00212 g016
Table 1. Chemical composition of the raw ore. wt%.
CuFeSiAlKMg
1.544.3425.867.825.973.61
MnTiCaCoNaS
0.440.580.300.060.020.12
Table 2. Analysis of the existing state of copper. wt%.
Existing StateContentDistribution Rate
Copper sulfate0.0030.19
Free copper oxide0.4227.20
Combined copper oxide0.9158.94
Primary copper sulfide0.085.12
Secondary copper sulfide0.138.55
Total copper1.54100.00
Table 3. Properties of organic cationic surfactants.
ReagentsMolecular FormulaSolubilityCation Branched Chain StructureSource
DTABC15H34NBrSoluble in waterSeparations 12 00212 i001Komio. Tianjin, China
TTABC17H38NBrSoluble in water after heatingSeparations 12 00212 i002Komio. Tianjin,
China
CTABC19H42NBrSoluble in water after heatingSeparations 12 00212 i003Komio. Tianjin, China
DDACC22H48NClSoluble in waterSeparations 12 00212 i004Rhawn. Shanghai, China
DDAOC14H31NOSoluble in waterSeparations 12 00212 i005Usolf. Shangdong, China
Table 4. Mineral composition analysis of the raw ore. wt%.
QuartzBiotiteFeldsparSericiteVermiculiteKaoliniteChloriteGarnetHornblende
35.4425.8312.659.412.253.202.980.590.52
SepioliteFayaliteIron oxideTenoriteCupriteLibetheniteBrochantiteSulfide copperOther minerals
0.510.681.800.460.010.110.090.103.37
Table 5. Analysis of the existing state of copper in the leaching residue. wt%.
Existing StateContentDistribution Rate
Free copper oxide0.025.13
Combined copper oxide0.2461.54
Primary copper Sulfide0.0512.82
Secondary copper sulfide0.0820.51
Total copper0.39100.00
Table 6. The change in unit cell parameters of biotite before and after adding CTAB.
Itema (Å)b (Å)c (Å)α (deg)β (deg)γ (deg)
Biotite5.3810.7620.3999.9785.43119.97
Biotite with CTAB5.6310.5323.43100.684.28118.22
Table 7. Energy consumption and heating cost analysis of enhanced leaching and regular leaching.
Conditions and ItemEnhanced LeachingRegular Leaching
Dosage of sulfuric acid (kg∙t−1)45
Leaching temperature (°C)65
Copper leaching rate (%)78.3275.26
Leaching time (min)120200
Dosage of CTAB (g∙t−1)75/
CTAB cost (USD∙t−1)3.75–7.00/
Heating power (kWh∙t−1)81.91
Total energy consumption (kWh∙t−1)163.82273.03
Heating power cost (USD∙t−1)19.6532.76
Total heating cost-saving (USD∙t−1)6.11–9.36/
Table 8. Potential merits and demerits.
MeritsDemerits
(1) CTAB markedly accelerates the leaching rate of cupriferous biotite-type copper oxide ore, substantially diminishing the necessary leaching period.
(2) CTAB demonstrates excellent biodegradability and photodegradation, easily decomposes in the natural environment, especially suitable for the African environment with strong light, thereby facilitating environmentally sustainable treatment of leaching residue [49].
(3) In comparison to leaching adds such as calcium fluoride, CTAB demands a considerably lower dosage-less than 0.01 wt% of the total raw ore mass [7].
(1) CTAB itself is toxic and introduces Br into the system. Although the corrosiveness of Br toward stainless-steel equipment is less severe than that of Cl and F, it remains non-negligible [50].
(2) Moreover, the organic cations in CTAB may compete with Cu2+ for extractants during the solvent extraction, potentially resulting in increased extra consumption of the extractant.
(3) Additionally, in the context of oil removal from copper electrowinning solutions, CTAB is generally regarded as a dissolved organic contaminant once solubilized in water. Its presence in the electrowinning system may detrimentally impact the quality of the cathode copper [51].
Disclaimer/Publisher’s Note: The statements, opinions and data contained in all publications are solely those of the individual author(s) and contributor(s) and not of MDPI and/or the editor(s). MDPI and/or the editor(s) disclaim responsibility for any injury to people or property resulting from any ideas, methods, instructions or products referred to in the content.