Article

Simultaneous Determination of 23 Trans Fatty Acids in Common Edible Oils by Gas Chromatography-Mass Spectrometry

1
State Key Laboratory of Biobased Material and Green Papermaking, School of Bioengineering, Qilu University of Technology (Shandong Academy of Sciences), Jinan 250353, China
2
Institute of Quality Standard and Testing Technology for Agro-Products, Shandong Academy of Agricultural Sciences, Jinan 250100, China
3
Shandong Quality and Technical Review and Evaluation Center Co., Ltd., Jinan 250013, China
*
Authors to whom correspondence should be addressed.
Separations 2025, 12(7), 171; https://doi.org/10.3390/separations12070171
Submission received: 26 May 2025 / Revised: 20 June 2025 / Accepted: 26 June 2025 / Published: 28 June 2025

Abstract

Trans fatty acids (TFAs) pose significant health risks, including cardiovascular disease and metabolic disorders. However, the lack of high-resolution, high-sensitivity, and high-throughput quantitative methods for TFA analysis has led to fragmented data on TFA content in edible oils, which constrains research on the quality assessment of edible oils. In this study, we developed a high-resolution and high-sensitivity gas chromatography-mass spectrometry method to simultaneously determine 23 TFA isomers. The method validation demonstrated good sensitivity, linearity, accuracy, and precision. Based on the proposed method, we analyzed 170 samples of 11 common edible oils, establishing a comprehensive TFA profile for each type. Ruminant fats (beef tallow, mutton tallow, butter) had high TFA levels (0.8–4.8 g/100 g), dominated by vaccenic acid (C18:1 t11) and conjugated linoleic acid, while vegetable oils (soybean, corn, peanut and sesame oil) exhibited lower concentrations (0.5–2.2 g/100 g), especially monounsaturated TFAs. Particularly, soybean oil was rich in C18:3 isomers, while shortening presented the closest similarity to sesame oil. Cluster analysis distinguished oils by TFA composition, highlighting low-TFA clusters (sunflower oil, pork lard, cream). In conclusion, the high-resolution, high-sensitivity, and high-throughput TFA quantification method developed in this study provides technical support for establishing characteristic TFA profiles in edible oils, while offering data support to further quality assessment.

1. Introduction

Trans fatty acids (TFAs) are a class of unsaturated fatty acids characterized by the presence of one or more double bonds in the trans configuration. Naturally occurring unsaturated fatty acids (UFAs) predominantly adopt the cis configuration, while TFAs exist in small quantities in ruminant-derived products (e.g., beef, lamb, and dairy) due to microbial hydrogenation in the rumen [1,2]. In contrast, industrially processed fats, such as partially hydrogenated vegetable oils found in margarine and shortening, contain significantly higher proportions of TFAs [3]. The trans configuration confers a more linear molecular structure, enabling tighter packing and higher melting points compared to their cis counterparts (e.g., elaidic acid trans-C18:1 melts at 45 °C, whereas oleic acid cis-C18:1 melts at 14 °C) [4]. Due to these physicochemical properties, TFAs incorporated into biological membranes reduce membrane fluidity, leading to impaired permeability, mitochondrial dysfunction, neuronal membrane abnormalities [5,6,7]. Furthermore, TFAs competitively inhibit the metabolism of essential fatty acids, disrupting lipid metabolic pathways. This interference results in altered membrane phospholipid composition, dysregulated neurotransmitter synthesis and release, lipoprotein metabolism disorders [6]. Clinically, TFA consumption is associated with elevated cardiovascular risk, metabolic disturbances, and chronic inflammation [5,6,8,9,10].
In nature, fatty acids exhibit remarkable diversity, with significant variations in their composition among different species [11,12]. Comprehensive and accurate quantitative detection of fatty acids is of great significance for the quality evaluation of edible oil. Currently, gas chromatography with flame ionization detection (GC-FID) remains the predominant analytical approach. While this method enables rapid quantification of major fatty acids through area normalization, it faces considerable limitations in separating various isomers, including cis/trans isomers and double-bond positional isomers [13]. Even when employing strongly polar 100 m capillary columns, baseline separation of all isomers remains unachievable. Particular difficulties arise in the analysis of TFAs, which typically exist at trace levels below the detection limit of FID. Furthermore, their coexistence with abundant fatty acids often leads to column overload or peak coelution issues. To improve resolution, some studies have employed combined separation strategies. Dual temperature programs on the same column [13], sequential analysis using different chromatographic columns [14,15], or silver-ion thin layer chromatography (Ag+-TLC) prefractionation prior to GC analysis [16,17,18], etc., have been applied and discussed. While these approaches enhance separation of multiple trans isomers, they complicate the integration of complete fatty acid profiling data [11,19]. To address sensitivity limitations, mass spectrometry (MS) detection has become essential. However, MS quantification requires individual calibration curves for each compound based on characteristic ions, significantly increasing method development workload compared to the rapid area normalization approach possible with FID. Therefore, the lack of high-resolution, high-sensitivity, and high-throughput detection methods has consistently hindered in-depth research on the fatty acid profiles of edible oils, representing an urgent challenge that needs to be addressed.
The content of TFAs in edible oils exhibits significant variation depending on oil type and processing methods (e.g., refining, hydrogenation). Naturally processed palm oil contains negligible TFAs, while virgin olive oil maintains exceptionally low levels [20]. In common vegetable oils (soybean, corn, and rapeseed oils), TFAs typically constitute 0.1–2% of total fatty acids [12]. Industrial hydrogenated vegetable oils, such as shortening and margarine, are commonly assumed to contain elevated levels of TFAs. Elaidic acid (C18:1 t9) was identified as the predominant TFA isomer in hydrogenated oils [21]. Trace amounts of C16:1 trans isomers were also detected in these products, with concentrations consistently below 0.3% of total fatty acids, while these C16:1 trans isomers were absent in non-hydrogenated vegetable oils [12]. Notably, significant variations in TFA content exist due to differences in processing technologies [22]. Ruminant-derived fats (e.g., beef tallow, lamb fat, and butter) contain 2–9% TFAs due to microbial hydrogenation in the rumen [23]. Among the TFAs present in natural animal fats, vaccenic acid (C18:1 t11) constitutes the predominant fraction, accounting for over 50–80% of total TFAs [24]. C18:2 and C18:3 trans isomers, which demonstrate notable functional properties as polyunsaturated fatty acids (PUFAs), are also abundance in edible oils [12], and conjugated linoleic acid (CLA) is characteristically found in animal-derived fats. However, the lack of standardized detection methods, particularly the limited and inconsistent coverage of TFAs species analyzed across studies, has resulted in fragmented historical data.
To achieve more comprehensive and accurate quantitative analysis of TFAs, thereby facilitating systematic and scientifically rigorous compositional characterization and quality evaluation of edible oils, the development of a high-resolution, high-sensitivity, and high-throughput fatty acid quantification method is fundamentally essential. Therefore, this study established a GC-MS method for simultaneous detection of 23 TFA species with both high resolution and high sensitivity. Based on the proposed method, we performed quantitative analysis of TFAs in 11 common edible oils and constructed their corresponding fingerprint profiles.

2. Materials and Methods

2.1. Chemicals and Reagents

Methanol and n-hexane (all HPLC grade) were obtained from Fisher Scientific (Waltham, MA, USA). Ethanol (purity ≥ 95%), NaOH (purity ≥ 95%), and acetyl chloride (purity > 99.5%) were purchased from Sinopharm Chemical Reagent Co., Ltd (Shanghai, China). Ultrapure water was prepared using a Milli-Q purification system (Millipore, Burlington, MA, USA).
The reference standards used in this study were as follows: FAME solution GLC 674 from Nu-Chek Prep; 37-FAME-Mix from Alta Scientific (Tianjin, China); 2-CLA FAME-mix (C18:2 cis-9,trans-11 and C18:2 trans-10,cis-12), 4-C18:2 FAME-mix (C18:2 trans-9,cis-12, C18:2 cis-9,trans-12, C18:2 trans-9,trans-12, C18:2 cis-9,cis-12), and 8-C18:3 FAME-mix (C18:3 trans-9,trans-12,trans-15, C18:3 trans-9,trans-12,cis-15, C18:3 trans-9,cis-12,trans-15, C18:3 cis-9,cis-12,trans-15, C18:3 cis-9,trans-12,trans-15, C18:3 cis-9,trans-12,cis-15, C18:3 trans-9,cis-12,cis-15, C18:3 cis-9,cis-12,cis-15) were all purchased from ANPEL. The internal standard C10:1 cis-4 FA individual standard was obtained from Macklin Biochemical Technology Co., Ltd (Shanghai, China).

2.2. Sample Collection

This study collected a total of 170 batches of 11 common edible oils for analysis, including 22 batches of peanut oil from local markets in Shandong, China; 15 batches of corn oil from local markets in Shandong, Shanghai and Guangdong, China; 13 batches of soybean oil from local markets in Shandong and Shanghai, China; 17 batches of sesame oil from local markets in Shandong, China; 14 batches of sunflower oil from local markets in Shandong, Tianjin and Jiangsu, China; 18 batches of lard from local markets in Shandong, Fujian and Jiangsu, China; 11 batches of beef tallow from local markets in Henan and Chongqing, China; 12 batches of mutton tallow from local markets in Shandong and Henan, China; 17 batches of cream from local markets in Shandong, Jiangsu and Guangdong, China; 2 batches of butter from Air Canada flights (brands: Lurpak and Saputo) and 18 batches from local markets in Shandong, Hebei and Shanghai, China; and 11 batches of shortening from local markets in Guangdong and Tianjin, China. All samples were stored at −20 °C.

2.3. Sample Preparation

The frozen samples were completely thawed at room temperature prior to analysis. Lipid extraction and methyl esterification were performed according to the method described by Wang [11], with subsequent analysis of the resulting fatty acid methyl esters (FAMEs) by GC-MS.
Briefly, approximately 0.5 g of sample was weighed, and dissolved in 5 mL of n-hexane by vortex mixing. 25 µg internal standard C10:1 cis-4 FA was then added. An amount of 2 mL of 2% sodium hydroxide–methanol solution was added, followed by sealing and incubation at 50 °C for 15 min. 2 mL of 10% acetyl chloride–methanol solution was then added, followed by sealing and incubation at 90 °C for another 150 min. After transesterification, the samples were cooled to room temperature, followed by sequential addition of 5 mL n-hexane and 5 mL water along the tube wall. After phase separation, the n-hexane layer was collected, and subsequently diluted and analyzed by GC-MS.

2.4. GC-MS Detection

FAMEs were analyzed using an Agilent 7890B GC system equipped with a 5977 MS detector (Agilent Technologies, Santa Clara, CA, USA) and a capillary CP-Sil 88 column (100 m × 0.25 mm × 0.2 μm) (Agilent Technologies, Middelburg, The Netherlands). The injection volume was 1 μL, and the split ratio was 10:1. Helium was employed as the carrier gas with a total run time of 165 min. The pressure was controlled using a programmed pressure-variable mode: maintained at 38 psi from 0–75 min, decreased to 26 psi from 75–81 min, held at 26 psi from 81–111 min, increased back to 38 psi from 111–114 min, and finally maintained at 38 psi from 114–165 min. The inlet temperature was 270 °C, and the oven temperature had the following program: 100 °C held for 8 min, increased by 4 °C/min to 120 °C, held for 8 min and increased by 4 °C/min to 160 °C, held for 35 min and increased by 0.2 °C/min to 170 °C, and then increased by 1 °C/min to 180 °C, and increased by 2 °C/min to 210 °C, held for 15 min and increased by 20 °C/min to 230 °C, held for 8 min. The temperature of the transfer line was set to 250 °C, and the solvent delay was 20 min.
The temperature of the MS ion source was set to 230 °C, and the ionizing energy was 70 eV. Qualitative and quantitative analyses of FAME were performed in the selected ion monitoring mode (Table 1). Peak identification of FAME was based on retention time and the characteristic ions, including 1 quantitative ion and 3 qualitative ions. Based on the peak area of the quantitative ion, FAME quantification was performed using standard curves of each external standard and calibrated using the internal standard. To improve sensitivity, the quantitative ion of each FAME was selected at the best signal-to-noise ratio, and the runtime was divided into 9 time windows to scan the selected characteristic ions, in which the dwell time of each ion was >8 ms, and the scanning frequency was >4.1 cycle/s. The quantification results were expressed as absolute contents, with individual fatty acids reported in g/kg and their total sum reported in g/100 g.

2.5. Method Validation

Sensitivity, linearity, accuracy, and precision were involved in validating the method (ICH, 2005). Sensitivity was calculated from the concentrations with signal-to-noise ratios (SNR) of 3 and 10, and expressed as the limit of detection (LOD) and quantitation (LOQ), respectively. The standard curve and linear range for each FAME were established, and at least six different concentrations were used to determine the regression equation. In this study, we initially conducted preliminary analyses on 11 sample matrices to identify the absent TFA species. Subsequently, a standardized mixture containing 23 TFA reference standards (each at three different concentration levels) was added to all samples. The accuracy and precision of the proposed method were then evaluated by calculating the recoveries and variation coefficients of the previously absent TFAs.

2.6. Statistical Analysis

The data were analyzed and sorted using Excel 2023. Heatmap clusters were analyzed using the Omic share tools at Gene Nenovo website (https://www.omicshare.com/tools/) (accessed on 23 May 2025).

3. Results and Discussion

3.1. Chromatographic Separation of 23 Kinds of TFAMEs

The use of a 100-m CP Sil-88 column, programmed pressure and an optimized temperature gradient have significantly improved column efficiency and chromatographic resolution. As illustrated in Figure 1a, the proposed method successfully achieved simultaneous chromatographic separation of 23 common trans fatty acid methyl esters (TFAMEs), including 11 monounsaturated TFAMEs (C14-C22), 5 C18:2 FAME isomers and 7 C18:3 FAME isomers.
Notably, only one co-elution peak was observed among these 23 TFAMEs, corresponding to C18:3 t9t12c15 and C18:3 t9c12t15 (Figure 1c). These particular C18:3 isomers presented analytical challenges due to their nearly identical retention times and shared characteristic ions, as reported in previous studies [25,26]. In this study, they were quantified using peak summation. Moreover, while C19:1 t10 and C18:2 c9c12 FAMEs exhibited similar retention times in chromatographic separation (Figure 1a), as did C20:1 t11 and C18:3 c9c12c15 FAMEs, effective resolution of these critical isomer pairs was successfully achieved through selective ion monitoring (Figure 1c). It should be noted that C18 FAMEs exhibit particularly complex isomerism with closely related physicochemical properties, potentially leading to additional co-elution phenomena [25]. However, the commercial unavailability of certain standards (particularly for FA or FAME isomers such as C18:1 t10) limited complete identification and may potentially lead to co-elution or misjudgment in practical analyses.

3.2. Method Validation Results

To enhance signal response, a multi-window scanning mode was employed in mass spectrometric detection, which optimally increased the dwell time of characteristic ions while maintaining appropriate scanning frequency, thereby significantly improving instrument sensitivity. As presented in Table 1, the method achieved quantification limits of 10 µg/L for 9 TFAMEs, 20 µg/L for nine compounds, 30 µg/L for three species, 40 µg/L for one compound, and 60 µg/L for three analytes (including the co-eluting compounds C18:3 t9t12c15 and C18:3 t9c12t15). With a 500-fold dilution factor employed in sample preparation, the corresponding quantification ranges in original samples were 0.001–0.006 g/100 g. Compared with previous reports [11,25], the current method demonstrates improved sensitivity. Furthermore, the detection sensitivity could be further enhanced by adjusting the dilution factor according to specific analytical requirements.
To meet the analytical requirements of sample detection, the linear ranges of the calibration curves were carefully optimized according to the typical concentration levels of each fatty acid. For low-abundance TFAs such as C14:1 t9, the linear range was set at 5–250 ppb, while for more abundant species like C18:1 t11, an extended range of 30–6000 ppb was selected. This selection of the linear range significantly improved the accuracy of quantitative analysis. As shown in Table 1, all examined TFAs demonstrated excellent linearity with coefficient of determination (R2) values exceeding 0.999 for their respective regression equations, indicating superior fitting of the calibration curves.
A preliminary screening of TFAs was conducted in 11 common edible oils to confirm the absence of detectable TFAs. For method validation, recovery experiments were performed using one sunflower oil and one lard sample spiked with a FAME mixed standard at three concentration levels. Triplicate analyses were conducted for each spiked sample, with the proportional composition of FAMEs matching the available standard mixture. As summarized in Table 2, the proposed method demonstrated good accuracy and precision, with recoveries ranging from 75.4% to 92.6% and coefficients of variation (CVs) between 2.8% and 9.1%. Although the recovery test only presented results for TFAs naturally absent in the matrix, the extraction and esterification efficiencies of different fatty acids were highly consistent, thus yielding relatively uniform recoveries. Using sunflower oil and pork lard to represent plant-based and animal-based lipid matrices, respectively, this approach objectively evaluates the accuracy and precision of the fatty acid detection method.

3.3. The Profile of TFAs in Edible Oil

Analysis of 170 samples established comprehensive TFA profiles comprising 23 species across 11 common edible oils (Table 3). Among the five vegetable oils examined, monounsaturated TFAs occurred at relatively low levels and were exclusively represented by C18:1 t9 and C18:1 t11. Sesame oil exhibited significantly higher C18:1 t9 content, resulting in greater total monounsaturated TFA content compared to other vegetable oils, which is consistent with previous reports [12]. The C18:2 trans fatty acids constituted a predominant proportion of total TFAs in vegetable oils, with C18:2 c9t12 and C18:2 t9c12 being the major isomers, with no detectable CLA (C18:2 c9t11 and C18:2 t10c12). Corn oil contained markedly elevated total C18:2 TFA levels versus other vegetable oils, aligning with literature data [12]. Substantial variability was observed for C18:3 TFAs, with soybean oil demonstrating particularly high concentrations of C18:3 c9c12t15 and C18:3 t9c12c15, leading to significantly greater total C18:3 TFA content. Total TFA concentrations across vegetable oils ranged from 0.5 to 2.2 g/100 g, with sunflower oil consistently showing the lowest values for all TFA categories (monounsaturated, C18:2, and C18:3 isomers), in agreement with published data [12].
Animal fats exhibited greater diversity and higher concentrations of TFAs compared to vegetable oils. Ruminant-derived fats (beef tallow, mutton tallow, and butter) contained exceptionally high levels of monounsaturated TFAs, predominantly contributed by C18:1 t11. The total content of C18:2 TFAs was comparable between animal and vegetable fats. However, a striking distinction was observed in their isomeric composition: animal fats predominantly contained CLA isomers, whereas vegetable oils exclusively comprised non-conjugated C18:2 trans isomers (e.g., C18:2 c9t12 and C18:2 t9c12), with no detectable CLA. Notably, C18:2 t10c12 was exclusively detected in bovine-derived products (beef tallow, butter, and cream). The C18:3 TFA content showed similar quantitative ranges but greater species variability in animal fats, likely reflecting the complex biohydrogenation pathways mediated by rumen microbiota [9]. Total TFA concentrations in animal fats ranged from 0.8–4.8 g/100g, with cream and pork lard showing significantly lower values. This reduction in cream can be attributed to its high water content, while the lower TFA levels in pork lard may reflect the absence of microbial biohydrogenation in monogastric pigs, whose fatty acid profiles primarily derive from dietary sources rather than endogenous microbial synthesis.
Notably, shortening, a hydrogenated vegetable oil product, did not demonstrate significantly higher TFA content than conventional vegetable oils, showing only increased diversity and concentration of monounsaturated TFAs (e.g., C16:1 t9). This observation likely reflects the industrial transition from traditional partial hydrogenation (which generates TFAs) to modern processing technologies such as complete hydrogenation and interesterification [27], resulting in higher saturation levels rather than trans-isomer formation.
Overall, ruminant-derived fats (beef tallow, mutton tallow, and butter) exhibited significantly higher TFA content, while sunflower oil and pork lard presented lower content on the contrary. Given the dualistic biological effects of PUFAs such as C18:2 and C18:3—which exhibit both beneficial and adverse health impacts—these compounds were excluded from TFA risk assessment. When evaluating only monounsaturated TFAs, soybean, corn, and sunflower oils demonstrated significantly lower concentrations (<0.05 g/100 g of total fatty acids) compared to other oil types.

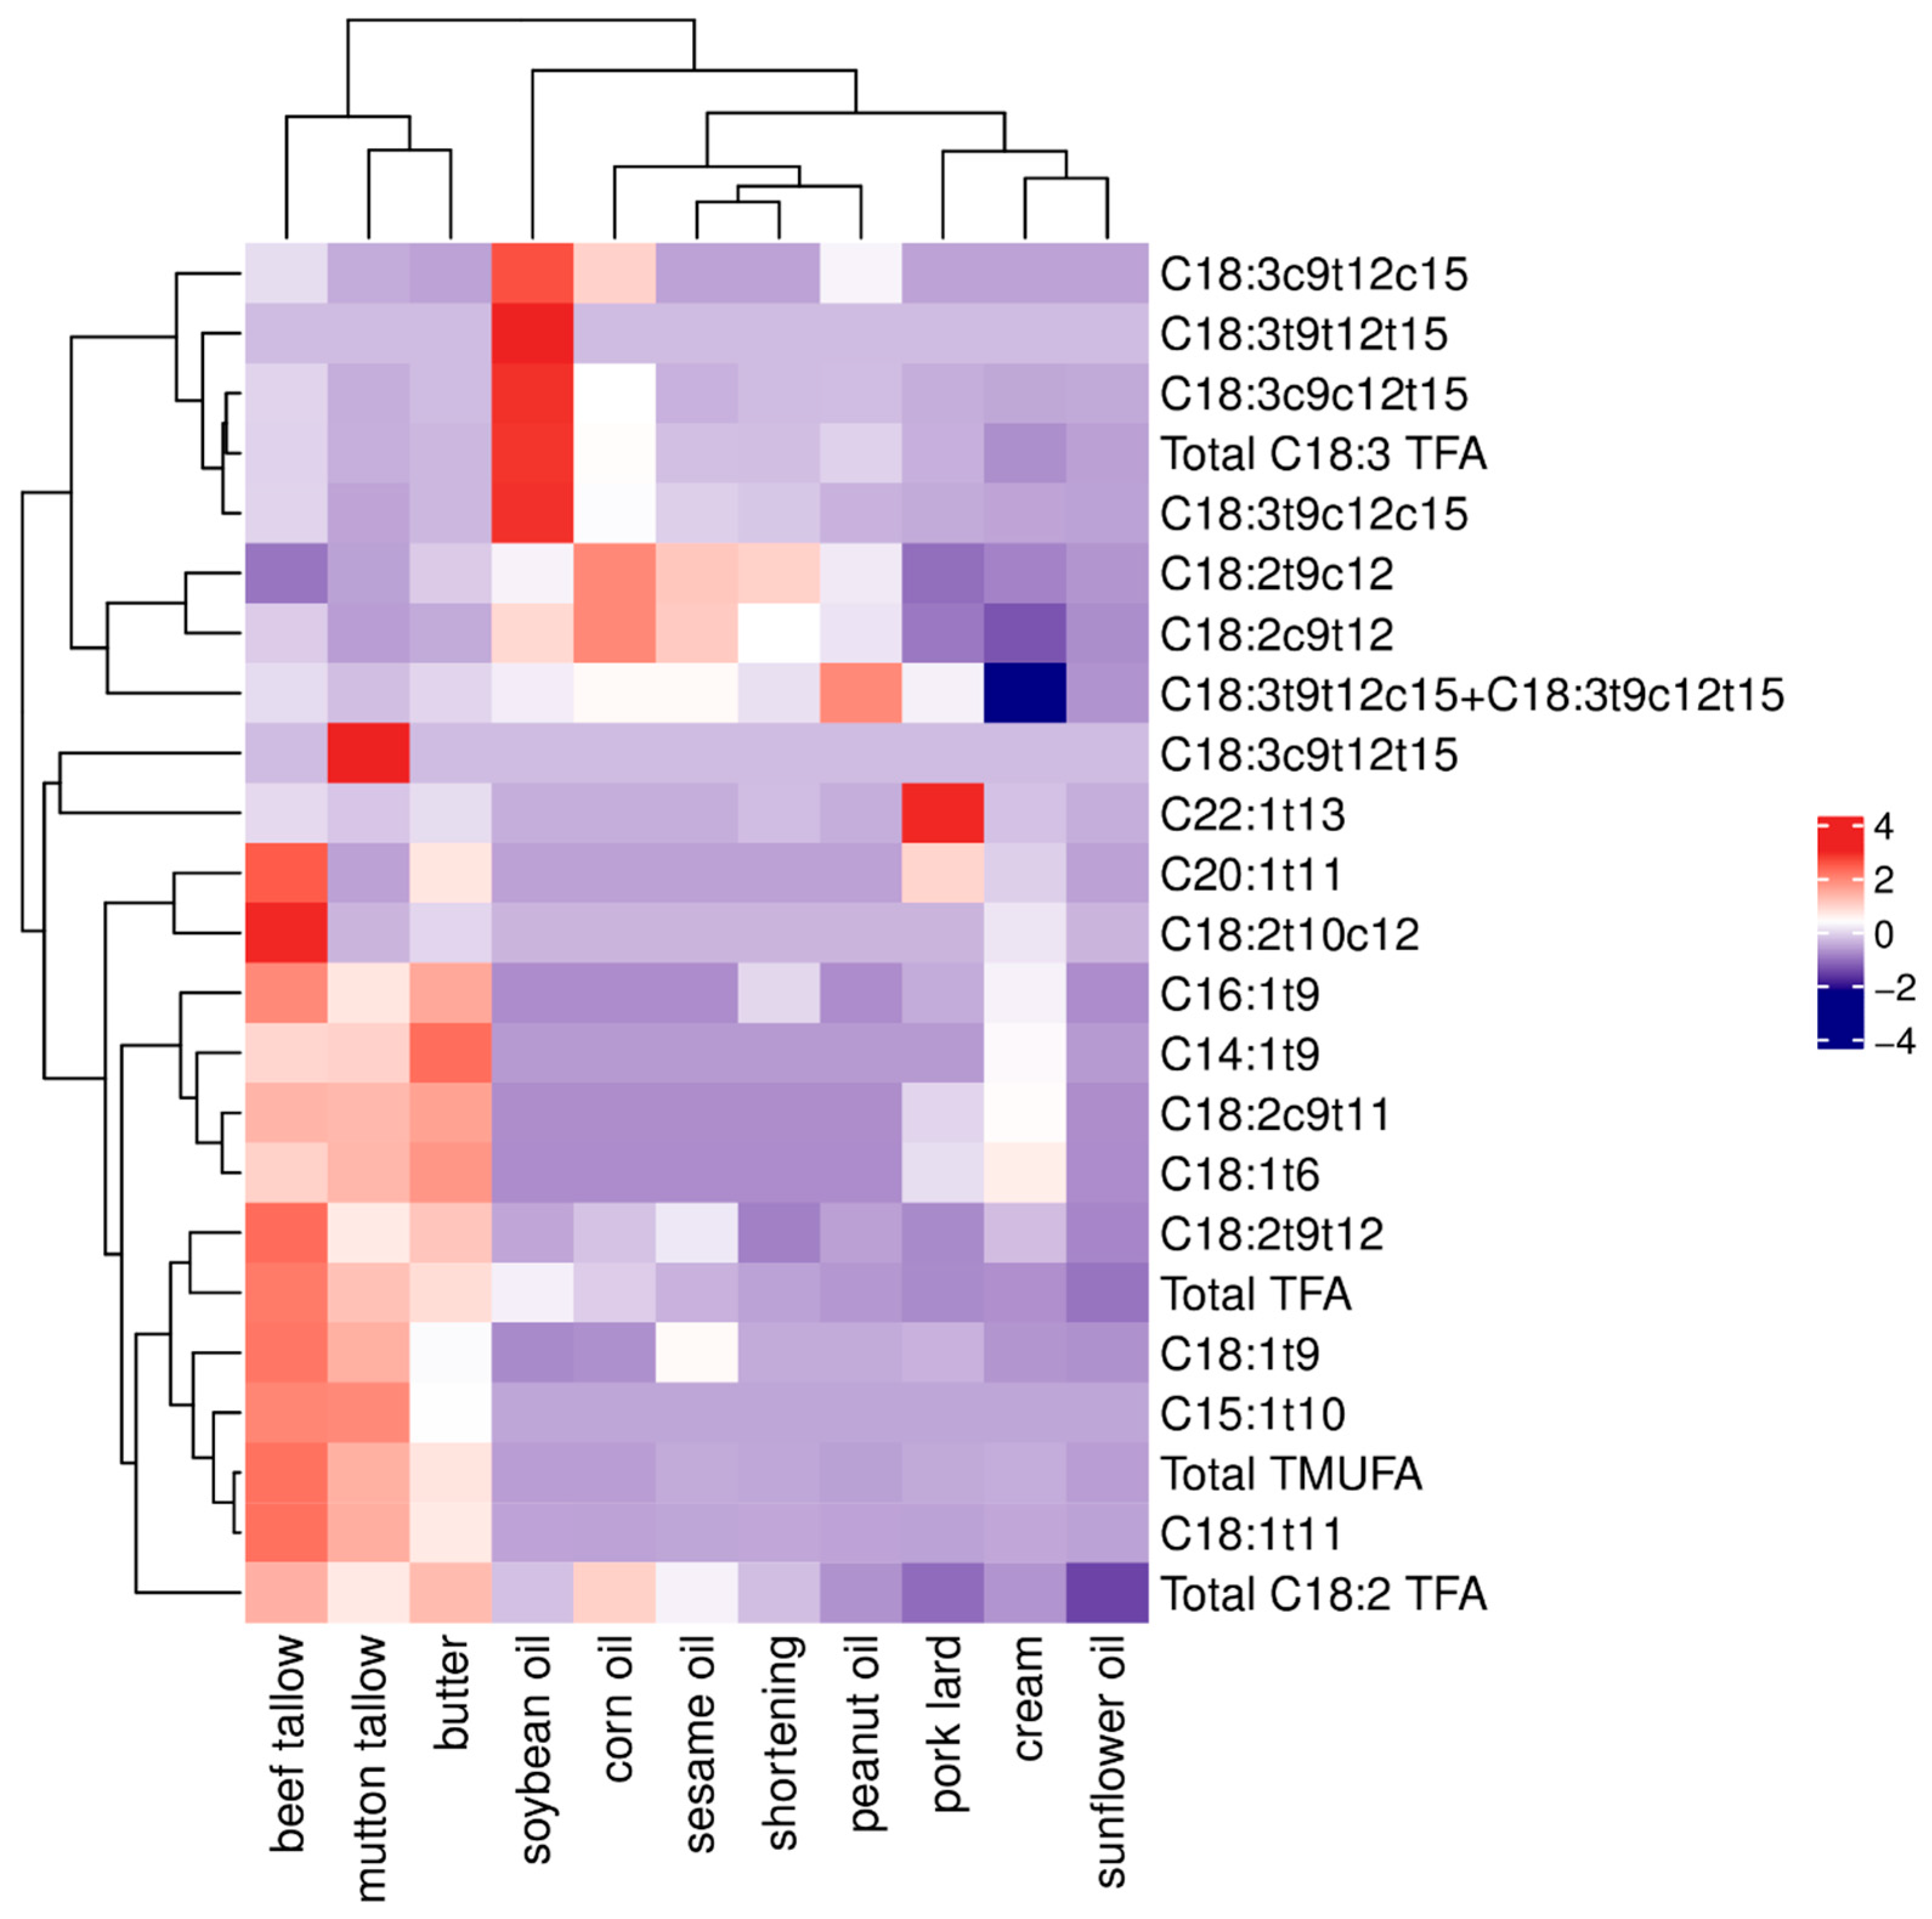
3.4. Cluster Analysis

Based on the TFA profiling results, cluster analysis was performed for the 11 common edible oils. As illustrated in Figure 2, beef tallow, mutton tallow, and butter exhibited similar TFA compositions that were markedly distinct from other tested oils, characterized by significantly higher levels of monounsaturated TFAs along with elevated contents of CLA and C18:2 t9t12. Soybean oil formed a separate cluster primarily due to its uniquely high C18:3 TFA content. Corn oil, peanut oil, and sesame oil showed comparable TFA profiles, with shortening demonstrating the closest similarity to sesame oil. In contrast, pork lard, cream, and sunflower oil were grouped together, distinguished from other oils by their consistently low concentrations across all TFA categories.

4. Conclusions

This study developed a GC-MS method for simultaneous analysis of 23 TFA isomers, achieving high-resolution and high-sensitivity. The method validation demonstrated good sensitivity, linearity, accuracy, and precision, fully meeting the analytical requirements for practical sample detection. Based on the proposed method, we analyzed 170 samples and constructed TFA profiles for 11 common edible oils. Ruminant fats (beef tallow, mutton tallow, butter) had high TFA levels (0.8–4.8 g/100 g), dominated by C18:1 t11 and CLA, while vegetable oils (soybean, corn, peanut and sesame oil) exhibited lower concentrations (0.5–2.2 g/100 g), especially monounsaturated TFAs. Particularly, soybean oil was rich in C18:3 isomers, while shortening presented the closest similarity to sesame oil. Cluster analysis distinguished oils by TFA composition, highlighting low-TFA clusters (sunflower oil, pork lard, cream). In conclusion, the high-resolution, high-sensitivity, and high-throughput TFA quantification method developed in this study provides robust technical support for establishing characteristic TFA profiles in edible oils, while offering a fundamental data framework for further quality assessment.

Author Contributions

Conceptualization, F.W.; methodology, F.W.; software, Y.C.; validation, Y.C., K.W. and X.W.; formal analysis, F.W.; investigation, K.W., X.W.; resources, X.L.; data curation, X.L.; writing—original draft preparation, F.W.; writing—review and editing, F.W.; visualization, Y.C.; supervision, X.L.; project administration, J.Z.; funding acquisition, J.Z. All authors have read and agreed to the published version of the manuscript.

Funding

This study was funded by the Central Guiding Local Science and Technology Development Special Fund Project (YDZX2024015, YDZX2023006); the Key Innovation Project of Qilu University of Technology (Shandong Academy of Sciences) (2024ZDZX03); and the 2023 Provincial Key R&D Plan (Rural Revitalization Science and Technology Innovation Boosting Action Plan (2023TZXD003).

Data Availability Statement

All data supporting the findings of this study are available within the paper.

Conflicts of Interest

Authors Kun Wang and Xianpeng Wu were employed by the company Shandong Quality and Technical Review and Evaluation Center Co., Ltd. The remaining authors declare that the research was conducted in the absence of any commercial or financial relationships that could be construed as a potential conflict of interest.

References

  1. Wanders, A.J.; Zock, P.L.; Brouwer, I.A. Trans Fat Intake and Its Dietary Sources in General Populations Worldwide: A Systematic Review. Nutrients 2017, 9, 840. [Google Scholar] [CrossRef] [PubMed]
  2. Enjalbert, F.; Zened, A.; Cauquil, L.; Meynadier, A. Integrating Data from Spontaneous and Induced trans-10 Shift of Ruminal Biohydrogenation Reveals Discriminant Bacterial Community Changes at the OTU Level. Front. Microbiol. 2023, 13, 1012341. [Google Scholar] [CrossRef]
  3. Niforou, A.; Magriplis, E.; Klinaki, E.; Niforou, K.; Naska, A. On Account of Trans Fatty Acids and Cardiovascular Disease Risk—There Is Still Need to Upgrade the Knowledge and Educate Consumers. Nutr. Metab. Cardiovasc. Dis. 2022, 32, 1811–1818. [Google Scholar] [CrossRef]
  4. Oteng, A.B.; Kersten, S. Mechanisms of Action of Trans Fatty Acids. Adv. Nutr. 2020, 11, 697–708. [Google Scholar] [CrossRef]
  5. Harvey, K.A.; Arnold, T.; Rasool, T.; Antalis, C.; Miller, S.J.; Siddiqui, R.A. Trans-Fatty Acids Induce Pro-Inflammatory Responses and Endothelial Cell Dysfunction. Br. J. Nutr. 2008, 99, 723–731. [Google Scholar] [CrossRef] [PubMed]
  6. Pase, C.S.; Bürger, M.E. Trans Fat Intake and Behavior. In The Molecular Nutrition of Fats; Academic Press: Cambridge, MA, USA, 2019; pp. 189–197. [Google Scholar] [CrossRef]
  7. Wang, L.; Liu, T.; Guo, J.; Zhao, T.; Tang, H.; Jin, K.; Li, L.; Xue, Y.; Yang, R.; Chen, J.; et al. Abnormal Erythrocyte Fatty Acid Composition in First-Diagnosed, Drug-Naïve Patients with Depression. J. Affect. Disord. 2022, 318, 414–422. [Google Scholar] [CrossRef]
  8. Song, G.; Zhang, M.; Peng, X.; Yu, X.; Dai, Z.; Shen, Q. Effect of Deodorization Method on the Chemical and Nutritional Properties of Fish Oil during Refining. LWT-Food Sci. Technol. 2018, 96, 560–567. [Google Scholar] [CrossRef]
  9. El-Aal, Y.A.A.; Abdel-Fattah, D.M.; Ahmed, K.E.-D. Some Biochemical Studies on Trans Fatty Acid-Containing Diet. Diabetes Metab. Syndr. Clin. Res. Rev. 2019, 13, 1753–1757. [Google Scholar] [CrossRef] [PubMed]
  10. Guasch-Ferré, M.; Babio, N.; Martínez-González, M.A.; Corella, D.; Ros, E.; Martín-Peláez, S.; Estruch, R.; Arós, F.; Gómez-Gracia, E.; Fiol, M.; et al. Dietary Fat Intake and Risk of Cardiovascular Disease and All-Cause Mortality in a Population at High Risk of Cardiovascular Disease. Am. J. Clin. Nutr. 2015, 102, 1563–1573. [Google Scholar] [CrossRef]
  11. Wang, F.; Chen, M.; Luo, R.; Huang, G.; Wu, X.; Zheng, N.; Zhang, Y.; Wang, J. Fatty Acid Profiles of Milk from Holstein Cows, Jersey Cows, Buffalos, Yaks, Humans, Goats, Camels, and Donkeys Based on Gas Chromatography–Mass Spectrometry. J. Dairy Sci. 2022, 105, 1687–1700. [Google Scholar] [CrossRef]
  12. Fang, H.; Cao, M.; Zhang, X.; Wang, K.; Deng, T.; Lin, J.; Liu, R.; Wang, X.; Liu, A. The Assessment of Trans Fatty Acid Composition in Edible Oil of Different Brands and Regions in China in 2021. Food Chem. 2023, 121, 105394. [Google Scholar] [CrossRef]
  13. Amores, G.; Virto, M. Total and Free Fatty Acids Analysis in Milk and Dairy Fat. Separations 2019, 6, 14. [Google Scholar] [CrossRef]
  14. Pojjanapornpun, S.; Nakornsadet, A.; Sombutsuwan, P.; Chumsantea, S.; Krisnangkura, K.; Aryusuk, K. Simulation of Fatty Acid Peak Profile on a 100-m CP-Sil 88 Column and Application for Analysis of Commercial Trans Fat Alternatives in Thailand. J. Food Compos. Anal. 2020, 91, 103525. [Google Scholar] [CrossRef]
  15. Bravo-Lamas, L.; Aldai, N.; Kramer, J.K.G.; Barron, L.J.R. Case Study Using Commercial Dairy Sheep Flocks: Comparison of the Fat Nutritional Quality of Milk Produced in Mountain and Valley Farms. LWT-Food Sci. Technol. 2018, 89, 374–380. [Google Scholar] [CrossRef]
  16. Momchilova, S.M.; Nikolova-Damyanova, B.M. Advances in Silver Ion Chromatography for the Analysis of Fatty Acids and Triacylglycerols—2001 to 2011. Anal. Sci. 2012, 28, 837–844. [Google Scholar] [CrossRef]
  17. Precht, D.; Molkentin, J.; Destaillats, F.; Wolff, R.L. Comparative Studies on Individual Isomeric 18:1 Acids in Cow, Goat, and Ewe Milk Fats by Low-Temperature High-Resolution Capillary Gas-Liquid Chromatography. Lipids 2001, 36, 827–832. [Google Scholar] [CrossRef] [PubMed]
  18. Rodriguez-Alcala, L.M.; Alonso, L.; Fontecha, J. Stability of Fatty Acid Composition after Thermal, High Pressure, and Microwave Processing of Cow Milk as Affected by Polyunsaturated Fatty Acid Concentration. J. Dairy Sci. 2014, 97, 7307–7315. [Google Scholar] [CrossRef] [PubMed]
  19. Zhang, M.; Yang, X.; Zhao, H.T.; Dong, A.J.; Wang, J.; Liu, G.Y.; Wang, P.; Cheng, C.; Zhang, H. A Quick Method for Routine Analysis of C18 Trans Fatty Acids in Non-Hydrogenated Edible Vegetable Oils by Gas Chromatography–Mass Spectrometry. Food Control 2015, 57, 293–301. [Google Scholar] [CrossRef]
  20. Sarwar, S.; Shaheen, N.; Ashraf, M.M.; Bahar, N.; Akter, F.; Hossain, M.; Mridha, M.K.; Kajal, M.A.M.; Bin Rasul, S.S.; Khondker, R.; et al. Fatty Acid Profile Emphasizing Trans-Fatty Acids in Commercially Available Soybean and Palm Oils and Its Probable Intake in Bangladesh. Food Chem. Adv. 2024, 4, 100611. [Google Scholar] [CrossRef]
  21. Ganguly, R.; Pierce, G.N. The Toxicity of Dietary Trans Fats. Food Chem. Toxicol. 2015, 78, 170–176. [Google Scholar] [CrossRef]
  22. Baltacıoğlu, C. Effect of Different Frying Methods on the Total Trans Fatty Acid Content and Oxidative Stability of Oils. J. Am. Oil Chem. Soc. 2017, 94, 923–934. [Google Scholar] [CrossRef]
  23. Field, C.J.; Blewett, H.H.; Proctor, S.; Vine, D. Human Health Benefits of Vaccenic Acid. Appl. Physiol. Nutr. Metab. 2009, 34, 979–991. [Google Scholar] [CrossRef] [PubMed]
  24. Bassett, C.M.; Edel, A.L.; Patenaude, A.F.; McCullough, R.S.; Blackwood, D.P.; Chouinard, P.Y.; Paquin, P.; Lamarche, B.; Pierce, G.N. Dietary Vaccenic Acid Has Antiatherogenic Effects in LDLr-/- Mice. J. Nutr. 2010, 140, 18–24. [Google Scholar] [CrossRef] [PubMed]
  25. Chen, M.; Zhang, Y.; Wang, F.; Zheng, N.; Wang, J. Simultaneous Determination of C18 Fatty Acids in Milk by GC-MS. Separations 2021, 8, 118. [Google Scholar] [CrossRef]
  26. Teng, F.; Wang, P.; Yang, L.; Ma, Y.; Day, L. Quantification of Fatty Acids in Human, Cow, Buffalo, Goat, Yak, and Camel Milk Using an Improved One-Step GC-FID Method. Food Anal. Methods 2017, 10, 2881–2891. [Google Scholar] [CrossRef]
  27. Mavlanov, U.; Czaja, T.P.; Nuriddinov, S.; Dalimova, D.; Dragsted, L.O.; Engelsen, S.B.; Khakimov, B. The Effects of Industrial Processing and Home Cooking Practices on Trans-Fatty Acid Profiles of Vegetable Oils. Food Chem. 2025, 469, 142571. [Google Scholar] [CrossRef]
Figure 1. (a) Total ion chromatograms (TIC) of the FAME from mixed standards solution; (b) Selected ion chromatograms (SIC) of C18:2 c9c12 (m/z = 67) and C19:1 t10 (m/z = 278); (c) Selected ion chromatograms (SIC) of C18:3 t9t12c15 (m/z = 67, 79) and C18:3 t9c12t15 (m/z = 67, 79); (d) Selected ion chromatograms (SIC) of C18:3 c9c12c15 (m/z = 79) and C20:1 t11 (m/z = 250). The serial numbers of trans fatty acids in Table 1 are labeled on the chromatograms.
Separations 12 00171 g001
Figure 2. Heatmap of the trans fatty acids (TFA) in common edible oil samples. c = cis; t = trans; TMUFA = monounsaturated TFA.
Separations 12 00171 g002
Table 1. Selected ion monitoring parameters of the proposed GC-MS method.
No.Trans Fatty Acid
(TFA)
Windows
(No.)
Retention Time
(min)
Quantitative Ion
(m/z)
Qualitative Ion
(m/z)
Dwell Time
(ms)
LOQ
(ppb)
Linearity Range
(ppb)
Standard Curve
Regression Equation
(ppb)
R2FAME-FA
Conversion Coefficient
ISC10:1 c4125.8741101529612/////
1C14:1 t942.9166877420812105–250Y = 2.1238x − 22.66760.99980.9417
2C15:1 t10248.4746918022212105–250Y = 11.5450x − 131.1480.99960.9449
3C16:1 t9354.43194697423612105–250Y = 6.5063x − 250.98350.99970.9477
4C17:1 t10462.92087469250122010–500Y = 1.5149x − 76.85260.99910.9503
5C18:1 t6572.77469222264122010–500Y = 9.0349x − 405.80.99930.9527
6C18:1 t973.0746922226412105–250Y = 38.7466x − 763.83560.9998
7C18:1 t1173.77469222264123015–3000Y = 3.5880x − 174.26970.9991
8C18:2 t9t12682.429467812631010125–5000Y = 11.9951x − 6754.52480.99940.9524
9C18:2 c9t1285.32946781263101050–2000Y = 10.3814x − 3425.05480.9991
10C18:2 t9c1286.92946781263101050–2000Y = 9.6048x + 3268.99160.9990
11C19:1 t787.12787423619410105–250Y = 0.7035x + 0.48950.99910.9548
12C19:1 t1088.027869236194102010–500Y = 0.9160x − 65.86060.9994
13C18:3 t9t12t15797.7796712129286075–1500Y = 12.0283x − 8181.08630.99950.9520
14C18:3 t9t12c15101.2796712129286075–1500Y = 10.2026x − 649.07860.9990
15C18:3 t9c12t15
16C18:3 c9c12t15102.6796712129282017.5–3500Y = 10.2953x − 1140.86690.9994
17C18:3 c9t12t15103.2796712129284037.5–750Y = 7.3719x − 1904.69520.9993
18C18:3 c9t12c15106.0796712129282017.5–350Y = 8.0243x − 1368.43180.9991
19C18:3 t9c12c15106.8796712129282017.5–3500Y = 10.2532x − 1452.92650.9994
20C20:1 t11107.22506920829282020–1000Y = 0.3553x − 1.57520.99940.9568
21C18:2 c9t118113.0294678114982010–2000Y = 0.6747x − 718.59140.99910.9524
22C18:2 t10c12115.8294678114982010–2000Y = 0.5267x − 467.06680.9995
23C22:1 t139134.474693202368105–250Y = 0.5267x − 467.06680.99950.9602
IS = internal standard; LOQ = limit of quantification; c = cis; t = trans.
Table 2. Recovery and variable coefficient (CV) of TFAMEs in soybean oil and pork lard (n = 3).
Trans Fatty Acid
(TFA)
Concentration MultipleSunflower OilPork Lard
25 mg/kg100 mg/kg200 mg/kg25 mg/kg100 mg/kg200 mg/kg
Recovery
(%)
CV
(%)
Recovery
(%)
CV
(%)
Recovery
(%)
CV
(%)
Recovery
(%)
CV
(%)
Recovery
(%)
CV
(%)
Recovery
(%)
CV
(%)
C14:1 t9182.55.187.84.589.26.483.47.784.23.589.74.9
C15:1 t10183.24.285.34.689.87.581.26.283.44.388.47.2
C16:1 t9186.58.586.46.588.74.6NA
C17:1 t10285.44.685.44.690.25.581.54.485.25.689.78.9
C18:1 t6289.78.983.64.491.44.1NA
C18:1 t91NANA
C18:1 t113NANA
C18:2 t9t125NANA
C18:2 c9t122NANA
C18:2 t9c122NANA
C19:1 t7188.73.889.76.990.28.679.33.581.27.289.93.6
C19:1 t10283.54.588.27.189.73.578.54.782.26.991.34.7
C18:3 t9t12t15484.37.388.65.491.57.481.25.183.64.691.37.3
C18:3 t9t12c154NANA
+C18:3 t9c12t15
C18:3 c9c12t151NANA
C18:3 c9t12t15279.65.483.53.591.26.283.67.488.12.390.26.7
C18:3 c9t12c15188.15.589.72.490.69.182.43.885.73.892.63.8
C18:3 t9c12c151NANA
C20:1 t11175.45.379.85.386.53.7NA
C18:2 c9t11481.56.685.54.385.45.9NA
C18:2 t10c12482.33.883.72.986.48.683.34.086.93.990.63.7
C22:1 t13179.64.281.33.785.14.9NA
NA = Not available.
Table 3. The content of TFAs in common edible oils (g/100 g, mean ± SD).
Trans Fatty Acid
(TFA)
Soybean Oil
n = 13
Peanut Oil
n = 22
Coil Oil
n = 15
Sunflower Oil
n = 14
Sesame Oil
n = 17
Pork Lard
n = 18
Beef Tallow
n = 11
Mutton Tallow
n = 12
Butter
n = 20
Cream
n = 17
Shortening
n = 11
C14:1 t9NDNDNDNDNDND0.009 ± 0.0020.009 ± 0.0040.017 ± 0.0080.006 ± 0.003ND
C15:1 t10NDNDNDNDNDND0.008 ± 0.0030.008 ± 0.0030.003 ± 0.003NDND
C16:1 t9NDNDNDNDND0.014 ± 0.0030.122 ± 0.0510.067 ± 0.0350.105 ± 0.0850.046 ± 0.0540.034 ± 0.011
C17:1 t10NDNDNDNDNDNDNDNDNDNDND
C18:1 t6NDNDNDNDND0.034 ± 0.0140.074 ± 0.0810.090 ± 0.0630.107 ± 0.1050.058 ± 0.045ND
C18:1 t90.027 ± 0.0160.056 ± 0.0260.033 ± 0.0140.033 ± 0.0220.143 ± 0.0430.063 ± 0.0240.303 ± 0.1360.235 ± 0.1260.131 ± 0.1430.037 ± 0.0220.056 ± 0.019
C18:1 t110.022 ± 0.0130.022 ± 0.0190.012 ± 0.0040.016 ± 0.0080.041 ± 0.0250.019 ± 0.0212.538 ± 1.0501.840 ± 0.7081.120 ± 0.6200.059 ± 0.0390.055 ± 0.045
C18:2 t9t120.078 ± 0.0090.077 ± 0.0070.086 ± 0.0100.069 ± 0.0090.097 ± 0.0310.070 ± 0.0040.158 ± 0.0830.112 ± 0.0150.125 ± 0.0320.085 ± 0.0450.068 ± 0.002
C18:2 c9t120.474 ± 0.2520.329 ± 0.1310.670 ± 0.5390.171 ± 0.1050.509 ± 0.1200.129 ± 0.0840.285 ± 0.1060.199 ± 0.0610.222 ± 0.0950.060 ± 0.0450.380 ± 0.063
C18:2 t9c120.258 ± 0.0890.246 ± 0.1020.482 ± 0.4210.135 ± 0.0930.373 ± 0.0860.082 ± 0.0190.092 ± 0.0150.151 ± 0.0550.206 ± 0.1550.110 ± 0.0850.357 ± 0.107
C19:1 t7NDNDNDNDNDNDNDNDNDNDND
C19:1 t10NDNDNDNDNDNDNDNDNDNDND
C18:3 t9t12t150.083 ± 0.008NDNDNDNDNDNDNDNDNDND
C18:3 t9t12c15
+ C18:3 t9c12t15
0.115 ± 0.0120.180 ± 0.0250.125 ± 0.0190.081 ± 0.0450.125 ± 0.0140.116 ± 0.0270.108 ± 0.0190.097 ± 0.0070.106 ± 0.0110.022 ± 0.0420.110 ± 0.009
C18:3 c9c12t150.613 ± 0.1910.057 ± 0.0960.171 ± 0.2440.019 ± 0.0240.035 ± 0.0280.029 ± 0.0150.096 ± 0.0740.029 ± 0.0180.054 ± 0.0280.016 ± 0.0100.055 ± 0.025
C18:3 c9t12t15NDNDNDNDNDNDND0.025 ± 0.037NDNDND
C18:3 c9t12c150.094 ± 0.0310.025 ± 0.0090.045 ± 0.020NDNDND0.018 ± 0.0160.003 ± 0.005NDNDND
C18:3 t9c12c150.466 ± 0.1620.024 ± 0.0110.123 ± 0.2110.003 ± 0.0070.063 ± 0.1520.013 ± 0.0380.068 ± 0.0580.006 ± 0.0110.031 ± 0.0260.005 ± 0.0100.053 ± 0.016
C20:1 t11NDNDNDNDND0.024 ± 0.0230.049 ± 0.056ND0.020 ± 0.0300.007 ± 0.021ND
C18:2 c9t11NDNDNDNDND0.234 ± 0.1240.690 ± 0.2780.668 ± 0.3220.767 ± 0.6130.382 ± 0.276ND
C18:2 t10c12NDNDNDNDNDND0.164 ± 0.023ND0.016 ± 0.0500.024 ± 0.069ND
C22:1 t13NDNDNDNDND0.017 ± 0.0120.002 ± 0.0020.001 ± 0.0020.002 ± 0.0030.001 ± 0.0020.001 ± 0.001
∑TMUFA0.048 ± 0.0290.079 ± 0.0340.045 ± 0.0180.049 ± 0.0290.185 ± 0.0560.172 ± 0.0363.106 ± 1.1552.250 ± 0.7471.506 ± 0.7460.214 ± 0.1230.147 ± 0.043
∑ C18:2 TFA0.811 ± 0.3270.651 ± 0.2311.238 ± 0.9540.376 ± 0.1030.979 ± 0.1910.515 ± 0.1601.388 ± 0.3491.130 ± 0.3631.337 ± 0.6510.660 ± 0.4170.804 ± 0.154
∑ C18:3 TFA1.371 ± 0.3340.286 ± 0.1070.464 ± 0.4840.103 ± 0.0330.222 ± 0.1460.162 ± 0.0540.290 ± 0.1460.160 ± 0.0540.191 ± 0.0550.044 ± 0.0520.218 ± 0.039
∑ TFA2.216 ± 0.5951.016 ± 0.3191.748 ± 1.1690.528 ± 0.1031.386 ± 0.2570.849 ± 0.1954.784 ± 1.2823.540 ± 0.8633.034 ± 1.2160.917 ± 0.5371.169 ± 0.208
ND = Not Detected.
Disclaimer/Publisher’s Note: The statements, opinions and data contained in all publications are solely those of the individual author(s) and contributor(s) and not of MDPI and/or the editor(s). MDPI and/or the editor(s) disclaim responsibility for any injury to people or property resulting from any ideas, methods, instructions or products referred to in the content.

