Article

Extraction of Terpenoids from Pine Needle Biomass Using Dimethyl Ether

Idaho National Laboratory, Idaho Falls, ID 83415, USA
*
Authors to whom correspondence should be addressed.
Separations 2025, 12(7), 169; https://doi.org/10.3390/separations12070169
Submission received: 8 May 2025 / Revised: 18 June 2025 / Accepted: 23 June 2025 / Published: 26 June 2025

Abstract

Pine needles are an industrial feedstock for extracts used in a variety of applications, but conventional extraction methods often result in a degradation of the terpenoid compounds that naturally occur in loblolly pine (Pinus taeda). Separation of these compounds from pine biomass is an energy-intensive operation, typically requiring a significant input of thermal energy. An alternative separation approach with potential energy savings is extraction with a condensable gas, namely, dimethyl ether. Biomass materials are exposed to liquid dimethyl ether under pressure, which mobilizes the organics. The extract is then separated from the insoluble pine matter, and dimethyl ether is volatilized away from the separated organic species. A variety of terpene derivatives were extracted from pine needle biomass using this approach, including monoterpenes, sesquiterpenes, and related oxygenates, which were identified using two-dimensional gas chromatography/mass spectrometry. Additionally, the dimethyl ether-treated needles resemble needles subjected to low-temperature drying, whereas needles treated with a high-temperature drying method appear to have shrunken structures. The results suggest that dimethyl ether extraction has significant potential for separating valuable organics from complex matrices without the application of thermal energy during treatment.

1. Introduction

Pines (Pinus) are a dominant genus found in North American, European, and Asian forests [1]. Historically, pine has been harvested by humankind for use as a building material [1], chemical production (e.g., potash) [2], fuel [1], food [3], and traditional medicine [4]. While pine still serves dominantly in construction materials and as a raw material for pulp and paper industries [5], residues from these industries are considered a low-cost feedstock for biofuel production. Thermochemical conversion pathways for pine are often considered, where fast pyrolysis or catalytic fast pyrolysis can provide high bio-oil yields, which can then be hydrotreated to create fuels in the jet, diesel, and gasoline ranges [6]. However, studies have shown that pine white wood anatomical fractions result in higher pyrolysis performance than their bark and needle fractions, primarily due to higher extractives and inorganic elements [7]. In particular, needles can contain high levels of extractives that are now used in a variety of applications [8]. Pine extracts originate from conifer oleoresin, which serves a biological role in tree defense, forming a chemical barrier against pest insects and fungal spores [9,10,11].
The extracts of pine needles are of particular ongoing research interest on account of their broad utility as specialty chemicals [12], pharmaceuticals [13,14,15], perfumes [12], structural [16,17] antimicrobial [18] biocomposites, bio-oils for combustible fuel [19,20], and food additives [21]. Pine needles are also frequently studied as an indicator of contamination in the atmosphere [22] and the local environment [23]. Relevant in many of these applications, biocompounds found within pine needles are responsible for the resistance of individual pine species to invasive pine beetle species [10,11,24,25]. As such, the separation and identification of pine resin terpenes associated with anti-beetle defensive capabilities has been a research priority.
Extraction of pine-derived biocompounds with organic solvents has been widely applied, primarily for the identification of individual terpenes. Pentane and hexane have been utilized by multiple groups [26,27,28,29], and solvent systems using mixtures of alkane solvents and acetone [30] and diethyl ether [8] have also been applied. These approaches resulted in the separation of terpenes, notably α-pinene, δ-carene, and β-pinene, which, in general, are the most abundant monoterpenes [8]. Solvent extraction is not specific and also results in the separation of fatty acids and esters with comparatively smaller quantities of mono-, sesqui-, and di-terpenoids. Serial extraction of pine needles using hexane, methanol, and, finally, water enables the collection of a wider range of compounds [29].
Hydrodistillation has been employed by several groups for separating organic compounds from pine needles and other fractions. Pine biomass is mixed with water, and the resulting mixture is distilled, resulting in the partitioning of extractable organic compounds within the distillate. Hydrodistillation has been shown to be effective in separating many terpenoid derivatives [24,31,32,33,34,35,36,37,38,39,40]. A simultaneous extraction and distillation process has also been effectively employed to separate terpenes from pine needles using dichloromethane as an extraction solvent [41,42].
Monoterpenes are emitted from pine as volatilized organic compounds and can be collected using adsorption cartridges, enabling the analysis of monoterpenes [43]. Solid-phase microextraction (SPME) effectively samples the headspace over pine samples for the identification of separate mono-terpenoid, sesqui-terpenoid, and aldehyde fractions [25,44,45]. SPME has also been used to separate terpenoids generated from the torrefaction of pine biomass [46], thus separating the mono-terpenes, sesqui-terpenes, acetic acid, and additional products more commonly associated with pyrolysis treatments [19]. Solvent-free microwave extraction is yet another separation method that has shown efficacy in terpenoid recovery from pine biomass [47].
Supercritical carbon dioxide extraction has been employed for the separation of terpenoids [30] and was shown to be effective as a pretreatment for pine biomass pyrolysis [37]. The experiments showed that more terpenes could be extracted from needles compared with bark, cones, and branches [37]. Supercritical fluid extractions require elevated temperatures and pressures (CO2 becomes supercritical at 72 atm at 30 °C), adding to the energy and equipment costs of a process.
Condensable gases are another class of solvents that have been utilized to recover pine extracts. Bier and coworkers utilized condensable gas extraction with a liquefied butane/propane mixture at ~5 atm and 35 °C to extract terpenes from pine needles, concluding that the approach was more efficient compared with conventional solvent extraction [48]. In this work, pine needles are processed by condensable gas extraction with dimethyl ether (DME) [49,50,51,52,53,54,55,56,57,58,59,60,61,62,63,64,65,66,67,68,69,70,71]. In many ways, DME extraction is like a butane/propane extraction but isolates a different, generally larger fraction of biocompounds than iso-butane, n-butane, or propane extractions. The larger extracted fraction is due to the greater polarity of DME relative to butane/propane, allowing for more polar molecules to be mobilized. DME may also mobilize less polar molecules more effectively by displacing both water and mobile organics; removing water from a porous solid may improve the mobility of less polar organics. This work presents an emerging methodology for the extraction of a more diverse variety of compounds from pine materials than has been previously studied with other solvents. The final extract from DME extraction generally undergoes phase separation into distinct aqueous and organic phases once the DME is removed. These characteristics allow DME to be applied to other aqueous separations [72,73,74,75,76,77,78,79].
In this work, pine needles (leaves) from the loblolly pine (Pinus taeda) were selected as a feedstock for the extraction of terpenoid species with DME. Loblolly pine was selected, as it is a dominant North American pine species; needles were extracted because they feature higher concentrations of terpenoids than woody material [80]. While characterization of terpenes has been performed on the needles of various pine species [80,81,82,83], the exact mixture of terpenoid compounds varies with species, tree habitat, needle age, and season [83].
The extracts were subsequently analyzed using two-dimensional gas chromatography/mass spectrometry (2D-GC/MS), confocal microscopy, scanning electron microscopy (SEM), and energy dispersive X-ray spectroscopy (EDS). The use of two-dimensional GC is advantageous [31]. Given the complexity of the mixtures generated by separation processes, this approach can enable chromatographic separation of closely eluting compounds, which, in turn, can generate unambiguous mass spectra for library matching. Even when using 2D-GC/MS, compound identification using retention index matching is still needed, as noted in multiple earlier studies [31,38,39,45,84].

2. Materials and Methods

2.1. Sample Preparation

A sample (10.2 g) of fresh pine needles, Pinus taeda, was enclosed in a pressure-rated glass extraction cylinder sealed at both ends with Teflon endcaps. DME (Matheson Gas, Irving, TX, USA, 99.5%) was introduced to and evacuated from the reaction chamber via Swagelok fittings and ball valves. The pine needle material had not been size-reduced or dried prior to extraction. Pine needles were received fresh and stored within a vacuum-sealed plastic bag and refrigerated prior to extraction. Furthermore, 3 × ~1 L DME volumes were used to immerse the sample at ambient temperatures (~20 °C) and elevated pressure (DME vapor pressure is ~5 atmospheres at ~20 °C). The solvent was recirculated via a pump for 1 h with each volume of DME. All three volumes were collected in the same collection vessel. When the DME was removed via depressurization, two products were produced as follows: (1) ~2 g of a cloudy aqueous solution and (2) a semisolid resin adhered to the glass vessel. While DME was not captured and recompressed (recycled) in this work, recent publications present methodologies and analyses of DME recycling for industrial separation [78,79,85,86]. A diagram of the extraction apparatus and a more detailed hardware description is presented in Supplementary Materials Figure S1.
The aqueous sample was diluted using methanol (Sigma-Aldrich, St. Louis, MO, USA, anhydrous, 99.8%) prior to analysis using a 2D-GC/MS instrument. The resin was partially dissolved into tetrahydrofuran (THF, Sigma-Aldrich, anhydrous, 99.9%), producing amorphous green semisolids and a solution that was analyzed without further dilution. The THF sample was spiked with a small volume of a solution (AccuStandard, New Haven, CT, USA) containing biphenyl, phenanthrene, and fluoranthene, such that their concentrations were 1 millimole/liter. These compounds served as internal standards and may be used to measure unknown concentrations of terpenes from the calibration curves. The amorphous green semisolids that did not dissolve in THF were analyzed using a micropyrolysis unit interfaced with the 2D-GC/MS.

2.2. Micropyrolysis

The residual green semisolid was analyzed using a micropyrolyzer (CDS Analytical 5250 pyrolyzer, Oxford, PA, USA), which is equipped with a 36-sample carousel that enables analyses of batches of sample tubes. The samples were dropped into the pyrolysis chamber, dried for 4 s at 100 °C, and then held for an additional second at 100 °C. The temperature was then ramped at 50 °C/s to the maximum pyrolysis temperature (Tmax) and then held at Tmax for 5.00 s. The sample tube was then ejected, and the chamber was cleaned by heating to 1200 °C and holding at this temperature for 10 s. The pyrolysis vapor that was produced was transferred to the 2D-GC/MS via a transfer line maintained at 280 °C.
Samples of the green semisolid were prepared for pyrolysis by loading a pyrolysis tube with a short spacer and a glass wool plug. Approximately 300 µg was then weighed into the pyrolysis tube, to which another glass wool plug was added. Prior to analysis, one µL of solution containing the three internal standard compounds at a concentration of 1 millimole/L was injected into the biomass. The quantity of each internal standard added to the pyrolysis tubes was 1 nanomole.
Data processing involved the subtraction of instrument blanks from the analyses of the pasty solids; this corrected for the presence of paraffinic aldehydes in the instrument from prior analyses.

2.3. 2D-GC Separation

Two-dimensional gas chromatography (2D-GC) was conducted using an Agilent (Santa Clara, CA, USA) 7890 gas chromatograph modified for 2D-GC by a four-jet modulator and a secondary oven, both located within the primary oven. The first chromatographic dimension used a 28 m 0.25 mm inner diameter column with a 0.5 µm Rxi-5ms (Restec, Bellafonte, PA, USA) stationary phase, which is 5% diphenyl/95% dimethyl polysiloxane. The second chromatographic dimension used a 1 m, 0.1 mm inner diameter column with a 0.1 µm Rxi-17 (Restec, Bellefonte, PA, USA) stationary phase, which is 50% diphenyl/50% dimethyl polysiloxane. An additional 21 cm of the Rxi-17 column served as the transfer capillary between the secondary oven and the mass spectrometer. The Rxi-5ms column primarily separates compounds based on the boiling point, while the Rxi-17 column separates on the basis of compound polarity.
The helium carrier gas flow was controlled at 1 mL/min throughout the analysis. The pyrolysis compounds were split within the injector using a split ratio of 20:1. The injector was maintained at 300 °C. Upon initiation of the analysis, the primary column was held at 50 °C for 0.5 min, then ramped at 7.5 °C/min to a target temperature of 260 °C, and finally held at this temperature for an additional 3 min. The transfer capillary was maintained at 280 °C.
The secondary oven and 4-jet modulator were maintained at 5 °C and 15 °C (respectively) above the temperature of the primary oven. A 3.00 s modulation period was used, and hot and cool pulse times were varied to efficiently trap and desorb light compounds early in the run, and heavier compounds later in the run. Before a retention time of 394 s, the hot pulse and cool times were 0.50 and 1.00 s, respectively. This was repeated twice per modulation cycle by the 4-jet modulator. After 394 s, the hot pulse and cool times were 1.00 and 0.50 s, respectively.
Liquid samples were injected using a Gerstel rail sampler. A volume of one µL was injected for analyses of all liquid samples and standards.

2.4. MS Detection

Mass spectrometry detection and analysis were conducted using a Leco Pegasus 4D instrument (St. Joseph, MI, USA), which integrates a time-of-flight mass spectrometer with the Agilent 7890 GC. An acquisition delay of 220 s was employed to allow very light compounds to pass through the MS before analysis was initiated. The instrument was scanned from m/z 43 to 300 at a rate of 200 spectra/s. The fast scan rate enables the deconvolution of closely eluting compounds. Electron ionization via the ion source was conducted at 250 °C with an energy of 70 electron volts (eV).

2.5. Compound Identification

Compounds were identified based on their mass spectra, utilizing library searches. The monoterpenes were identified by a small but notable m/z 136 (M+•). Significant fragment ions were at m/z 121 (loss of •CH3) and m/z 107 (loss of •C2H5). Frequently, the base peak was m/z 93, formed either by the loss of •C3H7 as an integral propyl radical or by serial losses of •CH3 and then •C2H4; this ion tends to be generally diagnostic for monoterpenes. The C7H8+• ion at m/z 92 was occasionally prominent.
The monoterpenes are all C10H16 isomers and tend to have mass spectra that are similar to one another, which means that their mass spectra are not explicitly diagnostic for compound identification. Frequently, library searches generate matches that have high similarity scores but low probabilities, reflecting a situation where the agreement between an unknown mass spectrum and that of the library match is high, but the library spectrum is not particularly unique, i.e., multiple other compounds have a similar spectrum. On account of this problem, compound identification should ideally involve retention time matching with known identified standards. An alternative approach is to compare the relative retention time order observed for the terpenoid chromatographic peaks with other studies reported in the literature. The latter approach was used in this study, consistent with the objective, which was to qualitatively evaluate the effectiveness of the DME extraction for achieving low-temperature terpenoid extraction.

2.6. Sample Preparation and SEM-EDS Imaging

Needles were either subjected to DME treatment, as described above, or thermal treatment at 105 °C and 40 °C. Treated pine needles were embedded and sectioned using an adapted protocol from Gierlinger et al. [87]. They were rehydrated by soaking in water and slowly infiltrated with polyethylene glycol (PEG) 2000 (Sigma-Aldrich). Rehydrated needles were submerged in 50% PEG 2000 solution in a closed container at 60 °C until they were permeated with the solution. Once the needles sank to the bottom of the container, the lid was removed to allow the water to evaporate from the solution. When the volume of the solution was reduced by half, the needles were submerged in 100% PEG overnight. The needles were removed from the PEG, placed on a microscope slide, and allowed to harden to the slide at room temperature overnight. The needles were sectioned with a scalpel and soaked in water to remove the PEG from the sections. The sections were dried onto a microscope slide at room temperature overnight. The sections were removed from the microscope slides with a scalpel, attached to carbon SEM mounts with double-sided copper tape, and sputter-coated with gold. Sections were imaged using a JEOL JSM-6610LV Scanning electron microscope (SEM, Tokyo, Japan) equipped with an energy-dispersive X-ray spectrometer (EDS).

3. Results

3.1. Structural Changes to Pine Needle Material

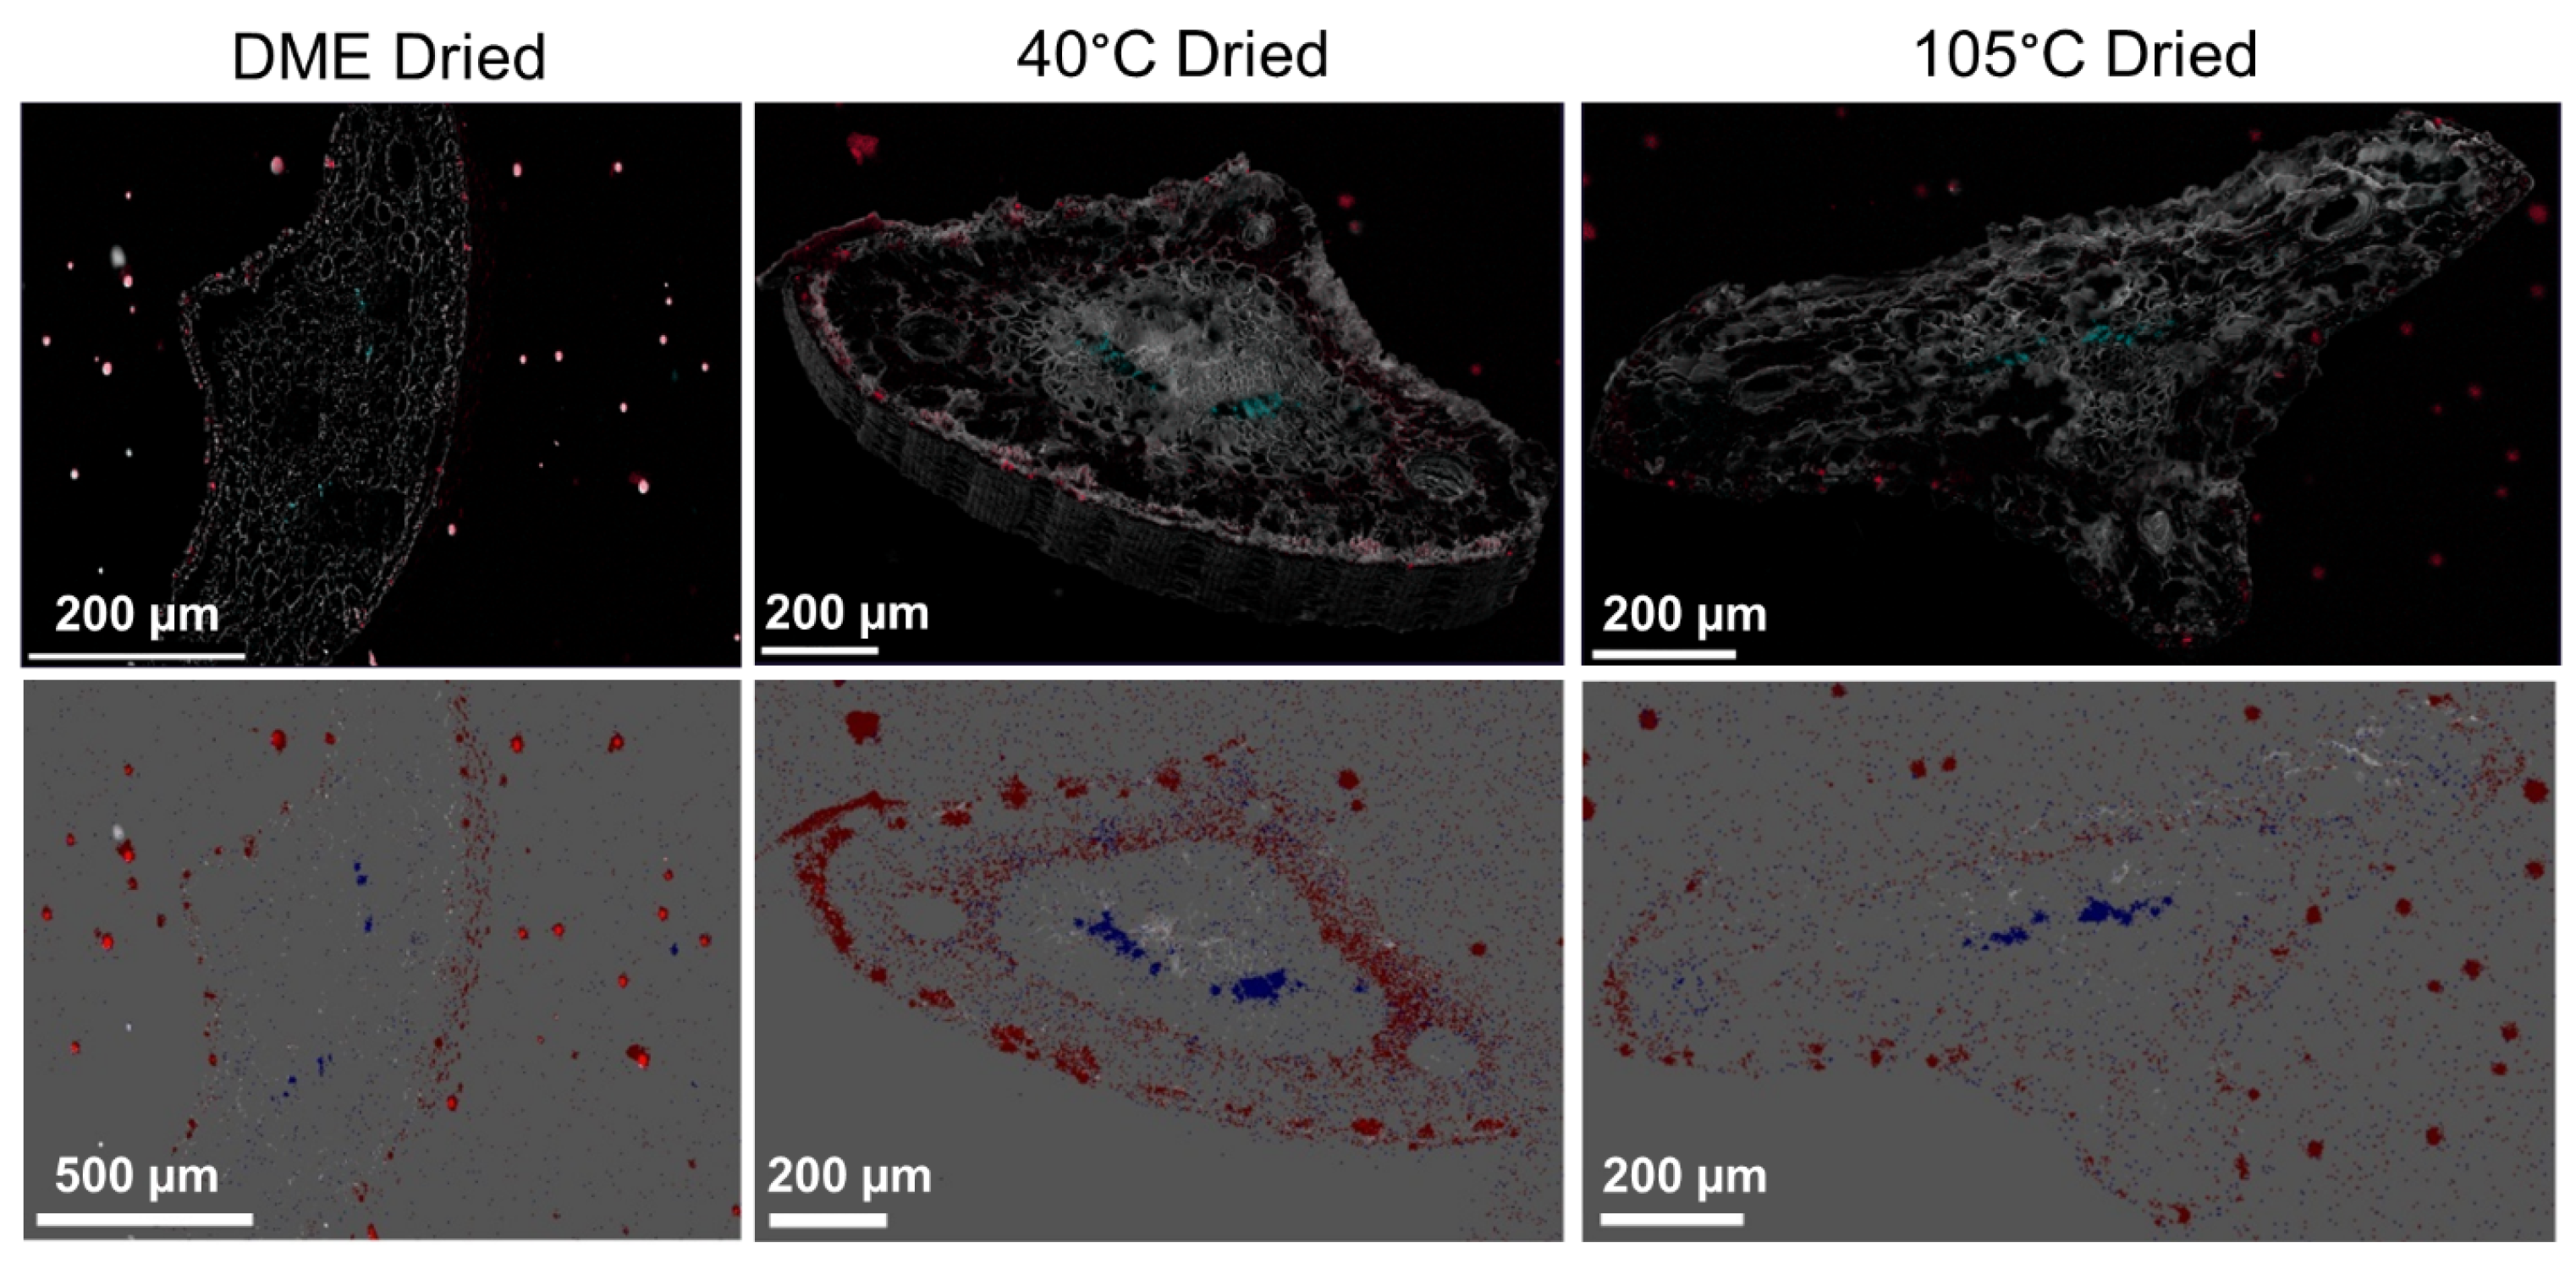
Ideally, terpenoid extraction would employ benign conditions, such as a low temperature and pressure, and minimal mechanical grinding. More aggressive extraction conditions would be expected to destroy the pore structure, making the mobilization of terpenoids more difficult. Higher temperatures would also be expected to cause chemical changes in the terpenoids, including isomerization, oxidation, and hydroxylation, modifying the nature of the essential oils that are extracted. For this reason, the microscopic anatomy of the pine needles treated using DME extraction was compared with the needles that were subjected to thermal treatment at 105 °C and 40 °C. Confocal imaging revealed gross anatomical changes in the needles dried at 105 °C, as evidenced by a shrunken appearance and possible pore collapse, as substantiated by SEM imaging in Figure 1. In comparison, the pore structure of the pine needles heated to only 40 °C and the samples subjected to DME extraction displayed intact pore structures. Additionally, the SEM image of the DME-dried sample displays a cuticle (outer layer) that is attached but separated from the needle. In contrast, the cortex layer appears to have delaminated from the 40 °C-dried needle. Further insight into the effect of the DME process is provided by the spatial distribution of silicon and calcium, as shown in the images generated using EDS. The samples treated at 40 °C show that silicon is enriched in the epidermis and mesophyll and that calcium is enriched in the phloem. Figure 2 depicts SEM-EDS mapping of DME-dried, 40 °C-dried, and 105 °C-dried pine needles. Silicon was enriched in the epidermis and mesophyll. Calcium was enriched in the phloem; red = Si and blue = Ca.
In comparison, the image of the DME-treated sample shows that both Si and Ca are depleted, indicating that the process removes the inorganic elements from the vascular structure of the pine needles. Si and Ca are elements that are converted to ash in combustion, and their removal results in a cleaner biomass product [88]. Ash byproducts of biomass are associated with fine particulate emissions, fouling, corrosion, and abrasion [88]. This may suggest that DME extraction could function as a pretreatment ahead of thermal processing by removing inorganics that may catalyze secondary degradation during pyrolysis.

3.2. Analysis of the THF-Soluble Terpenoids

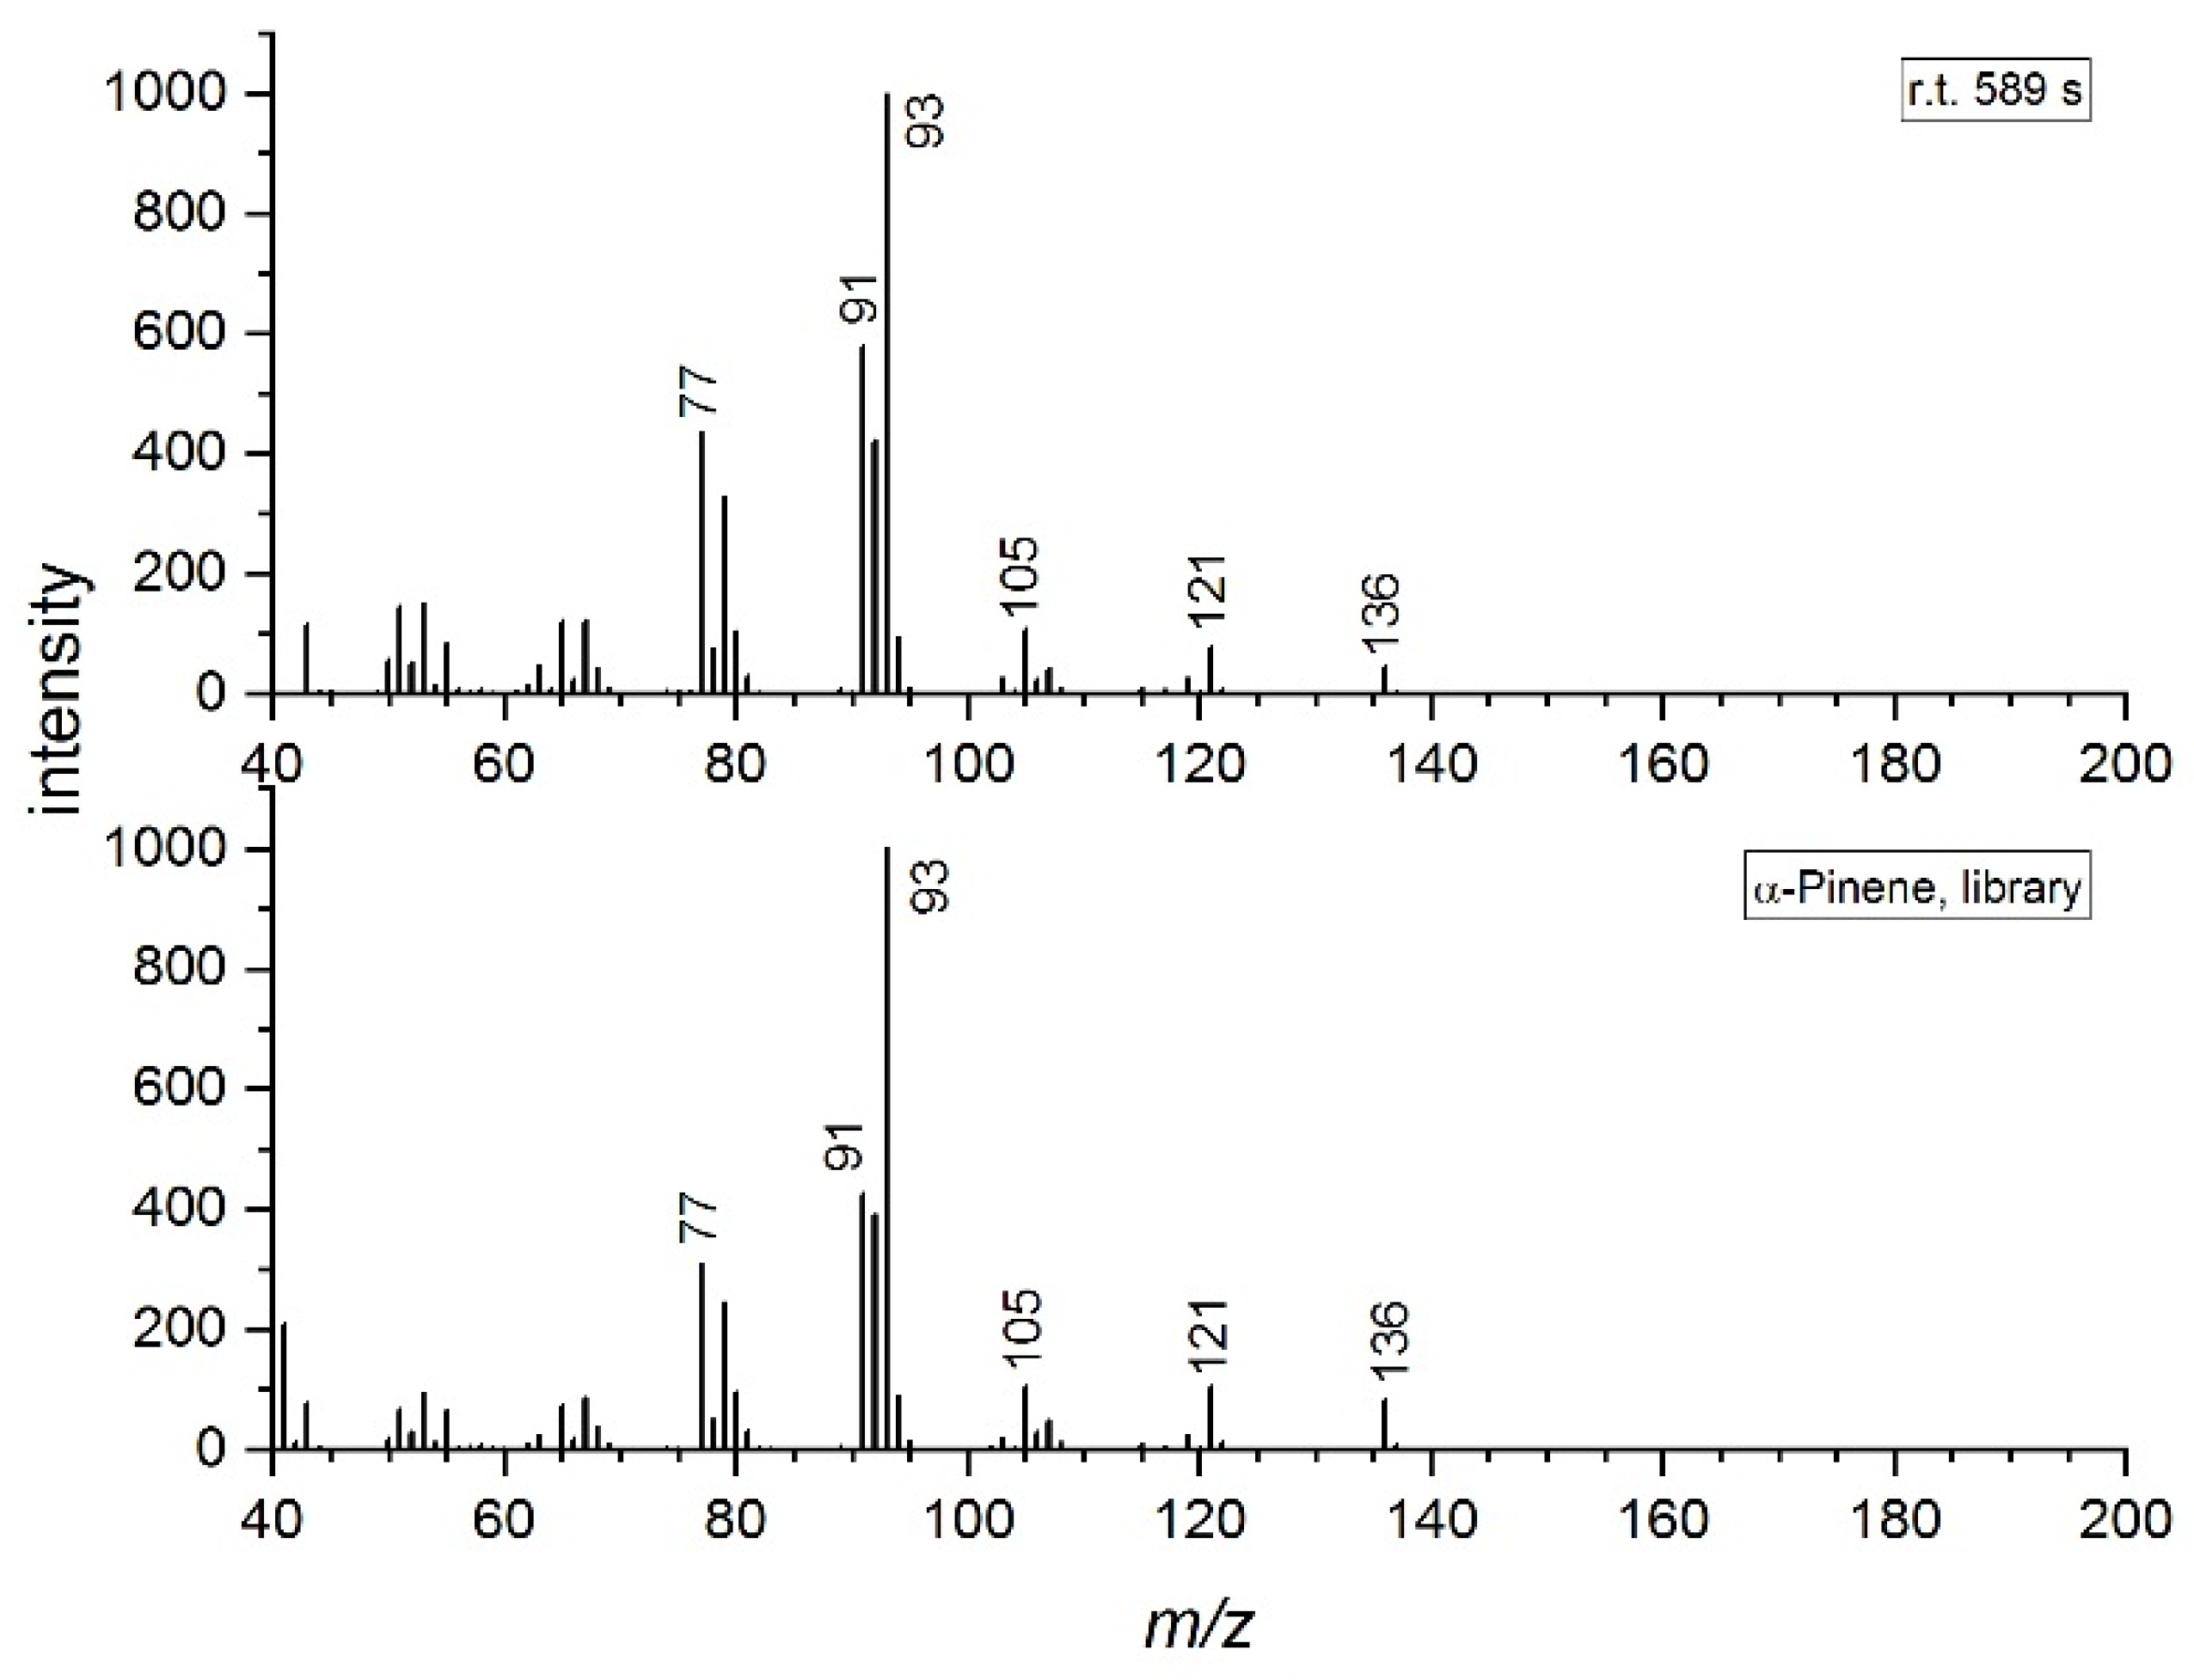
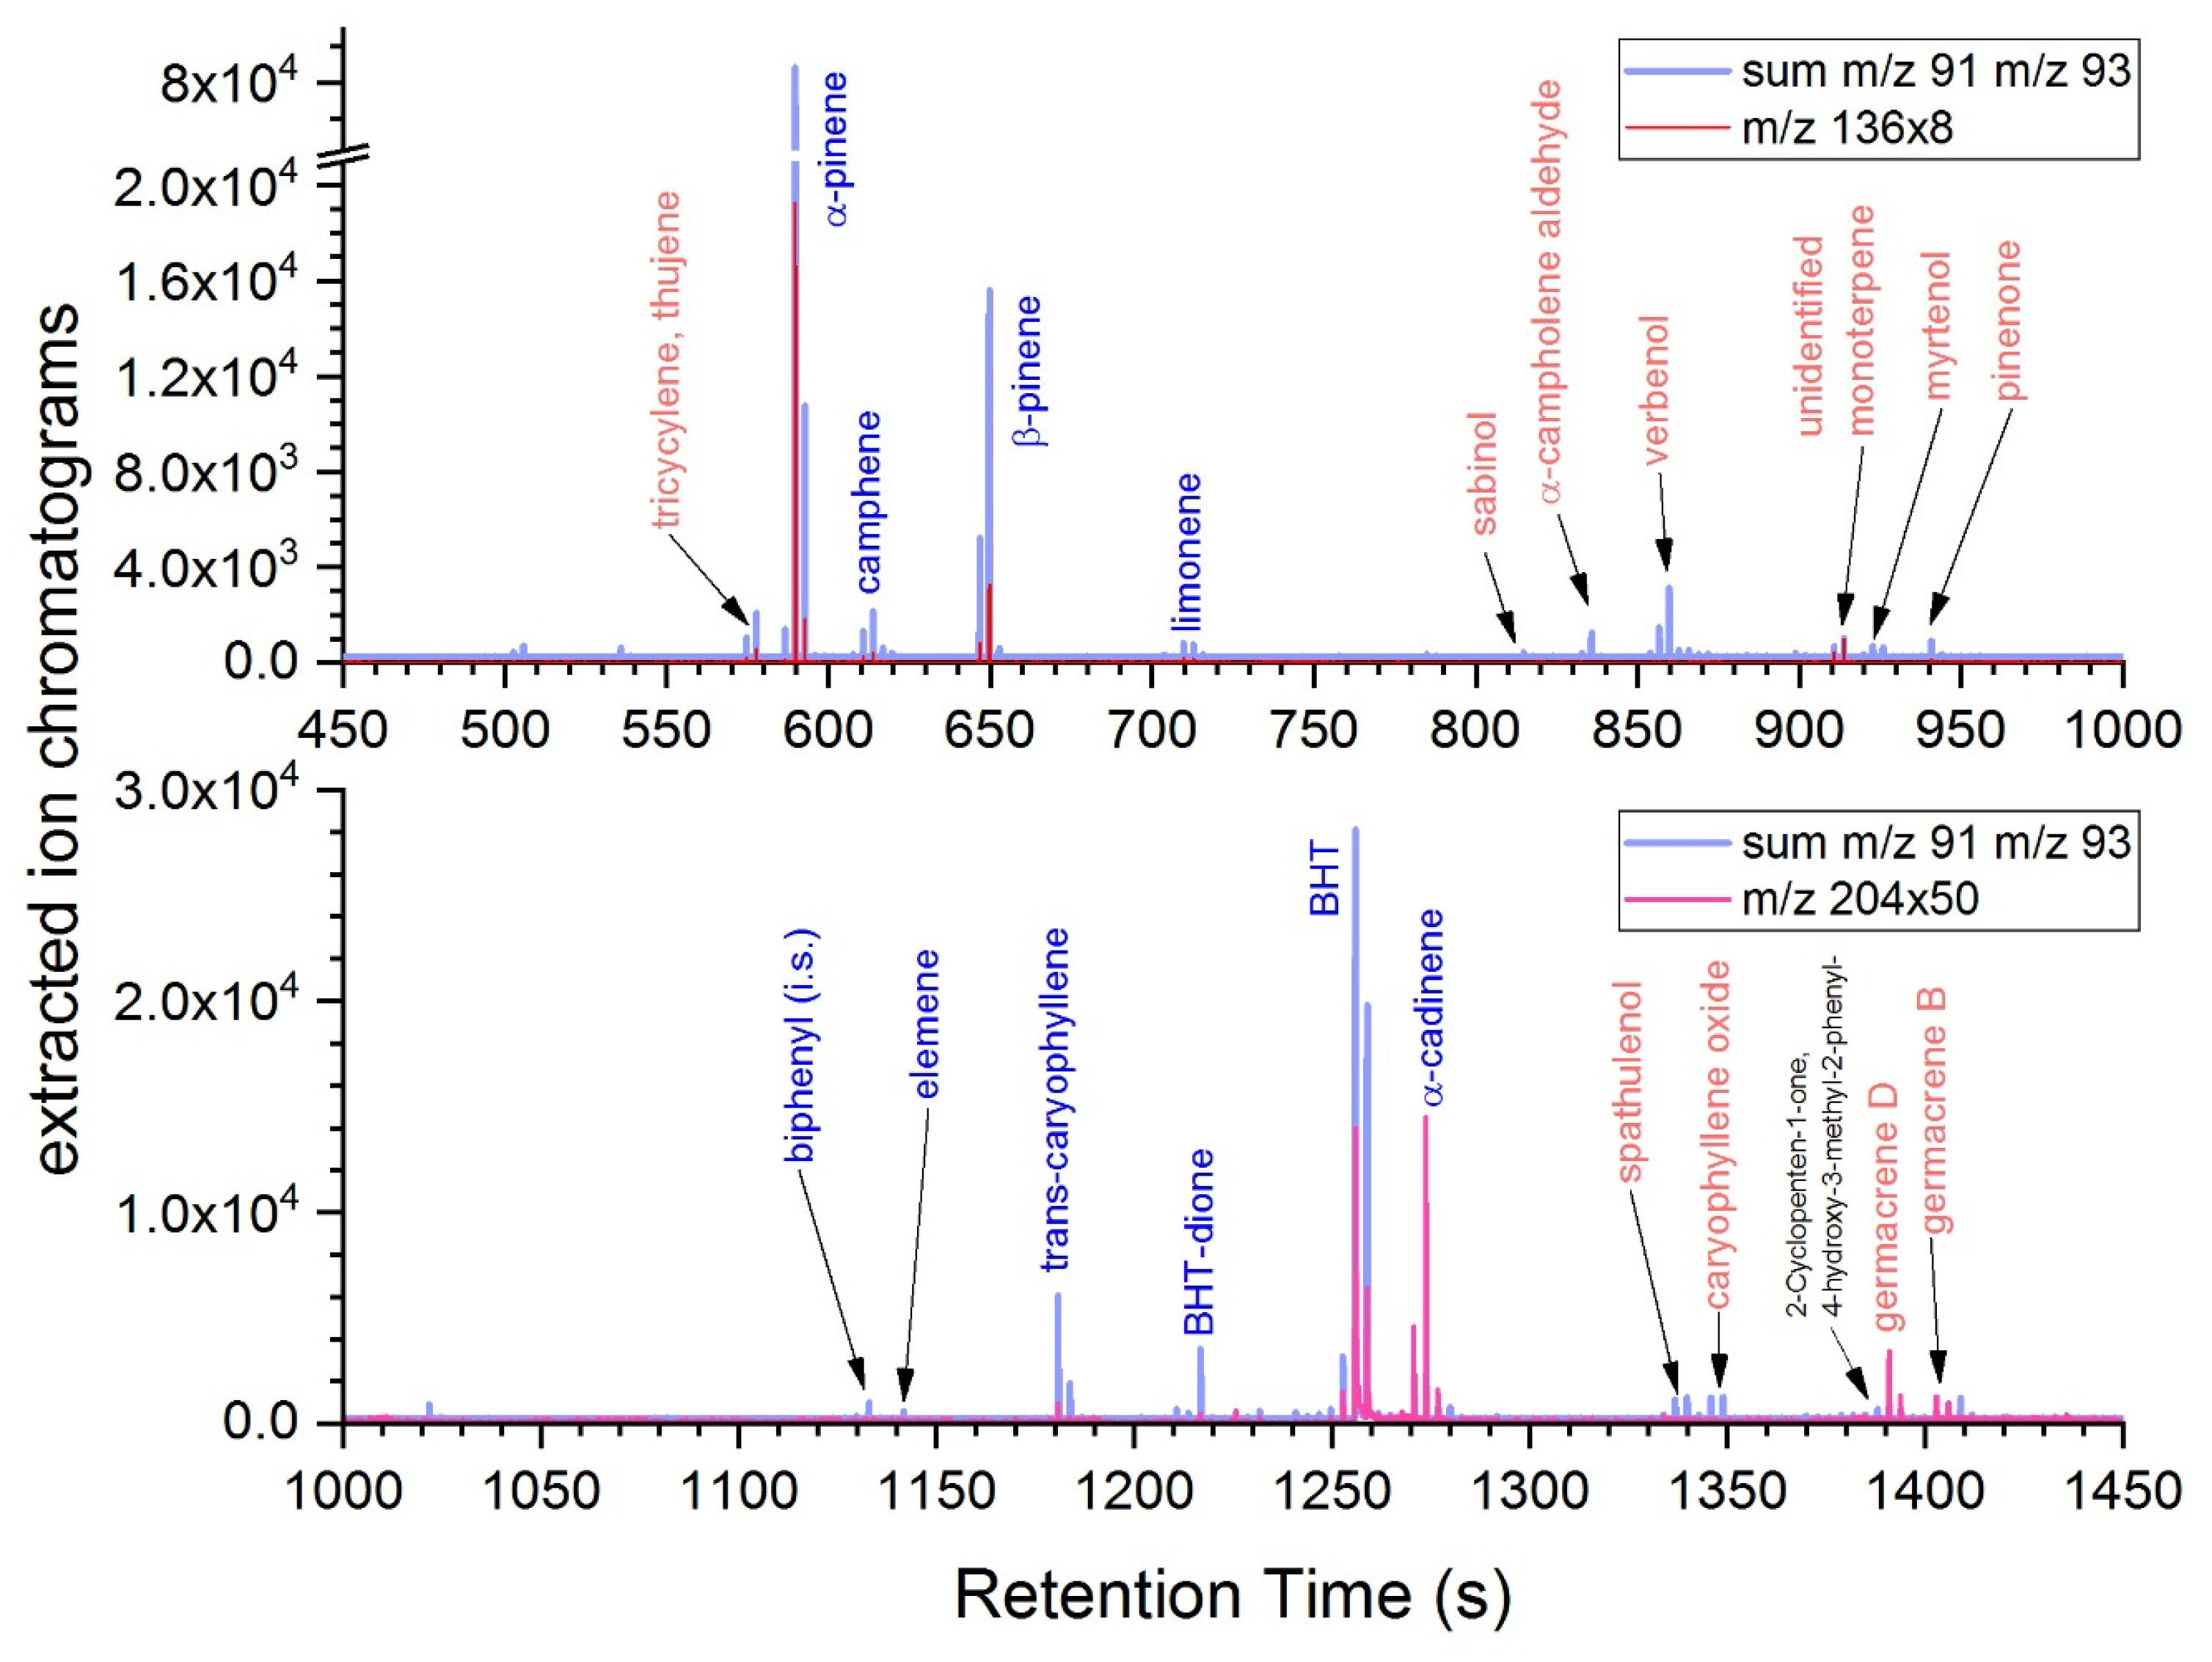
The product of the DME extraction was a dark green semisolid that dissolved into and colored the solution. The analyses of the THF showed an abundant peak corresponding to α-pinene, eluting at ~590 s, together with numerous low-abundance peaks that were also terpenoid in nature. The identification of α-pinene was based on retention time matching with a standard (see Supplementary Materials Appendix S2, Figure S2) and also agreement with the mass spectrum. In the analysis of the standard, concentrations of α-pinene and the internal standard were known, and this enabled the concentration of α-pinene in the sample to be calculated at 1.36 mM/L. The mass spectrum of α-pinene displays a low-abundance molecular ion at m/z 136, monoterpene elemental composition C10H16; Figure 3. The majority of the ion signal is accounted for by m/z 93, 92, 91, 79, and 77. The formation of the base peak at m/z 93 can be reasonably rationalized by a serial elimination of •CH3 and then C2H4; Reaction Scheme 1. The appearance of multiple, high-abundance fragment ions is indicative of the complexity of the fragmentation pathways operating in the α-pinene radical cation; however, this behavior is not unique to α-pinene, as the other monoterpenes display similar behavior and unsurprisingly produce very similar mass spectra.
The abundant m/z 93 and 91 that are seen in the mass spectra of the monoterpenes suggest that these ions could be used to identify other monoterpenes that are not abundant in the extract. An extracted ion chromatogram was generated by summing the signal from the m/z 93 and 91 mass channels, which tended to provide a reliable indication of the presence of both mono- and sesquiterpenes. These could be substantiated by the extracted ion chromatograms of m/z 136 and 204, which correspond to the molecular ions of the monoterpenes and sesquiterpenes, respectively. Figure 4 depicts the extracted ion chromatograms from the analysis of THF-soluble terpenoids.
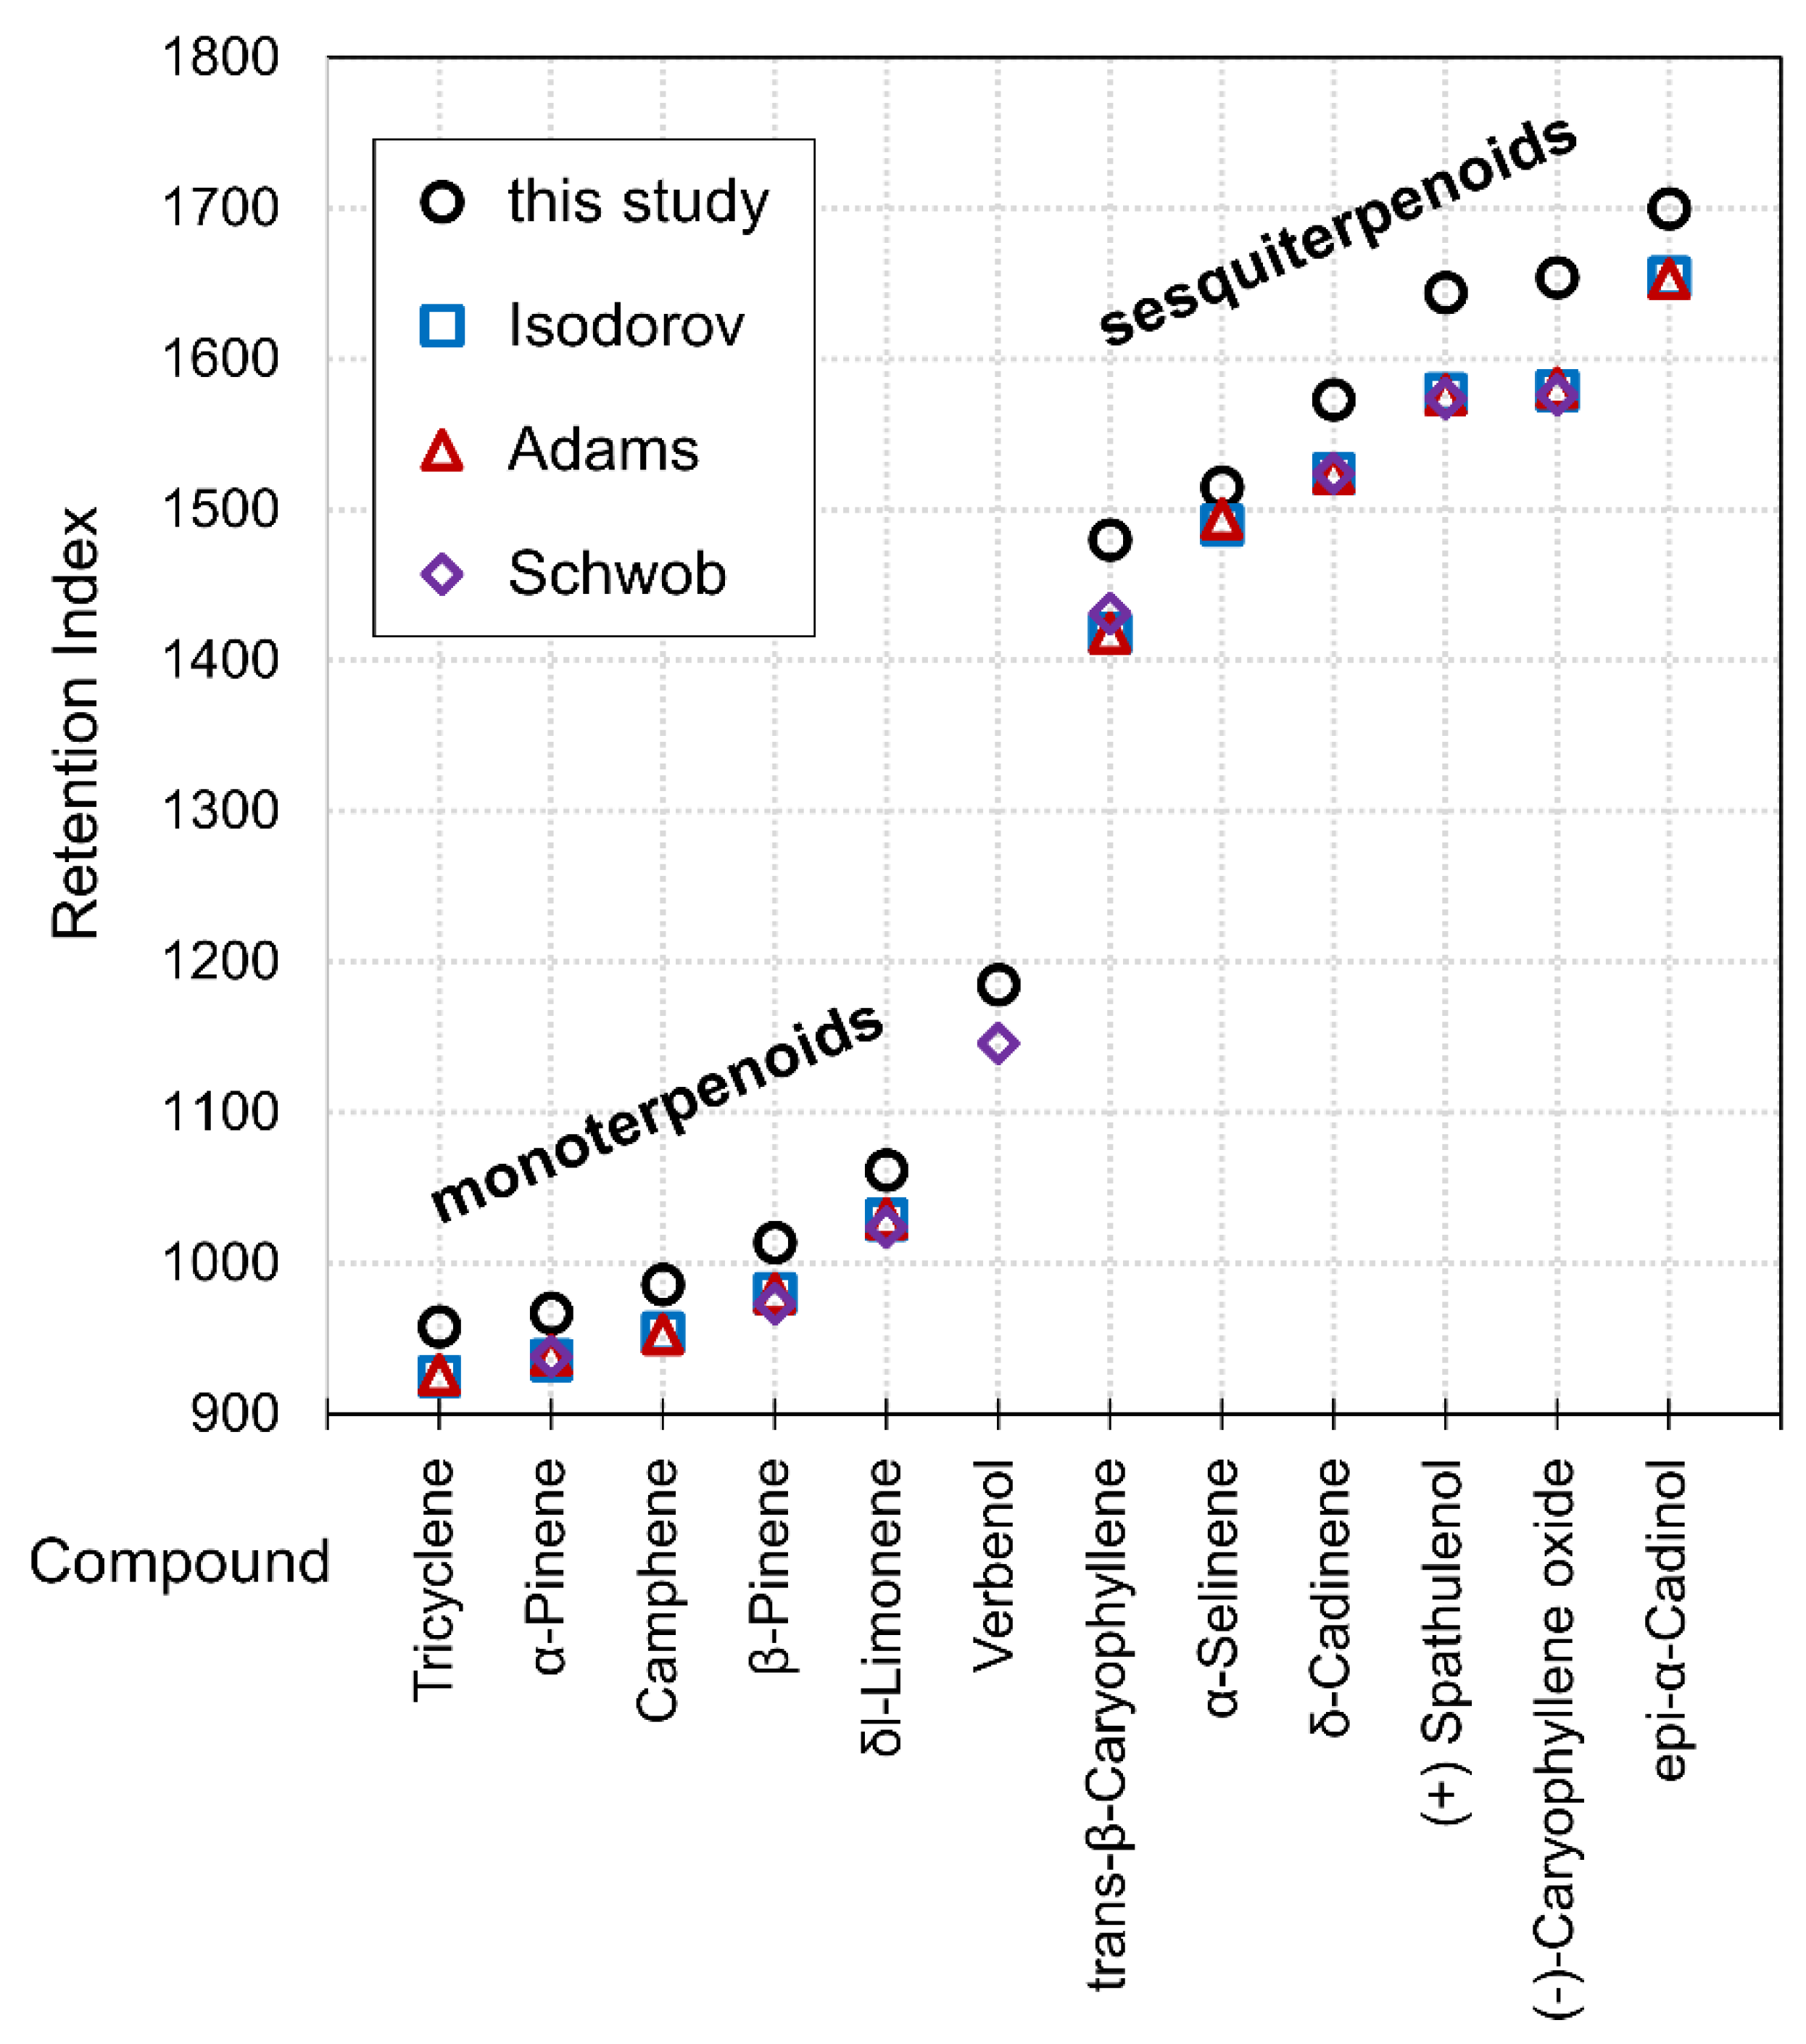
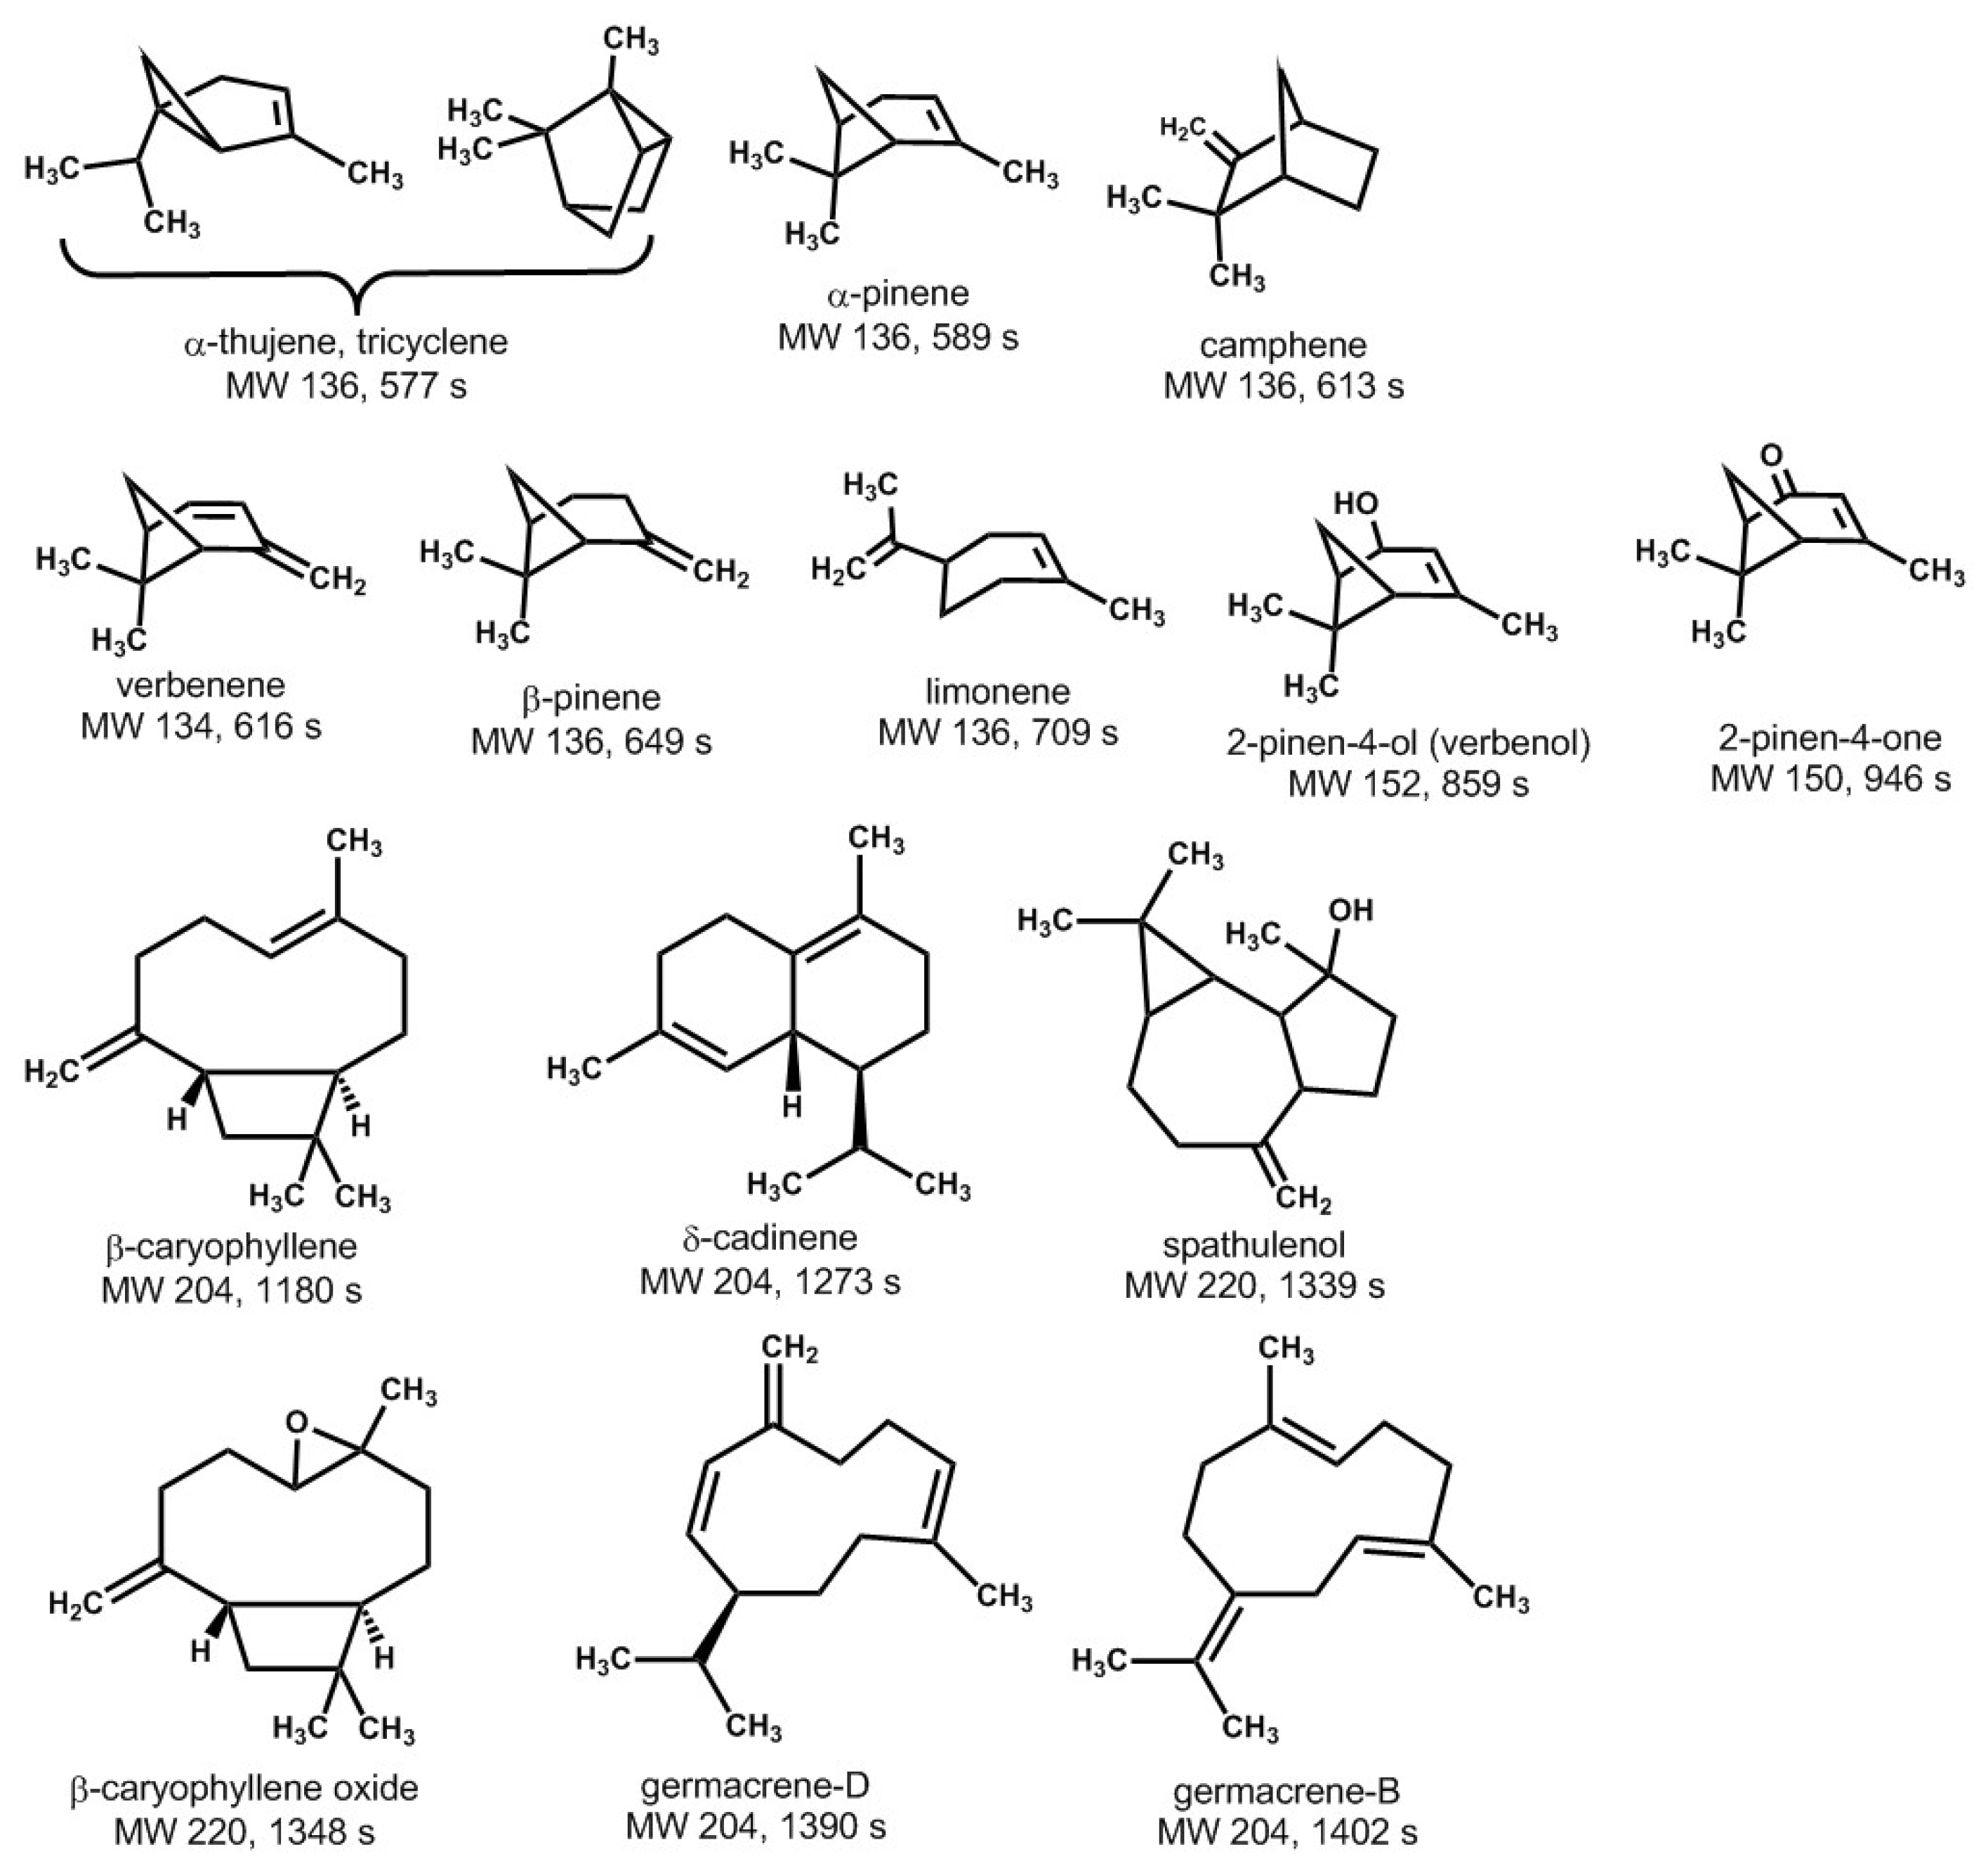
Standards were not available for matching the mass spectra or retention times. However, the comparison of measured retention indices with values that were published in the literature provided an improved level of accuracy with regard to the compound identifications in Figure 5 and Figure 6. The retention indices measured in the present study were systematically higher compared with the literature values; however, the order of retention indices was consistent when compared with previous publications by Adams [84], Isodorov [45], and Schwob [89], as presented in Table 1. The higher retention indices mean that the retention times are longer for the terpenoids with respect to the neighboring compounds in the paraffin series. This is probably the result of the secondary column (a 50% phenyl/50% methyl stationary phase), which separates compounds more on the basis of polarity compared with the methyl siloxane stationary phases used in the literature.
The presence of multiple sesquiterpenes is illustrated by a 3D chromatographic plot of the region eluting from about 1160 to 1460 sec, using the sum of the extracted ion profiles of m/z 93, 91, 204 (expanded by 20×) and 136 (expanded by 20×); Figure 7. β-caryophyllene and δ-cadinene are prominent, eluting on either side of the butylated hydroxytoluene (BHT) preservative, which is an impurity introduced into the process by the THF receiving solvent. It is worthwhile noting that there is another prominent sesquiterpene that is exactly co-eluted with BHT, as evidenced by an m/z 204 extracted ion profile that does not exactly trace that of the BHT-derived ions; however, a mass spectrum could not be deconvoluted. There are minor peaks with a molecular weight of 204 that are seen at later retention times. They furnish mass spectra that are in good agreement with the germacrene derivatives; however, there is a disagreement between their observed elution order and that which is reported in the literature.

3.3. Residual Paste Water Leach and Thermal Desorption/Pyrolysis

The DME extract produced a resin that was partially dissolved in THF; for the preceding analysis, the residual green paste was leached with water to identify compounds that were more extensively functionalized. Residual THF was the only compound significantly above the background when the TIC was plotted without expansion factors; this is shown in Supplementary Materials Figure S3. Several terpene/terpenoid compounds were observed when the extracted ion chromatograms generated from the sum of m/z 91 and 93 were plotted; see Supplementary Materials Figure S4. Specifically, α- and β-pinene and two pinene oxygenates, 2-pinen-4-ol and 2-pinen-4-one, were observed, albeit at low abundance. In this sample, the concentration of α-pinene was measured at 0.07 mM/, indicating that the majority of the α-pinene was recovered by the THF dissolution. There was no evidence of any sesquiterpene derivatives in this analysis of the subsequent water leach.
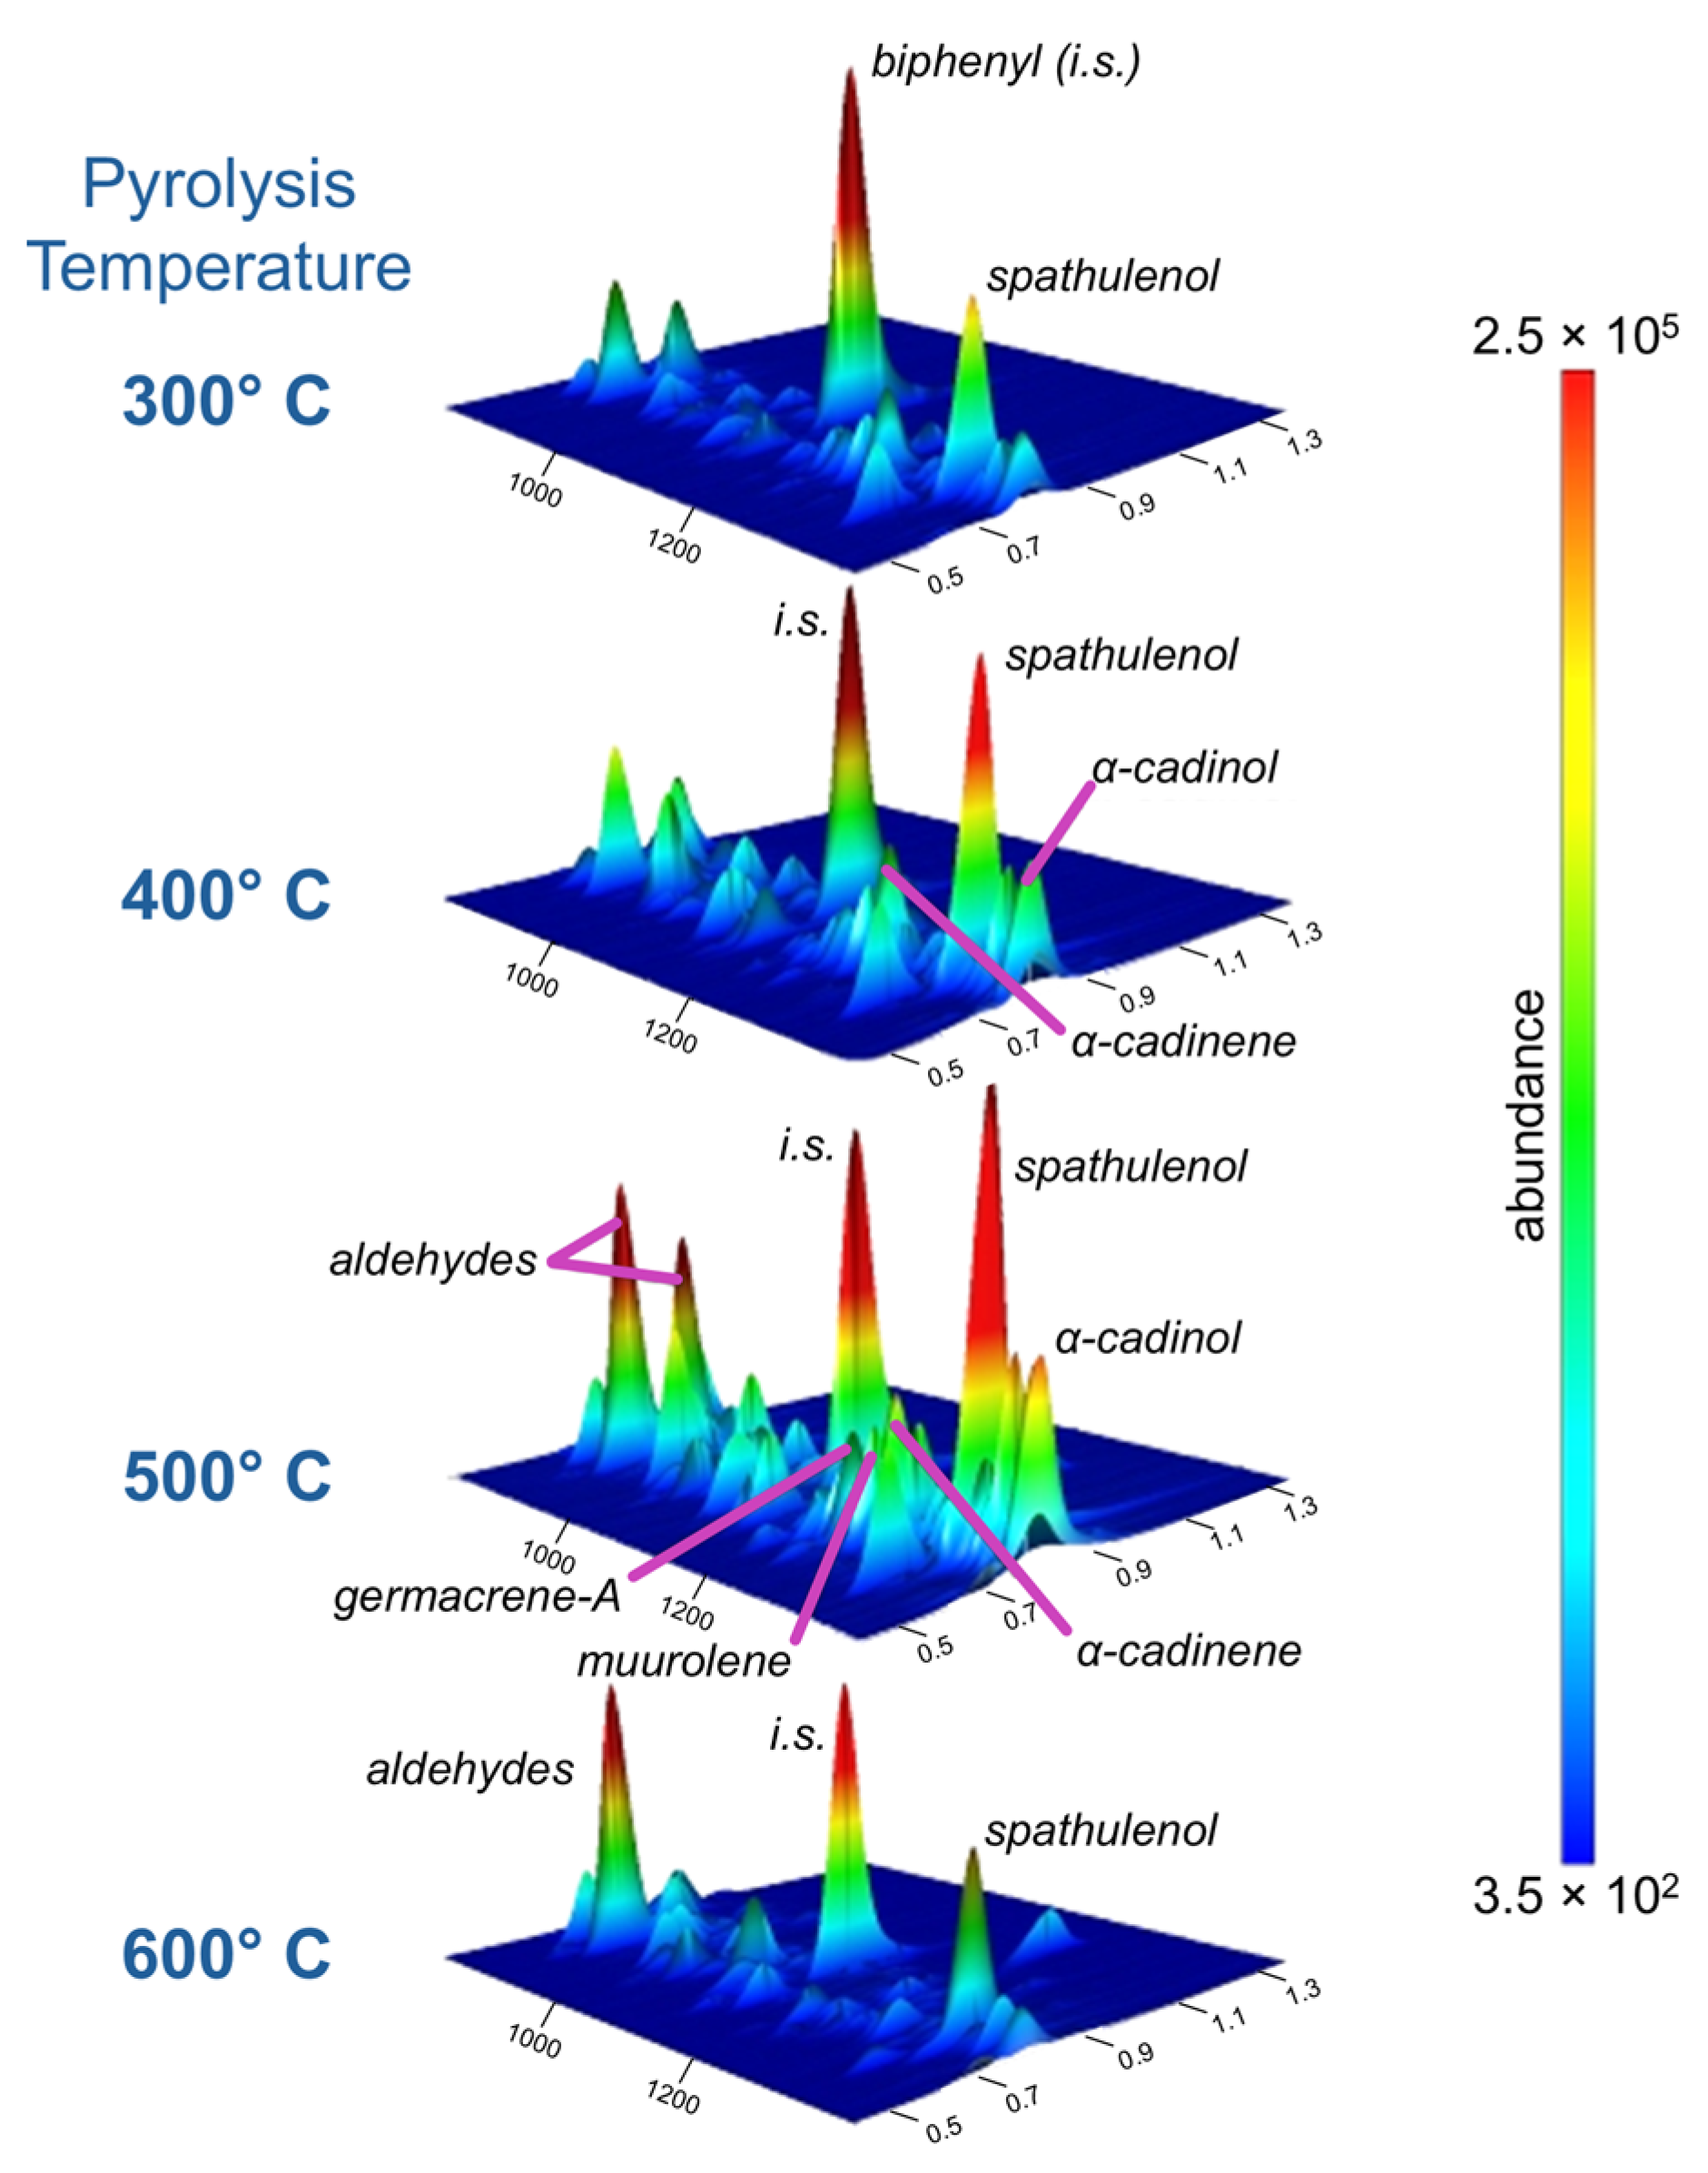
The post-THF dissolution residuals were also analyzed using micro-pyrolysis/2D-GC/MS. Four different maximum temperatures were employed in the micropyrolysis unit: 300 °C, 400 °C, 500 °C, and 600 °C. These experiments function to both thermally desorb and pyrolyze the residue samples. Generally, 300 °C is inadequate to initiate the pyrolysis of biomass, but it is more than sufficient to volatilize many of the organics present. Pyrolysis of biomass at 400 °C results in the thermal degradation of hemicellulose, which is observed in the form of small organic oxygenates eluting from the 2D-GC at shorter retention times. At 500 °C and 600 °C, significant pyrolysis of the cellulose and lignin fractions occurs; compounds from these processes are observed together with the terpenoids.
Compound identification involved the consideration of matching experimental mass spectra with those found in mass spectral libraries and matching retention indices. Mass spectral library matching is ambiguous because of the large number of terpenoid compounds in the libraries and the similarity of their mass spectra. Compound identification based on retention index matching is similarly difficult due to disagreements in the literature and also because the retention indices in the present study were systematically greater compared to those in the literature. Nevertheless, elution order is largely constant; hence, using elution order together with mass spectral matching afforded compound identification with good accuracy.
Paraffinic aldehydes containing between six and twelve carbon atoms were observed in the thermal desorption/pyrolysis experiments (see Figure 8); these compounds are likely formed from the degradation of the corresponding acids during the thermal desorption/pyrolysis event. No monoterpenes were seen in these analyses, indicating that the THF extraction had effectively removed them from the insoluble green residue generated in the DME extraction. The compounds produced from the experiments conducted at 400, 500, and 600 °C were similar in many cases, and their abundances increased from 300 < 400 < 500 °C but then decreased upon going to 600 °C, suggesting that the highest temperatures caused degradation of some of the sesquiterpenes.
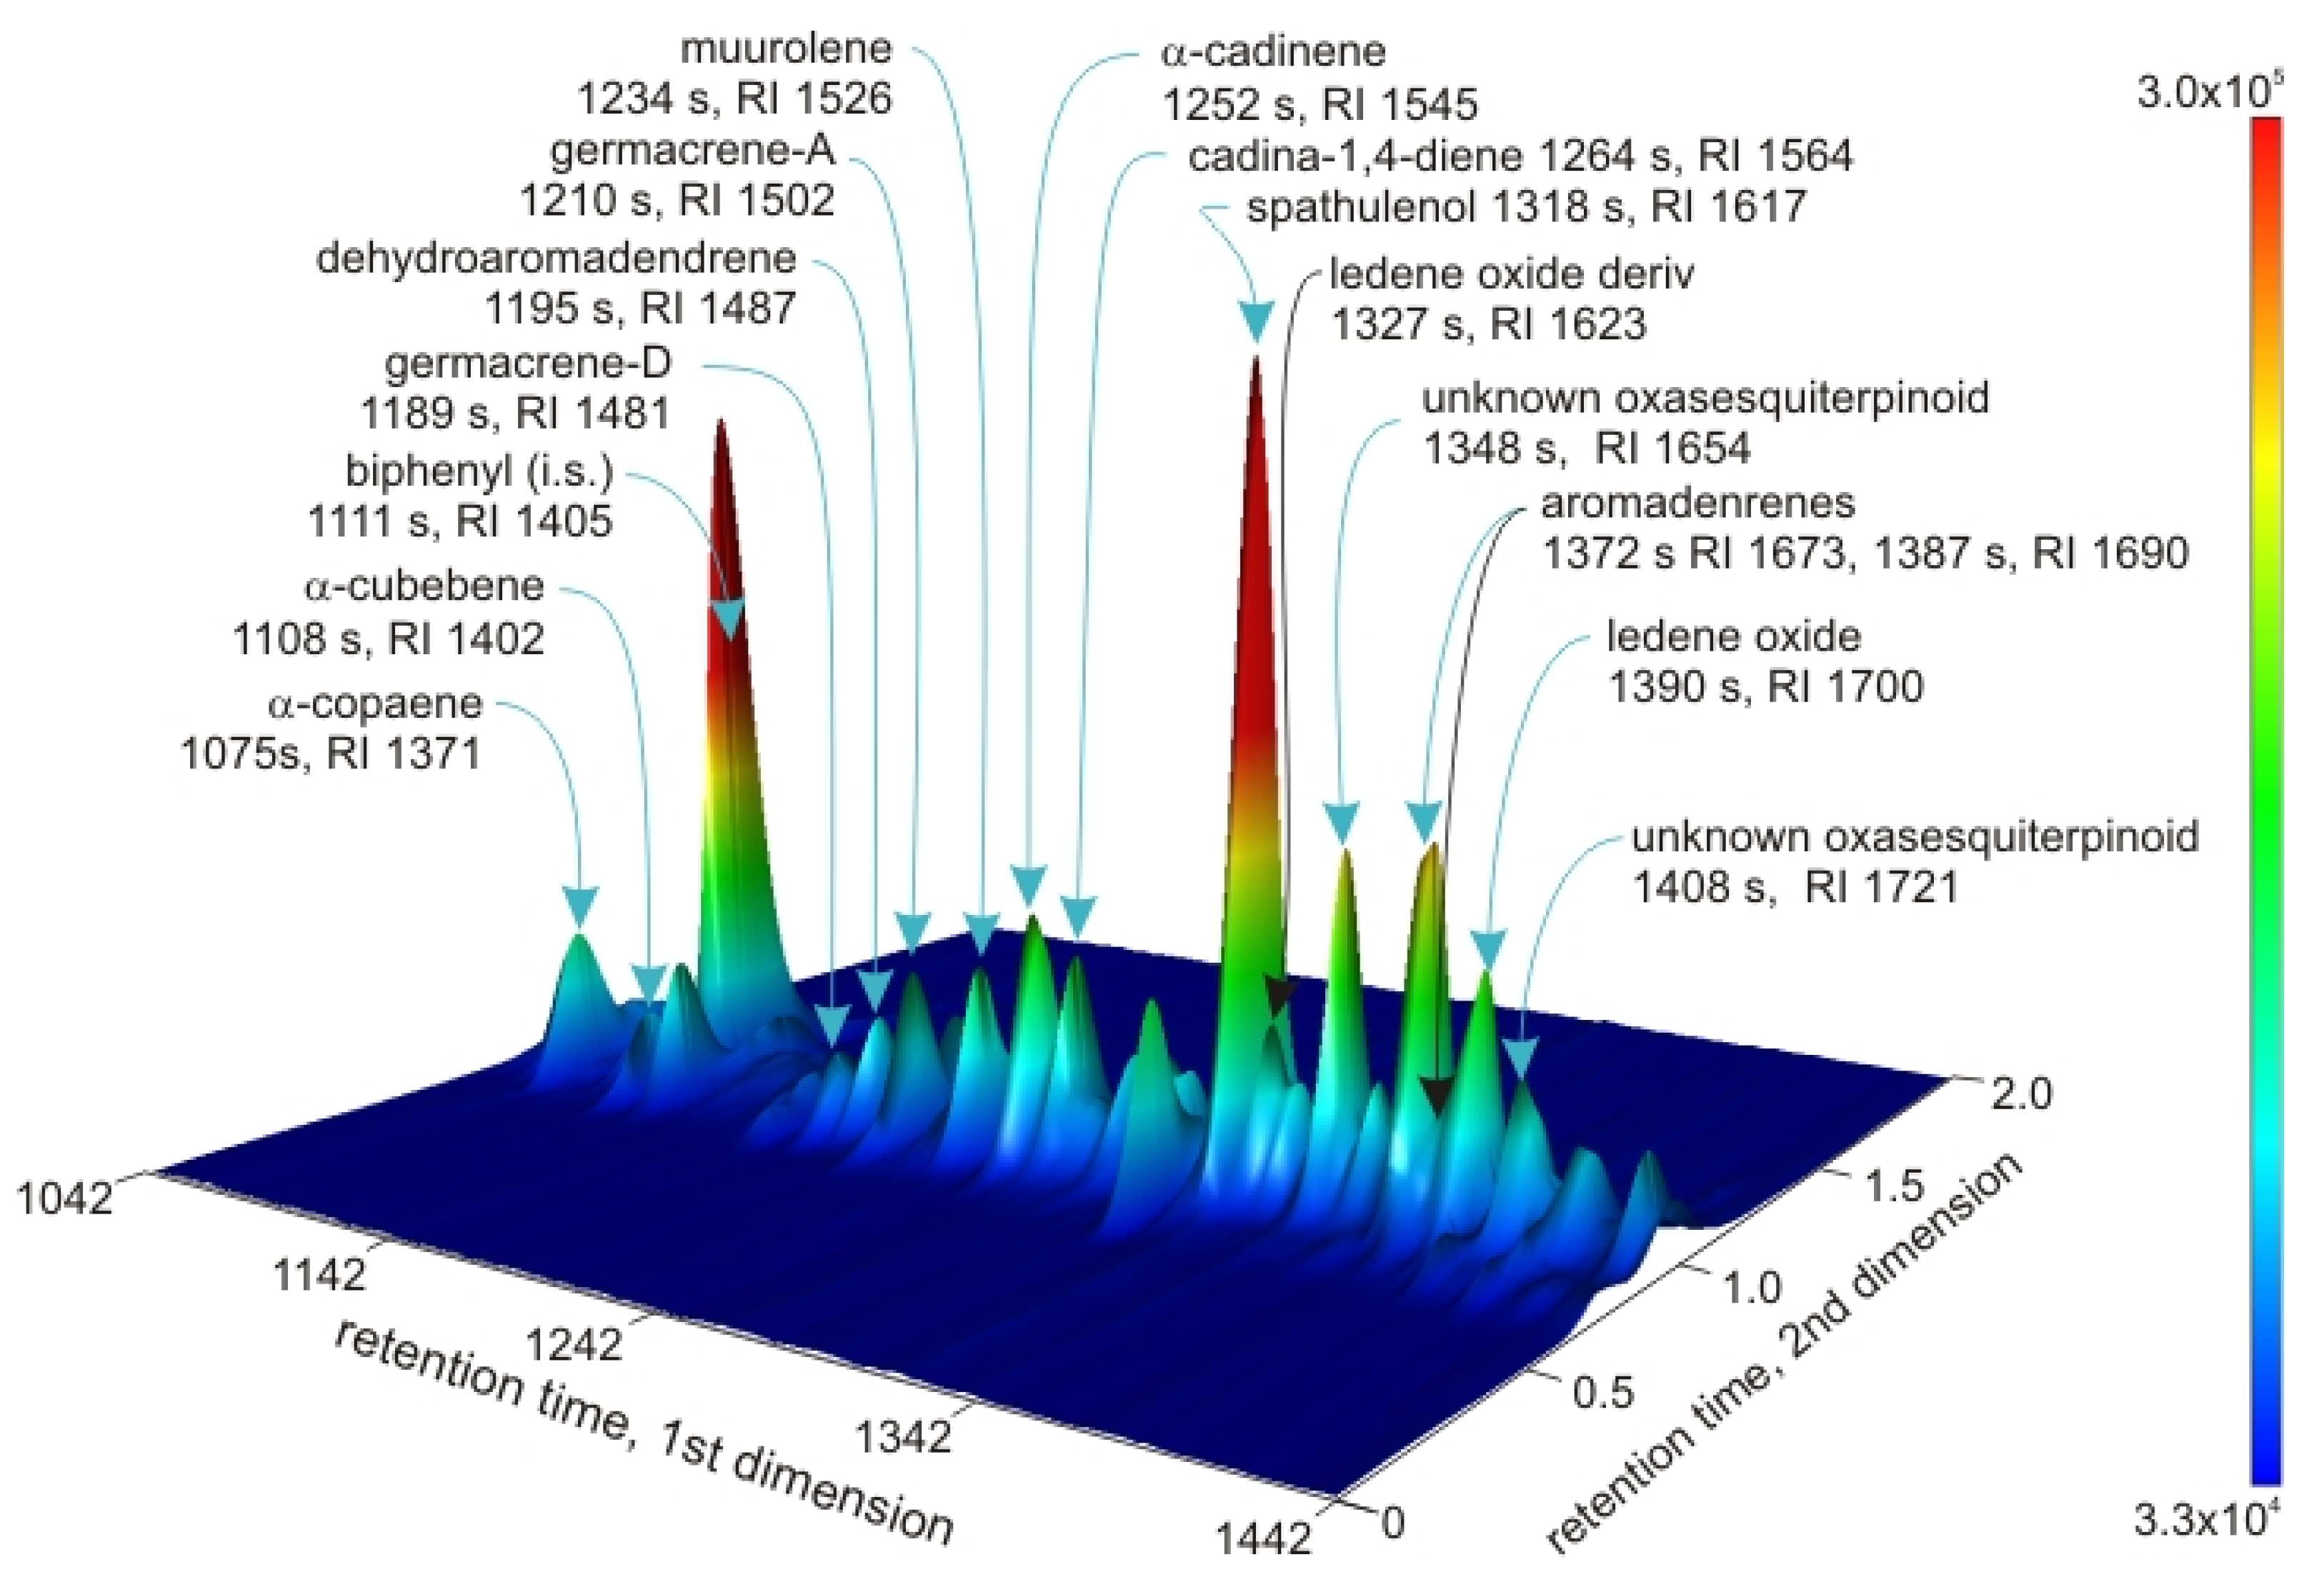
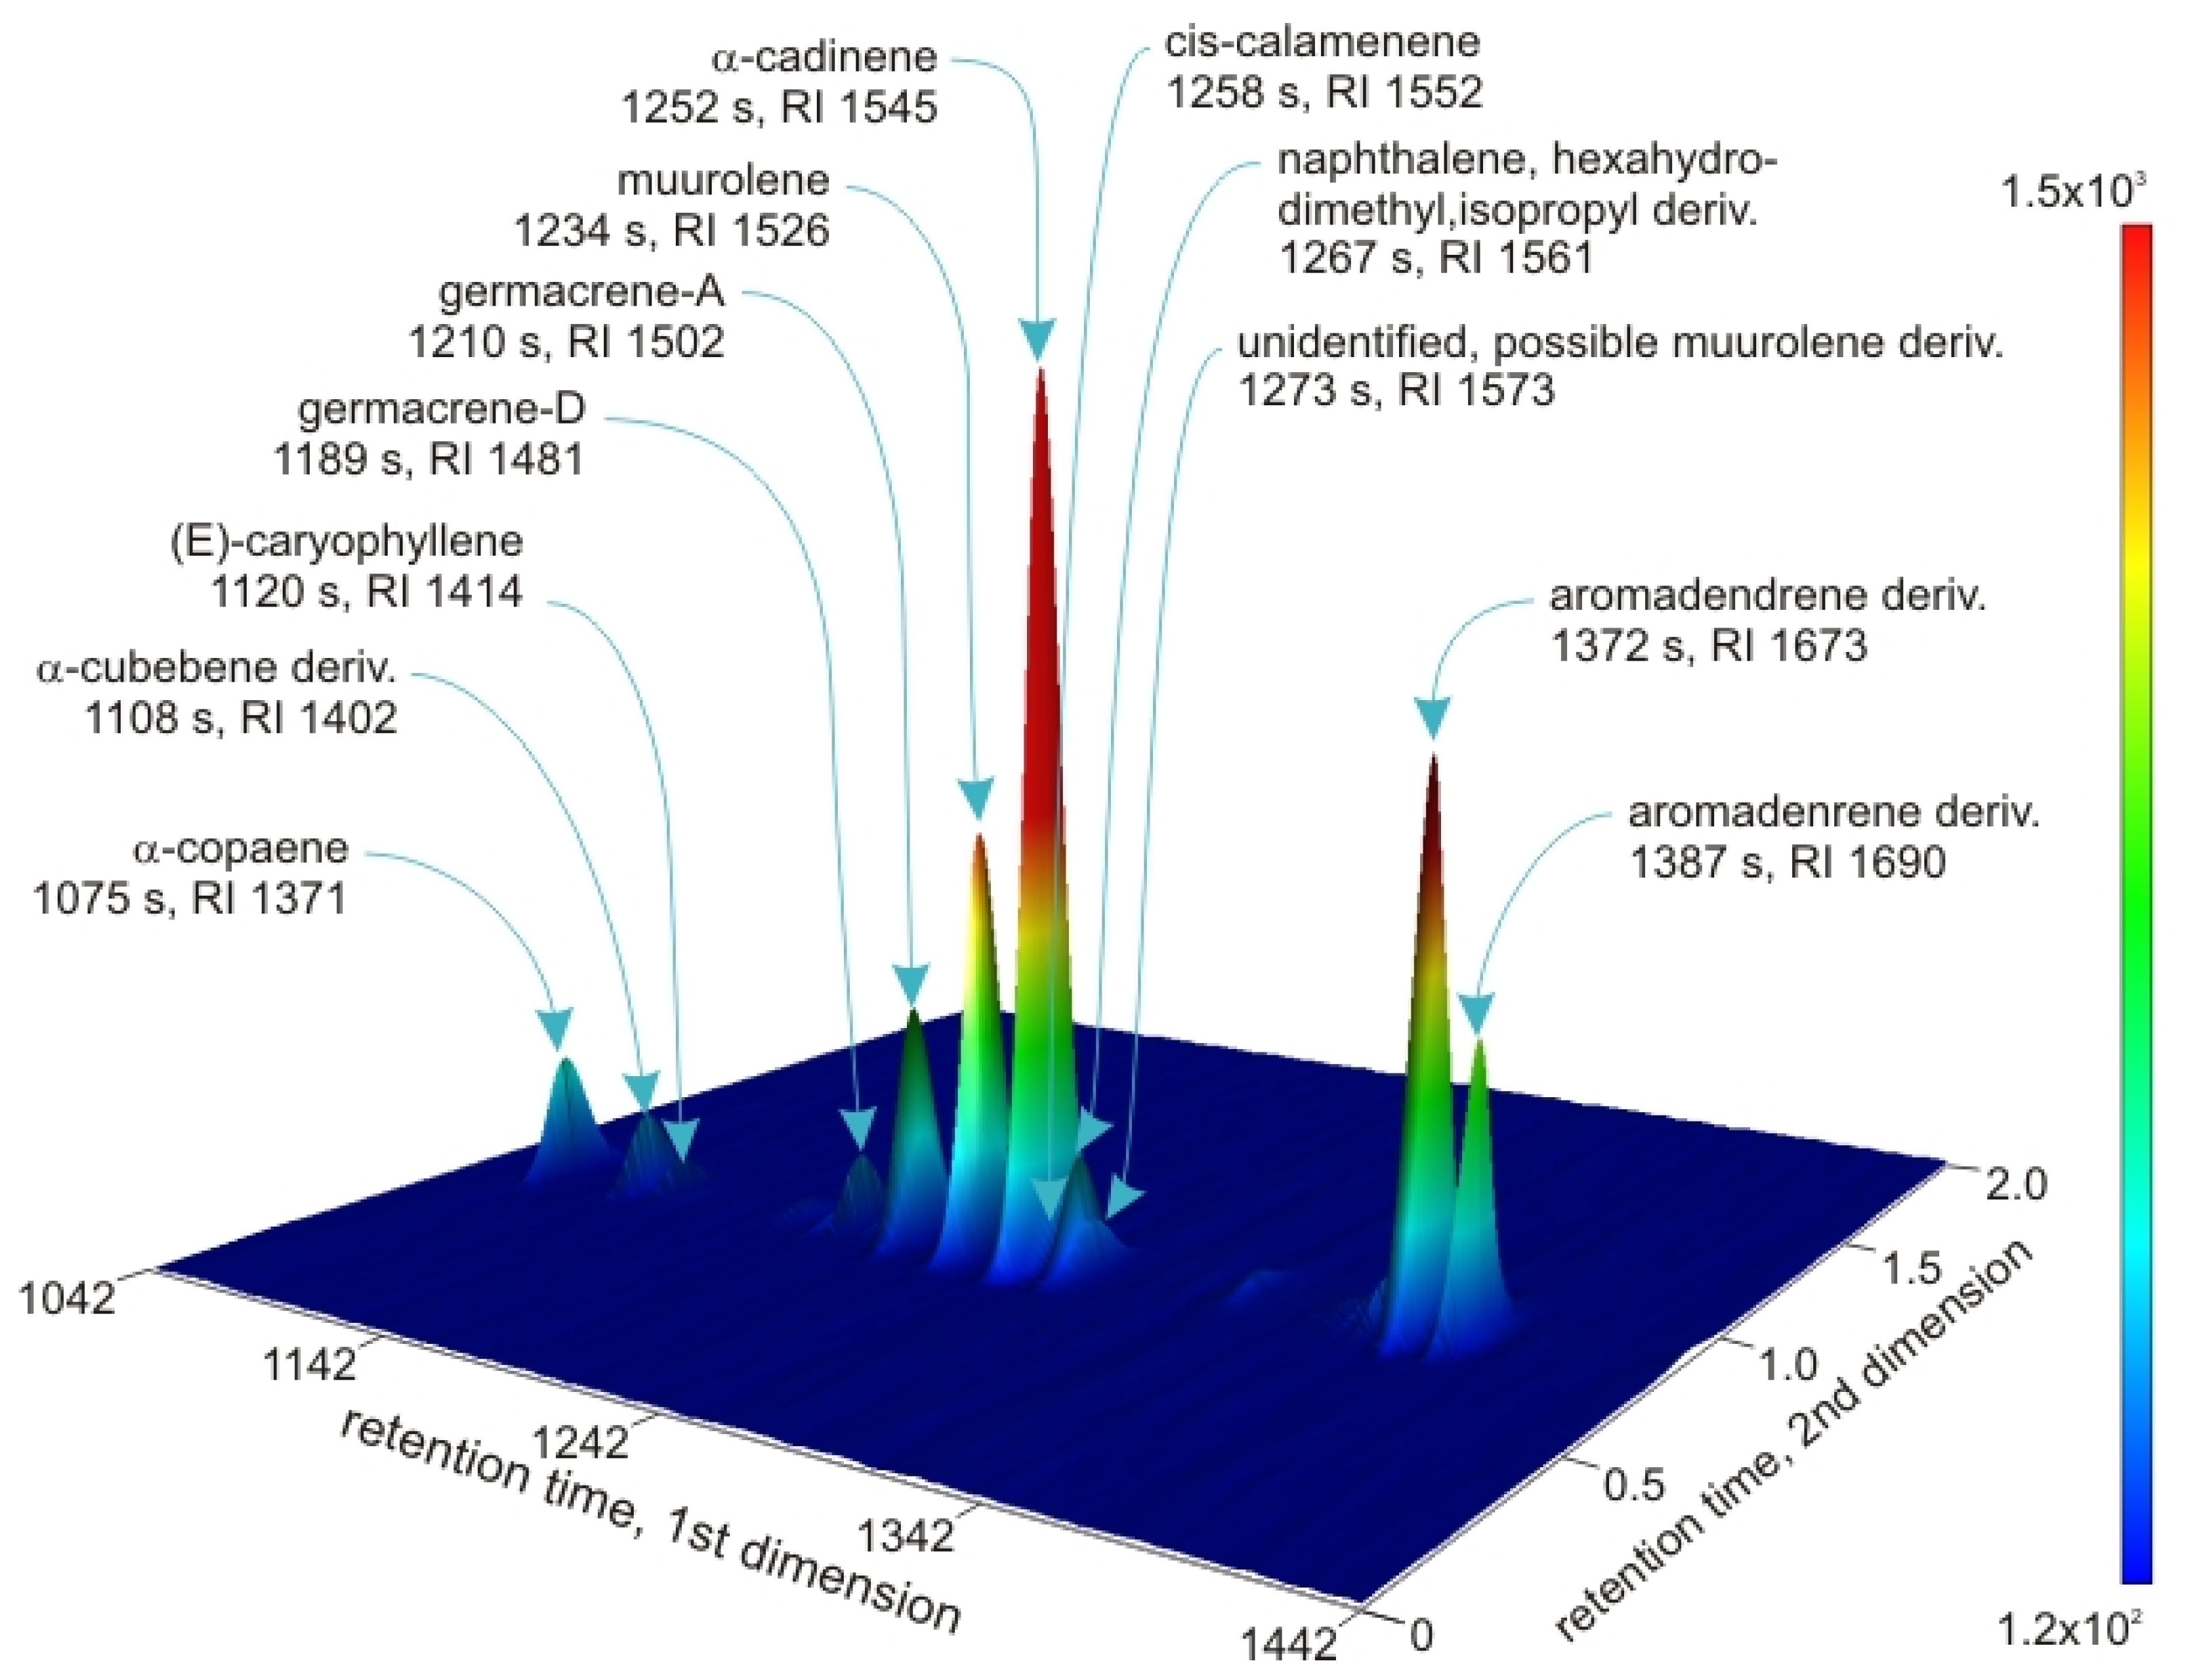
The thermal desorption/pyrolysis experiments contained ten abundant sesquiterpene or sesquiterpenoid compounds in the time window over which the sesquiterpenes elute; see Figure 8. The most abundant peak was a compound identified as (+) spathulenol, which is a hydroxylated sesquiterpene. A small but notable molecular ion was observed at m/z 220 for spathulenol, and the mass spectrum was in excellent agreement with the library entry (Supplementary Materials Figure S18). α-Cadinene is the second most prominent sesquiterpene; this compound was not noted in the analyses of the extracts (Supplementary Materials Figure S14). It is noted that a large number of less abundant sesquiterpenoid compounds were extracted, and the 2D chromatograms in Figure 9 and Figure 10 provide a flavor of the complexity. These compounds were not detected in the analyses of conventional solvent extraction processes, indicating that sesquiterpenes do not have significant solubility in THF, hexane [26], or methylene chloride [90]. However, it is clear that they are mobilized by condensed dimethyl ether. Identifications of compounds within the insoluble residues are presented in Table 2. A plot of the three-dimensional chromatogram generated from the total mass spectral ion current at a 500 °C pyrolysis of THF-insoluble solid is shown in Figure 9. The m/z 204 channel depicting thermal desorption/pyrolysis conducted at 500 °C on a the THF-insoluble solid is shown in Figure 10.

4. Conclusions

Pine needle extracts are widely utilized in diverse applications that include composite materials, chemicals, pharmaceuticals, and food. The dimethyl ether (DME) extraction process presented in this work was effective in separating terpenoid compounds from pine needle biomass. The process has the advantage of being conducted at benign temperatures, which is important, given the propensity of the terpene and sesquiterpene derivatives to undergo isomerization. The DME extraction was able to mobilize a large number of sesquiterpenoid compounds, which were not directly extractable with THF, hexane, or methylene chloride. The variability of terpenoid compounds presents a significant characterization challenge, which was addressed using two-dimensional gas chromatography with mass spectrometry detection. This approach yielded unequivocal separation of the majority of the terpenoid peaks; however, the similarity of the mass spectra of terpenoid isomers rendered identification based on mass spectral library searching ineffective. Improved compound identification was achieved by combining retention index matching with library searching; however, this was complicated by longer retention indices resulting from the polar secondary column used in the two-dimensional GC analysis, which disproportionately lengthens the retention times of the terpenoids compared with the different types of paraffin. Nevertheless, the overall analytical strategy shows good promise for characterizing complex mixtures generated in extractions of pine biomass.

Supplementary Materials

The following supporting information can be downloaded at: https://www.mdpi.com/article/10.3390/separations12070169/s1, Figure S1. Experimental apparatus utilized for DME extraction of terpenoids from pine needles. The extraction was carried out within a glass vessel (50 mm outer diameter, 5 mm wall thickness) with threaded ends sealed with Teflon endcaps. The extraction vessel was connected to the DME canister and a pump via Swagelok fittings and 1/8” Teflon tubing. Needles were loaded into the extraction chamber, the chamber was sealed, and DME was introduced to the chamber from the condensable gas canister. DME was then recirculated via a pump. After recirculation, the DME-soluble extract was recovered from extraction chamber via a ball valve. DME volatilizes away at ambient tem-perature and pressure, leaving behind the DME-soluble terpenoid-containing extract; Figure S2. Total ion chromatogram of a solution of a-pinene, biphenyl, phenanthrene and fluoranthene, in concentrations of 3.16, 1.00, 1.00 and 1.00 mM/L, respectively; Figure S3. Total ion chromatogram of the aqueous layer, diluted 1:10 with methanol, no expansion factors; Figure S4. 3-D extracted ion chromatogram generated from the sum of m/z 91+93, for the aqueous layer. The internal standard biphenyl is observed because it has a low abundance m/z 91 in its mass spectrum; Figure S5. Top, mass spectrum of RT 1075 s. Bottom, library spectrum of (-)-α-copaene. Perhaps the rare (+)-α-stereoisomer, or (-)-β-isomer; Figure S6. Top, mass spectrum of RT 1108 s. Bottom, library spectrum of (-)-α-copaene. Perhaps the rare (+) stereoisomer; Figure S7. Top, mass spectrum of RT 1120 s. Bottom, library spectrum of β-caryophyllene, not a convincing match; Figure S8. Top, mass spectrum of RT 1168 s. Bottom, library spectrum of germacrene-D; Figure S9. Top, mass spectrum of RT 1168 s. Bottom, library spectrum of β-caryophyllene; Figure S10. Top, mass spectrum of RT 1189 s. Bottom, library spectrum of germacrene-D; Figure S11. Top, mass spectrum of RT 1198 s. Bottom, library spectrum of ledene oxide-(II); Figure S12. Top, mass spectrum of RT 1210 s. Bottom, library spectrum of (-)-α-copaene; Figure S13. Top, mass spectrum of RT 1234 s. Bottom, library spectrum of α-muurolene; Figure S14. Top, mass spectrum of RT 1252 s. Bottom, library spectrum of γ-cadinene; Figure S15. Top, mass spectrum of RT 1258 s. Bottom, library spectrum of calamenene; Figure S16. Top, mass spectrum of RT 1267 s. Bottom, library spectrum of 1,2,3,4,4a,7-hexahydro-1,6-dimethyl-4-(1-methylethyl)-naphthalene; Figure S17. Top, mass spec-trum of RT 1273 s. Bottom, library spectrum of α-muurolene; Figure S18. Top, mass spectrum of RT 1318 s. Bottom, library spectrum of spathulenol; Figure S19. Top, mass spectrum of RT 1318 s. Bottom, library spectrum of (-)-caryophyllene oxide; Figure S20. Top, mass spectrum of RT 1318 s. Bottom, library spectrum of (+)-aromadren; Figure S21. Top, mass spectrum of RT 1363 s. Bottom, library spectrum of ledene oxide-(II); Figure S22. Top, mass spectrum of RT 1363 s. Bottom, library spectrum of α-copaene; Figure S23. Top, mass spectrum for RT1 1372 s. Bottom, library spectrum for aromadrene oxide; Figure S24. Top, mass spectrum for RT1 1372 s. Bottom, library spectrum for (+)-aromadren; Figure S25. Top, mass spectrum for RT1 1372 s. Bottom, library spectrum for 1,2,3,4,4a,5,8,9,12,12a-decahydro-1,4-methanobenzocyclodecene; Figure S26. Top, mass spectrum for RT1 1387 s. Bottom, library spectrum for aromadren; Figure S27. Top, mass spectrum for RT1 1372 s. Bottom, library spectrum for (-)-caryophyllene oxide; Figure S28. Top, mass spectrum for RT1 1417 s. Bottom, library spectrum for ledene oxide; Figure S29. Top, mass spectrum for RT1 1537 s. Bottom, library spectrum for ledene oxide.

Author Contributions

Conceptualization, L.M.W. and A.D.W.; methodology, G.S.G. and C.O.; investigation, G.S.G. and R.M.B.; writing—original draft preparation, G.S.G.; writing—review and editing, C.S., L.M.W., and A.D.W.; visualization, C.S.; supervision, A.D.W.; funding acquisition, L.M.W. All authors have read and agreed to the published version of the manuscript.

Funding

G.S.G., R.M.B., and L.M.W. were supported by the U.S. Department of Energy (DOE), the Office of Energy Efficiency and Renewable Energy (EERE), and Bioenergy Technologies Office (BETO). C.O., C.S., and A.D.W. acknowledge funding from ExxonMobil. The views represented are those of the authors and do not necessarily reflect those of ExxonMobil. This work was conducted at Idaho National Laboratory under the United States Department of Energy contract DE-AC07-05ID14517. The views expressed in this article do not necessarily represent the views of the U.S. Department of Energy or the United States Government.

Data Availability Statement

The original contributions presented in this study are included in the article/Supplementary Materials. Further inquiries can be directed to the corresponding authors.

Acknowledgments

The authors would like to thank INL colleagues Luke Williams for needle sourcing and thermal treatment and Arvin Cunningham and Tim Yoder for their SEM-EDS expertise.

Conflicts of Interest

The authors declare no conflicts of interest.

Abbreviations

The following abbreviations are used in this manuscript:
DMEDimethyl ether
SPMESolid-phase microextraction
2D-GC/MSTwo-dimensional gas chromatography/mass spectrometry
SEMScanning electron microscopy
EDSEnergy dispersive X-ray spectroscopy
THFTetrahydrofuran
2D-GCTwo-dimensional gas chromatography
PEGPolyethylene glycol

References

  1. Ryan, M.G.; Richardson, D.M. The Complete Pine. BioScience 1999, 49, 1023–1024. [Google Scholar] [CrossRef]
  2. William, I.; Roberts, I. American Potash Manufacture before the American Revolution. In Proceedings of the American Philosophical Society; American Philosophical Society: Philadelphia, PA, USA, 1972; Volume 116, pp. 383–395. Available online: http://www.jstor.org/stable/986069 (accessed on 1 May 2025).
  3. Özgüven, F.; Vursavuş, K. Some physical, mechanical and aerodynamic properties of pine (Pinus pinea) nuts. J. Food Eng. 2005, 68, 191–196. [Google Scholar] [CrossRef]
  4. Kim, K.-Y.; Chung, H.-J. Flavor Compounds of Pine Sprout Tea and Pine Needle Tea. J. Agric. Food Chem. 2000, 48, 1269–1272. [Google Scholar] [CrossRef]
  5. Elfvinga, B.; Ericsson, T.; Rosvall, O. The Introduction of Lodgepole Pine for Wood Production in Sweden: A Review. For. Ecol. Manag. 2001, 141, 15–29. [Google Scholar] [CrossRef]
  6. Liu, C.; Wang, H.; Karim, A.M.; Sun, J.; Wang, Y. Catalytic fast pyrolysis of lignocellulosic biomass. Chem. Soc. Rev. 2014, 43, 7594–7623. [Google Scholar] [CrossRef] [PubMed]
  7. Oasmaa, A.; Kuoppala, E.; Gust, S.; Solantausta, Y. Fast Pyrolysis of Forestry Residue. 1. Effect of Extractives on Phase Separation of Pyrolysis Liquids. Energy Fuels 2003, 17, 1–12. [Google Scholar] [CrossRef]
  8. Wiyono, B.; Tachibana, S.; Tinambunan, D. Chemical Compositions of Pine Resin, Rosin and Turpentine Oil from West Java. J. For. Res. 2006, 3, 7–17. [Google Scholar] [CrossRef]
  9. Rissanen, K.; Hölttä, T.; Barreira, L.F.M.; Hyttinen, N.; Kurtén, T.; Bäck, J. Temporal and Spatial Variation in Scots Pine Resin Pressure and Composition. Front. For. Glob. Change 2019, 2, 23. [Google Scholar] [CrossRef]
  10. Hood, S.; Sala, A. Ponderosa pine resin defenses and growth: Metrics matter. Tree Physiol. 2015, 35, 1223–1235. [Google Scholar] [CrossRef]
  11. Clark, E.L.; Pitt, C.; Carroll, A.L.; Lindgren, B.S.; Huber, D.P. Comparison of lodgepole and jack pine resin chemistry: Implications for range expansion by the mountain pine beetle, Dendroctonus ponderosae (Coleoptera: Curculionidae). PeerJ 2014, 2, e240. [Google Scholar] [CrossRef]
  12. Ribeiro, A.; Bernardo-Gil, G. Densities and refractive indices of components of pine resin. J. Chem. Eng. Data 1990, 35, 204–206. [Google Scholar] [CrossRef]
  13. Bernardo-Gil, M.G.; Ribeiro, M.A. Vapor-Liquid Equilibria of Binary Systems based on Pine Resin. FIuidPhaseEquilibria 1989, 53, 15–22. [Google Scholar] [CrossRef]
  14. Kong, Z.; Liu, Z.; Ding, B. Study on the antimutagenic effect of pine needle extract. Mutat. Res. 1995, 347, 101–104. [Google Scholar] [CrossRef] [PubMed]
  15. Lee, J.S.; Kim, H.G.; Lee, H.W.; Han, J.M.; Lee, S.K.; Kim, D.W.; Saravanakumar, A.; Son, C.G. Hippocampal memory enhancing activity of pine needle extract against scopolamine-induced amnesia in a mouse model. Sci. Rep. 2015, 5, 9651. [Google Scholar] [CrossRef]
  16. Singha, A.S.; Thakur, V.K. Study of Mechanical Properties of Ureaformaldehyde Theromsets Reinforced by Pine Needle Powder. BioResources 2009, 4, 292–308. [Google Scholar] [CrossRef]
  17. Singha, A.S.; Thakur, V.K. Mechanical, Morphological and Thermal Properties of Pine Needle-Reinforced Polymer Composites. Int. J. Polym. Mater. Polym. Biomater. 2008, 58, 21–31. [Google Scholar] [CrossRef]
  18. Chang, R.; Rohindra, D.; Lata, R.; Kuboyama, K.; Ougizawa, T. Development of poly(ε-caprolactone)/pine resin blends: Study of thermal, mechanical, and antimicrobial properties. Polym. Eng. Sci. 2019, 59, E32–E41. [Google Scholar] [CrossRef]
  19. Varma, A.K.; Mondal, P. Physicochemical characterization and kinetic study of pine needle for pyrolysis process. J. Therm. Anal. Calorim. 2015, 124, 487–497. [Google Scholar] [CrossRef]
  20. Pandey, S.; Dhakal, R.P. Pine Needle Briquettes: A Renewable Source of Energy. Int. J. Energy Sci. 2013, 3. Available online: https://www.researchgate.net/publication/265783688_Pine_Needle_Briquettes_A_Renewable_Source_of_Energy (accessed on 1 May 2025).
  21. Kim, E.-J.; Kim, S.-M. Bread Properties Utilizing Extracts of Pine Needle according to Preparation Method. Korean J. Food Sci. Technol. 1998, 30, 542–547. [Google Scholar]
  22. Eriksson, G.; Jensen, S.; Kylin, H.; Strachan, W. The pine needle as a monitor of atmospheric pollution. Nature 1989, 341, 42–44. [Google Scholar] [CrossRef]
  23. Lamppu, J.; Huttunen, S. Relations between Scots pine needle element concentrations and decreased needle longevity along pollution gradients. Environ. Polution 2003, 122, 119–126. [Google Scholar] [CrossRef]
  24. Faldt, J.; Solheim, H.; Langstrom, B.; Borg-Karlson, A.K. Influence of fungal infection and wounding on contents and enantiomeric compositions of monoterpenes in phloem of Pinus sylvestris. J. Chem. Ecol. 2006, 32, 1779–1795. [Google Scholar] [CrossRef]
  25. Szmigielski, R.; Cieslak, M.; Rudzinski, K.J.; Maciejewska, B. Identification of volatiles from Pinus silvestris attractive for Monochamus galloprovincialis using a SPME-GC/MS platform. Environ. Sci. Pollut. Res. 2012, 19, 2860–2869. [Google Scholar] [CrossRef]
  26. Backlund, I.; Arshadi, M.; Hunt, A.J.; McElroy, C.R.; Attard, T.M.; Bergsten, U. Extractive profiles of different lodgepole pine (Pinus contorta) fractions grown under a direct seeding-based silvicultural regime. Ind. Crops Prod. 2014, 58, 220–229. [Google Scholar] [CrossRef]
  27. Kacik, F.; Vel’kova, V.; Smira, P.; Nasswettrova, A.; Kacikova, D.; Reinprecht, L. Release of Terpenes from Fir Wood during Its Long-Term Use and in Thermal Treatment. Molecules 2012, 17, 9990–9999. [Google Scholar] [CrossRef] [PubMed]
  28. Achotegui-Castells, A.; Llusia, J.; Hodar, J.A.; Penuelas, J. Needle terpene concentrations and emissions of two coexisting subspecies of Scots pine attacked by the pine processionary moth (Thaumetopoea pityocampa). Acta Physiol. Plant. 2013, 35, 3047–3058. [Google Scholar] [CrossRef]
  29. Piccand, M.; Bianchi, S.; Halaburt, E.I.; Mayer, I. Characterization of extractives from biomasses of the alpine forests and their antioxidative efficacy. Ind. Crops Prod. 2019, 142, 111832. [Google Scholar] [CrossRef]
  30. Bukhanko, N.; Attard, T.; Arshadi, M.; Eriksson, D.; Budarin, V.; Hunt, A.J.; Geladi, P.; Bergsten, U.; Clark, J. Extraction of cones, branches, needles and bark from Norway spruce (Picea abies) by supercritical carbon dioxide and soxhlet extractions techniques. Ind. Crops Prod. 2020, 145, 112096. [Google Scholar] [CrossRef]
  31. da Silva, M.; Mateus, E.P.; Munha, J.; Drazyk, A.; Farrall, M.H.; Paiva, M.R.; das Neves, H.J.C.; Mosandl, A. Differentiation of ten pine species from central Portugal by monoterpene enantiomer-selective composition analysis using multidimensional gas chromatography. Chromatographia 2001, 53, S412–S416. [Google Scholar] [CrossRef]
  32. Idzojtic, M.; Kajba, D.; Franjic, J. Differentiation of F-1 hybrids P nigra J. F. Arnold x P sylvestris L., P nigra J. F. Arnold x P densiflora Siebold et Zucc, P nigra J. F. Arnold x P thunbergiana Franco and their parental species by needle volatile composition. Biochem. Syst. Ecol. 2005, 33, 427–439. [Google Scholar] [CrossRef]
  33. Pfeifhofer, H.W.; Idzojtic, M.; Zebec, M. The Needle Volatile Composition of Pinus nigra J. F. Arnold, P. sylvestris L., R densiflora Siebold et Zucc. and P. thunbergiana Franco Trispecies Hybrids. Silvae Genet. 2008, 57, 221–226. [Google Scholar] [CrossRef]
  34. Korica, A.; Polis, O.; Spalvis, K.; Bartkevics, V. Quantitative and Qualitative Seasonal Changes of Scots Pine and Norway Spruce Foliage Essential Oils in Latvia, and the Extraction Dynamics Thereof. Balt. For. 2015, 21, 51–58. [Google Scholar]
  35. Orav, A.; Kailas, T.; Liiv, M. Analysis of terpenoic composition of conifer needle oils by steam distillation/extraction, gas chromatography and gas chromatography mass spectrometry. Chromatographia 1996, 43, 215–219. [Google Scholar] [CrossRef]
  36. Rezanka, P.; Fahnrich, J. Isolation of terpenes from Norway Spruce needles by distillation. Chem. Listy 2003, 97, 119–122. [Google Scholar]
  37. Trubetskaya, A.; Budarin, V.; Arshadi, M.; Magalhaes, D.; Kazanc, F.; Hunt, A.J. Supercritical extraction of biomass as an effective pretreatment step for the char yield control in pyrolysis. Renew. Energy 2021, 170, 107–117. [Google Scholar] [CrossRef]
  38. Bojovic, S.; Jurc, M.; Ristic, M.; Popovic, Z.; Matic, R.; Vidakovic, V.; Stefanovic, M.; Jurc, D. Essential-Oil Variability in Natural Populations of Pinus mugo Turra from the Julian Alps. Chem. Biodivers. 2016, 13, 181–187. [Google Scholar] [CrossRef]
  39. Kupcinskiene, E.; Stikliene, A.; Judzentiene, A. The essential oil qualitative and quantitative composition in the needles of Pinus sylvestris L. growing along industrial transects. Environ. Pollut. 2008, 155, 481–491. [Google Scholar] [CrossRef]
  40. Judzentiene, A.; Stikliene, A.; Kupcinskiene, E. Changes in the essential oil composition in the needles of Scots pine (Pinus sylvestris L.) under anthropogenic stress. Sci. World J. 2007, 7, 141–150. [Google Scholar] [CrossRef]
  41. Nikolic, B.; Todosijevic, M.; Ratknic, M.; Dordevic, I.; Stankovic, J.; Cvetkovic, M.; Marin, P.D.; Tesevic, V. Terpenes and n-Alkanes in Needles of Pinus cembra. Nat. Prod. Commun. 2018, 13, 1035–1037. [Google Scholar] [CrossRef]
  42. Pollien, P.; Chaintreau, A. Simultaneous Distillation−Extraction:  Theoretical Model and Development of a Preparative Unit. Anal. Chem. 1997, 69, 3285–3292. [Google Scholar] [CrossRef]
  43. Tanner, R.L.; Zielinska, B. Determination of the Biogenic Emission Rates of Species Contributing to VOC in the San-Joaquin Valley of California. Atmos. Environ. 1994, 28, 1113–1120. [Google Scholar] [CrossRef]
  44. Tammela, P.; Nygren, M.; Laakso, I.; Hopia, A.; Vuorela, H.; Hiltunen, R. Volatile compound analysis of ageing Pinus sylvestris L. (Scots pine) seeds. Flavour. Fragr. J. 2003, 18, 290–295. [Google Scholar] [CrossRef]
  45. Isidorov, V.A.; Vinogorova, V.T.; Rafałowski, K. HS-SPME analysis of volatile organic compounds of coniferous needle litter. Atmos. Environ. 2003, 37, 4645–4650. [Google Scholar] [CrossRef]
  46. Thanh, K.L.; Commandre, J.M.; Valette, J.; Volle, G.; Meyer, M. Detailed identification and quantification of the condensable species released during torrefaction of lignocellulosic biomasses. Fuel Process. Technol. 2015, 139, 226–235. [Google Scholar] [CrossRef]
  47. Karaogul, E.; Alma, M.H. Solvent-free Microwave and Hydro-distillation Extraction of Essential Oils from the Sawdust of Pines: Correlation with Heat-map. Bioresources 2019, 14, 8229–8240. [Google Scholar] [CrossRef]
  48. Bier, M.C.J.; Medeiros, A.B.P.; de Oliveira, J.S.; Cocco, L.C.; Costa, J.D.; de Carvalho, J.C.; Soccol, C.R. Liquefied gas extraction: A new method for the recovery of terpenoids from agroindustrial and forest wastes. J. Supercrit. Fluids 2016, 110, 97–102. [Google Scholar] [CrossRef]
  49. Levine, I. Method of Simultaneously Defatting, Dehydrating, and Eliminating Bacteria from Foodstuffs. US3795750A, 2 May 1974. [Google Scholar]
  50. Levine, I.E. Methoxymethane Sterilization Method. US3900288A, 13 August 1975. [Google Scholar]
  51. Levine, I.E. Methoxymethane Sterilization Method. US4048343A, 13 September 1977. [Google Scholar]
  52. Bauer, M.C.; Kruse, A. The use of dimethyl ether as an organic extraction solvent for biomass applications in future biorefineries: A user-oriented review. Fuel 2019, 254, 115703. [Google Scholar] [CrossRef]
  53. Zheng, Q.; Watanabe, M. Advances in low-temperature extraction of natural resources using liquefied dimethyl ether. Resour. Chem. Mater. 2022, 1, 16–26. [Google Scholar] [CrossRef]
  54. Kanda, H. Super-energy-saving Dewatering Method for High-specific-surface-area Fuels by Using Dimethyl Ether. Adsorpt. Sci. Technol. 2008, 26, 345–349. [Google Scholar] [CrossRef]
  55. Kanda, H.; Makino, H.; Miyahara, M. Energy-saving drying technology for porous media using liquefied DME gas. Adsorption 2008, 14, 467–473. [Google Scholar] [CrossRef]
  56. Kanda, H.; Makino, H. Energy-efficient coal dewatering using liquefied dimethyl ether. Fuel 2010, 89, 2104–2109. [Google Scholar] [CrossRef]
  57. Oshita, K.; Takaoka, M.; Nakajima, Y.; Morisawa, S.; Kanda, H.; Makino, H.; Takeda, N. Sewage Sludge Dewatering Process Using Liquefied Dimethyl Ether as Solid Fuel. Dry. Technol. 2011, 29, 624–632. [Google Scholar] [CrossRef]
  58. Kanda, H.; Li, P. Simple extraction method of green crude from natural blue-green microalgae by dimethyl ether. Fuel 2011, 90, 1264–1266. [Google Scholar] [CrossRef]
  59. Kanda, H.; Morita, M.; Makino, H.; Takegami, K.; Yoshikoshi, A.; Oshita, K.; Takaoka, M.; Morisawa, S.; Takeda, N. Deodorization and Dewatering of Biosolids by Using Dimethyl Ether. Water Environ. Res. 2011, 83, 23–25. [Google Scholar] [CrossRef]
  60. Oshita, K.; Takaoka, M.; Nakajima, Y.; Morisawa, S.; Kanda, H.; Makino, H.; Takeda, N. Characteristics of Biosolids in Dimethyl Ether Dewatering Method. Water Environ. Res. 2012, 84, 120–127. [Google Scholar] [CrossRef] [PubMed]
  61. Oshita, K.; Toda, S.; Takaoka, M.; Kanda, H.; Fujimori, T.; Matsukawa, K.; Fujiwara, T. Solid fuel production from cattle manure by dewatering using liquefied dimethyl ether. Fuel 2015, 159, 7–14. [Google Scholar] [CrossRef]
  62. Nerome, H.; Hoshino, R.; Ito, S.; Esaki, R.; Eto, Y.; Wakiyama, S.; Sharmin, T.; Goto, M.; Kanda, H.; Mishima, K. Functional Ingredients Extraction from Garcinia mangostana Pericarp by Liquefied Dimethyl Ether. Eng. J. 2016, 20, 155–162. [Google Scholar] [CrossRef]
  63. Hoshino, R.; Murakami, K.; Wahyudiono, W.; Machmudah, S.; Okita, Y.; Ohashi, E.; Kanda, H.; Goto, M. Economical Wet Extraction of Lipid from labyrinthula Aurantiochytrium limacinum by Using Liquefied Dimethyl Ether. Eng. J. 2016, 20, 145–153. [Google Scholar] [CrossRef]
  64. Hoshino, R.; Ogawa, M.; Murakami, K.; Wahyudiono; Kanda, H.; Goto, M. Extraction of Lipids from Wet Arthrospira platensis by Liquefied Dimethyl Ether. Solvent Extr. Res. Dev. Jpn. 2017, 24, 47–60. [Google Scholar] [CrossRef]
  65. Boonnoun, P.; Shotipruk, A.; Kanda, H.; Goto, M. Optimization of rubber seed oil extraction using liquefied dimethyl ether. Chem. Eng. Commun. 2019, 206, 746–753. [Google Scholar] [CrossRef]
  66. Kanda, H.; Shirai, H. Method for Removing Water Contained in Solid Using Liquid Material. WO2003101579A1, 11 December 2003. [Google Scholar]
  67. Zheng, Q.; Zhang, Y.; Wahyudiono; Fouquet, T.; Zeng, X.; Kanda, H.; Goto, M. Room-temperature extraction of direct coal liquefaction residue by liquefied dimethyl ether. Fuel 2020, 262, 116528. [Google Scholar] [CrossRef]
  68. Machmudah, S.; Wicaksono, D.T.; Happy, M.; Winardi, S.; Wahyudiono; Kanda, H.; Goto, M. Water removal from wood biomass by liquefied dimethyl ether for enhancing heating value. Energy Rep. 2020, 6, 824–831. [Google Scholar] [CrossRef]
  69. Kanda, H.; Wahyudiono; Machmudah, S.; Goto, M. Direct Extraction of Lutein from Wet Macroalgae by Liquefied Dimethyl Ether without Any Pretreatment. ACS Omega 2020, 5, 24005–24010. [Google Scholar] [CrossRef]
  70. Zhang, Y.; Chen, M.; Zhou, Y.; Li, W.; Lee, Y.; Kanda, H.; Gao, X.-X.; Hu, R.; Brooks, K.G.; Zia, R.; et al. The Synergism of DMSO and Diethyl Ether for Highly Reproducible and Efficient MA0.5FA0.5PbI3 Perovskite Solar Cells. Adv. Energy Mater. 2020, 10, 2001300. [Google Scholar] [CrossRef]
  71. Öhrman, O.G.W.; Pettersson, E. Dewatering of Biomass Using Liquid Bio Dimethyl Ether. Dry. Technol. 2013, 31, 1267–1273. [Google Scholar] [CrossRef]
  72. McNally, J.S.; Foo, Z.H.; Deshmukh, A.; Orme, C.J.; Lienhard, J.H.; Wilson, A.D. Solute Displacement in the Aqueous Phase of Water-NaCl-Organic Ternary Mixtures Relevant to Solvent-Driven Water Treatment. RSC Adv. 2020, 10, 29516–29527. [Google Scholar] [CrossRef]
  73. Wilson, A.D.; Wendt, D.S.; Orme, C.J.; Adhikari, B.; Ginosaur, D.M. Methods and Systems for Treating an Aqueous Solution. WO2019191553A1, 3 October 2019. [Google Scholar]
  74. Wilson, A.D.; Wendt, D.S.; Orme, C.J.; Adhikari, B.; Ginosaur, D.M. Methods and Systems for Treating an Aqueous Solution. US11261111B2, 1 March 2022. [Google Scholar]
  75. Stetson, C.; Lee, H.; Orme, C.J.; Ginosar, D.M.; Wilson, A.D. Selective Precipitation of Metal Ion Salts from Saturated Aqueous Solutions. PCT/US2022/072792, 2022. [Google Scholar]
  76. Wilson, A.D.; Lienhard, J.; Deshmukh, A.; Foo, Z.H. Switchable System for High-Salinity Brine Desalination and Fractional Precipitation. US20220212957A1, 2022. [Google Scholar]
  77. Stetson, C.; Prodius, D.; Lee, H.; Orme, C.; White, B.; Rollins, H.; Ginosar, D.; Nlebedim, I.C.; Wilson, A.D. Solvent-Driven Fractional Crystallization for Atom-Efficient Separation of Metal Salts from Permanent Magnet Leachates. Nat. Commun. 2022, 13, 3789. [Google Scholar] [CrossRef]
  78. Foo, Z.H.; Stetson, C.; Dach, E.; Deshmukh, A.; Lee, H.; Menon, A.; Prasher, R.; Yip, N.Y.; Lienhard, J.H.; Wilson, A.D. Solvent-Driven Aqueous Separations for Hypersaline Brine Concentration and Resource Recovery. Trends Chem. 2022, 4, 1078–1093. [Google Scholar] [CrossRef]
  79. Deshmukh, A.; Foo, Z.H.; Stetson, C.; Lee, H.; Orme, C.J.; Wilson, A.D.; Lienhard, J.H. Thermodynamics of solvent-driven water extraction from hypersaline brines using dimethyl ether. Chem. Eng. J. 2022, 434, 134391. [Google Scholar] [CrossRef]
  80. Ji, W.S.; Ji, X.Y. Comparative Analysis of Volatile Terpenes and Terpenoids in the Leaves of Species-A Potentially Abundant Renewable Resource. Molecules 2021, 26, 5244. [Google Scholar] [CrossRef] [PubMed]
  81. Mitic, Z.S.; Jovanovic, S.C.; Zlatkovic, B.K.; Nikolic, B.M.; Stojanovic, G.S.; Marin, P.D. Needle Terpenes as Chemotaxonomic Markers in Pinus: Subsections Pinus and Pinaster. Chem. Biodivers. 2017, 14, e1600453. [Google Scholar] [CrossRef] [PubMed]
  82. Butkiene, R.; Nivinskiene, O.; Mockute, D.; Miliute, A. Variety of the essential oils composition of wood, needles (leaves), unripe and ripe berries of var. communis growing wild in Druskininkai district. Chemija 2007, 18, 35–40. [Google Scholar]
  83. Nikolic, B.M.; Ballian, D.; Mitic, Z.S. Diversity of Needle Terpenes Among Pinus Taxa. Forests 2025, 16, 623. [Google Scholar] [CrossRef]
  84. Adams, R.P. Identification of Essential Oil Components by Gas Chromatography/Mass Spectrometry; Allured Publishing Corporation: Carol Stream, IL, USA, 2007. [Google Scholar]
  85. Lee, H.; Stetson, C.; Orme, C.J.; Kuns, M.W.; Lacey, J.A.; Vega-Montoto, L.; Snyder, S.W.; Wilbanks, J.R.; Bowen, J.L.; Wilson, A.D. Class-based separations of mixed solid-liquid systems with condensable solvent washing and extraction: The dilemma of pizza box recycling. J. Clean. Prod. 2023, 426, 139080. [Google Scholar] [CrossRef]
  86. Deshmukh, A.; Wilson, A.D.; Lienhard, J.H. Electrically Powered High-Salinity Brine Separation Using Dimethyl Ether. Ind. Eng. Chem. Res. 2024, 63, 8341–8356. [Google Scholar] [CrossRef]
  87. Gierlinger, N.; Keplinger, T.; Harrington, M. Imaging of plant cell walls by confocal Raman microscopy. Nat. Protoc. 2012, 7, 1694–1708. [Google Scholar] [CrossRef]
  88. Vassilev, S.V.; Vassileva, C.G.; Song, Y.C.; Li, W.Y.; Feng, J. Ash contents and ash-forming elements of biomass and their significance for solid biofuel combustion. Fuel 2017, 208, 377–409. [Google Scholar] [CrossRef]
  89. Schwob, I.; Bessiere, J.-M.; Masotti, V.; Viano, J. Changes in essential oil composition in Saint John’s wort (Hypericum perforatum L.) aerial parts during its phenological cycle. Biochem. Syst. Ecol. 2004, 32, 735–745. [Google Scholar] [CrossRef]
  90. Gardner, D.R.; James, L.F. Pine needle abortion in cattle: Analysis of isocupressic acid in North American gymnosperms. Phytochem. Anal. 1999, 10, 132–136. [Google Scholar] [CrossRef]
Figure 1. SEM images of pine needle cross-sections after DME drying, drying at 40 °C, and drying at 105 °C. Pore collapse is induced by drying at 105 °C. In contrast, DME-dried and 40 °C-dried pine needles appear to have intact pore structures.
Separations 12 00169 g001
Figure 2. SEM-EDS mapping of DME-dried, 40 °C-dried, and 105 °C-dried pine needles. Silicon is enriched in the epidermis and mesophyll. Calcium is enriched in the phloem. Red = Si; blue = Ca.
Separations 12 00169 g002
Figure 3. Mass spectrum of α-pinene acquired during the analysis of the THF layer (top) and the NIST library spectrum (bottom).
Separations 12 00169 g003
Scheme 1. Hypothesized fragmentation of α-pinene, accounting for the formation of the base peak at m/z 93.
Separations 12 00169 sch001
Figure 4. Extracted ion chromatograms from the analysis of the THF layer. The sum of m/z 91 and 93 is given in blue. The top plot is the chromatogram from 450 to 1000 sec, with the molecular ion for the monoterpenes included (m/z 136). The bottom plot is the same analysis, from 1000 to 1450 s, with the molecular ion for the sesquiterpenes included (m/z 204). Compounds identified with high certainty are labeled in blue, while tentatively identified compounds are labeled in red. α-pinene is by far the most abundant compound in the extract. Note the break in the y-axis in the top plot.
Separations 12 00169 g004
Figure 5. Comparison of retention index values from the present study with those reported by Adams [84], Isodorov [45], and Schwob [89].
Separations 12 00169 g005
Figure 6. Structures of terpenoid compounds observed in the THF solution generated in the DME process.
Separations 12 00169 g006
Figure 7. Three-dimensional chromatogram generated from the sum of 93, 91, 204 × 20, and 136 × 20, showing peaks corresponding to the sesquiterpenes. 3-D color scale of peaks shows the relative intensity of species.
Separations 12 00169 g007
Figure 8. Total ion chromatograms (displayed from 800 to 1380 s (first dimension retention time)) 3D-GC/MS according to pyrolysis temperature, emphasizing generation of spathulenol at ~1318 s, maximized at 500 °C. The internal standard (i.s.), biphenyl, is located at the center of each total chromatogram. The left axis depicts the retention time in the first dimension, while the right axis presents the retention time in the second dimension.
Separations 12 00169 g008
Figure 9. Three-dimensional chromatogram generated from the total mass spectral ion current from a 500 °C pyrolysis of a small quantity of THF-insoluble solid.
Separations 12 00169 g009
Figure 10. Three-dimensional chromatogram generated from the m/z 204 mass channel from thermal desorption/pyrolysis conducted at 500 °C on a small quantity of THF-insoluble solid.
Separations 12 00169 g010
Table 1. Retention indices measured for terpenoid compounds identified in the analyses of the THF solution generated from the DME process. Values reported by Isodorov [45], Adams [84], and Schwob [89] are included for comparison.
Retention Index (s)
CompoundThis StudyIsodorov [45]Adams [84]Schwob [89]First Dimension Retention TimeMass Spectral Similarity
Index
Molecular Weight
(u)
Tricyclene958844926 577844136
α-Pinene967936939938589936136
Camphene986886953 613886136
β-Pinene1014911980973649911136
δl-Limonene106285410301024709854136
Verbenol1185838 1146859838152
trans-β-Caryophyllene1480950141814311180950204
α-Selinene15158621494 1216862204
δ-Cadinene1573870152415241273870204
(+) Spathulenol1644836157615741339836220
(−)-Caryophyllene oxide1654774158115761348774220
epi-α-Cadinol17008151653 1390815222
Table 2. Summary of retention indices for compounds identified in the thermal desorption/pyrolysis 2D-GC/MS analyses of the insoluble residues. Values reported by Adams [84] and Isodorov [45] are included for comparison.
Retention Index (s)
CompoundThis StudyIsodorov [45]Adams [84]First Dimension Retention TimeMass Spectral Similarity
Index
Molecular Weight
(u)
α-Copaene1374.3137613771072831204
Cubabene1405.9139013901105870204
1,6,10-Dodecatriene, 7,11-dimethyl-3-methylene-, (Z)-1420.6 14301120710204
Germacrene D1485.4 14841186796204
Germacrene A1506.1 15081207814204
α-Muurolene1530.4149914981231775204
α-Cadinene1548.6 15371249868204
1S,cis-Calamenene1554.7 15281255898202
Germacrene B1566.8 15591267769204
Cadina-1,4-diene1563.7 15331264832204
(−)-Caryophyllene oxide1591.0157915821291803220
(+) spathulenol1620.1157615771318869220
10-epi-α-Cadinol1680.1 1372687222
trans-Z-α-Bisabolene epoxide1696.8 1387809220
Disclaimer/Publisher’s Note: The statements, opinions and data contained in all publications are solely those of the individual author(s) and contributor(s) and not of MDPI and/or the editor(s). MDPI and/or the editor(s) disclaim responsibility for any injury to people or property resulting from any ideas, methods, instructions or products referred to in the content.