Abstract
In this study, weekly grab samples extracted by solid-phase extraction (SPE) and stir bar sorptive extraction (SBSE) were compared for the analysis of 230 pesticides in surface waters. Samples were collected from three different locations around Melbourne, Australia. Analysis was performed using Gas Chromatography Quadrupole Time of Flight High Resolution Mass Spectrometry (GC-QToF-HRMS). The two extraction techniques were compared, among others, for their limits of detection, recovery, extraction, and quantification efficiency of pesticides, as well as spatial and temporal differences in detected compounds. The target compounds screened were pesticides belonging mainly to the categories of fungicides, insecticides, and herbicides. Although SBSE extracted more pesticides at two out of three sites, SPE extracted total concentrations up to four times higher than SBSE over all sampling sites. The log KOW of detected pesticides only partially explained the differences in detection, with SBSE performing better in the absorption of hydrophobic compounds. In addition, matrix effects, in particular turbidity, appeared to hinder extraction of contaminants, especially for SBSE. Spatially, SBSE detected 10 pesticides more than SPE at two locations, while the opposite was true at the third location, where turbidity was higher. The types of pesticides detected varied slightly between techniques and locations. The study highlights the complementarity of SBSE and SPE for monitoring pesticides in natural environments. SBSE is an easy-to-use technique and allows for extraction of a higher number of pesticides at trace level, but it might not be the preferred option for highly turbid waters. SPE requires more tedious and complex sample processing but allows for a more accurate quantification of a broader range of pesticides.
1. Introduction
Water pollution has been reported to have caused 1.8 million estimated deaths in 2015 [1]. These estimates are impressive as they stand, yet they do not include negative health consequences from chemical contamination, such as by pesticides, which in parallel to the harm on human health causes degradation of freshwater and marine ecosystems [2]. In situ data collection often remains limited to target screening, making it challenging to assess chemical mixtures. Wide-screening methods look at a higher number of pesticides and can therefore better address the occurrence of trace-level contamination in complex chemical mixtures [3]. The adoption of wide-screening methods for water quality testing has progressed in parallel to the development of miniaturized extraction (ME) techniques, allowing for faster, more sustainable, and easier pre-concentration procedures of a variety of organic compounds [4]. Traditionally implemented pre-concentration and extraction procedures typically require large volumes of organic solvents or samples to be able to first uptake active substances from the water samples and then to release them from the absorbent medium [5,6]. Solid-phase extraction (SPE), compared to liquid-phase extraction (LLE), provides higher extraction efficiency, good repeatability, and lower solvent usage. Disadvantages are the high cost of the cartridges and the complex and monotonous work required both during pre-processing and extraction, which requires specialized personnel [5].
Among ME methods, stir bar sorptive extraction (SBSE), developed in 1999, is one of the most widely implemented sorbent-based micro-extraction methods [5]. SBSE involves magnetic stirring of a stir bar in a water sample under controlled chemical and physical conditions [5] until adsorption equilibrium is reached. The stir bar, a small glass magnet (10 or 20 mm), is coated with an absorbent layer (0.5 or 1 mm) of polydimethylsiloxane (PDMS) or polyethylene glycol (PEG). PDMS is used for extracting hydrophobic compounds (2 < log KOW < 5) while PEG is used for polar compounds (log KOW < 2). After extraction, the stir bars are desorbed thermally at high temperatures (300 °C) by gas chromatography or injected as a solution for liquid chromatography. When coupled with gas chromatography, the direct desorption of the compounds from the stir bar coating allows for the identification and quantification of a large number of organic compounds with high precision [6,7].
SBSE has been successfully applied for the determination of organochlorine and pyrethroid pesticides in surface waters [6,8], with many studies optimizing extraction conditions, such as extraction time, sample volume, and stirring speed, for both polar and non-polar organic pollutants [9,10]. The SBSE technique has been widely praised for its cost-effectiveness, simplicity, and speed of the extraction procedure [11], partly addressing some of the drawbacks mentioned for SPE. For instance, SBSE is considered more ecologically friendly than traditional methods, as solvent use is almost absent during preparation and extraction steps. In fact, the sample preparation step only requires thermal conditioning of the stir bars, while extraction does not make any use of solvents, except in the case of internal standard solution addition. Reduced sample processing steps also lower potential analyte losses, which, contrarily, can be the case for SPE- and LLE-processed samples as they need to be filtered before extraction [5]. SBSE sensitivity also results in lower Limits of Detection (LODs) compared with traditional techniques [12]. Nonetheless, matrix effects might compromise expected recovery, while very hydrophobic compounds can absorb on the container walls. Unlike SPE, which can be applied for extraction of compounds with a wide polarity range, the type of absorbent phase on the stir bar limits its applicability to either hydrophobic or polar contaminants [13]. It is fundamental to understand the advantages and disadvantages of PDMS-coated stir bars compared with other extraction methods and sampling techniques. There have been mixed results from the few studies that have validated SBSE against LLE and SPE for organochlorines, pesticides, pharmaceuticals, and other chemicals of emerging concern (CECs). Some studies reported significant differences in recoveries and concentrations from water samples extracted by LLE, SPE, and SBSE [6,14,15], with traditional methods providing an overall better performance, and others—finding no difference in the results [4].
Considering the high number of pesticides produced and increasing volumes used globally [16,17], sensitive, faster, and easily applicable analytical techniques can improve the estimation of water contamination by chemical cocktails and their risk on the aquatic ecosystem. This study aims to deepen our understanding of the comparability of grab-sampling-based SBSE with water samples extracted using solid-phase extraction (SPE) with HLB as the sorbent. The research investigates the methodological advantages and disadvantages of SBSE and SPE for monitoring 230 pesticides in surface waters, belonging majorly to the classes of insecticides, fungicides, and herbicides. Data for the comparison and assessment were obtained during a four-week monitoring campaign at three different sampling locations around Melbourne, Australia. The comparative study touches upon numbers and concentrations of pesticides detected and the occurrence of contaminants linked to land-use. Such assessments can help define whether one methodology is better suited for use considering land-use, expected contaminants present, and human and financial resources. The novelty of the study lies in its comprehensive screening of a wide list of pesticides, its parallel comparison of the traditional SPE technique and SBSE, and in the diversity of land-use around the sampled locations.
2. Materials and Methods
2.1. Chemicals and Materials
A solution of 230 pesticides (41.7% insecticides, 24.3% fungicides, 19.6% herbicides as major categories) (Table S1, Supplementary Materials) was used to develop the screening and quantification method. The solutions were purchased as mixtures from Restek Corporation (Bellefonte, PA, USA). Of the 230 pesticides screened, a standard solution was not available for 12 compounds, namely 2,4,6-tribromoanisole, 2-chloronaphthalene, 2-phenylphenol, 4,4′-methylenebis(N,N-dimethylaniline), acetophenone, dichlorbenzamide, chlorocresol, epoxiconazole, isoxadifen, phthalimide, quinoline, resorcinol. They were excluded from quantitative analysis (indicated in italic in Table S1, Supplementary Materials). The internal standard solution consisted of trans-Nonachlor (13C10, 98%, Cambridge Isotope Laboratories Inc., Andover, MA, USA, quantifier ion: 418.8182; qualifier ion: 420.8154), diluted in acetone (1 mL), for a final concentration of 0.5 ng/L for the samples processed with SBSE and 5 ng/L for the water samples extracted with SPE. Pesticide grade methanol, ethyl acetate, and toluene were used as solvents (Merck KGaA, Darmstadt, Germany). SPE cartridges used were Oasis HLB (Waters, Milford, MA, USA). As this study was part of a larger assessment that includes a comparison with passive samplers, the HLB phase was selected due to its ability to target a wider polarity spectrum, facilitating comparison with the other sampling techniques (POCIS and Chemcatcher). While HLB cartridges in SPE have been widely used to determine polar compounds in combination with LC, studies also report their application for pesticide detection when coupled with GC [18]. The use of HLB cartridges reduces labour in the preparation steps by limiting activation processes before extraction, making the method more comparable to the SBSE protocol. Stir bars (2 mm × 0.5 mm, PDMS coating) were provided by Gerstel (Mülheim an der Ruhr, Germany).
2.2. Extraction Procedures
For the SPE method, grab water samples (1L) were extracted according to the methods outlined in [19,20,21,22]. In short, 1 mL internal standard solution (5 ng/L) was added to the grab sample before vacuum-filtering through a glass microfiber membrane (Whatman 1.2 µm, grade GF/C). The samples were then extracted onto pre-conditioned HLB cartridges (6 mL methanol followed by 6 mL Milli-Q Water) and eluted with ethyl acetate (10 mL). After elution, samples were sonicated and concentrated to 100 µL under a gentle stream of nitrogen. Finally, 2 µL was injected into the desorption tubes.
For the SBSE method, stir bars were cleaned through conditioning in glass thermodesorption tubes for 5 h at 330 °C under a nitrogen stream in a Gerstel (Mülheim an der Ruhr, Germany) tube conditioner. Thereafter, grab water samples (100 mL) were extracted onto stir bars through magnetic stirring for 5 h (rotation speed: 800 rpm). Before extraction, the water samples were spiked with 1 mL internal standard solution in acetone (0.5 ng/L). After extraction, the stir bars were kept at 4 °C in separate vials until analysis. The samples were usually extracted the day after the sampling. Linearity, recovery, reproducibility, and stability of the method were examined and reported on in [23].
2.3. Field Study
The SPE and SBSE methods were assessed for methodological advantages and disadvantages for monitoring pesticides in surface waters using environmental samples collected from three sites in Victoria, south-eastern Australia, called Site A, Site B, and Site C (Figure 1). These sites are located, respectively, near the outlet of a wastewater treatment plant in a rural residential area (Site A), in an industrial and residential neighbourhood (Site B), and a rural site where there was considerable horticulture (Site C). Grab water samples (1 L (for SPE) and 100 mL (for SBSE)) were collected weekly over a four-week period during the summer season (8 February–8 March 2023), totaling 5 sampling events at each of the three sampling sites. For SBSE, samples were collected in duplicate due to the destructive nature of the technique, which prevents repeated analysis. A total of 30 samples were extracted using SBSE, while 15 samples were extracted in total using SPE. Blank samples, consisting of spiked MilliQ water, were processed in parallel to the collected samples for SPE and SBSE with each method. Water parameters (pH, turbidity, electro conductivity, dissolved oxygen, and temperature) were measured each week during collection of the grab water samples.
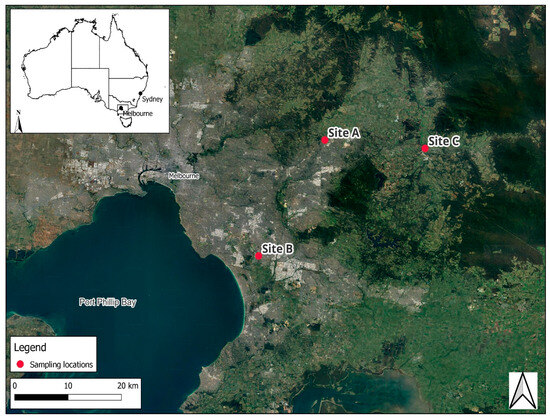
Figure 1.
Map of the sampling locations.
2.4. Sample Analysis
SBSE samples were dried under constant nitrogen flow. Thereafter, they were placed in desorption tubes for thermal desorption, while SPE-extracted samples were injected. Theoretically, SBSE extracts and desorbs the whole 100 mL sample, while through the SPE procedure, 2 µL of concentrated solution are injected, corresponding to 20 mL, one fifth of the SBSE sample volume (100 mL). The analysis was performed on a Gas Chromatograph 8890 with Quadruple Time-Of-Flight 7250 (Agilent Technology, Santa Clara, CA USA) coupled with a Multi-Purpose Sampler (MPS) connected to a Thermal Desorption Unit TDU2 and a Programmable Temperature Vaporizer (PTV) CIS-4 (Cooling Injection System) with a cryostatic cooling system CCD2 (Gerstel, Mülheim an der Ruhr, Germany). A Multi-Purpose Sampler (MPS) was used to automatically move the desorption tubes with the stir bars from the trays to the TDU. All chemicals were separated and analyzed on HP-5MS UI capillary column (length = 30 m, internal diameter = 0.25 mm, film thickness = 0.25 µm, Agilent Technology, Santa Clara, CA, USA). The injection and desorption methods are detailed in the Supplementary Materials (Table S2). Analysis method validation for SBSE is described in [21], and for SPE it followed [20]. Information on the quantitative methods used for sample analysis can be found in Supplementary Table S1. This includes the retention time and quantifier and qualifier ion masses for each compound and for internal standard (trans-Nonachlor 13C10). Quantification of samples was based on computation of calibration curves of 4 calibration levels (L1: 10 ng/L, L2: 25 ng/L, L3: 50 ng/L, L4: 100 ng/L). L1 was injectsed (SPE) or desorbed (SBSE) six times to determine the Method Detection Limit (MDL), LOD, and Limit of Quantification (LOQ), according to the methodology of the US Environmental Protection Agency [24]. Information on calibration curves, limits of detection, and average recoveries are reported in Table S3 (Supplementary Materials). SBSE was unable to extract compounds captan, terbacil, N-2,4-Dimethylphenyl)formamide, and tricyclazole (Beam). Given the target screening involves a wide range of compounds with varying characteristics, it is expected that responses will differ among the compounds, potentially affecting linearity in some cases. Acquisition data were analyzed with Quantitative Agilent Software (version 12.1).
2.5. Statistical Analysis
SBSE and SPE were compared both qualitatively and quantitatively in respect to analytical methods parameters, such as LODs and recoveries, and to the numbers and concentration of detected pesticides. For quantitative analysis, statistical paired t-test was performed with Spyder 3 scientific environment written in Python (version 2.7).
3. Results
3.1. Comparison of Pesticides Detected by SBSE and SPE
A total of 77 out of the 230 pesticides screened were detected using a combination of SPE and SBSE methods. Among these, 36 compounds were detected at least once by both methods; of those, 27 compounds were detected at least once by both methods above LOQ values, while the other 9 were detected below the LOQ but above the LOD (Figure 2).
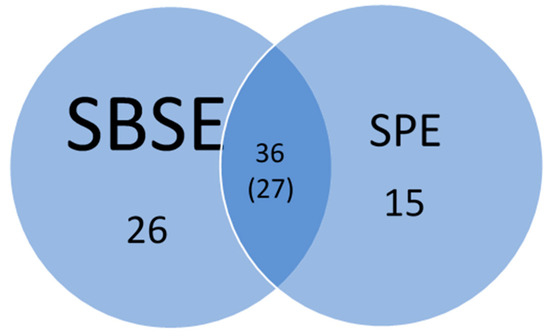
Figure 2.
Number of pesticides detected by SBSE and SPE from 5 sampling events collected from three study sites. Parenthesis 27 compounds were detected at least once by both methods above LOD values.
The detected pesticides were categorized as fungicides (33.8%), insecticides (29.9%), and herbicides (16.9%). The log KOW distribution of the detected compounds ranged between 1.6 and 6.6, with a median log KOW of 3.8. A detailed list of the compounds detection frequency by sample type with their respective log KOW values is provided in Table S4 (Supplementary Materials).
A total of 62 compounds were detected using SBSE, with log KOW values ranging from 2.2 to 6.6 (average = 4.3, median = 4.1). Among those, 26 compounds were uniquely detected by the SBSE method (Figure 2). These compounds had log KOW values in the range 2.3 to 6.6 (average = 4.5, median = 4.4). The 62 detected pesticides primarily belonged to the classes of fungicides (20), insecticides (20), and herbicides (9), with additional detections including breakdown products (5), and other classes such as metabolites, growth regulators, and synergists (Table 1). The most frequently SBSE-detected pesticides were the fungicides boscalid and folpet, the herbicides oxadiazon and simazine, the insecticide diazinon, and breakdown products 2,4′DDE, 4,4′DDE, pentachloroaniline, and anthraquinone (Table S5, Supplementary Materials).

Table 1.
Summary table of pesticides and their properties detected by SBSE and SPE.
A total of 51 compounds were detected by SPE, with log KOW values ranging from 1.6 to 6.5 (average = 3.8, median = 3.7). Fifteen compounds were uniquely detected by the SPE method (Figure 2), having log KOW ranging 1.6–4.1 (average = 3.5, median = 3.8). The 51 compounds detected primarily belonged to the classes off fungicides (18), herbicides (11), and insecticides (11), with additional detections including 3 breakdown products and metabolites, a bird repellent, and an impurity (Table 1). The most frequently detected pesticides by SPE were the fungicides azoxystrobin, DCPA, and iprodione, insecticide dieldrin, herbicides oxadiazon, simazine, terbacil, and pentachloroaniline (Table S6, Supplementary Materials).
Of the 62 pesticides detected by SBSE, 18 were detected in concentrations between the LOQ and LOD (Table S5, Supplementary Materials). In contrast, of the 51 pesticides extracted by SPE, 6 were detected at concentrations between the LOQ and LOD (Table S6, Supplementary Materials). These pesticides were considered for presence–absence analysis but were excluded when assessing concentration differences. Samples with concentrations detected between the LOQ and LOD were not considered in the calculation of average concentrations.
The LODs for SPE and SBSE significantly differed for the 27 pesticides commonly detected above LODs (p-value < 0.001). For the 27 detected pesticides, LODs with the SPE method (mean 0.8 ± 0.5 ng/L) were three times lower on average than those for SBSE (mean 2.7 ± 2.2 ng/L) (Table 1). Pesticide recoveries also significantly differed between the SBSE and SPE methods (p-value < 0.001), ranging from 97.6 to 101% for SBSE and 86–98.7% for SPE (Table 1).
In terms of precision of the two replicates, the two methods performed similarly overall, with SBSE resulting in a lower coefficient of variation (20.4%) than SPE (27.9%). Precision is relatively consistent between sites, with SPE coefficient of variation ranging from 25% to 31.4% and SBSE coefficient of variation ranging from 16.7% to 22.4%. Temporally, precision fluctuates between weeks. Noteworthy are the SPE coefficient of variation above 50% recorded at week 4 at all sites and the SBSE coefficient of variation below 1% recorded at weeks 3 and 4 at Site A and 3 at Site B.
3.2. Spatial and Temporal Comparison of SBSE and SPE Performance
Spatial comparison of the performance of the two sample methods, based on pesticide detections, is shown in Table 2 and Figure 3. More pesticides were detected using the SBSE method at Sites A and B, and the SPE method detected a greater number of pesticides at Site C (Figure 3). The numbers detected were similar between the two methods at Site A (SBSE 49, SPE 41) and Site C (SBSE 31, SPE 39), but 22 more pesticides were detected at Site B using SBSE compared to using SPE (Figure 3).
Table 2.
Summary of comparison of SBSE and SPE performance at different sampling locations.
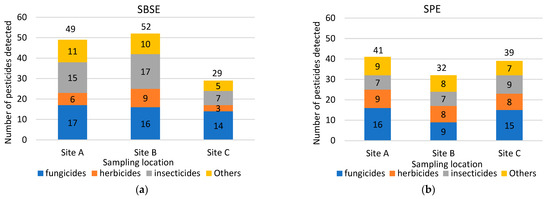
Figure 3.
Categories and numbers of pesticides extracted by SBSE (a) and by SPE (b) by sampling location.
Figure 3 also shows that there were differences in the types of pesticides detected by each method. Fungicides, insecticides, and herbicides were generally the top 3 most frequently detected groups, but which type dominated differed by sampler type and site. Fungicides were generally detected similarly using both techniques across all sample sites (around 15), except for Site B, where higher pesticides frequency was recorded through SBSE (16 versus 9 fungicides detected). Herbicides were also generally detected similarly using SBSE and SPE across all sample sites (around 8), except at Site C, where SPE extracted eight herbicides, as opposed to three extracted by SBSE. Insecticides were detected more frequently by SBSE at Site A (15) and Site B (17), while detection at Site C was similar to detection by SPE at all sites (around 8).
Total concentrations range and average are reported for both methods at the different sample sites in Table 2. SPE average total concentrations are between 2 and 4 times higher than SBSE-extracted total concentrations, and this is consistent through all sites. With both methods, Site C is the location where lowest concentrations are reported, while Site B reports highest concentrations, using both extraction techniques. The number of compounds detected at concentrations higher than 10 ng/L is comparable between the two methods at Site B, while at the other two sampling locations, SPE extracted 5–6 more compounds with concentrations higher than 10 ng/L. (Table 2). The number of pesticides detected in concentrations higher than 50 ng/L differ depending on methods and sites. At Site C, for instance, only one compound was detected at such concentration by SBSE, while eight were quantified above 50 ng/L using SPE. Concentrations obtained by each method averaged over the five sampling events for commonly detected compounds were compared using a t-test for each sampling location. No statistical difference (p < 0.05) was recorded among concentrations extracted by the two methods at the sampling locations (Table S7, Supplementary Materials). Indeed, concentrations of commonly detected compounds were comparable at Site C, while the largest differences in concentration were detected for iprodione, myclobutanil, and thiabendazole at Site A, for which SPE extracted around six times the concentration extracted by SBSE. At Site B, only one compound was extracted at concentration more than six times higher by SPE than by SBSE (Table S7, Supplementary Materials). When looking at individual compounds extracted at highest concentrations and frequencies over the five sampling events, they differed depending on sampling location and method used. Frequently detected compounds were tebuconazole and fipronil at Site A, fipronil at Site B, and fluopyram and mycobutanil at Site C.
Temporally, the number of pesticides detected by each method varied (Table 2). SBSE detected a greater number of pesticides each week, compared to SPE across all sites, median pesticide numbers detected weekly using SBSE being 43, 44, and 19 for Site A, Site B, and Site C, respectively, and 30, 22, and 13, respectively, for SPE (Table 2). In weekly sampling, the range in number of compounds detected showed less variation with SPE than with SBSE at Site A and Site B. However, at Site C, the opposite was true, although fewer compounds were found overall by SBSE. Regarding the frequency of individual compounds, SBSE consistently detected more compounds throughout all weekly samples than SPE at Site A (SBSE: 65.3% and SPE: 51.1%). Conversely, at Site B, SPE detected more compounds consistently (SBSE: 63.4% and SPE: 75%) likely due to the wetland’s relatively static nature, where both methods detected the majority of compounds in all samples. In Site C’s samples, there was high variability in the number of compounds detected weekly, with less than half of the compounds detected consistently over the five sampling events by either extraction method.
Total concentrations were always higher with SPE than with SBSE if analyzed temporally per sampling week. The highest total concentrations were recorded for SBSE at the last sampling event (week 4), while the lowest total concentration was recorded either at week 1 (Site A) or week 2 (Site B, Site C) sampling event. With SPE, the highest total concentrations were also recorded at week 4 for Site C and Site B samples, while at Site A, it was recorded week 0. The general patterns of SBSE-extracted concentrations were decreasing during first 2 weeks and increasing again up to week 4, while for SPE total concentrations fluctuate more and patterns depend on sampling locations.
3.3. SBSE and SPE Performance on a Subset of Commonly Extracted Compounds
Acknowledging the limitation of a comparison based on average concentrations; to further understand the behaviour of the two different extraction techniques, a smaller subset of six compounds was selected for comparisons of concentrations and trends over the 4 sampling weeks. The comparison has been limited to compounds extracted by both methods at concentrations higher than 10 ng/L and were present in at least one-third of samples for both methods. The selected compounds are the bird repellent anthraquinone, insecticide fipronil, herbicide oxadiazon, and the fungicides fluopyram, iprodione, and tebuconazole. They have an average log KOW of 4, ranging from 3.0 (iprodione) to 5.3 (oxadiazon). Table 3 reports concentrations found per these selected compounds in the sampling spot.
Table 3.
Spatial and temporal comparison of the concentrations of 6 selected pesticides detected by SBSE and SPE.
Frequency of detection was similar between the two techniques and consistent temporally for compounds anthraquinone, fipronil, and tebuconazole, detected at Site A and Site B, and for fluopyram detected at Site C. Iprodione and oxadiazon were detected at similar frequencies by SBSE and SPE but were sporadically detected during the weekly samples at the three sites. All selected measured compounds are extracted in average 1.7 (fipronil) to 3.3 (fluopyram) times in higher concentrations by SPE than SBSE. The concentration extracted by SPE and SBSE for the six selected compounds were found to be significantly different (p-value < 0.001), as determined by a paired t-test. A moderate linear relationship was found between concentrations extracted by SBSE versus SPE when calculated in average (regression line equation: y = 0.3x + 12.4, R2 = 0.63).
Additional observations can be made when considering linearity of single compounds. Only fipronil (Figure 4), the compound for which the SPE–SBSE concentration ratio is the smallest, showed linearity between measurements (R2 = 0.83). Tebuconazole presents a flat trend, indicating that an increase in concentration extracted by SPE did not correspond to any change in concentration extracted by SBSE. Anthraquinone (y = 0.3034x + 7.0177) and iprodione (y = 0.1919x + 24.301) show positive slope trends, indicating that a potential increase in concentration measured by SBSE corresponds to a non-linear increase by SPE. The opposite seems to be the case for oxadiazon (y = −0.1503x + 18.592) and fluopyram (y = −0.0664x + 18.068) for which a negative slope implies that a decrease in concentration extracted by SBSE corresponds to an increase by SPE. Oxadiazon (log KOW = 5.3) and fluopyram (log KOW = 4.8) have higher log Kow than the average for the selected compounds and, therefore, theoretically exhibit a stronger affinity for the PDMS stir bar adsorbing phase, which is expected to result in higher recovery.
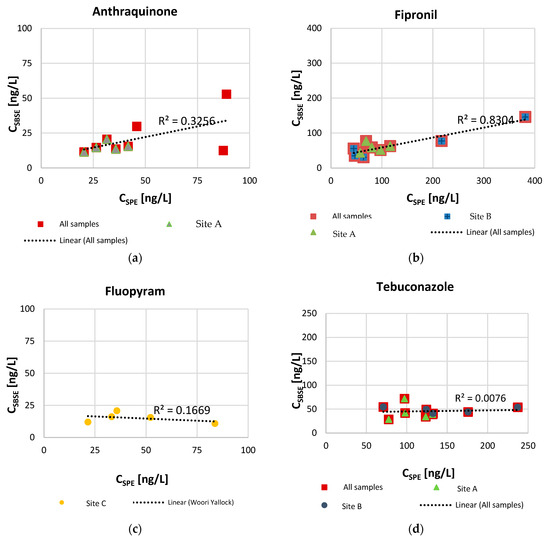
Figure 4.
Relationship between SBSE and SPE measured concentrations [ng/L] for selected compounds anthraquinone (a), fipronil (b), fluopyram (c), and tebuconazole (d).
4. Discussion
The study evaluated the outcomes of monitoring for pesticides in the natural environment using two different extraction techniques. It is important to note that although samples were taken at the same sampling locations at 5 min intervals, they represent two different instantaneous snapshots of water quality, which is a recognized limitation of the comparison. Few studies in the literature compare SBSE to other extraction methods, and researchers have compared SBSE to Liquid–Liquid Extraction (LLE) for extraction of organochlorine pesticides (OCPs) finding both comparable [4] and significantly different results [6]. SBSE detected more pesticides in total than SPE, including at a trace level. Different parameters might have impacted final concentrations extracted by the two methods. The log KOW of detected pesticides partially explains why some were not detected by the SBSE method but were by SPE, applicable to a wider range of compound polarities. While the upper log KOW (SBSE: 6.6, SPE: 6.5) of detected compounds is similar for both methods, the log Kow first quartile lies at 3.4 for SBSE and at 2.9 for SPE. For instance, SPE only extracted simazine at high concentrations at all sites. The compound has a log Kow (2.2) below the level of hydrophobicity reported for efficient extraction with PDMS [25]. The authors of [7] report theoretical recovery of 100 mL sample with SBSE for five organic pollutants ranging from 1.5 log KOW (dichlorvos) to 6 log KOW (benzo(a)pyrene). SBSE recovery jumps from 34% for atrazine (log KOW = 2.6) to 72% for naphthalene (log KOW = 3.3) and keeps increasing up to 100% recovery for benzo(a)pyrene (log KOW = 6) [7]. Ref. [23] found that hydrophobic PAHs (log Kow > 5), with comparable LOD, showed improved recoveries when using SBSE compared to SPE.
Spatially, at two of the three locations, Site B and Site A, SBSE extracted 10 and 20 more pesticides, respectively, whereas at Site C, SPE extracted 10 more pesticides than SBSE. The types of pesticides detected varied slightly depending on the two techniques and the sampling locations but are rather consistent temporally. Indeed, differences in number and pesticides detected by the two techniques might be due to other factors, for instance, matrix effects that could play a role in extraction efficiency. Matrix effects have been reported as a disadvantage of miniaturized extraction techniques, where the presence of organic molecules and suspended solids can hinder absorption of pesticides on the absorbing layer [5,14]. Comparing SBSE with LLE for wastewater samples Ref. [26] found that SBSE extracted fewer pesticides in influent samples than LLE, probably due to matrix effect, while it was more sensitive for detection of trace compounds in effluent samples. Indeed, at Site C, the reduced performance of SBSE in terms of number of detected pesticides and concentrations could potentially be linked to higher turbidity, measured in Nephelometric Turbidity Unit (NTU), compared to the other three sites (Site C: 11.7 NTU, Site B: 6.1 NTU, Site A: 2.1 NTU). Therefore, it appears that matrix effects might be playing a role in extraction efficiency by the two methods, rather than type of pesticides and consequently land-use. Nonetheless, to confirm this, further research should be conducted, given the limited scale of this monitoring exercise.
SPE extracted total concentrations were in average up to four times those by SBSE, and this is consistent both spatially and temporally, considering all pesticides detected. For the 27 commonly detected compounds, statistical comparison revealed no significant differences (p < 0.05) if averaged over the sampling weeks. However, notable exceptions were observed for specific compounds at each location, with SPE generally extracting higher concentrations than SBSE. This observation challenges expected extraction, if initial volumes injected are considered. Looking at spatial distribution, the highest concentrations for both extraction methods were recorded in samples from Site B, where occurrence of pesticides was also the most consistent throughout the four sampling weeks. This is understandable considering the stagnant nature of the wetland and its location in an industrial urban residential area. Site C is generally the site with lowest extracted amounts (and measured pesticides). At the site, fungicides fluopyram and myclobutanil appear at high concentrations, according to extraction by both methods. Prevalence of fungicides might be explained with the agricultural land-use surrounding the area. The lowest concentrations recorded by SBSE for fluopyram and oxadiazon at Site C is interesting given their high log KOW, which would indicate increased affinity with the PDMS phase. It is likely that high turbidity at the site might explain the tendency of hydrophobic compounds to absorb to suspended solids, as previously mentioned. Such a matrix effect might play a lesser role in absorption efficacy for SPE, as elution might still capture fractions of compounds absorbed unto them. This remains a speculation, as the few sampling sites and compounds compared limit the observation but is an interesting starting point for future research, which could investigate the effects of turbidity on SBSE. Alternative factors that could contribute to lower SBSE-extracted concentrations, as seen in the correlations between SPE and SBSE concentrations (Figure 4), could be linked to reaching of a saturation point and consequent desorption from the PDMS coating, in case of faster reached equilibrium, especially when their concentrations are high. Losses of hydrophobic analytes on the glass wall have also been reported as causing reduced recovery, while the optimization of SBSE parameters, such as extraction time and volume, do not seem to have a significant effect on recovery of chemicals, as for studies conducted on laboratory spiked samples [4]. The small number of compounds compared, based on frequency of detection and concentrations, and the restricted range at which concentrations are detected make such a comparison limited. In terms of precision of the two methods, they performed similarly overall, with coefficients of variations in range 16.7% to 31.4%. SBSE had, in general, lower coefficient of variation than SPE. While precision does not fluctuate much between sites, it does vary depending on the sampling week. Overall, the techniques appear to be comparable in terms of precision, although this is limited by the numbers of compounds detected.
In terms of methodology, SBSE is an easy to apply, fast and uses only limited amounts of solvents. It is suited for non-specialized personnel and has been successfully applied in citizen engagement activities [27,28]. The reduced manipulation of the samples gives less room for human error, although the passive nature of SBSE can lead to contamination from the surrounding environment. Furthermore, SBSE uses a limited sample volume while still achieving low detection limits. SPE, on the contrary, requires a more complex sample processing protocol, including filtering the samples, during which analyte losses might occur. It requires specialized personnel and use of solvents. Based on the performance of SBSE and SPE observed in this study, the two techniques are rather complementary. SBSE extracts more pesticides at trace level but might not be suitable for turbid waters and appears to be underestimating real concentrations of pesticides in the samples; SPE performs better in terms of quantification of pesticides of a broader polarity range. This is in line with a previous research that compared SBSE with LLE [14]. The limited number of studies comparing SBSE with traditional extraction techniques, in particular SPE, applied on field samples leaves space for further investigation. In particular, more investigation on the factors affecting stir bar saturation and calibrations between the two techniques could help better estimate real environmental concentrations when only using SBSE.
5. Conclusions
The novelty of the study presented lies in the extensive comparison carried out between grab-water samples from natural waterbodies extracted by SBSE and SPE. The comparison focused on the compounds screened and their concentration to assess whether one or the other method might be more suitable given the circumstances. The results indicate that SBSE performs better in terms of the number of pesticides detected, even in traces, while SPE extracts higher concentrations overall. Although SBSE performed better in the extraction of fungicides and insecticides, and SPE in the extraction of herbicides, the limited scale of the study does not allow inferring whether one method might be more appropriate depending on sample sites and type of pesticides. SBSE is suitable for hydrophobic compounds (log KOW > 3), while SPE can screen for a wider range of pesticides polarities; nonetheless, the partition coefficient alone cannot explain the differences in pesticides detected, for which other factors are at play. Matrix effects, such as the presence of suspended solids, seem to disfavour SBSE and hinder its absorption capacity; while saturation might lead to variable results and an underestimation of the actual concentration through desorption mechanisms. More in-depth studies would be needed to investigate the effect of turbidity and equilibrium parameters on absorption characteristics of SBSE as opposed to SPE. Finally, underestimation of the concentrations by SBSE can lead to underestimation of toxicity; therefore, when implementing the extraction techniques, researchers should be aware of its limitations. Increasing the amount of the absorbent phase and potentially using or complementing it with absorbents that cover a wider polarity range could be possible solutions to overcome SBSE’s limitations. SBSE remains easier to implement due to reduced laboratory procedures, limited solvent use, and smaller sample volume (100 mL vs. 1 L). However, it is a destructive technique, as it desorbs the entire sample in one analysis. Both extraction techniques can suffer from analyte losses due to absorption on glass walls, suspended solids, or, in the case of SPE, during sample pre-processing step.
Ultimately, the choice between the two extraction techniques should be driven by the characteristics of the water sources, screened pesticides, and advantages or disadvantages related to analytical processing, human resources, and financial considerations. Finally, both techniques are limited to grab-sampling, providing only an instantaneous snapshot of water quality. Therefore, comparison or integration with other sampling techniques, such as passive samplers, should be further investigated.
Supplementary Materials
The following supporting information can be downloaded at: https://www.mdpi.com/article/10.3390/separations12060158/s1, Table S1. List of screened pesticides, their main and sub categories, retention times (RT), and quantifier and qualifier ions, used for compounds identification; Table S2: Instrumental conditions of the GC-QToF-HRMS acquisition methods by desorption and injection; Table S3: Calibration curve parameters (Formula and R2), Limit of Detection (LOD), Limit of Quantification (LOQ), Method detection limits (MDL), and recoveries determined for each compound using SBSE and SPE methods applied in the study; Table S4: List of detected compounds, pesticide category, Log KOW and detection frequency by extraction method; Table S5: SBSE detected compounds and calculated concentrations; Table S6: Concentrations and detection frequencies for compounds detected using SPE at the three study sites over the 4 weeks of sampling; Table S7: Frequency and concentrations [ng/L] of compounds extracted by both methods averaged over 5 sampling events for each sampling locations.
Author Contributions
Conceptualization and supervision: V.P., J.M., G.M. and B.M.G.; methodology: J.M., G.M. and C.C.; data acquisition, analysis, and interpretation: C.C., J.M. and V.P.; original drafting: C.C.; revision: C.C., G.M., B.M.G., H.V., J.M. and V.P.; approval for publication of content: V.P. All authors have read and agreed to the published version of the manuscript.
Funding
This research received no external funding.
Data Availability Statement
The data presented in this study are available on request from the corresponding author.
Acknowledgments
We thank Daniel MacMahon for designing the map of the sampling locations and Rebecca Reid for her technical support in the laboratory.
Conflicts of Interest
The authors declare no conflicts of interest.
References
- Landrigan, P.J.; Fuller, R.; Acosta, N.J.R.; Adeyi, O.; Arnold, R.; Basu, N.; Baldé, A.B.; Bertollini, R.; Bose-O’Reilly, S.; Boufford, J.I.; et al. The Lancet Commission on pollution and health. Lancet 2018, 391, 462–512. [Google Scholar] [CrossRef] [PubMed]
- FAO. Water Quality in Agriculture: Risks and Risk Mitigation; FAO &IWMI: Rome, Italy, 2023. [Google Scholar] [CrossRef]
- Gago-Ferrero, P.; Bletsou, A.A.; Damalas, D.E.; Aalizadeh, R.; Alygizakis, N.A.; Singer, H.P.; Hollender, J.; Thomaidis, N.S. Wide-scope target screening of >2000 emerging contaminants in wastewater samples with UPLC-Q-ToF-HRMS/MS and smart evaluation of its performance through the validation of 195 selected representative analytes. J. Hazard. Mater. 2020, 387, 121712. [Google Scholar] [CrossRef] [PubMed]
- Sargazi, M.; Bücking, M.; Kaykhaii, M. Development of a solventless stir bar sorptive extraction/thermal desorption large volume injection capillary gas chromatographic-mass spectrometric method for ultra-trace determination of pyrethroids pesticides in river and tap water samples. Open Chem. 2020, 18, 1339–1348. [Google Scholar] [CrossRef]
- Campanale, C.; Massarelli, C.; Losacco, D.; Bisaccia, D.; Triozzi, M.; Uricchio, V.F. The monitoring of pesticides in water matrices and the analytical criticalities: A review. TrAC Trends Anal. Chem. 2021, 144, 116423. [Google Scholar] [CrossRef]
- Ochiai, N.; Ieda, T.; Sasamoto, K.; Takazawa, Y.; Hashimoto, S.; Fushimi, A.; Tanabe, K. Stir bar sorptive extraction and comprehensive two-dimensional gas chromatography coupled to high-resolution time-of-flight mass spectrometry for ultra-trace analysis of organochlorine pesticides in river water. J. Chromatogr. A 2011, 1218, 6851–6860. [Google Scholar] [CrossRef]
- David, F.; Ochiai, N.; Sandra, P. Two decades of stir bar sorptive extraction: A retrospective and future outlook. TrAC Trends Anal. Chem. 2019, 112, 102–111. [Google Scholar] [CrossRef]
- Serôdio, P.; Nogueira, J.M.F. Development of a stir-bar-sorptive extraction–liquid desorption–large-volume injection capillary gas chromatographic–mass spectrometric method for pyrethroid pesticides in water samples. Anal. Bioanal. Chem. 2005, 382, 1141–1151. [Google Scholar] [CrossRef]
- Aparicio, I.; Martín, J.; Santos, J.L.; Malvar, J.L.; Alonso, E. Stir bar sorptive extraction and liquid chromatography—Tandem mass spectrometry determination of polar and non-polar emerging and priority pollutants in environmental waters. J. Chromatogr. A 2017, 1500, 43–52. [Google Scholar] [CrossRef]
- Giordano, A.; Fernández-Franzón, M.; Ruiz, M.J.; Font, G.; Picó, Y. Pesticide residue determination in surface waters by stir bar sorptive extraction and liquid chromatography/tandem mass spectrometry. Anal. Bioanal. Chem. 2009, 393, 1733–1743. [Google Scholar] [CrossRef]
- Prieto, A.; Basauri, O.; Rodil, R.; Usobiaga, A.; Fernández, L.A.; Etxebarria, N.; Zuloaga, O. Stir-bar sorptive extraction: A view on method optimisation, novel applications, limitations and potential solutions. J. Chromatogr. A 2010, 1217, 2642–2666. [Google Scholar] [CrossRef]
- Nasiri, M.; Ahmadzadeh, H.; Amiri, A. Sample preparation and extraction methods for pesticides in aquatic environments: A review. TrAC Trends Anal. Chem. 2020, 123, 115772. [Google Scholar] [CrossRef]
- Posada-Ureta, O.; Olivares, M.; Delgado, A.; Prieto, A.; Vallejo, A.; Irazola, M.; Paschke, A.; Etxebarria, N. Applicability of polydimethylsiloxane (PDMS) and polyethersulfone (PES) as passive samplers of more hydrophobic organic compounds in intertidal estuarine environments. Sci. Total Environ. 2016, 578, 392–398. [Google Scholar] [CrossRef] [PubMed]
- Murrell, K.A.; Dorman, F.L. A suspect screening analysis for contaminants of emerging concern in municipal wastewater and surface water using liquid–liquid extraction and stir bar sorptive extraction. Anal. Methods 2020, 12, 4487–4495. [Google Scholar] [CrossRef] [PubMed]
- Suazo, F.; Vasquez, J.; Retamal, M.; Ascar, L.; Giordano, A. Pharmaceutical Compounds Determination in Water Samples: Comparison between Solid Phase Extraction and Stir Bar Sorptive Extraction. J. Chil. Chem. Soc. 2017, 62, 3597–3601. [Google Scholar] [CrossRef][Green Version]
- FAO. Pesticides Use, Pesticides TRADE and pesticides Indicators—Global, Regional and Country Trends, 1990–2020; FAO: Rome, Italy, 2022. [Google Scholar] [CrossRef]
- Sharma, A.; Shukla, A.; Attri, K.; Kumar, M.; Kumar, P.; Suttee, A.; Singh, G.; Barnwal, R.P.; Singla, N. Global trends in pesticides: A looming threat and viable alternatives. Ecotoxicol. Environ. Saf. 2020, 201, 110812. [Google Scholar] [CrossRef]
- Badawy, M.E.I.; El-Nouby, M.A.M.; Kimani, P.K.; Lim, L.W.; Rabea, E.I. A review of the modern principles and applications of solid-phase extraction techniques in chromatographic analysis. Anal. Sci. 2022, 38, 1457–1487. [Google Scholar] [CrossRef]
- Zhu, F.; Yao, Z.; Ji, W.; Liu, D.; Zhang, H.; Li, A.; Huo, Z.; Zhou, Q. An efficient resin for solid-phase extraction and determination by UPLCMS/MS of 44 pharmaceutical personal care products in environmental waters. Front. Environ. Sci. Eng. 2020, 14, 51. [Google Scholar] [CrossRef]
- Li, Y.; Gan, Z.; Liu, Y.; Chen, S.; Su, S.; Ding, S.; Tran, N.H.; Chen, X.; Long, Z. Determination of 19 anthelmintics in environmental water and sediment using an optimized PLE and SPE method coupled with UHPLC-MS/MS. Sci. Total Environ. 2020, 719, 137516. [Google Scholar] [CrossRef]
- Gopal, C.M.; Bhat, K.; Praveenkumarreddy, Y.; Shailesh; Kumar, V.; Basu, H.; Joshua, D.I.; Singhal, R.K.; Balakrishna, K. Evaluation of selected pharmaceuticals and personal care products in water matrix using ion trap mass spectrometry: A simple weighted calibration curve approach. J. Pharm. Biomed. Anal. 2020, 185, 113214. [Google Scholar] [CrossRef]
- Moschet, C.; Lew, B.M.; Hasenbein, S.; Anumol, T.; Young, T.M. LC- and GC-QTOF-MS as Complementary Tools for a Comprehensive Micropollutant Analysis in Aquatic Systems. Environ. Sci. Technol. 2017, 51, 1553–1561. [Google Scholar] [CrossRef]
- Cacciatori, C.; Mariani, G.; Tavazzi, S.; Comero, S.; Gawlik, B.M. A Powerful Tool for the Wide-Screening of Organic Contaminants in Citizen Science Initiatives: Development and Validation of a SBSE GC-QToF-HRMS Method; Publications Office of the European Union: Luxembourg, 2025. [Google Scholar] [CrossRef]
- EPA. Definition and Procedure for the Determination of the Method Detection Limit, Revision 2; Office of Water, United States Environmental Protection Agency (EPA): Washington, DC, USA, 2016. Available online: www.epa.gov (accessed on 17 December 2024).
- Ochiai, N.; Sasamoto, K.; David, F.; Sandra, P. Recent Developments of Stir Bar Sorptive Extraction for Food Applications: Extension to Polar Solutes. J. Agric. Food Chem. 2018, 66, 7249–7255. [Google Scholar] [CrossRef] [PubMed]
- Brigitte Niehus, G.P.; Popp, P.; Bauer, C.; Zwanziger, H.W. Comparison of Stir Bar Sorptive Extraction and Solid Phase Extraction as Enrichment Techniques in Combination with Column Liquid Chromatography for the Determination of Polycyclic Aromatic Hydrocarbons in Water Samples. Int. J. Environ. Anal. Chem. 2002, 82, 669–676. [Google Scholar] [CrossRef]
- Cacciatori, C.; Mariani, G.; Comero, S.; Marin, D.; Cabrera, M.; Bon-Tavarnese, J.; Gaggstatter, J.; Myers, J.; Pettigrove, V.; Gawlik, B.M. Stir bar sorptive extraction TDU-GC-QToF-HRMS for screening 230 pesticides in waters surrounding banana plantations in Costa Rica through community engagement. Chemosphere 2025, 376, 144251. [Google Scholar] [CrossRef] [PubMed]
- Cacciatori, C.; Mariani, G.; Comero, S.; Marin, D.; Cabrera, M.; Bon-Tavarnese, J.; Gaggstatter, J.; Tavazzi, S.; Maffettone, R.; Myers, J.; et al. “The Gems of Water”: A co-created scientist-citizen approach for water quality monitoring. Front. Water 2024, 6, 1358959. [Google Scholar] [CrossRef]


Disclaimer/Publisher’s Note: The statements, opinions and data contained in all publications are solely those of the individual author(s) and contributor(s) and not of MDPI and/or the editor(s). MDPI and/or the editor(s) disclaim responsibility for any injury to people or property resulting from any ideas, methods, instructions or products referred to in the content. |
© 2025 by the authors. Licensee MDPI, Basel, Switzerland. This article is an open access article distributed under the terms and conditions of the Creative Commons Attribution (CC BY) license (https://creativecommons.org/licenses/by/4.0/).