Article

Effect of Vortex Finder Wall Thickness on Internal Flow Field and Classification Performance in a Hydrocyclone

1
Shandong Gold Mining Technology Co., Ltd. Filling Engineering Laboratory Branch, Yantai 266700, China
2
Institute of Intelligent Manufacturing and Smart Transportation, Suzhou City University, Suzhou 215100, China
3
School of Mechanical and Vehicle Engineering, Linyi University, Linyi 276000, China
*
Author to whom correspondence should be addressed.
Separations 2025, 12(6), 149; https://doi.org/10.3390/separations12060149
Submission received: 14 April 2025 / Revised: 21 May 2025 / Accepted: 28 May 2025 / Published: 3 June 2025
(This article belongs to the Topic Advances in Separation Engineering)

Abstract

The hydrocyclone generally exhibits limited separation efficiency and classification sharpness. As the discharge channel for fine particles, the vortex finder plays a critical role in influencing the classification performance through its structural parameters. However, the influence of vortex finder wall thickness on fly ash classification within the hydrocyclone has not yet been reported. In this study, computational fluid dynamics (CFDs) were employed to investigate the variations in pressure field, velocity field, and separation efficiency with respect to changes in vortex finder wall thickness. The results indicate that the radial velocity increases with vortex finder wall thickness, which facilitates the rapid formation of a particle-size stratification, thereby reducing the number of misclassified particles. The cut size initially decreases and then increases as the wall thickness of the vortex finder increases. A minimum cut size of 17.2 µm was observed when the wall thickness reached 10 mm. The classification sharpness improves progressively with increasing wall thickness. At a wall thickness of 15 mm, the steepness index reaches 0.68. Experimental results demonstrate that a thick-walled vortex finder structure can significantly enhance the classification sharpness of the hydrocyclone. Specifically, the content of −19 µm particles in the underflow decreased by 32.17% when the vortex finder wall thickness increased from 5 mm to 15 mm. Meanwhile, the proportion of −19 µm particles in the overflow increased by 12.72%. Therefore, employing a thick-walled vortex finder structure can not only enhance the cut size precision but also effectively improve the classification performance of the hydrocyclone.

1. Introduction

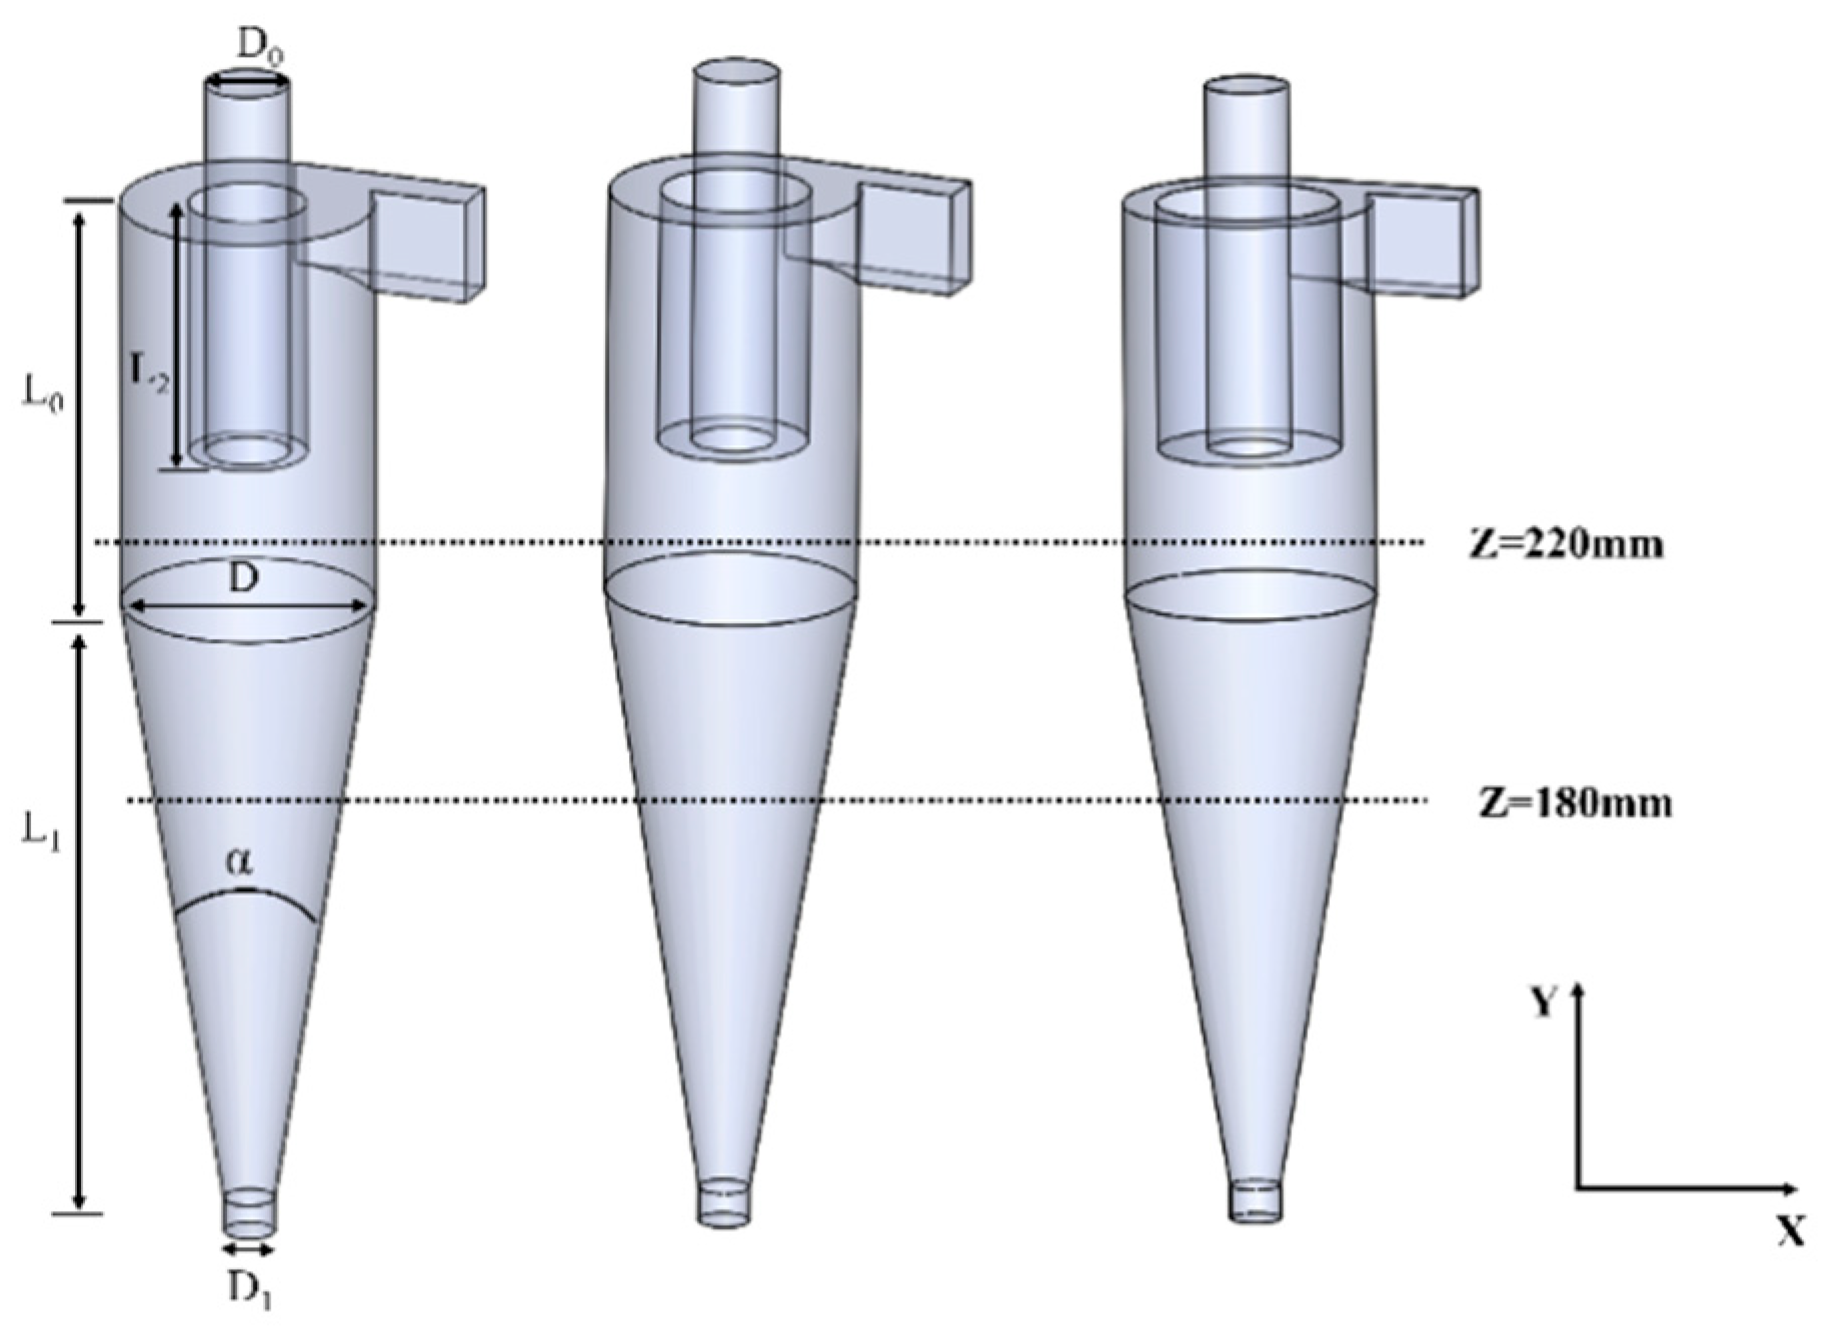
Hydrocyclones have been widely applied in industries such as petroleum and chemical engineering due to their structural simplicity, small footprint, and absence of moving parts. A typical hydrocyclone consists of five major components: inlet section, cylindrical section, conical section, vortex finder, and spigot [1,2,3]. When multiphase flow enters the hydrocyclone under the high pressure induced by a plunger pump, particle classification occurs under the combined action of centrifugal force, pressure gradient force, and other classification forces. The classification process can be described as follows: coarse particles migrate toward the wall under centrifugal force and are discharged through the spigot, achieving axial settling; meanwhile, fine particles migrate toward the center under the pressure gradient and are discharged through the overflow outlet, completing radial settling under the guidance of the vortex finder. The ideal classification scenario involves all coarse particles exiting through the spigot and all fine particles being collected at the overflow outlet. However, due to inherent structural limitations and the influence of intense turbulent fluctuations, the internal flow field of the hydrocyclone becomes highly complex. Phenomena such as short-circuit flow, circulating flow, and secondary flow coexist, leading to particle trajectory deviations and a significant degree of particle misplacement—one of the main reasons for the low classification sharpness of hydrocyclones. As the discharge channel for fine particles, the vortex finder plays a crucial role in determining the classification performance. Therefore, rational design of the vortex finder geometry is considered one of the key strategies to enhance hydrocyclone classification efficiency [4,5].
The cylindrical section of the hydrocyclone, functioning as a pre-separation zone, plays a decisive role in energy distribution and the development and stabilization of the internal flow field. The vortex finder serves as the fine-particle outlet and exerts a significant influence on the hydrocyclone separation performance; accordingly, it has been extensively investigated by numerous researchers. Cui [6] used CFD to investigate the interaction between feed size distribution and vortex finder diameter on hydrocyclone separation performance. It was demonstrated that, when the vortex finder diameter falls within an optimal range, the hydrocyclone can self-adjust its zero-axial-velocity envelope surface and particle equilibrium radius to accommodate varying feed size distributions; however, the optimal diameter was not determined in that study. Ghodrat [7] employed numerical analysis to assess the effects of vortex finder diameter, length, and geometry on separation performance. It was found that, by varying diameter or geometry, a compromise optimum can be identified that minimizes inlet pressure drop; moreover, the influence of vortex finder length on separation efficiency was shown to be far less significant than that of diameter and shape. Arman Raoufi [8] used CFD to predict and evaluate the impact of vortex finder shape and diameter on hydrocyclone performance and internal flow. The results show that increasing the vortex finder diameter reduces the tangential velocity in the hydrocyclone’s internal region, which in turn leads to lower separation efficiency in hydrocyclones equipped with larger vortex finders. Among the structural parameters, the wall thickness of the vortex finder directly determines the space available for flow development in the cylindrical section, thereby exerting a significant influence on the classification performance of the hydrocyclone [9,10,11]. Meanwhile, an increased wall thickness of the vortex finder prolongs the trajectory of the short-circuit flow, allowing more particles to re-enter the separation zone, which is beneficial for improving classification efficiency. However, few studies have focused on the effects of vortex finder wall thickness on the internal flow field and classification characteristics. This study, based on fluid dynamics theory, applies the Reynolds Stress Model (RSM) to predict variations in the turbulent field within the hydrocyclone. The Mixture model is employed to capture the behavioral patterns of the particle phase [12,13]. The numerical results are validated through comparison with Hsieh’s [14] classical experimental data, confirming the accuracy of the simulation [
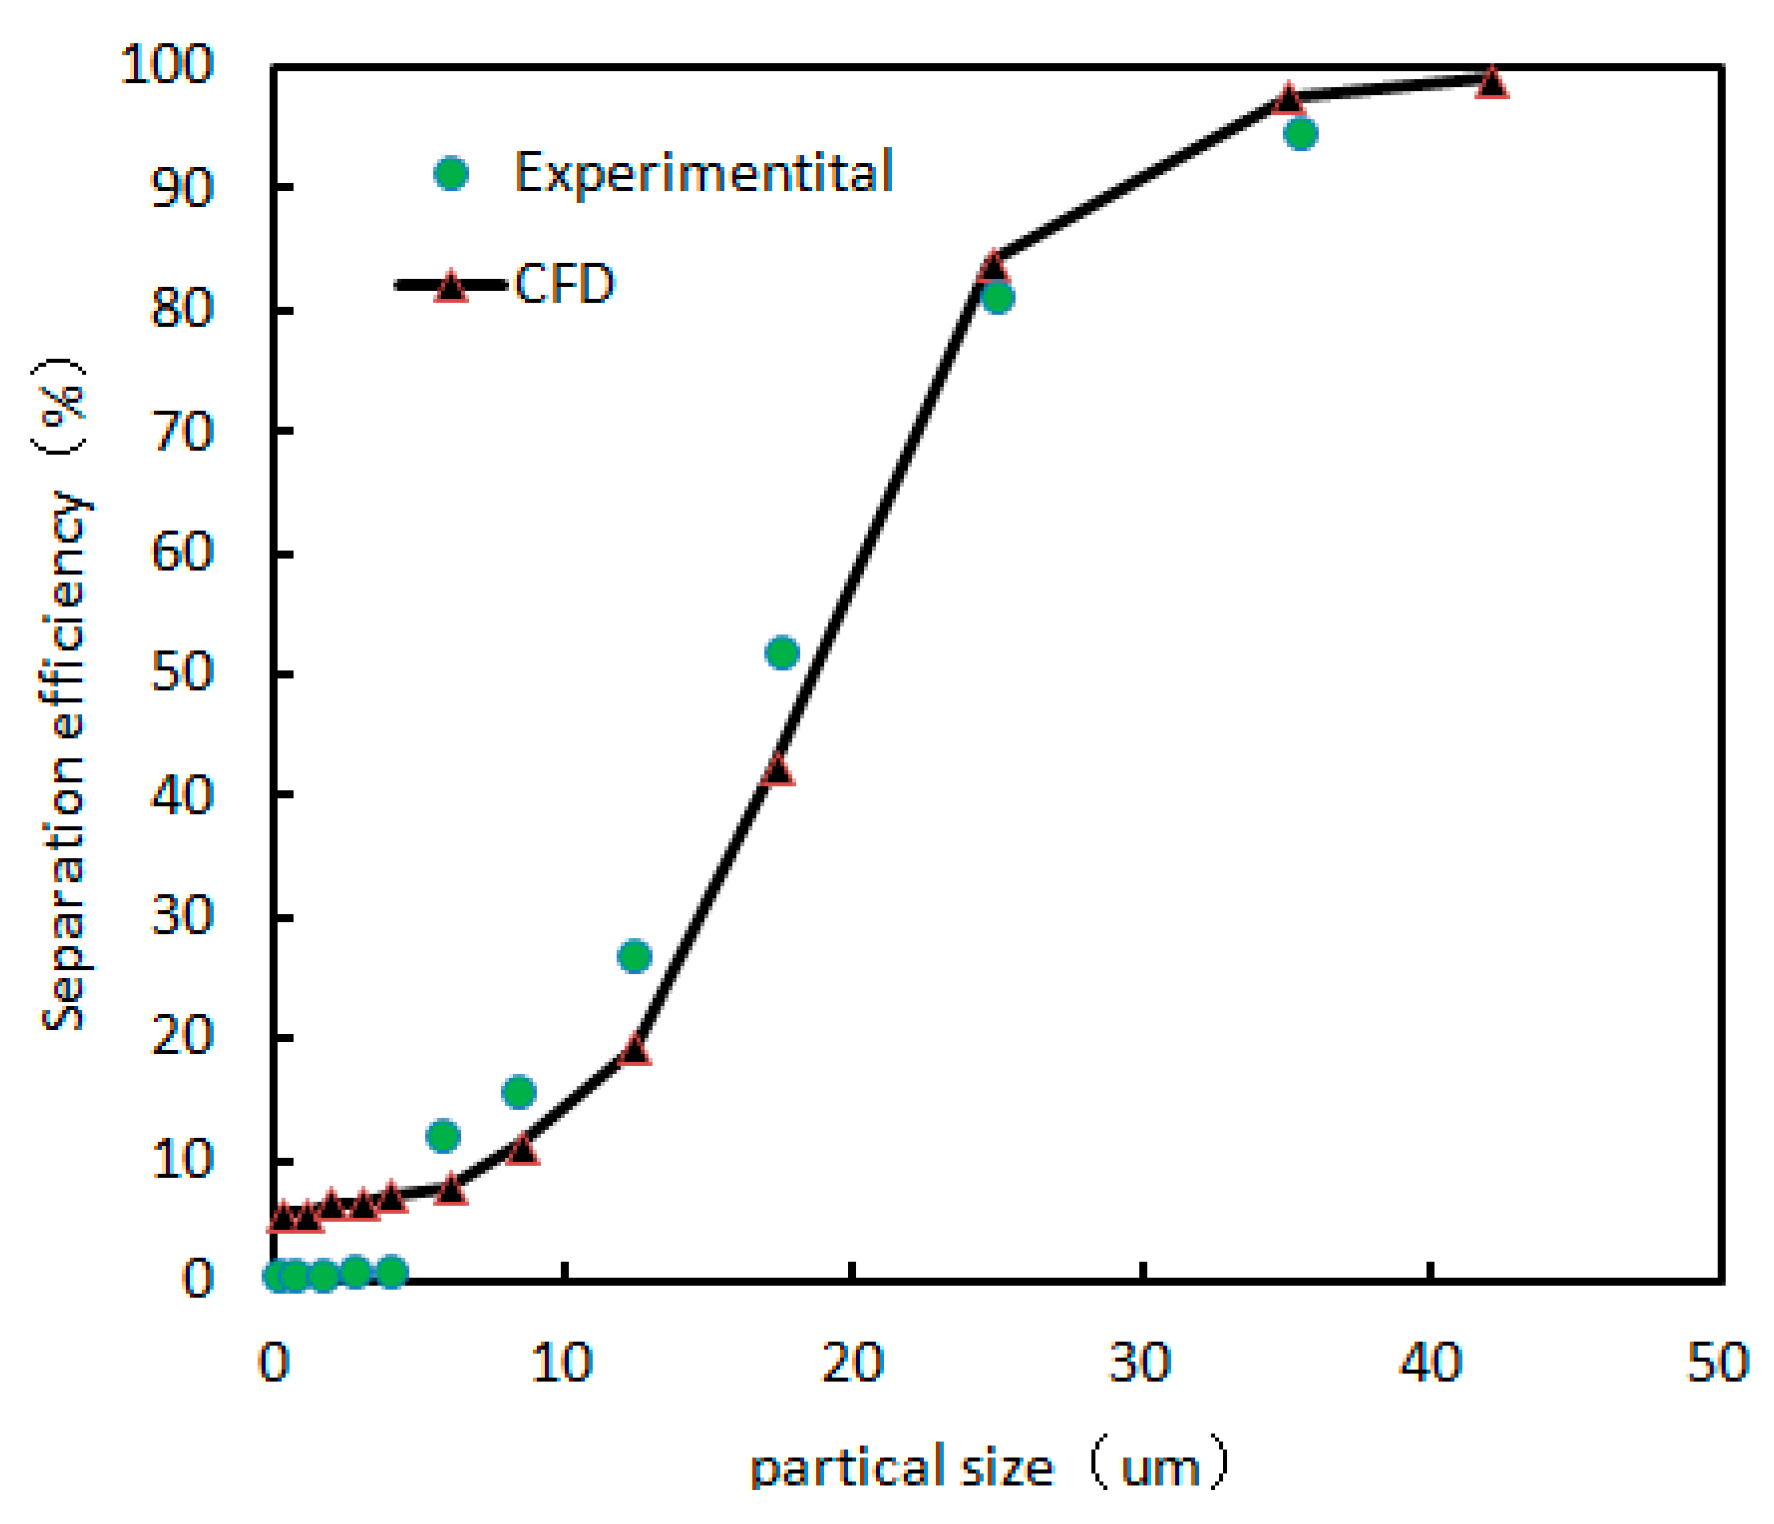
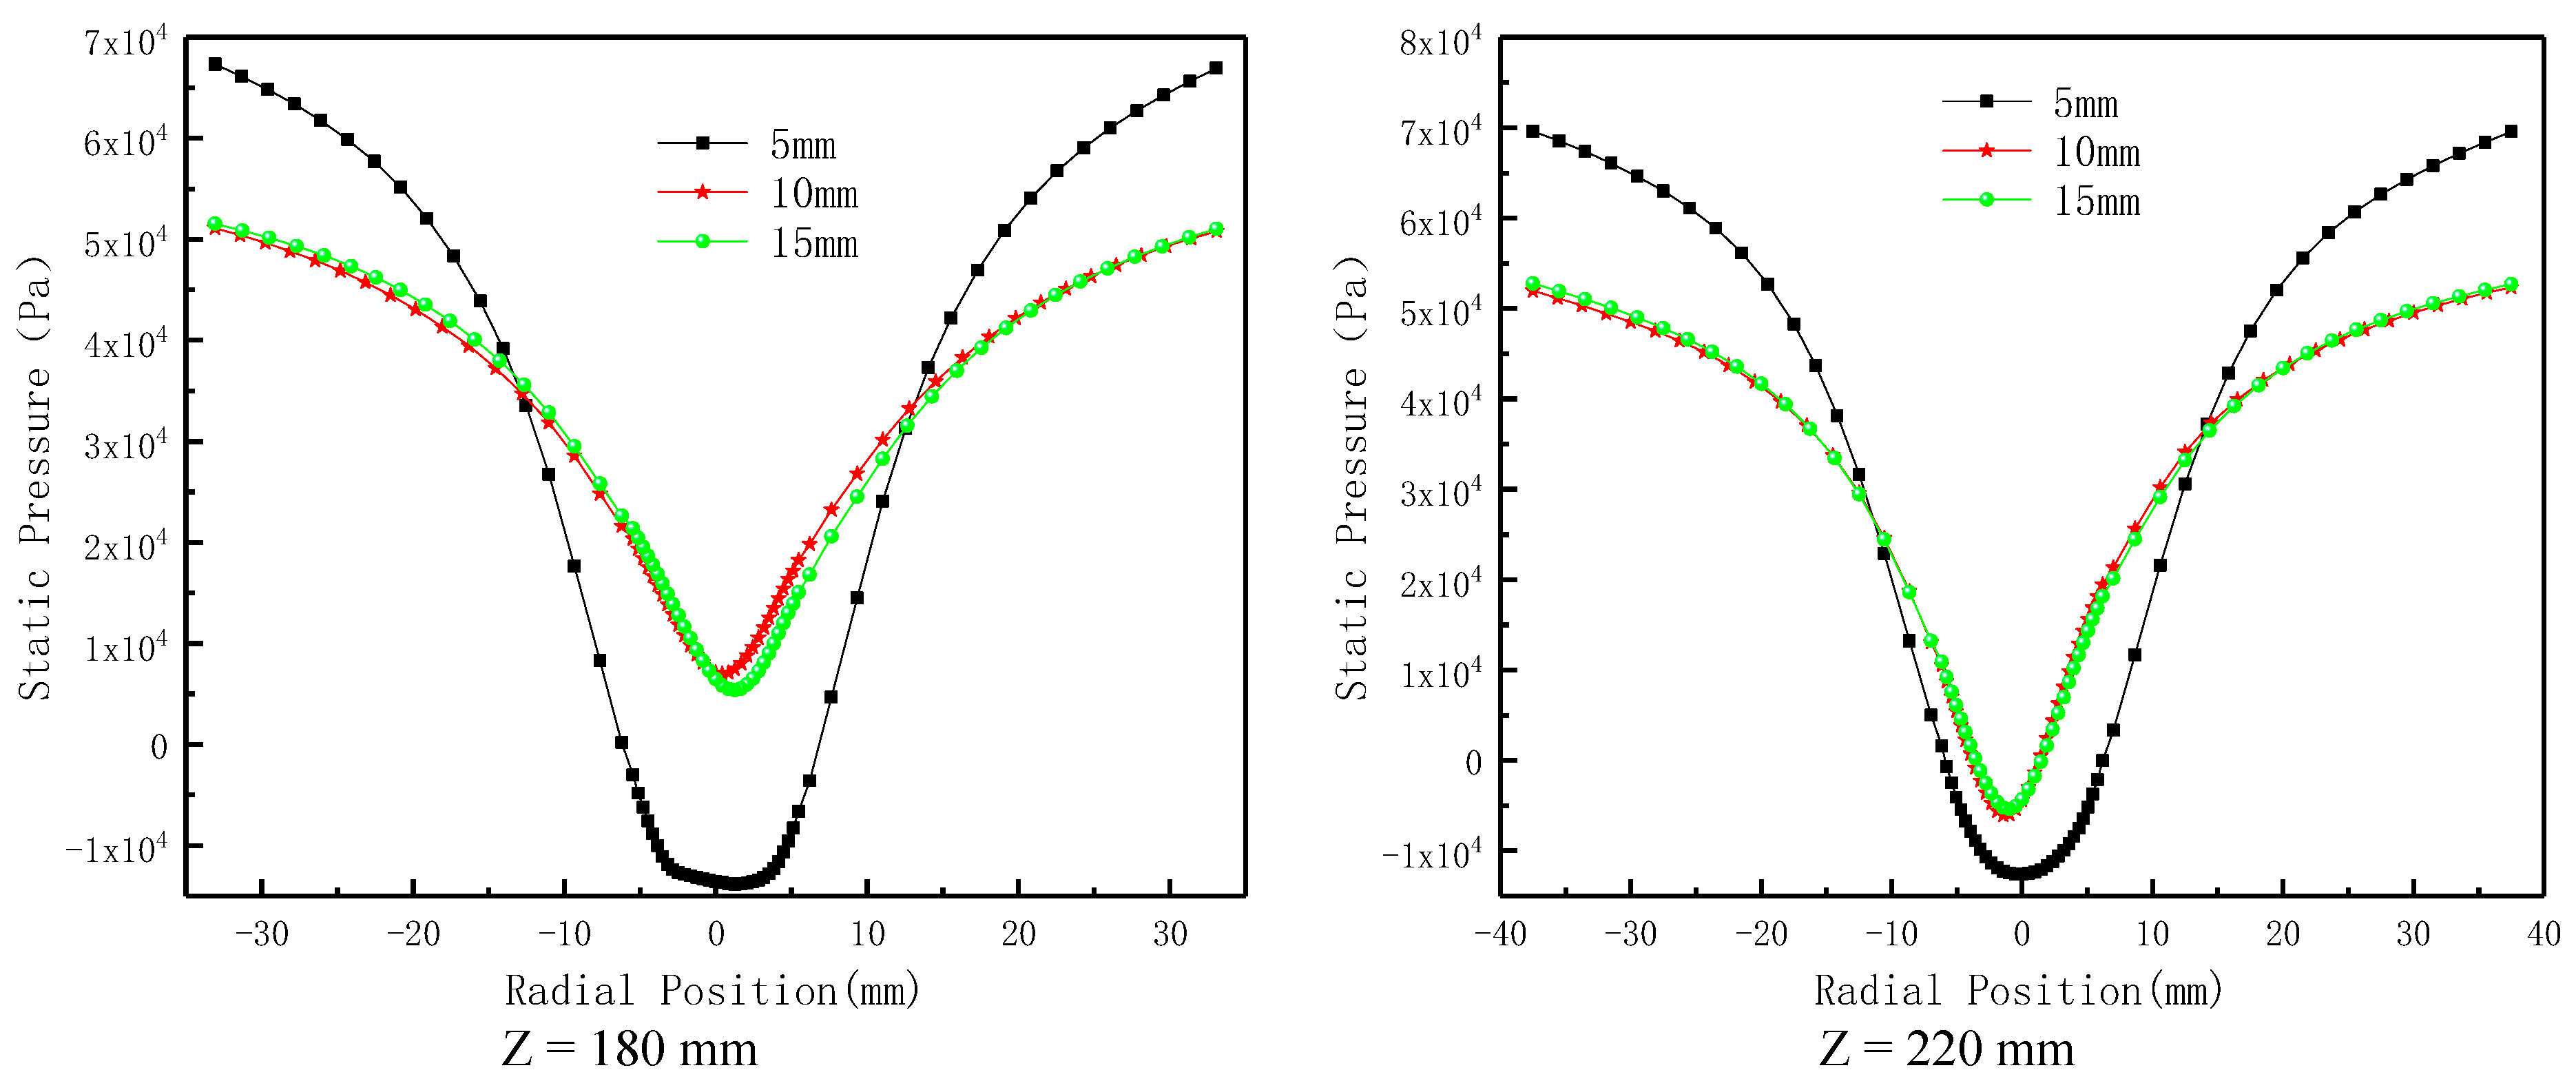
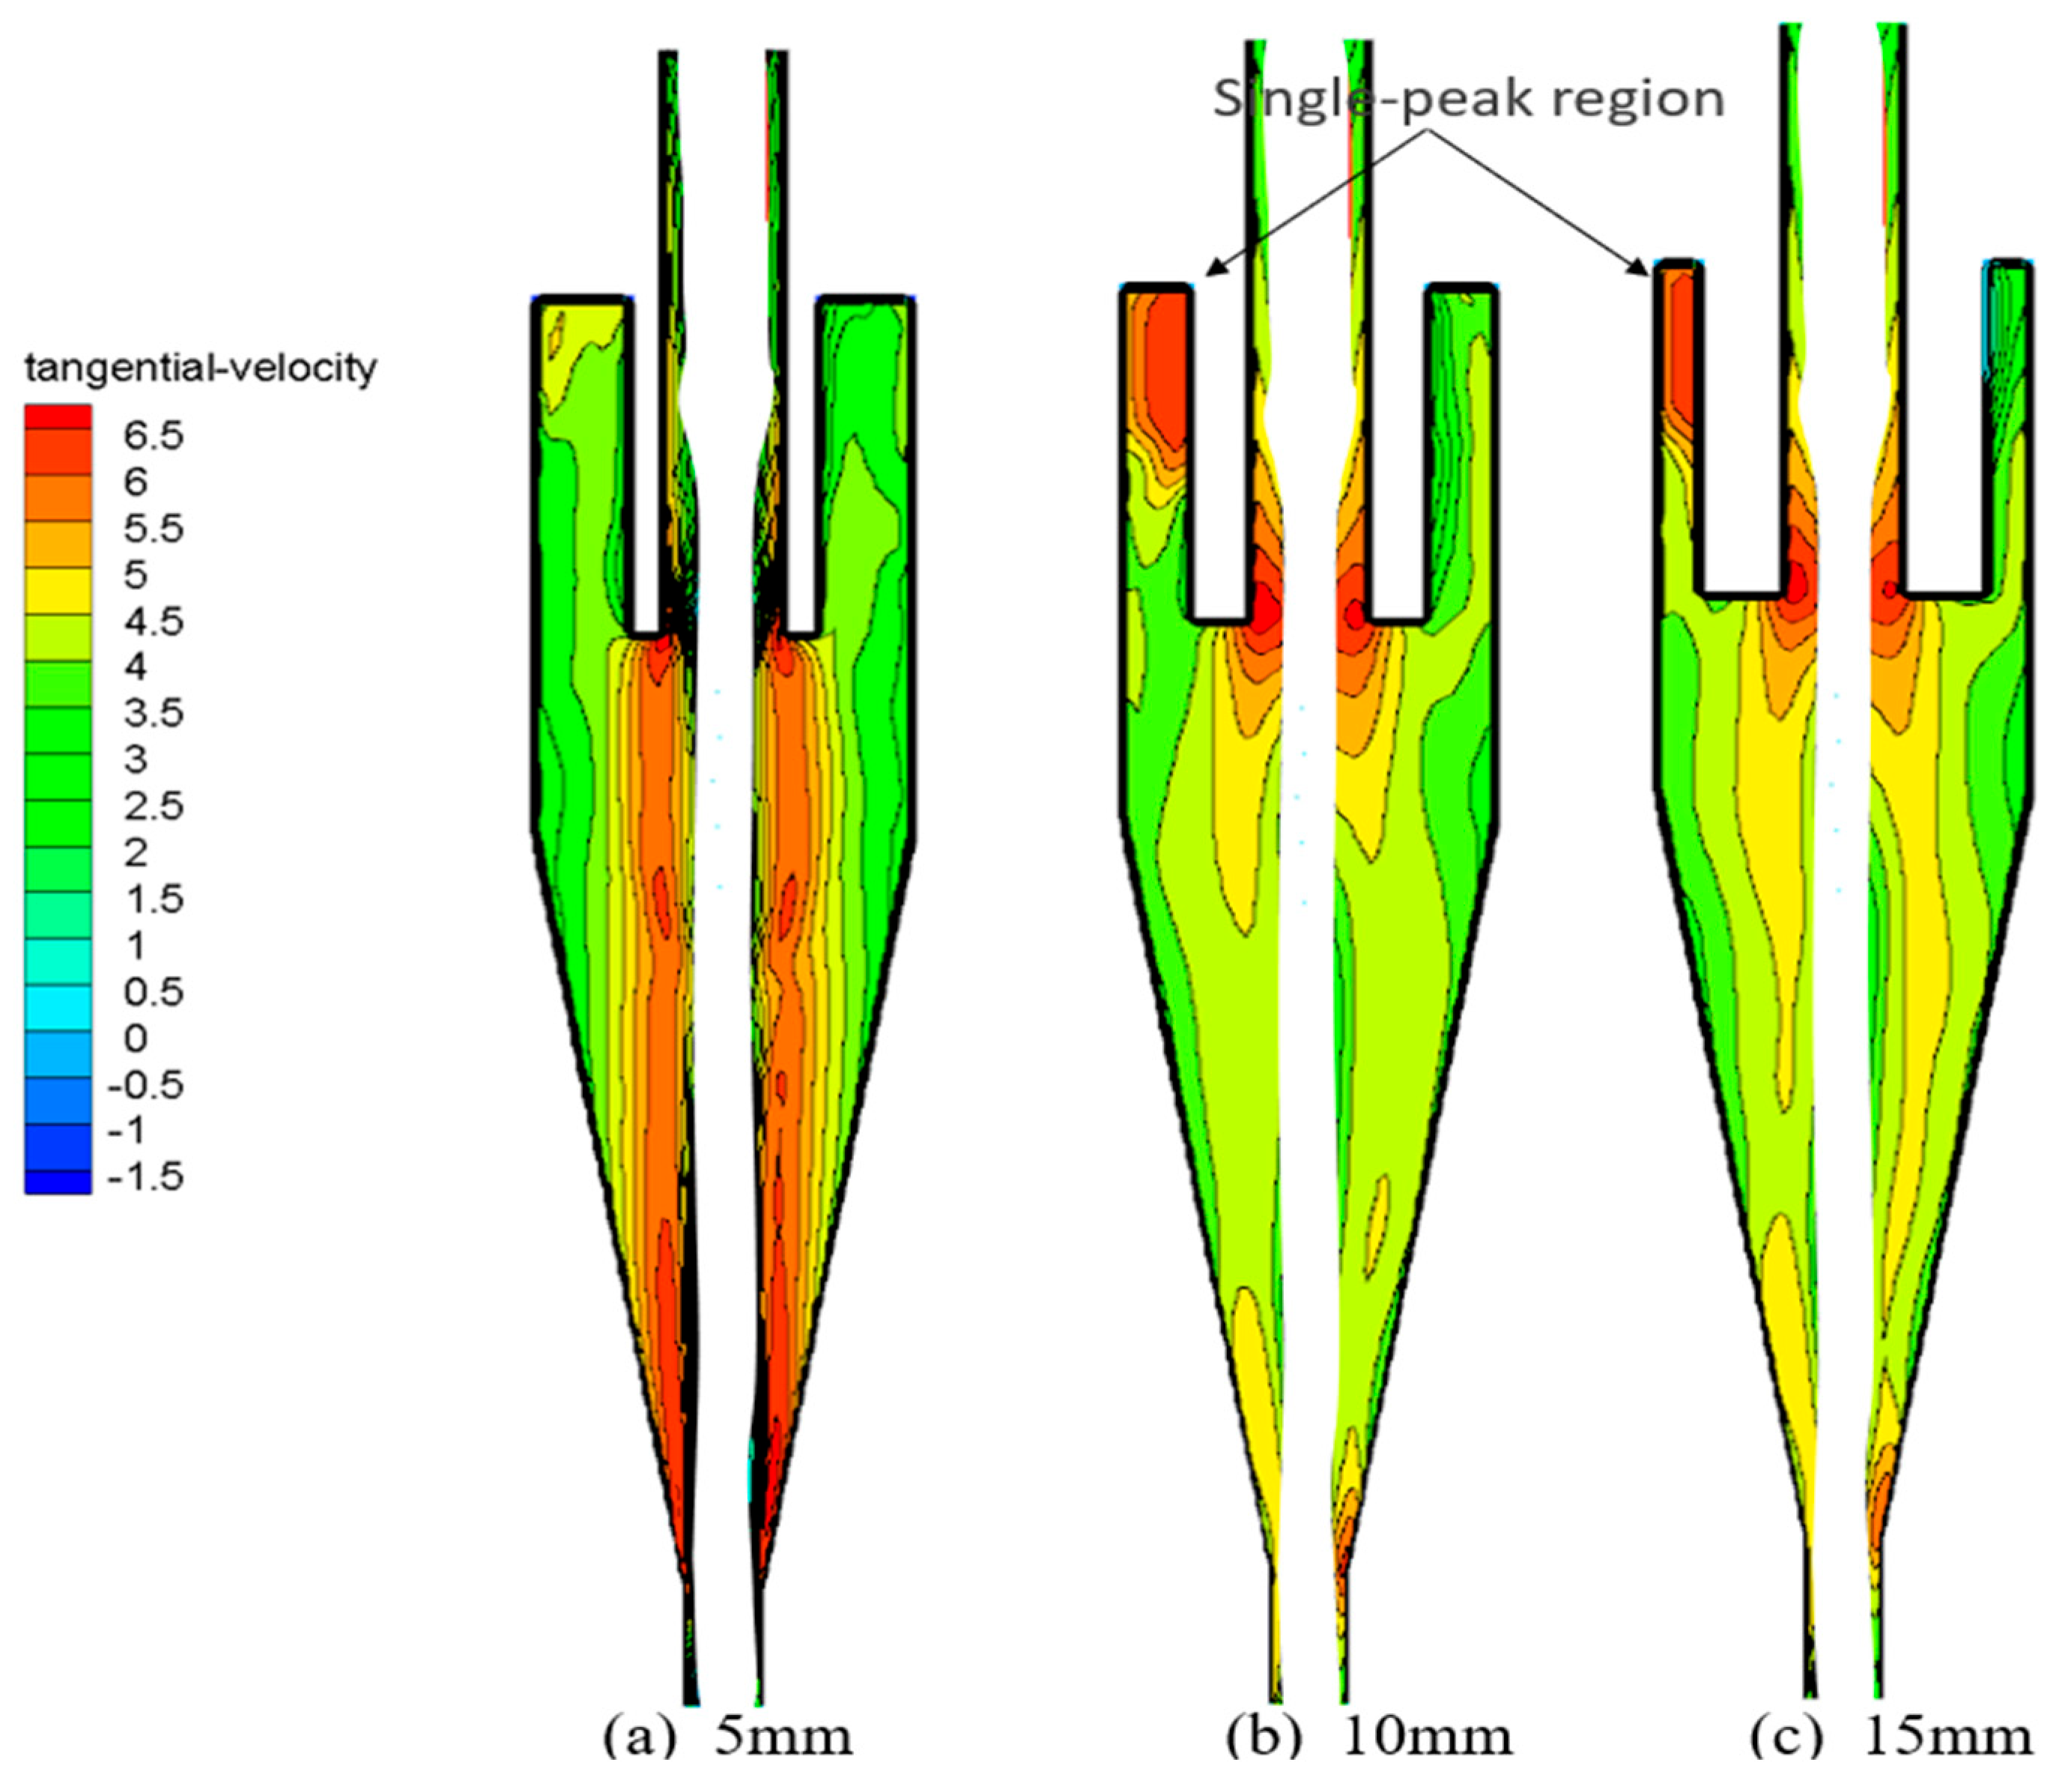
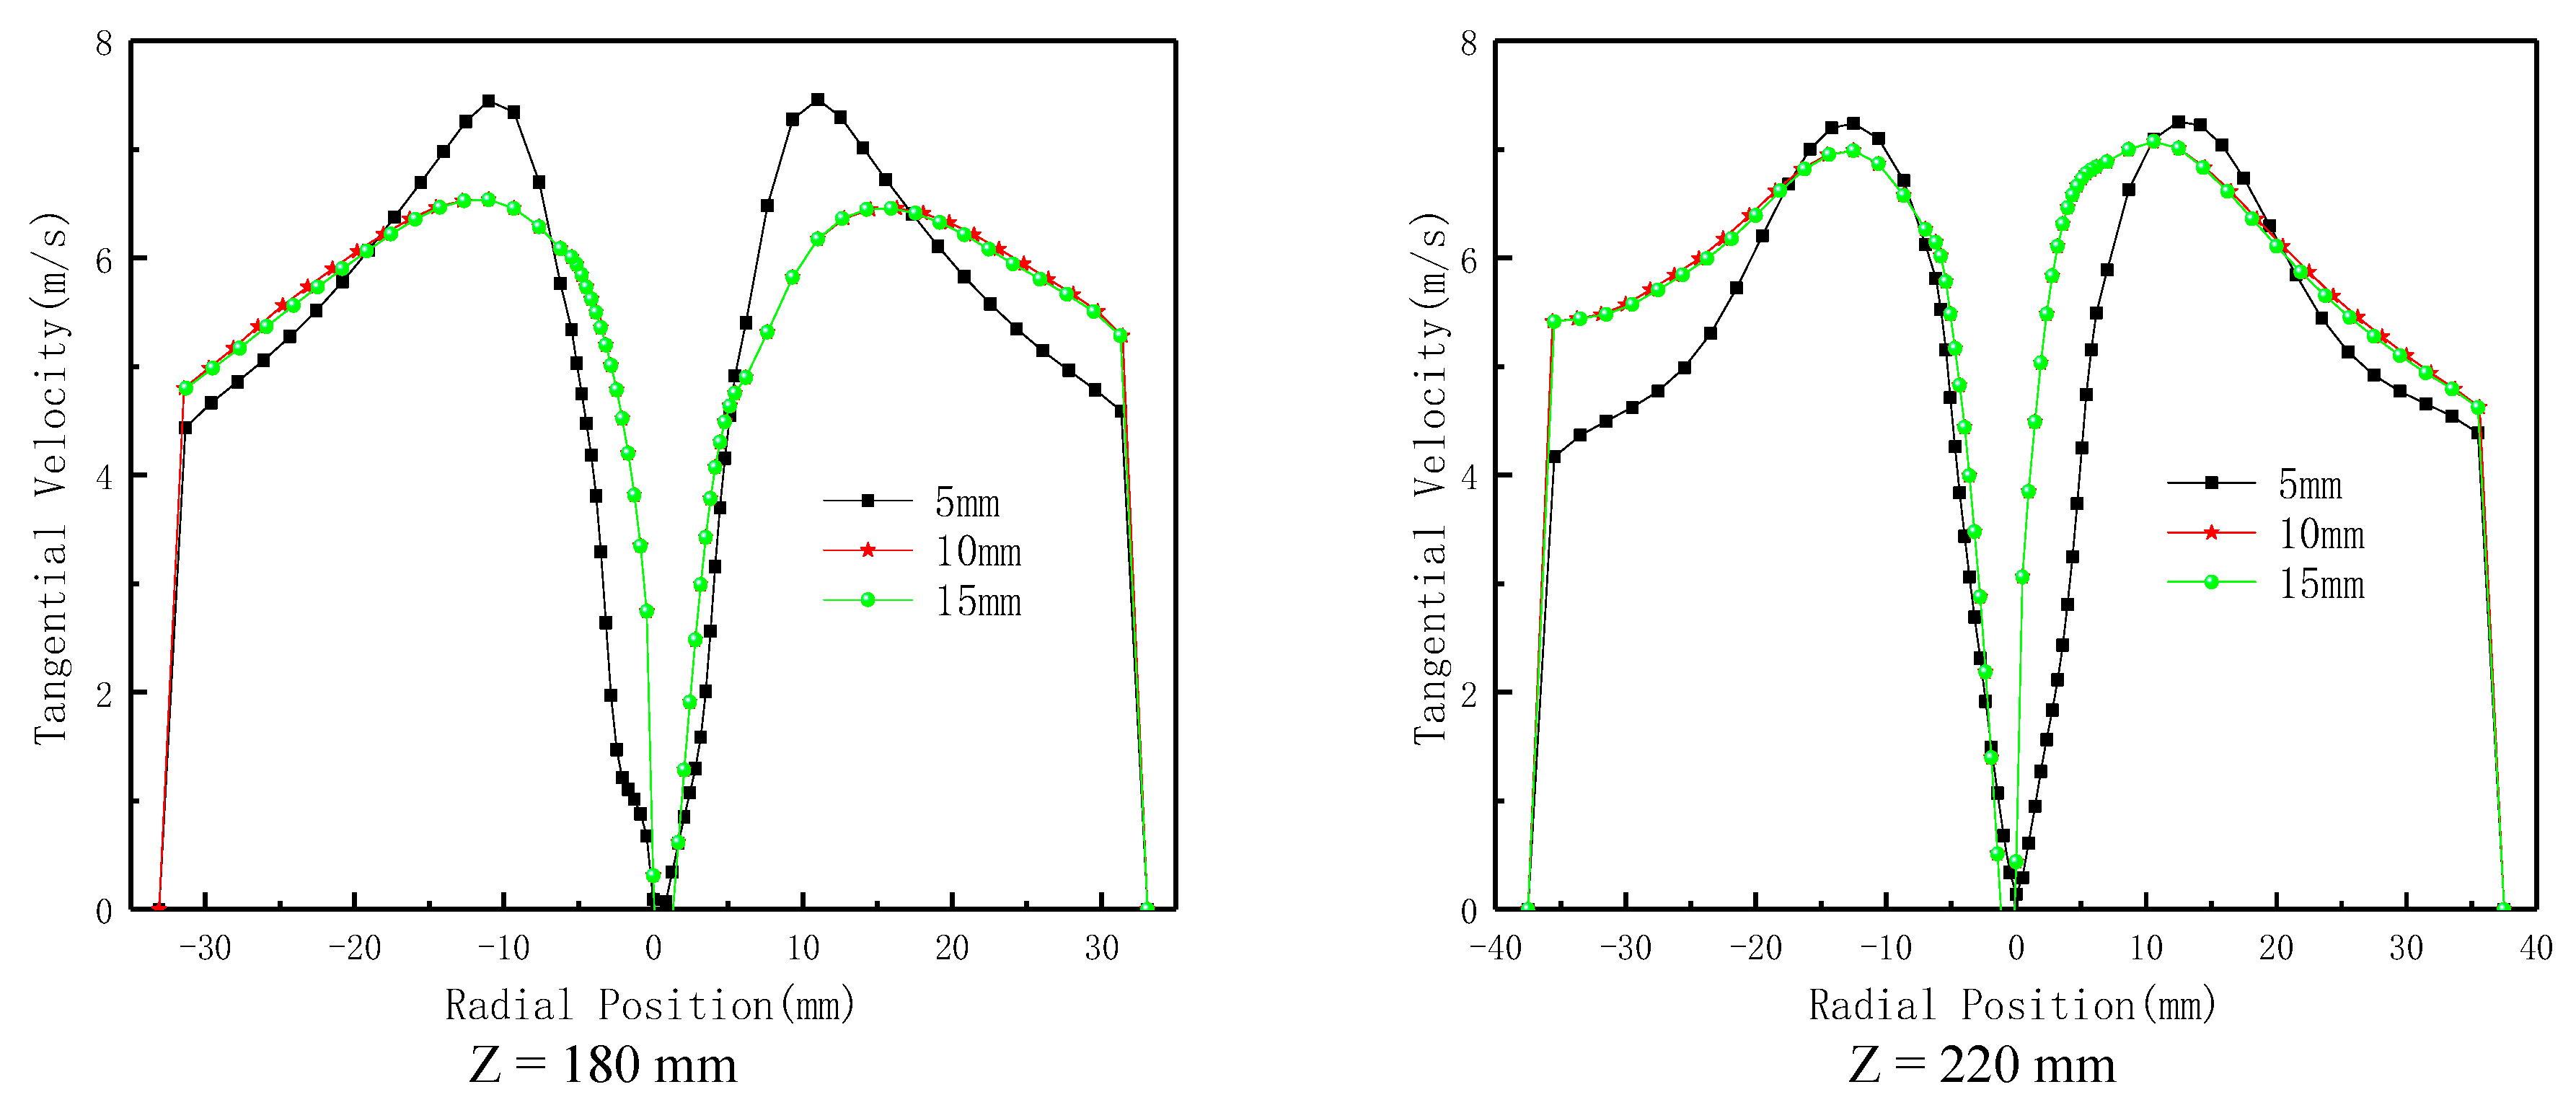
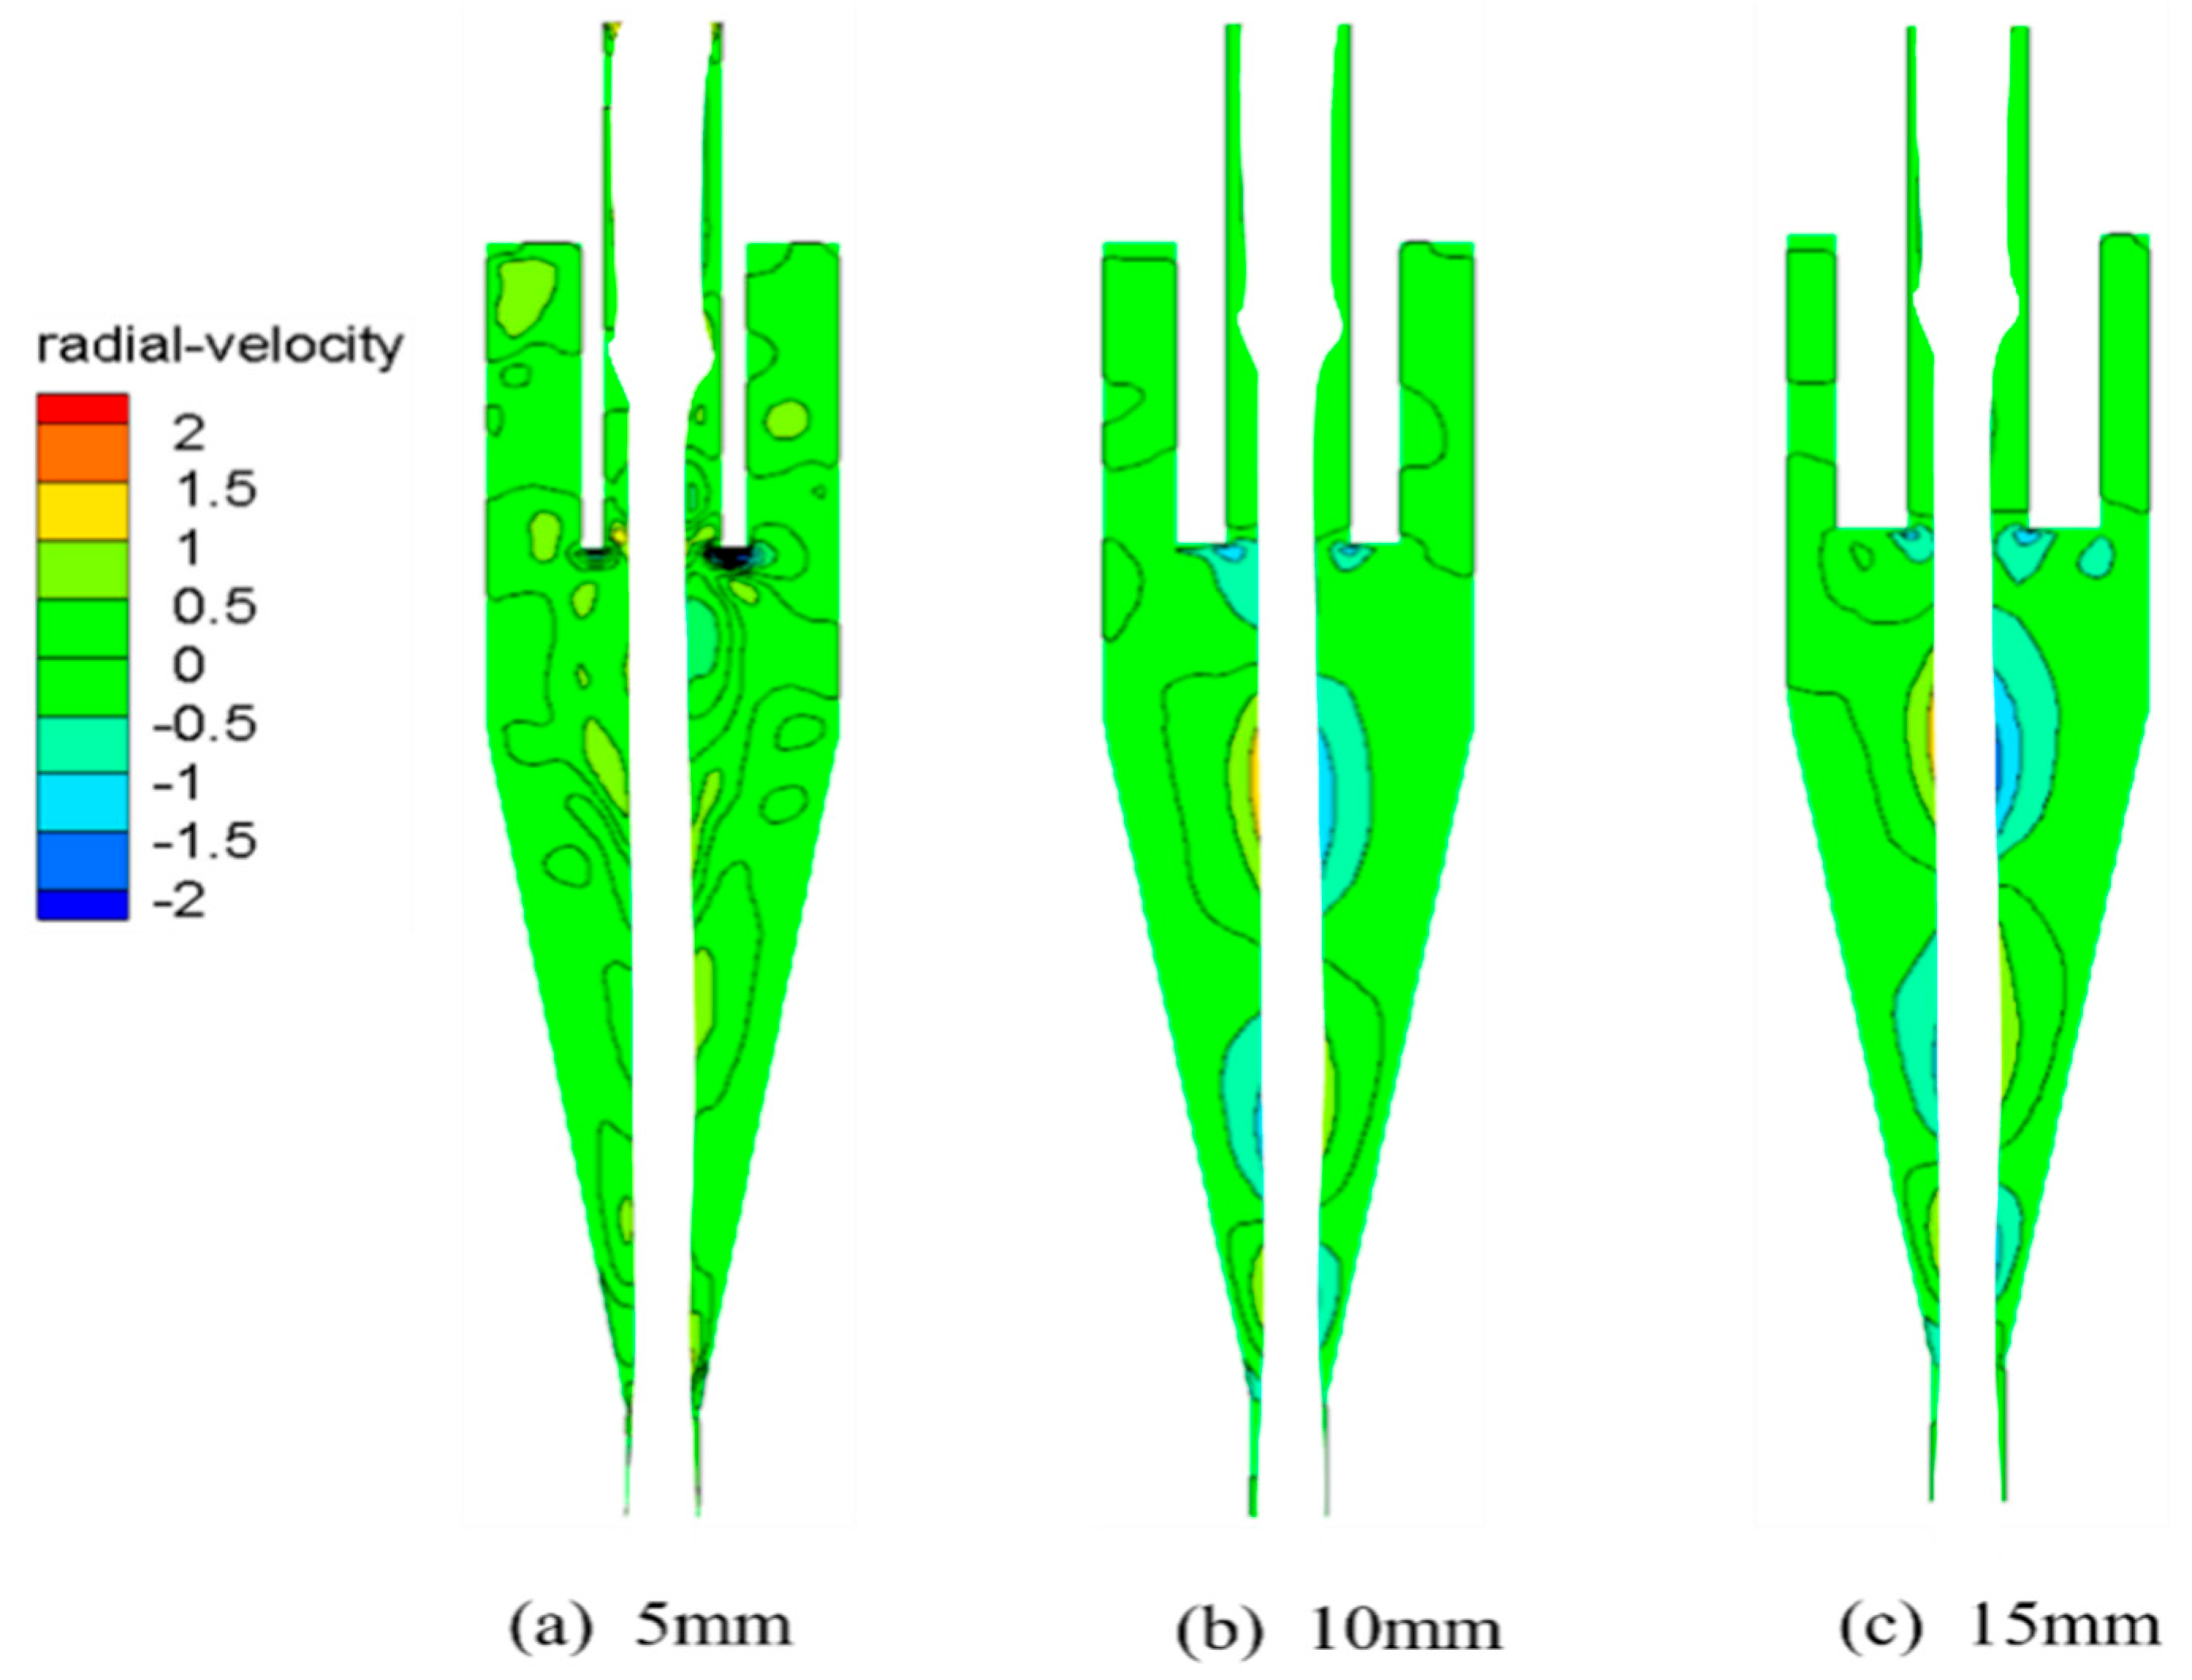
15]. On this basis, the study quantitatively analyzes how changes in vortex finder wall thickness affect key evaluation parameters such as the pressure field, velocity field, and classification efficiency.
This study investigates the influence of vortex finder wall thickness on the internal flow field and classification performance of a hydrocyclone using both numerical analysis (CFD) and experimental methods. The effects were examined in terms of key evaluation indicators such as pressure field, velocity field, turbulence field, and classification efficiency, thereby revealing the underlying mechanisms of how vortex finder wall thickness impacts these factors. Laboratory experiments were conducted to obtain the characteristics of how vortex finder wall thickness affects particle-phase classification. The evolution of flow structures and the spatial distribution characteristics of the particle phase are illustrated. The results provide important theoretical and practical guidance for the future design of advanced vortex finder structures.

2. Physical Model

2.1. Model Description

Because of the hydrocyclone’s complex internal flow field, the investigation of its flow and particle classification characteristics was divided into two steps using CFD. In the first step, the Volume of Fluid (VOF) model was employed to resolve the internal flow field evolution, and the Reynolds Stress Model (RSM) was applied to predict turbulence characteristics within the hydrocyclone [16]. Second, the two-phase flow is modeled using the Eulerian–Lagrangian approach [17]. In this model, the bubble diameter was set to 1 × 10⁻⁵ mm to compute slip velocity at the water–air interface; full model details are documented in the literature [18,19]. Furthermore, the following definitions were adopted: separation efficiency (η = Cu/Cf × 100%, Cu represents the mass fraction of a specific particle size in the underflow, while Cf denotes the mass fraction of the same particle size in the feed) denotes the recovery rate of particles of each size in the spigot; cut size (d50) is the particle diameter corresponding to a 50% separation efficiency; steepness index (SI = d25/d75) is the ratio of the diameters at 25% and 75% separation efficiencies.

2.2. Model Construction and Mesh Generation

To investigate the influence of vortex finder wall thickness on the internal flow field and classification performance of the hydrocyclone, numerical simulations were carried out for three vortex finder structures with wall thicknesses of 5 mm, 10 mm, and 15 mm. The structure and dimensions of the hydrocyclone are shown in Figure 1 and Table 1. Except for the vortex finder wall thickness, all other structural parameters remained identical. Mesh generation is one of the most critical steps in numerical simulation, as the type, number, and size of the mesh significantly affect numerical accuracy. Among various mesh types, hexahedral meshes are widely used for geometrically regular structures due to their high accuracy and fast convergence [20,21]. Therefore, in this study, an O-grid meshing method was used in Integrated Computer Engineering and Manufacturing (ICEM 2023) software to generate a hexahedral mesh, as shown in Figure 2. To select an appropriate mesh number and ensure reasonable computation time, a mesh independence test was conducted, as illustrated in Figure 3. Tangential velocity was used as the evaluation criterion. When the mesh count reached 2.6 × 10⁵, the tangential velocity showed minimal variation with further increases in mesh number. Therefore, to optimize computational efficiency, a mesh with 3.1 × 10⁵ hexahedral cells was adopted for the computational domain. Since this study focuses on the vortex finder, mesh refinement was applied near the wall and wall thickness of the vortex finder. Additionally, to reduce numerical diffusion during the computation, the hydrocyclone was axially divided into segments every 30 mm for mesh partitioning and then reassembled to improve the accuracy of the simulation results [22,23,24].

2.3. Boundary Condition Setup

The velocity inlet was specified at the inlet boundary, with both the water phase and particle phase velocities set to 5 m/s. The overflow outlet and spigot were defined as pressure outlets. The liquid viscosity corresponding to 20 °C at standard atmospheric pressure was applied. No-slip boundary conditions were imposed at all walls, and standard wall functions were used for near-wall treatment [25,26,27,28]. Pressure–velocity coupling was handled using the Semi-Implicit Method for Pressure Linked Equations (SIMPLE) algorithm. The pressure equation was discretized with the Pressure Staggering Option (PRESTO) scheme, while the momentum equations were solved using the third-order accurate Quadratic Upstream Interpolation for Convective (QUICK) scheme. The Volume of Fluid (VOF) phase-fraction equation was discretized using the Geo-Reconstruct scheme to improve interface tracking accuracy; all other equations were discretized with a first-order upwind scheme [29]. In the VOF model, the air backflow coefficient at both the spigot and overflow outlet was set to 1 to ensure that air enters through at least one outlet. A time step of 1 × 10⁻⁴ s was used. In the Mixture model, the bubble diameter was specified as 1 × 10⁻⁵ mm. Solid particles were represented by quartz sand with a density of 2673 kg/m3; the feed particle size distribution is given in Table 2. The specific method for selecting particle size is detailed in the literature [30]. Convergence was achieved when inlet and outlet volumetric flow rates were balanced [31].

2.4. CFD Model Validation

Before applying the physical model to numerical analysis, it is essential to validate its accuracy. In 1988, Hsieh experimentally obtained detailed velocity distribution data within a φ75 mm hydrocyclone, which has been widely used by researchers to validate their simulation results. Therefore, in this study, a hydrocyclone with geometric parameters identical to those used by Hsieh was constructed for model validation. A comparison between the simulated and experimental results is shown in Figure 4. As can be seen, the simulation results show good agreement with the experimental data, with deviations mainly observed at the peak values, which are primarily attributed to the inherent limitations of the turbulence model. Overall, the VOF model provides reliable reference data for the internal flow field of the hydrocyclone, thereby verifying the validity of the modeling approach [32,33,34].
The particle phase motion characteristics were predicted using the Two-Fluid Model (TFM), and the resulting simulated data were compared with Delgadillo’s [35] experimental data. As illustrated in Figure 5, the simulated and experimental values exhibit a high degree of consistency, with only minor discrepancies observed for particles smaller than 5 µm. This phenomenon may be attributed to two factors: first, errors associated with the particle size analyzer; second, the high wettability of particles smaller than 5 µm, which hinders the hydrocyclone’s ability to effectively classify them, resulting in an experimental measurement of zero. When particle sizes exceed 5 µm, the variations in simulated and experimental values are highly consistent, demonstrating that the TFM can accurately predict the particle phase motion characteristics. In summary, the simulated data obtained from the physical model utilized in this study are reliable.

3. Results and Discussion

3.1. Static Pressure

A hydrocyclone converts pressure energy into kinetic energy with concomitant energy loss; hence, investigating the distribution and variation of static pressure within the hydrocyclone is of significant practical importance. Figure 6 shows the effect of vortex finder wall thickness on static pressure along the diameters at Z = 180 mm and Z = 220 mm. The static pressure decreases radially inward before increasing near the center, where it becomes negative. This negative pressure arises from the conversion of pressure energy to kinetic energy during circumferential motion; when pressure falls below ambient, external air is drawn into the hydrocyclone center, forming the air core. As vortex finder wall thickness increases, the static pressure magnitude decreases, indicating that a thicker wall effectively reduces internal energy consumption under identical operating conditions, thereby lowering operational costs. Moreover, the thicker wall diminishes the likelihood of vortex formation and enhances flow field stability while maintaining adequate particle classification.
Pressure loss is defined as the pressure difference between the inlet and outlet. Here, the pressure loss ratio is defined as the pressure drop divided by the inlet pressure. The magnitude of the pressure loss directly determines the hydrocyclone’s operating energy consumption: the greater the pressure loss, the higher the energy consumption and operating cost. Therefore, the pressure loss should be minimized while maintaining the required particle classification. Table 3 shows the effect of vortex finder wall thickness on pressure loss. (Throughout the entire simulation process, a constant inlet volumetric flow rate and inlet pressure were maintained. After swirling within the hydrocyclone, the fluid exhibited varying outlet pressures, resulting in different pressure drops.) As the wall thickness increases, the pressure loss ratio gradually decreases, substantially reducing operating costs.

3.2. Tangential Velocity

Tangential velocity is one of the most critical components of the velocity field in a hydrocyclone. It directly influences the centrifugal force and, consequently, the classification performance of the hydrocyclone. At the same time, it serves as the primary driving force for the radial settling of particles. Although a high tangential velocity can effectively enhance the centrifugal force acting on particles, it also increases the likelihood of generating tangential vortices, which can lead to flow field instability. Therefore, a reasonable tangential velocity not only promotes particle classification but also contributes to flow stability. The influence of vortex finder wall thickness on tangential velocity in the ZX plane is shown in Figure 7. The white region at the center corresponds to the air core. It can be observed that the tangential velocity is lowest at the wall and gradually increases toward the center, reaching a maximum at a location close to the axis. As the wall thickness of the vortex finder increases, more fluid is compressed toward the outer wall of the hydrocyclone, resulting in a “narrow throat effect”, which significantly increases the kinetic energy of the fluid and introduces asymmetry in the velocity distribution.
To describe the effect of vortex finder wall thickness on tangential velocity in more detail, velocity profiles along the diameters at Z = 180 mm and Z = 220 mm are presented in Figure 8. The radial variation of tangential velocity generally exhibits an “M-shaped” profile, which corresponds to a typical Rankine vortex distribution: the tangential velocity increases gradually at first, then decreases sharply. Within the air core region (−2 mm to 2 mm), the tangential velocity is nearly zero, indicating that the gas in the air core does not participate in swirling motion. This explains why the air core does not contribute to particle classification. Meanwhile, with increasing vortex finder wall thickness, the overall tangential velocity shows an increasing trend, though changes occur primarily near the peak value. This trend is especially pronounced in the cylindrical section at Z = 220 mm. When the wall thickness reaches 10 mm, the tangential velocity becomes almost insensitive to further increases in wall thickness. Combined with the static pressure distribution, it can be concluded that a thick-walled vortex finder can achieve more efficient energy distribution. In the conical section and near the hydrocyclone wall, a thicker vortex finder effectively increases tangential velocity, enhances the centrifugal driving force on particles, and thus improves classification performance.

3.3. Radial Velocity

Radial velocity is the smallest component of the velocity field. Due to the high turbulence intensity and associated velocity fluctuations inside a hydrocyclone, experimental measurement of radial velocity profiles is challenging. Consequently, numerical simulation provides a reliable and effective means to characterize radial velocity distributions. Although its magnitude is relatively low, radial velocity governs the residence time of particles in the radial direction and thus determines the formation of radial particle layers.
Figure 9 shows the effect of vortex finder wall thickness on radial velocity. The radial velocity profile exhibits an antisymmetric pattern about the centerline, likely caused by the compression of the air core by the surrounding fluid. As the vortex finder wall thickness increases, the distinct features of the radial velocity distribution become more pronounced, indicating that a thicker-walled vortex finder enhances the stability of the internal flow field.
To elucidate the microscopic effect of vortex finder wall thickness on radial velocity, radial velocity profiles along diameters at Z = 180 mm and Z = 220 mm are presented in Figure 10. In the conical section (Z = 180 mm), radial velocity is observed to increase with wall thickness, as more energy is apportioned to this region by the thick-walled vortex finder. In the cylindrical section (Z = 220 mm), the radial velocity at 5 mm wall thickness exceeds that at 10 mm, since the slight increase in wall thickness augments internal confluent flow, thereby attenuating radial velocity. When the wall thickness reaches 15 mm, radial velocity rises sharply, indicating that a critical wall thickness threshold has been surpassed. Higher tangential velocities not only mitigate misaligned particle entrainment but also accelerate lateral particle settling, reducing the likelihood of radial vortices and thus enhancing particle classification.

3.4. Axial Velocity

Axial velocity, as another key component of the velocity field, significantly affects hydrocyclone separation performance in terms of split ratio and residence time. The split ratio, defined as the ratio of apex flow rate to inlet volumetric flow rate, should be minimized to reduce circulating flow and facilitate downstream water treatment. Figure 11 shows the effect of vortex finder wall thickness on axial velocity. The highest axial velocity occurs near the center, indicating rapid airflow within the air core. For the 5 mm wall thickness, the peak axial velocity is located in the conical section, since this region serves as the primary separation zone where particle–particle collisions intensify axial flow. In contrast, for 10 mm and 15 mm wall thicknesses, the maximum axial velocity shifts to the vortex finder base, a confluence zone of multiple flows, which explains the local velocity increase. Meanwhile, reduced axial velocity in the conical section diminishes axial turbulence, promoting smoother axial particle transport and enhancing classification accuracy.
The microscopic effect of vortex finder wall thickness on axial velocity is depicted in Figure 12, showing axial velocity distributions along the diameters at Z = 180 mm and Z = 220 mm. Axial velocity increases progressively with wall thickness, and velocities in the cylindrical section (Z = 220 mm) exceed those in the conical section (Z = 180 mm), reflecting differential energy allocation by the thick-walled vortex finder. Higher axial velocities in the cylindrical section facilitate rapid downward and upward particle transport; downward-moving particles with greater velocity can effectively avoid disturbances from multiple confluent flows near the vortex finder. Moreover, the axial velocity profile in the cylindrical section exhibits good symmetry, indicating a stable internal flow field that enhances particle separation sharpness.

3.5. Split Ratio and Zero-Velocity Envelope Surface

Figure 13 shows the effect of vortex finder wall thickness on the split ratio. The split ratio of the 15 mm thick-walled vortex finder is 38.53% lower than that of the 5 mm version. As the wall thickness increases, the split ratio decreases further, indicating a substantial reduction in secondary flow in the underflow. The lower split ratio also increases overflow volumetric flow rate, allowing more fine particles to exit via the overflow and reducing their proportion in the underflow, thereby enhancing coarse-particle separation sharpness.
When the direction of axial velocity reverses, points at which the velocity is zero inevitably occur; connecting these points yields the zero-velocity envelope surface (LZVV). The LZVV is a key indicator of hydrocyclone separation efficiency (η = Cu/Cf × 100%) and delineates the inner fine-particle separation zone from the outer coarse-particle zone. Figure 14 shows the effect of vortex finder wall thickness on the LZVV. As wall thickness increases, the LZVV shifts outward, indicating an enlarged fine-particle separation region and more complete fine-particle separation. Ideally, the LZVV should closely follow the hydrocyclone’s outer wall profile; the 10 mm and 15 mm configurations exhibit LZVV shapes in the conical section that closely match the outer wall, whereas the 5 mm configuration shows poor gradient smoothness, which may cause irregular variations in the fine-particle separation space and adversely affect precise fine-particle separation.

3.6. Velocity Vectors

To visualize the flow patterns within the hydrocyclone, velocity vector fields were analyzed (Figure 15). With a vortex finder wall thickness of 5 mm, extensive circulating flow and short-circuit flow appear in region A near the overflow outlet’s lower section. Multiple flow regimes between the vortex finder and the hydrocyclone wall induce elevated turbulence fluctuations and higher energy consumption, as well as increased particle mixing and shear stress, which degrade separation efficiency (η = Cu/Cf × 100%). At 10 mm wall thickness, only minor turbulence is observed in region B, while the remainder of the flow exhibits orderly migration. At 15 mm thickness, the confluent flow near the vortex finder’s lower end becomes regular, and the flow patterns between the vortex finder and the wall become uniform, indicating a marked improvement in internal flow stability. Hence, a thick-walled vortex finder effectively enhances flow stability and promotes orderly particle aggregation.

3.7. Partition Curve

The partition curve is a key performance index for hydrocyclone separation efficiency (η = Cu/Cf × 100%), reflecting the recovery rate of particles of different sizes in the underflow. Figure 16 shows the effect of vortex finder wall thickness on the partition curve. Underflow recovery increases with particle size. To distinguish coarse particle and fine particle separation performance, the curve is divided into fine and coarse regions. In the fine region, increased wall thickness reduces fine-particle carryover in the underflow, effectively mitigating underflow contamination. In the coarse region, thick-walled vortex finders yield higher coarse-particle recovery than thin-walled ones, enhancing coarse product yield. To assess the impact on cut size and separation sharpness, Figure 17 presents the variation of cut size (d50), defined as the particle size corresponding to 50% underflow recovery. A smaller d50 indicates stronger separation capability. Figure 18 shows the steepness index (d25/d75), representing the slope at 50% recovery; higher values indicate better separation sharpness and product quality.
As wall thickness increases, d50 first decreases then increases, reaching a minimum of 17.1 μm at 10 mm thickness. Further thickening enlarges d50; thus, a vortex finder wall thickness of 5–10 mm is recommended for a 75 mm hydrocyclone to achieve finer products. The steepness index increases monotonically with wall thickness, indicating that moderate increases in thickness enhance product quality.

3.8. Equilibrium Radius

To characterize particle distribution at the microscale, the equilibrium radius was defined. The procedure is as follows: (1) select reference planes every 25 mm along the axial direction; (2) determine the volume fraction distribution of each particle size at those planes; (3) connect the points of maximum volume fraction at each plane. As particle size increases, the locus of maximum concentration shifts radially toward the hydrocyclone wall, explaining the radial increase in particle diameter. Figure 19 shows the effect of vortex finder wall thickness on equilibrium radius for various particle sizes. For 5 μm fines, the 5 mm wall thickness yields equilibrium radii straddling the LZVV between Z = 115 mm and Z = 175 mm, indicating fines entering the external swirl and causing underflow contamination with greatly reduced separation sharpness. In contrast, for the 10 mm and 15 mm thick-walled vortex finders, the equilibrium radii of 2 μm fines lie entirely inside the LZVV, demonstrating effective mitigation of fine-particle misplacement; the 15 mm configuration exhibits an approximately linear distribution, yielding the best separation. For 25 μm mid-coarse particles, the 5 mm wall thickness similarly produces equilibrium radii on both sides of the LZVV, leading to particle mixing and low separation sharpness. The 10 mm and 15 mm thick-walled designs produce regular equilibrium radius distributions with higher separation sharpness.

4. Experimental Investigation

To evaluate the influence of thick-walled vortex finders on hydrocyclone separation performance, an experimental campaign was conducted. The test rig comprised a feed system (slurry pump and hopper), measurement system (flowmeter and pressure gauge), control system (valve), classification system (hydrocyclone), and recirculation piping. First, solids and water were mixed in the hopper at a predetermined ratio under stirring to maintain a uniform slurry concentration. The slurry was then delivered to the hydrocyclone inlet by the slurry pump, with volumetric flow rate adjusted via a frequency converter. Inlet flow rate and pressure were continuously monitored by the flowmeter and pressure gauge, respectively; any blockage was relieved by valve actuation to protect the hydrocyclone. Overflow and underflow outlets were piped back to the hopper to enable closed-loop operation (Figure 20). Prior to testing, the pump was run with water to check for leaks under high pressure and to flush residual printing debris from the hydrocyclone. Once proper operation was confirmed, slurry at the target concentration was prepared and stirred uniformly before performance tests commenced. To minimize experimental error, multiple parallel samples of feed, overflow, and underflow were collected, analyzed, and averaged to ensure data accuracy.
The material used was high purity fine grade quartz sand with a particle density of 2650 kg/m3. Its particle size distribution is given in Table 4, with 78.52% of particles below 52 μm, meeting the fine grade requirement. Particles < 20 μm were classified as fines, 20–35 μm as fine-mid, 35–50 μm as coarse-mid, and >50 μm as coarse.
Table 5 presents the effect of vortex finder wall thickness on hydrocyclone separation performance. Compared to the 5 mm wall thickness, the 15 mm thick-walled vortex finder reduced underflow concentration by 14.8%, decreased the underflow content of <20 μm particles by 51.69%, and increased separation sharpness by 17.63%, with a slight reduction in recovery rate. These results demonstrate that a thick-walled vortex finder effectively enhances fine-particle separation precision.
As shown in Table 6 and Table 7, the vortex finder wall thickness affected particle size distribution. In the underflow, the 15 mm thick-walled vortex finder reduced the content of <19 μm particles by 32.17% compared to the 5 mm configuration. In the overflow, the content of <19 μm particles increased by 12.72% relative to the 5 mm design. These results indicate that underflow contamination by fines was effectively mitigated and separation sharpness was significantly improved, thereby addressing low concentrate grade and poor separation efficiency.

5. Conclusions

In this study, the influence of the vortex finder wall thickness on the classification performance of the hydrocyclone was investigated through both numerical simulations and experimental analysis. Based on key evaluation metrics including pressure field, velocity field, and separation efficiency, the following characteristics were identified:
1. The thick-walled vortex finder reduces static pressure moderately while lowering the probability of tangential vortex formation, thus stabilizing the internal flow field. At a wall thickness of 15 mm, radial velocity increases significantly, promoting rapid fly ash particle layering and reducing particle misplacement.
2. Increasing vortex finder wall thickness effectively suppresses turbulent fluctuations and yields a more symmetric internal flow field, which facilitates orderly aggregation of fly ash particles, reduces short-circuit flow, and decreases energy consumption.
3. A wall thickness of 10 mm provides the strongest separation sharpness with a cut size of 17.1 μm, while 15 mm thickness delivers the highest separation precision. For a 75 mm hydrocyclone treating fly ash, a vortex finder wall thickness between 5 mm and 15 mm is recommended to efficiently remove impurity particles.
4. Compared to the 5 mm design, the 15 mm thick-walled vortex finder reduced underflow concentration by 14.8%, decreased the underflow content of <20 μm particles by 51.69%, and increased separation sharpness by 17.63%. The content of <19 μm particles in the underflow decreased by 32.17%, while their content in the overflow increased by 12.72%.
5. The limitation of this study is that the effect of vortex finder wall thickness on particle motion within the hydrocyclone was not quantified; further investigation will be conducted using the Discrete Phase Model (DPM).

Author Contributions

Data curation, Z.W., F.L. and H.Y.; Investigation, Z.W.; Methodology, Z.W. and P.L.; Project administration, H.Y.; Validation, Z.W., F.L. and H.Y.; Writing—original draft, Z.W.; Writing—review and editing, Z.L. All authors have read and agreed to the published version of the manuscript.

Funding

This work was financially supported by Shandong Provincial Natural Science Foundation (ZR2024QE381).

Institutional Review Board Statement

Not applicable.

Informed Consent Statement

Not applicable.

Data Availability Statement

The data that support the findings of this study are available from the corresponding author upon reasonable request.

Acknowledgments

We are grateful to Jinwen You for funding support.

Conflicts of Interest

Author Zaihai Wu was employed by the company Shandong Gold Mining Technology Co., Ltd. The remaining authors declare that the research was conducted in the absence of any commercial or financial relationships that could be construed as a potential conflict of interest.

References

  1. Rietema, K. Performance and design of hydrocyclones, Parts I-IV. Chem. Eng. Sci. 1961, 15, 298–325. [Google Scholar] [CrossRef]
  2. Chu, L.Y.; Luo, Q. Hydrocyclone with high sharpness of separation. Filtr. Sep. 1994, 720, 733–736. [Google Scholar] [CrossRef]
  3. Davidson, M.R. An adaptive method of predicting the air-core diameter for numerical models of hydrocyclone flow. Int. J. Miner. Process. 1995, 43, 167. [Google Scholar] [CrossRef]
  4. Li, F.; Liu, P.; Yang, X.; Zhang, Y. Nuemrical simulation on the effects of different feeding body structures on the flow field and seperation performance in a hydrocyclone. Powder Technol. 2020, 373, 254–266. [Google Scholar] [CrossRef]
  5. Li, F.; Liu, P.; Yang, X.; Zhang, Y.; Zhao, Y. Effects of inlet concentration on the hydrocyclone separation performance with different inlet velocity. Powder Technol. 2020, 375, 337–351. [Google Scholar] [CrossRef]
  6. Cui, B.; Zhang, C.; Wei, D.; Lu, S.; Feng, Y. Effects of feed size distribution on separation performance of hydrocyclones with different vortex finder diameters. Powder Technol. 2017, 322, 114–123. [Google Scholar] [CrossRef]
  7. Ghodrat, M.; Kuang, S.; Yu, A.; Vince, A.; Barnett, G.; Barnett, P. Numerical analysis of hydrocyclones with different vortex finder configurations. Miner. Eng. 2014, 16, 112–125. [Google Scholar] [CrossRef]
  8. Raoufi, A.; Shams, M.; Farzaneh, M.; Ebrahimi, R. Numerical simulation and optimization of fluid f low in cyclone vortex finder. Chem. Eng. Process. 2008, 47, 128–137. [Google Scholar] [CrossRef]
  9. Cui, B.Y.; Wei, D.Z.; Gao, S.L.; Liu, W.G.; Feng, Y.Q. Numerical and experimental studies of flow field in hydrocyclone with air core. Trans. Nonferrous Met. Soc. China 2014, 24, 2642–2649. [Google Scholar] [CrossRef]
  10. Svarovsky, L. Solid-Liquid Separation, 4th ed.; Butterworth-Heinemann Ltd.: Oxford, UK, 2000. [Google Scholar]
  11. Demir, S.; Karadeniz, A.; Aksel, M. Effects of cylindrical and conical heights on pressure and velocity fields in cyclones. Powder Technol. 2016, 295, 209–217. [Google Scholar] [CrossRef]
  12. Misiulia, D.; Andersson, A.G.; Lundström, T.S. Effects of theinlet angleonthe flow pattern and pressure drop of a cyclone with helical-roof inlet. Chem. Eng. Res. Des. 2015, 102, 307–321. [Google Scholar] [CrossRef]
  13. Tang, B.; Xu, Y.; Song, X.; Sun, Z.; Yu, J. Numerical study on the relationship between high sharpness and configurations of the vortex finder of a hydrocyclone by central composite design. Chem. Eng. J. 2015, 278, 504–516. [Google Scholar] [CrossRef]
  14. Hsieh, K.T. Phenomenological Model of the Hydrocyclone; The University of Utah: Salt Lake City, UT, USA, 1988. [Google Scholar]
  15. Kuang, S.; Qi, Z.; Yu, A.B.; Vince, A.; Barnett, G.D.; Barnett, P.J. CFD modeling and analysis of the multiphase flow and performance of dense medium cyclones. Miner. Eng. 2014, 62, 43–54. [Google Scholar] [CrossRef]
  16. Zhao, Q.; Cui, B.; Wei, D.; Song, T.; Feng, Y. Numerical analysis of the flow field and separation performance in hydrocyclones with different vortex finder wall thickness. Powder Technol. 2019, 345, 478–491. [Google Scholar] [CrossRef]
  17. Belošević, S.; Tomanović, I.D.; Crnomarković, N.Đ.; Milićević, A.; Tucaković, D.R. Modeling and optimization of processes for clean and efficient pulverized coal combustion in utility boilers. Therm. Sci. 2016, 20, 183–196. [Google Scholar] [CrossRef]
  18. Kuang, S.B.; Chu, K.W.; Yu, A.B.; Vince, A. Numerical study of liquid–gas–solid flow in classifying hydrocyclones: Effect of feed solids concentration. Miner. Eng. 2012, 31, 17–31. [Google Scholar] [CrossRef]
  19. Wang, B.; Yu, A.B. Computational investigation of the mechanisms of particle separation and “fish-hook” phenomenon in hydrocyclones. AICHEJ 2010, 56, 1703–1715. [Google Scholar] [CrossRef]
  20. Yang, Q.; Wang, H.-L.; Liu, Y.; Li, Z.-M. Solid/liquid separation performance of hydrocyclones with different cone combinations. Sep. Purif. Technol. 2010, 74, 271–279. [Google Scholar] [CrossRef]
  21. Hwang, K.J.; Chou, S.P. Designing vortex finder structure for improving the particle separation efficiency of a hydrocyclone. Sep. Purif. Technol. 2017, 172, 76–84. [Google Scholar] [CrossRef]
  22. Li, F.; Liu, P.K.; Yang, X.H.; Zhang, Y.K.; Jiang, L.; Wang, H. Numerical analysis of the effect of solid rod on the flow field and separation performance of thick-walled overflow pipe hydrocyclone. Powder Technol. 2021, 388, 261–273. [Google Scholar] [CrossRef]
  23. Li, F.; Liu, P.; Yang, X.; Zhang, Y.; Jiang, L.; Wang, H. The effects of the height-to-width ratio of the rectangular inlet on the flow field and separation performance by hydrocyclone. Int. J. Coal Prep. Util. 2021, 42, 3137–3154. [Google Scholar] [CrossRef]
  24. Li, F.; Liu, P.; Yang, X.; Zhang, Y.; Li, X.; Jiang, L.; Wang, H.; Fu, W. Purification of granular sediments from wastewater using a novel hydrocyclone. Powder Technol. 2021, 393, 751–763. [Google Scholar] [CrossRef]
  25. Li, F.; Liu, P.; Yang, X.; Zhang, Y.; Li, X.; Jiang, L.; Wang, H.; Fu, W. Numerical analysis on the effect of the length of arc-shaped vortex finder on the hydrocyclone’s flow field and separation performance. Miner. Eng. 2021, 172, 107172. [Google Scholar] [CrossRef]
  26. Vieira, L.G.M.; Silva, D.O.; Barrozo, M.A.S. Effect of Inlet Diameter on the Performance of a Filtering Hydrocyclone Separator. Chem. Eng. Technol. 2016, 39, 1406–1412. [Google Scholar] [CrossRef]
  27. Tian, J.Y.; Ni, L.; Song, T.; Olson, J.; Zhao, J.N. An overview of operating parameters and conditions in hydrocyclones for enhanced separations. Sep. Purif. Technol. 2018, 206, 268–285. [Google Scholar] [CrossRef]
  28. Ghodrat, M.; Kuang, S.B.; Yu, A.B.; Vince, A.; Barnett, G.D.; Barnett, P.J. Numerical analysis of hydrocyclones with different conical section designs. Miner. Eng. 2014, 62, 74–84. [Google Scholar] [CrossRef]
  29. Zhang, C.; Cui, B.; Wei, D.; Zhao, Q.; Luo, N.; Feng, Y. Predicting the optimum range of feed flow rate in a hydrocyclone using the method combined flow pattern and equation model. Powder Technol. 2017, 319, 279–288. [Google Scholar] [CrossRef]
  30. Zhang, C.; Cui, B.; Wei, D.; Lu, S. Effects of underflow orifice diameter on the hydrocyclone separation performance with different feed size distributions. Powder Technol. 2019, 355, 481–494. [Google Scholar] [CrossRef]
  31. Murthy, Y.R.; Bhaskar, K.U. Parametric CFD studies on hydrocyclone. Powder Technol. 2012, 230, 36–47. [Google Scholar] [CrossRef]
  32. Hwang, K.J.; Hwang, Y.W.; Yoshida, H. Design of novel hydrocyclones for improving fine particle separation using computational fluid dynamics. Chem. Eng. Sci. 2013, 85, 62–68. [Google Scholar] [CrossRef]
  33. Kelsall, D.F. A Study of the Motion of Solid Particles in a Hydraulic Cyclone. Trans. Inst. Chem. Eng. 1952, 30, 87–108. [Google Scholar]
  34. Frachon, M.; Cilliers, J.J. A general model for hydrocyclone partition curves. Chem. Eng. J. 1999, 73, 53–59. [Google Scholar] [CrossRef]
  35. Delgadillo, J.A. Modelling of 75- and 250-mm Hydrocyclones and Exploration of Novel Designs Using Computational Fluid Dynamics; The University of Utah: Salt Lake City, UT, USA, 2006. [Google Scholar]
Figure 1. Hydrocyclone structure and dimensions.
Separations 12 00149 g001
Figure 2. Hydrocyclone mesh generation.
Separations 12 00149 g002
Figure 3. Mesh independence verification.
Separations 12 00149 g003
Figure 4. Comparison of experimental and simulated values.
Separations 12 00149 g004
Figure 5. Comparison of the measured and simulated partition curves.
Separations 12 00149 g005
Figure 6. Effect of vortex finder wall thickness on static pressure distribution.
Separations 12 00149 g006
Figure 7. Variation of tangential velocity in ZX plane.
Separations 12 00149 g007
Figure 8. Variation of tangential velocity along the diameter line.
Separations 12 00149 g008
Figure 9. Effect of vortex finder wall thickness on hydrocyclone radial velocity.
Separations 12 00149 g009
Figure 10. Radial velocity distribution along the diameter line.
Separations 12 00149 g010
Figure 11. Influence of vortex finder wall thickness on axial velocity.
Separations 12 00149 g011
Figure 12. Radial velocity profile across the diameter.
Separations 12 00149 g012
Figure 13. Wall thickness dependence of split ratio.
Separations 12 00149 g013
Figure 14. LZVV variation with vortex finder wall thickness.
Separations 12 00149 g014
Figure 15. Velocity field characteristics under different wall thickness.
Separations 12 00149 g015
Figure 16. Grade-efficiency curves affected by wall thickness.
Separations 12 00149 g016
Figure 17. Cut size variation versus wall thickness.
Separations 12 00149 g017
Figure 18. Sharpness index as function of wall thickness.
Separations 12 00149 g018
Figure 19. Particle equilibrium radius under varying wall thickness.
Separations 12 00149 g019
Figure 20. Schematic diagram of classification test rig.
Separations 12 00149 g020
Table 1. Structural parameter.
ParameterValue
L0120 mm
L1180 mm
L275 mm
D75 mm
D025 mm
D112.5 mm
α20°
Table 2. Particle size distribution of feed material.
Particle Size Range/μmMean Size/μmYield/%
0~2117.42
2~32.512.13
3~5413.69
5~107.54.38
10~1512.512.63
15~2017.55.36
20~2522.57.62
25~3027.511.35
30~4537.56.29
45~6057.59.13
Total 100
Table 3. The influence of vortex finder wall thickness on pressure loss is presented.
TypeValue
5 mm62.3%
10 mm53.6%
15 mm43.2%
Table 4. Material particle size composition.
Size/μmInterval/%Positive Cumulative Content/%
0~93.196.16
9~199.1312.32
19~3511.3223.64
35~5821.3344.97
58~8628.2973.26
>8626.74100
Table 5. Separation efficiency comparison.
TypeOutlet Concentration//%Underflow Content of-20 μm/%Quality Efficiency/%Quantity Efficiency/%
5 mm85.127.6842.1387.36
10 mm84.666.6943.9887.02
15 mm72.523.7149.5686.22
Table 6. Underflow particle size comparison.
5 mm10 mm15 mm
Size/μmYield/%Content/%Yield/%Content/%Yield/%Content/%
0~95.095.094.624.623.363.36
9~1910.0815.178.1112.736.9310.29
19~3519.1134.2816.9329.6615.2325.52
35~5833.1667.4439.5269.1843.2268.74
58~8625.3692.8026.9996.1728.9397.67
>867.201003.831002.33100
Table 7. Overflow particle size comparison.
5 mm10 mm15 mm
Size/μmYield/%Content/%Yield/%Content/%Yield/%Content/%
0~926.3926.3928.8628.8630.1130.11
9~1928.9655.3531.2260.0832.2862.39
19~3510.0165.369.3269.408.1270.51
35~5829.9695.3227.7697.1623.3293.83
58~862.1397.452.0299.181.9295.75
>862.551000.821004.25100
Disclaimer/Publisher’s Note: The statements, opinions and data contained in all publications are solely those of the individual author(s) and contributor(s) and not of MDPI and/or the editor(s). MDPI and/or the editor(s) disclaim responsibility for any injury to people or property resulting from any ideas, methods, instructions or products referred to in the content.

