Article

Repurposing Portable Gas Chromatograph–Mass Spectrometers for Detecting Volatile Organic Compound Biomarkers in Urine Headspace

1
Integrated Nanosystems Development Institute, Indiana University Indianapolis, Indianapolis, IN 46202, USA
2
Department of Chemistry & Chemical Biology, Indiana University Indianapolis, Indianapolis, IN 46202, USA
3
Department of Intelligent Sensor Solutions, INFICON Inc., East Syracuse, NY 13057, USA
4
Department of Biomedical Engineering & Informatics, Indiana University Indianapolis, Indianapolis, IN 46202, USA
*
Authors to whom correspondence should be addressed.
Separations 2025, 12(5), 118; https://doi.org/10.3390/separations12050118
Submission received: 21 March 2025 / Revised: 25 April 2025 / Accepted: 29 April 2025 / Published: 7 May 2025
(This article belongs to the Special Issue Chromatographic Analysis of Biomarkers)

Abstract

:
Volatile organic compounds (VOCs) in urine headspace are potential biomarkers for different medical conditions, as canines can detect human diseases simply by smelling VOCs. Because dogs can detect disease-specific VOCs, gas chromatography–mass spectrometry (GC–MS) systems may be able to differentiate medical conditions with enhanced accuracy and precision, given they have unprecedented efficiency in separating, quantifying, and identifying VOCs in urine. Advancements in instrumentation have permitted the development of portable GC–MS systems that analyze VOCs at the point of care, but these are designed for environmental monitoring, emergency response, and manufacturing/processing. The purpose of this study is to repurpose the HAPSITE® ER portable GC–MS for identifying urinary VOC biomarkers. Method development focused on optimizing sample preparation, off-column conditions, and instrumental parameters that may affect performance. Once standardized, the method was used to analyze a urine standard (n = 10) to characterize intra-day reproducibility. To characterize inter-day performance, n = 3 samples each from three volunteers (and the standard) were analyzed each day for a total of four days (n = 48 samples). Results showed the method could detect VOC signals with adequate reproducibility and distinguish VOC profiles from different volunteers with 100% accuracy.

1. Introduction

Canines have the remarkable capability of being able to be trained to detect volatile organic compounds (VOCs) in noninvasive biological sample types for applications in medical diagnosis/screening, because they have an ultrasensitive sense of smell and an olfactory system with over 300 unique receptors [1,2,3]. Historically, canines have been used in various forensic applications for VOC detection of explosives, illegal drugs, and human decomposition odors. The wide-ranging capabilities of the canine olfactory system, including the noninvasive detection of medical conditions, has inspired researchers across the globe to interrogate VOC signals quantitatively using state-of-the-art analytical instrumentation [4,5,6]. VOCs are defined as relatively low-molecular-weight molecules with high vapor pressures that exist in the gas phase at room temperature. Volatiles found in nature have diverse sources, including but not limited to, consumer products (paints, cleaning products, building materials) and industrial processes (petroleum extraction) [7,8]. Beyond synthetic and manmade origins, volatiles are also emitted by plants as a form of cellular communication [9]. In humans, VOCs are expressed in noninvasive biological sample types, including breath, sweat and urine [10]. Volatile compounds are most widely studied in breath, but urine presents several advantages as it is easier to collect and contains a relatively high concentration of individual VOCs [4].
VOCs in noninvasive biological sample types have been investigated for biomarker discovery purposes regarding an array of medical conditions including respiratory infections [11,12], different types of cancer [13,14], and metabolic diseases [15,16,17]. These analytes can have an exogenous source through environmental exposure but can also be produced through endogenous metabolic pathways [18]. Many different studies indicate unique VOCs and functional groups to be clinically relevant biomarkers. The gold standard for identification/quantification is gas chromatography–mass spectrometry (GC–MS), because it has high capability for chromatographically separating, structurally elucidating (through electron or chemical ionization), and quantifying volatile analytes [19]. Although highly accurate, GC–MS is considered an offline technique because it requires additional steps in sample preparation prior to MS analysis. For a more rapid analysis, online MS techniques with ambient ionization modes can be utilized. One of these techniques, termed ion mobility mass spectrometry (IMS), is currently emerging as a reliable online method for VOC biomarker discovery [20,21]. Other online methods for the analysis of VOC biomarkers also include selected-ion flow-tube mass spectrometry (SIFT-MS) [22] and proton-transfer-reaction mass spectrometry (PTR-MS) [23]. Although these methods are rapid and highly accurate, GC–MS assays tend to have higher degrees of resolution and are therefore better equipped for analysis of the most complex profiles [24].
Across both online and offline MS techniques, instrumentation tends to occupy a relatively large footprint and requires trained personnel to run biological assays, in turn, making them insufficient clinical tools for point-of-care screening/diagnosis. Progress has been made in the development of nanomaterial-based sensor arrays (electronic noses, or e-Noses) that can differentiate VOC biomarker profiles corresponding to different medical conditions [25,26,27], but generally these devices need machine learning to distinguish meaningful patterns and do not have the required chemo-selectivity to distinguish individual biomarkers within a complex sample matrix. Portable GC–MS systems, initially developed in the 1990s, are miniaturized systems that permit analyses outside of a laboratory setting [28]. Unlike e-Nose devices, portable GC–MS systems not only retain a high degree of chemical selectivity but also allow for the accurate identification of unknown analytes. Over the years, commercialized portable GC–MS instruments have become available, but currently, only two systems have stood the test of time (Griffin™ G510 and INFICON HAPSITE® ER). Different portable GC–MS instruments have unique features, but all systems leverage low thermal mass (LTM) GC technology to permit faster heating/cooling rates, all the while reducing power consumption requirements [29].
The HAPSITE® ER, manufactured by INFICON inc. (East Syracuse, NY, USA), is a state-of-the-art portable GC–MS system that weighs about 50 pounds and implements LTM GC for the analysis of VOCs. The system is equipped with internal and external power sources, along with internal gas canisters for nitrogen (the mobile phase) and an internal standard (to monitor any instrumental drift). This system is also capable of introducing sample types through diverse modules (headspace, solid phase microextraction (SPME), thermal desorption, etc.) [30], but these must be purchased. The air probe that is interfaced with the instrument (without the purchase of additional modules) is the most straightforward method to introduce VOCs for analysis. The HAPSITE® ER and other devices were designed for users to detect hazardous analytes in different applications including environmental monitoring, emergency response, manufacturing/processing, and more [29]. The purpose of the current study is to repurpose portable GC–MS instruments for quantifying VOC biomarkers emanating from urine headspace. To develop a standardized method, sample pretreatment and instrumental parameters were optimized to increase chromatographic resolution and signal-to-noise ratios. The optimized method was benchmarked by analyzing a high number of sample replicates from urine specimens collected from three laboratory volunteers, as well as a standard solution of urine.

2. Materials and Methods

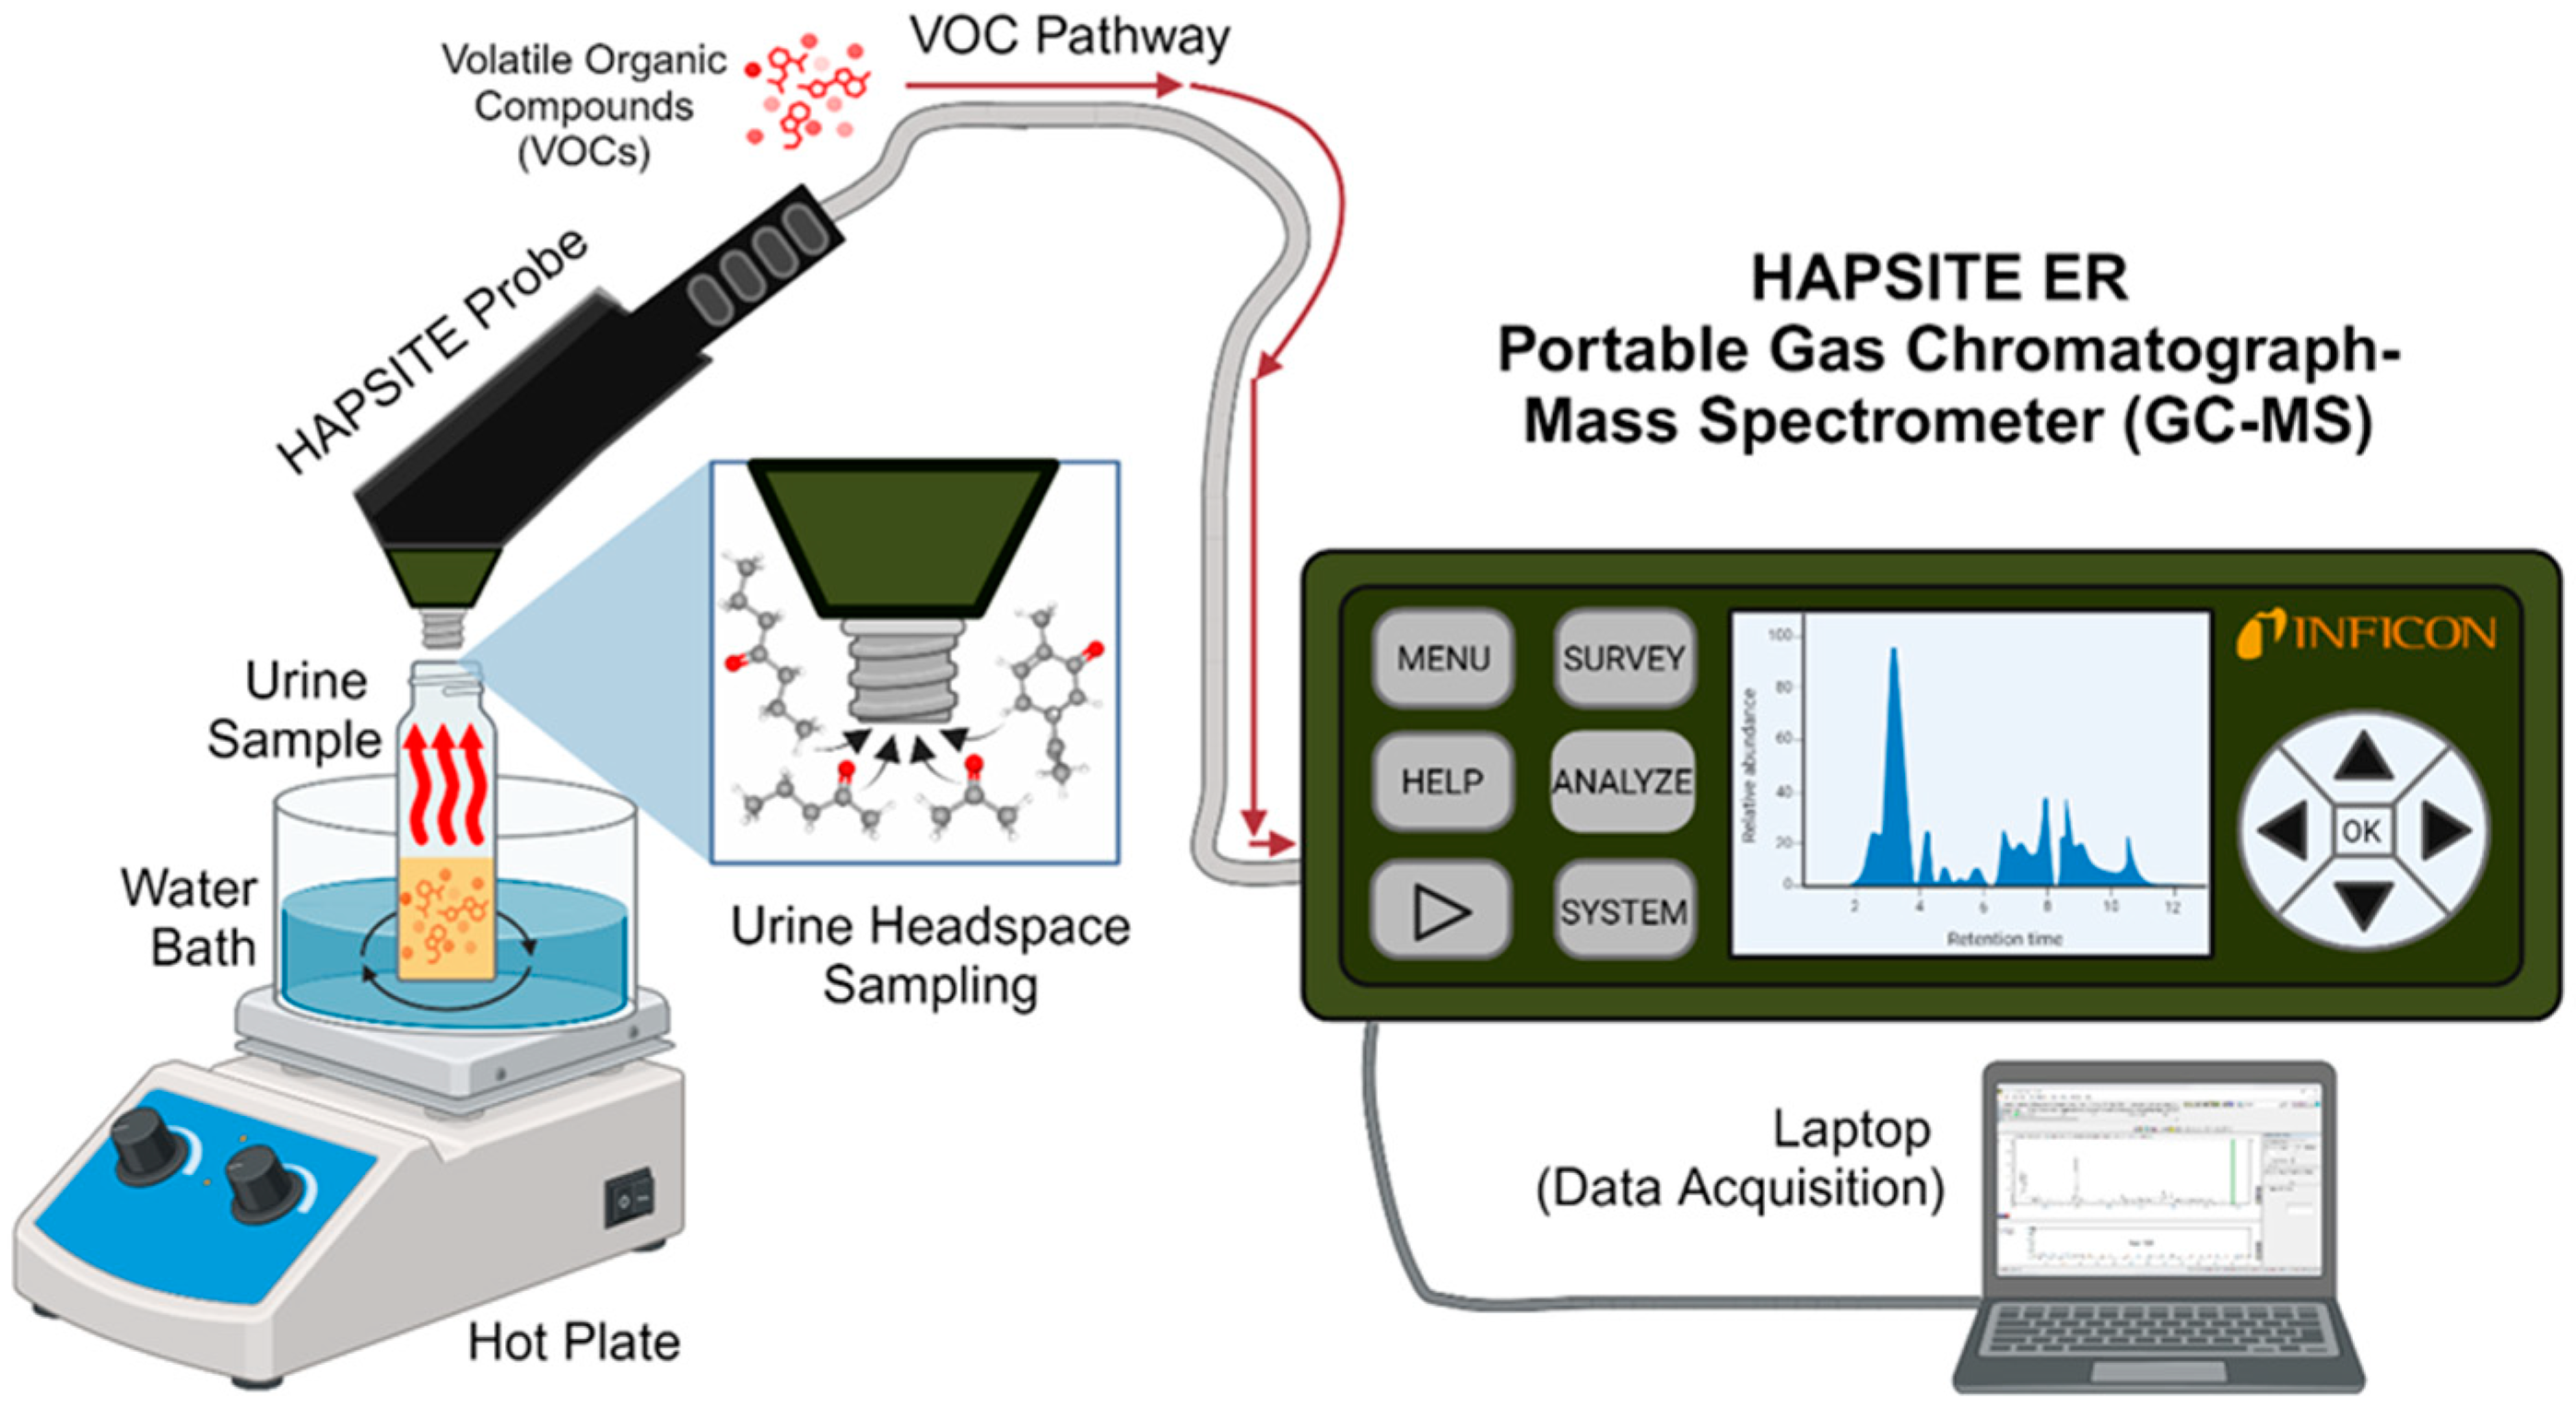
2.1. Materials and Instrumentation

Analytical reference standards in this study included the use of UTAK (Valencia, CA, USA) drug-free urine, which was purchased from Thermo Fisher Scientific (Waltham, MA, USA). Materials needed for urine processing and storage included polypropylene cups, sodium chloride (99.85% pure), sodium hydroxide (50% wt. in solution, nitrogen flushed extra pure), pH paper, and Parafilm (Thermo Fisher Scientific). Headspace vials (10 mL) with screw-on caps were purchased from Restek (Bellefonte, PA, USA) or Agilent (Santa Clara, CA, USA) and used to store aliquoted urine samples. A Thermo Fisher Scientific Forma 900 Series −80 °C freezer was utilized to store the urine samples until analysis. Hot magnetic stir plates were purchased from Thermo Fisher Scientific and micro-stir bars were attained from VWR, inc. (West Chester, PA, USA), which were used in heating/agitating the urine samples. The temperature of the water bath/urine sample was controlled using an incubator thermometer (Thermo Fisher Scientific). To sample and instrumentally analyze volatiles emanating from urine headspace, a HAPSITE® ER Chemical Identification System manufactured by INFICON inc. was implemented. The system is equipped with a DB-1 miniaturized GC column (15 m in length, 0.25-mm internal diameter, and 1-micron film thickness). The HAPSITE® ER also contains a Tri-Bed Concentrator Tube, which collects VOCs prior to injection onto the column.

2.2. Urine Sample Acquisition and Processing

For the UTAK standard urine, initially ~100 mL of sample was aliquoted into a urine storage cup and stored in a −80 °C freezer. For samples from lab volunteers (Indiana University IRB # 15542), first-morning urine was collected into a storage cup and subsequently transported to the lab and stored at −80 °C. Next, samples were thawed, aliquoted into headspace vials using the optimized volume, and stored in the freezer until subsequent GC–MS analysis. Immediately prior to analysis, the urine was thawed, saturated with salt (NaCl), and pH corrected to pH 7 using 1.9 M NaOH. Excess urine aliquots were used to titrate the solution and determine the quantitative amount of sodium hydroxide needed for proper pH correction. This is an important step, as previous studies have shown that varying the pH of the sample can significantly impact headspace VOC profiles detected by GC–MS [31]. After the sample pretreatment, the headspace vial was incubated in a water bath at an optimized temperature and agitation speed for an ideal amount of time. For all optimization experiments (on- and off-column), UTAK standards or samples from a single volunteer were analyzed in triplicate for each condition studied. Regarding assessment of intra-day performance and variability (after method optimization), n = 10 replicates of the UTAK standard were aliquoted and analyzed. For inter-day assessments, at least n = 12 aliquots were prepared for the three laboratory volunteers, as well as the UTAK standard (n = 48 samples in total).

2.3. Probe-Based Sampling and GC–MS Analysis

Once samples had been pretreated and heated/agitated to partition VOCs in the urine sample headspace, the HAPSITE® ER air probe was used to sample analytes and introduce them into the GC–MS for analysis. Immediately after sample pretreatment procedures, the headspace vial containing the urine sample was removed from the water bath, the cap was unscrewed, and the specimen was placed under the air probe, which was immobilized using a clamp on a ring stand (see Figure 1) [32]. The distance between the top of the vial and the bottom of the probe should be negligible. Using the probe, a pump was used to transport 100 mL of gas into the sampling device over the course of one-minute, which was collected on a Tri-Bed Concentrator Tube (containing a carbon-based sorbent material). Over the course of sampling, the lines of the air probe were maintained at 40 °C. After one minute of collection, the VOCs captured on the sorbent tube were desorbed into the system for 2.5 min at a pressure that corresponds to the GC flow rate (1.5 mL/min). For the first 8 s of desorption, the pre-concentrator tube was heated at a power of 9.5 Watts, followed by a 30 s desorption step at a power of 2.5 Watts. The GC run began after this 30 s period of initial desorption. After 2.5 min, purging of the pre-concentrator was finalized and the mobile phase was transported directly toward the front end of the column.
Although numerous probe and GC–MS parameters were explored, the instrument was pre-loaded with previously optimized methods from the company. As a starting point for method development, the team chose the standard method that is dedicated to analyzing VOCs at the lowest concentration levels using the Tri-Bed Concentrator. Using the standard method, during the entirety of analysis, the Tri-Bed Concentrator elbow was maintained at 70 °C, with the GC Heated Line (GCHL) at 70 °C, the membrane at 80 °C, and the valve oven at 70 °C. High-temperature methods were also explored and entailed maintaining the pre-concentrator elbow at 110 °C, the GCHL at 110 °C, the membrane at 120 °C, and the valve oven at 110 °C. It should be noted that to facilitate efficient permeation of VOCs from the end of the GC column to the MS detector through the membrane, it is very important to maintain a pressure difference. For both methods, the GC pressure was approximately 85 kPa, but the standard method has MS total pressure equal to ≈2 × 10⁻⁴ Pa and the high-temperature method has a MS pressure equal to ≈3 × 10⁻⁴ Pa. The initial chromatographic protocol entailed maintaining the oven at 60 °C for one minute, followed by a 6 °C/min ramp to 80 °C, a 12 °C/min ramp to 120 °C, and a final ramp of 26 °C/min to 180 °C (final hold time of two seconds). The protocol was modified to extend the final ramp temperature to 200 °C with a hold time of four minutes to permit the analysis of less volatile or even semi-volatile compounds during optimization. Additionally, the MS scanning range was slightly expanded to lower mass ranges (m/z 41-300) to ensure that highly volatile analytes were detected (i.e., acetone). Prior to the optimization of GC and MS parameters, variables relating to the air probe were first explored.
Even though the option to change the pumping volume and speed is available, the rate of the probe pump is constant and cannot be varied (100 mL/min). Experiments were undertaken to explore the impact of dynamic headspace volume, but deviating from the standard values of 100 mL did not increase sensitivity or reproducibility. The probe temperature was held at 40 °C, as experiments increasing the temperature to the maximum limit (60 °C) did not improve or deteriorate the quality of the results. Beyond extending the chromatographic runs, experiments were undertaken to determine if slowing ramps down (to 1 °C/min) within the oven temperature program could potentially increase chromatographic resolution as well as the number of VOCs detected. Additionally, the temperature of the membrane, heated lines and valve oven were alternated between standard and high-temperature methods. This is significant, as high-temperature modes may be more ideal for the analysis of relatively larger VOCs and semi-volatiles. Finally, although the MS was operated in full-scanning mode from m/z 41 to 300, the instrument is also capable of operating in limited scanning modes including selected ion monitoring (SIM). These techniques were also explored to increase method sensitivity/reproducibility. It should also be noted that nitrogen was provided from an external gas tank at a constant flow rate (mobile phase). An internal canister was used to introduce the internal standard gases (1,3,5-tris-trifluoromethylbenzene (IS #1) and bromopentafluorobenzene (IS#2)) for quality control purposes.

2.4. Data Processing and Analysis

After GC–MS data were acquired on the HAPSITE® ER, chromatographic data were processed and analyzed using the on-board ER IQ software (HAPSITE ER IQ V2.40.002) (manufactured by INFICON Inc.). Using the data review tool within the software, GC–MS raw data can be visualized and even overlapped from sample to sample. In addition to qualitative analyses, chromatographic peak areas can also be integrated and quantified. To analyze the data in most cases, total ion chromatograms (TICs) were subject to peak identification and integration within the software. In all cases, instrument and method performance were evaluated by quantitatively comparing the total number of peaks detected and the signal of specific VOCs in the urine samples. These peaks were searched against the NIST mass spectral library for preliminary identification. In certain cases, specifically regarding the qualification of reproducibility between different volunteers, extracted ion chromatograms (EICs) were used to integrate and quantify coeluting analytes (this will be discussed further in the Results and Discussion section). For the initial experiments, parameters were optimized to increase the number of VOCs and their associated integrated signals. Once the method was optimized, UTAK standards (n = 10 samples) were ran on a single day to qualify intra-day performance and reproducibility. For the qualification of inter-day performance, at least n = 3 replicates from three different lab volunteers (along with a UTAK standard) were analyzed each day for a total of four days (n = 48 samples in total). For all experiments benchmarking inter-day performance, TIC or EIC signals were normalized relative to the internal standard with the highest signal (IS #2). Inter-day and intra-day VOC reproducibility was determined for each of the analytes by calculating and comparing relative standard deviation (RSD) values. Additionally, integrated signals were autoscaled (z-scored) to generate hierarchical heatmaps and conduct principal component analysis (PCA) in Matlab (Natick, MA, USA).

3. Results and Discussion

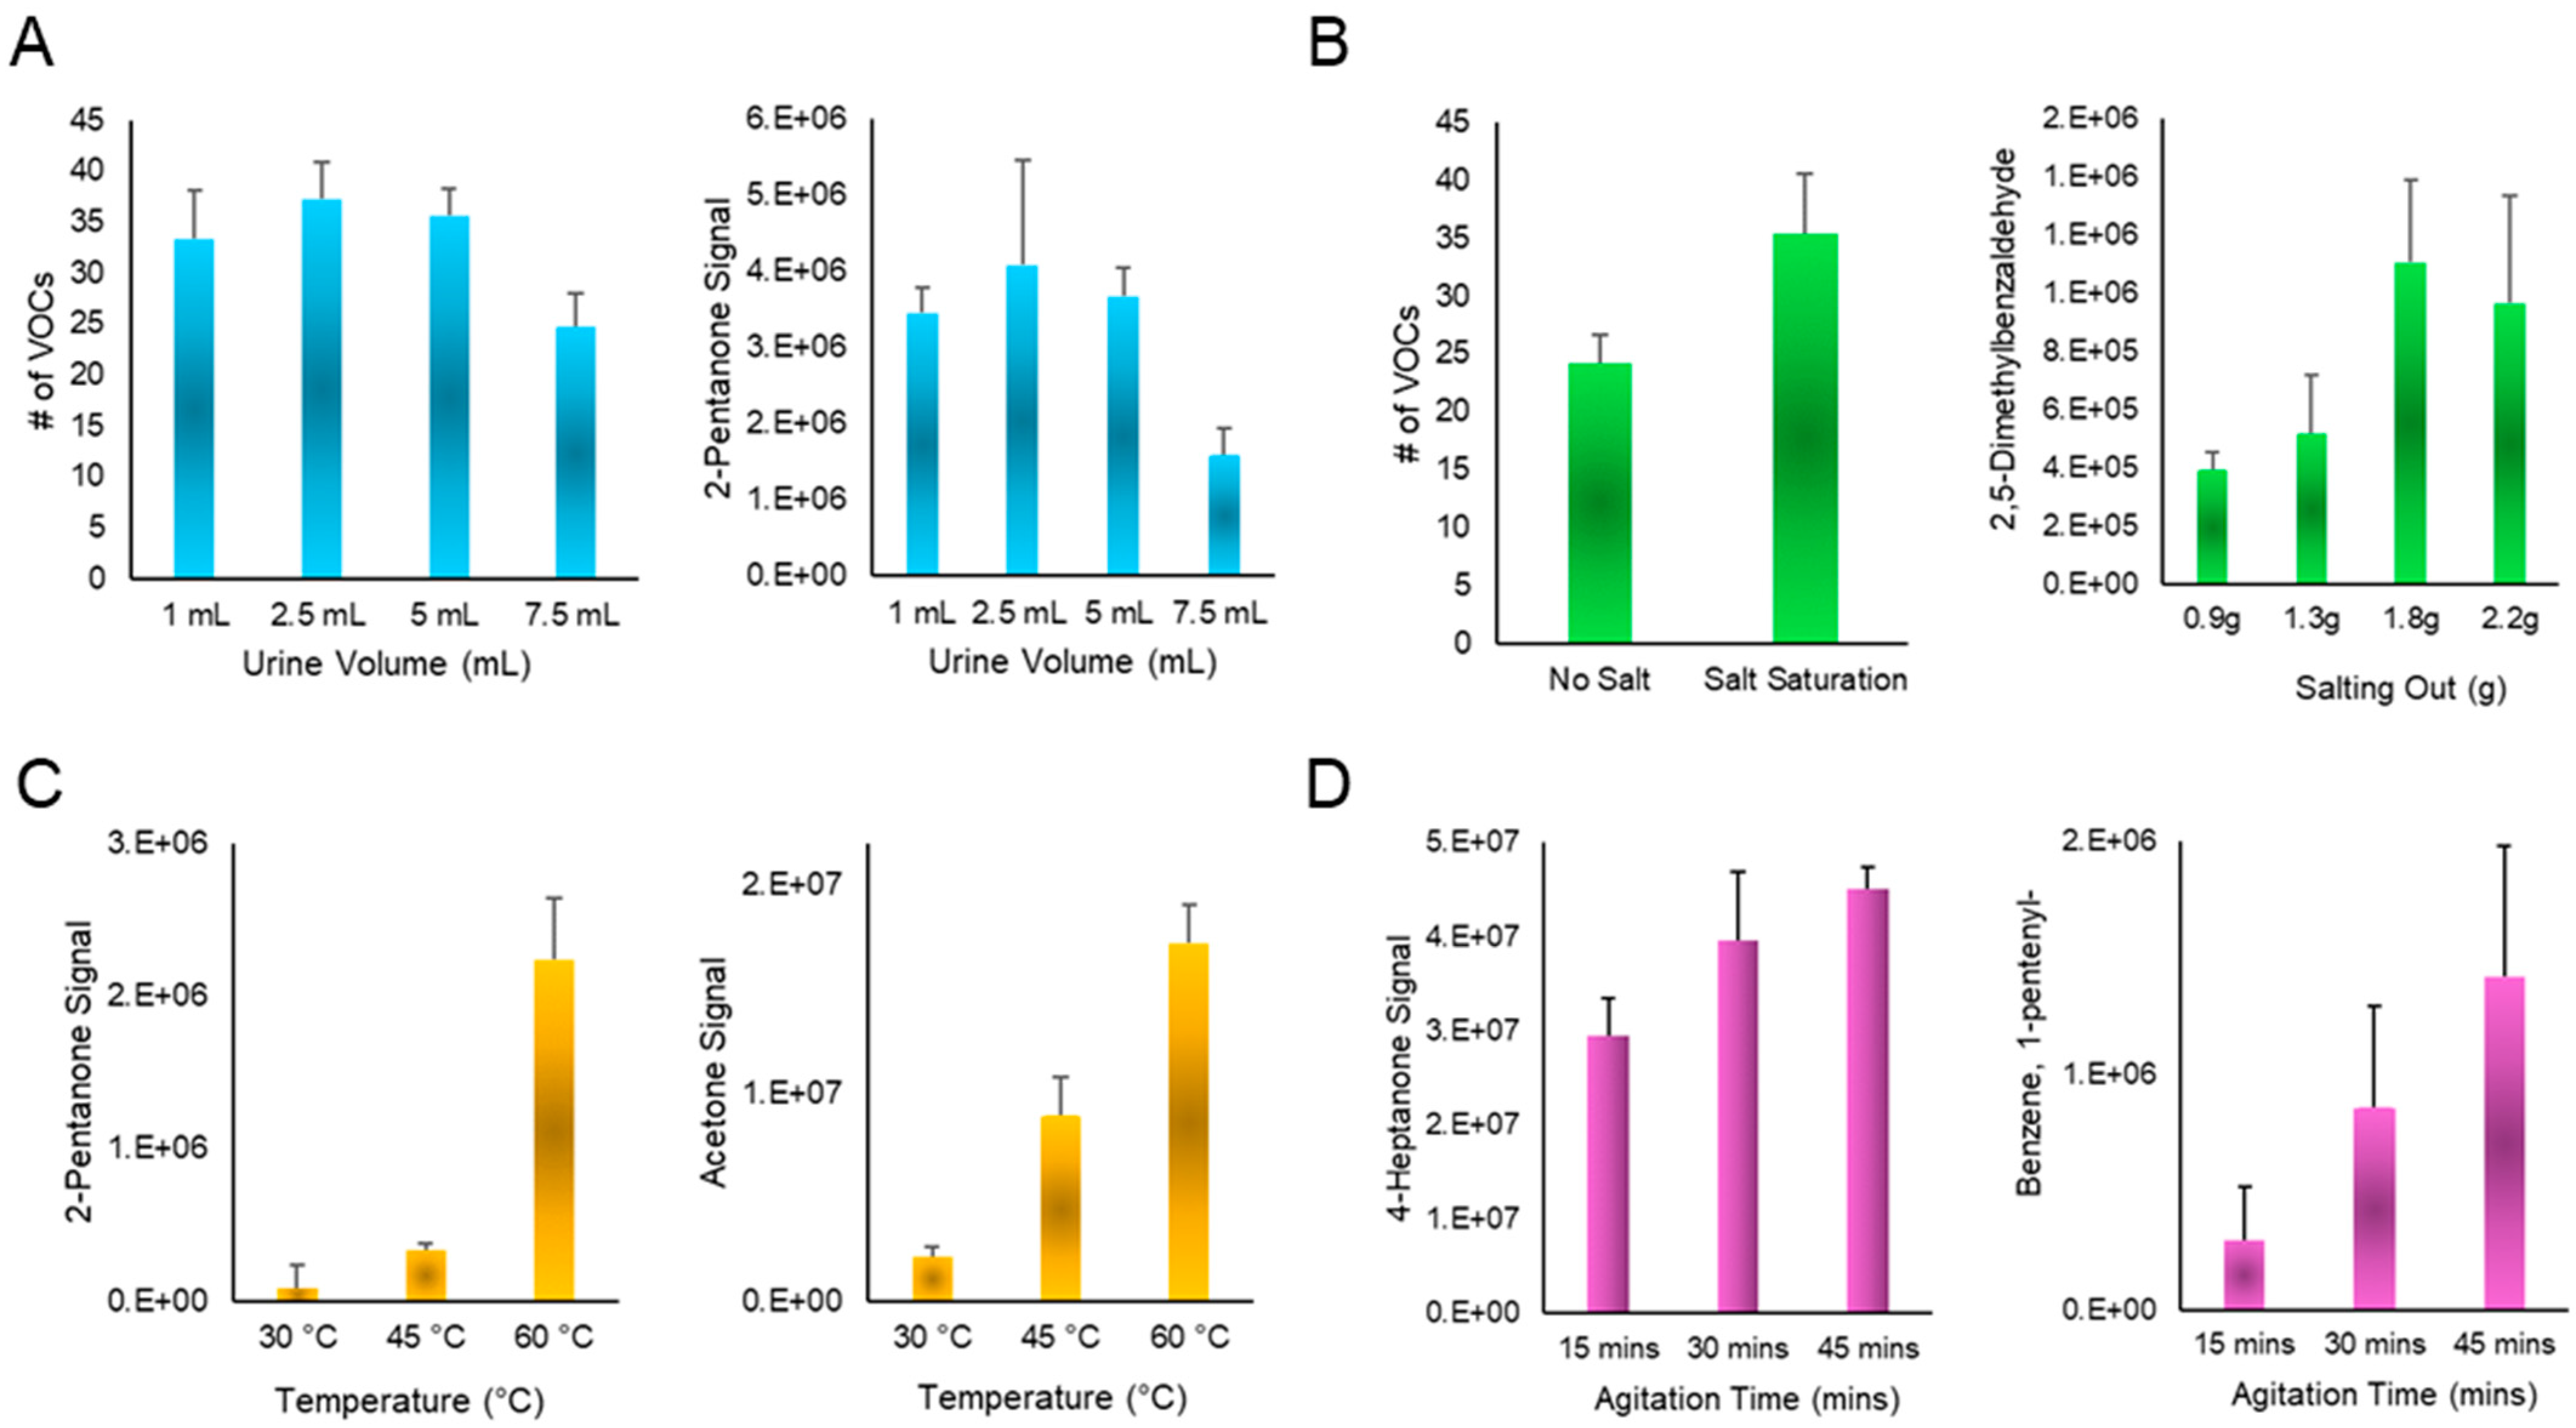
3.1. Optimization of Pretreatment Procedures

Prior to optimizing instrumental variables, off-column parameters were explored to ensure a high concentration of urinary VOCs in the headspace that can be sampled using the air probe (Figure 1). First, different volumes of the urine specimen aliquoted into headspace vials were explored (1 mL, 2.5 mL, 5 mL and 7.5 mL). These data showed that the total number of compounds among the different urine volumes was equivalent, except for 7.5 mL, which showed a significant decrease (Figure 2A). Because a handful of individual compounds showed slightly increased sensitivity/reproducibility with a 5 mL volume, this was determined optimal. Next, the effect of salting out (with pH correction to 7) was determined to increase the number of VOCs detected in the urine headspace. Salt addition was also studied in a quantitative fashion, with individual analytes showing positive correlations up to 1.8 g, which is the saturation point for 5 mL of urine. Salt addition beyond this amount showed no increases in sensitivity (Figure 2B). The temperature to which the urine was heated prior to sampling was also studied, with values ranging from 30 to 60 °C. Temperatures above this were not tested, as this could induce undesirable chemical reactions and modification of the native profile [33]. Nonetheless, individual analytes within the UTAK standard displayed increased sensitivity with temperatures up to 60 °C (Figure 2C). Agitation/heating time was also tested, and this showed that although the number of VOCs detected was somewhat equivocal between the times of 15 and 45 min, individual volatiles including 4-heptanone and 1-pententylbenzene showed increased sensitivity at the longest duration (Figure 2D). Finally, varying the agitation speed during heating did not significantly impact the number of VOCs detected nor the signal of unique analytes.

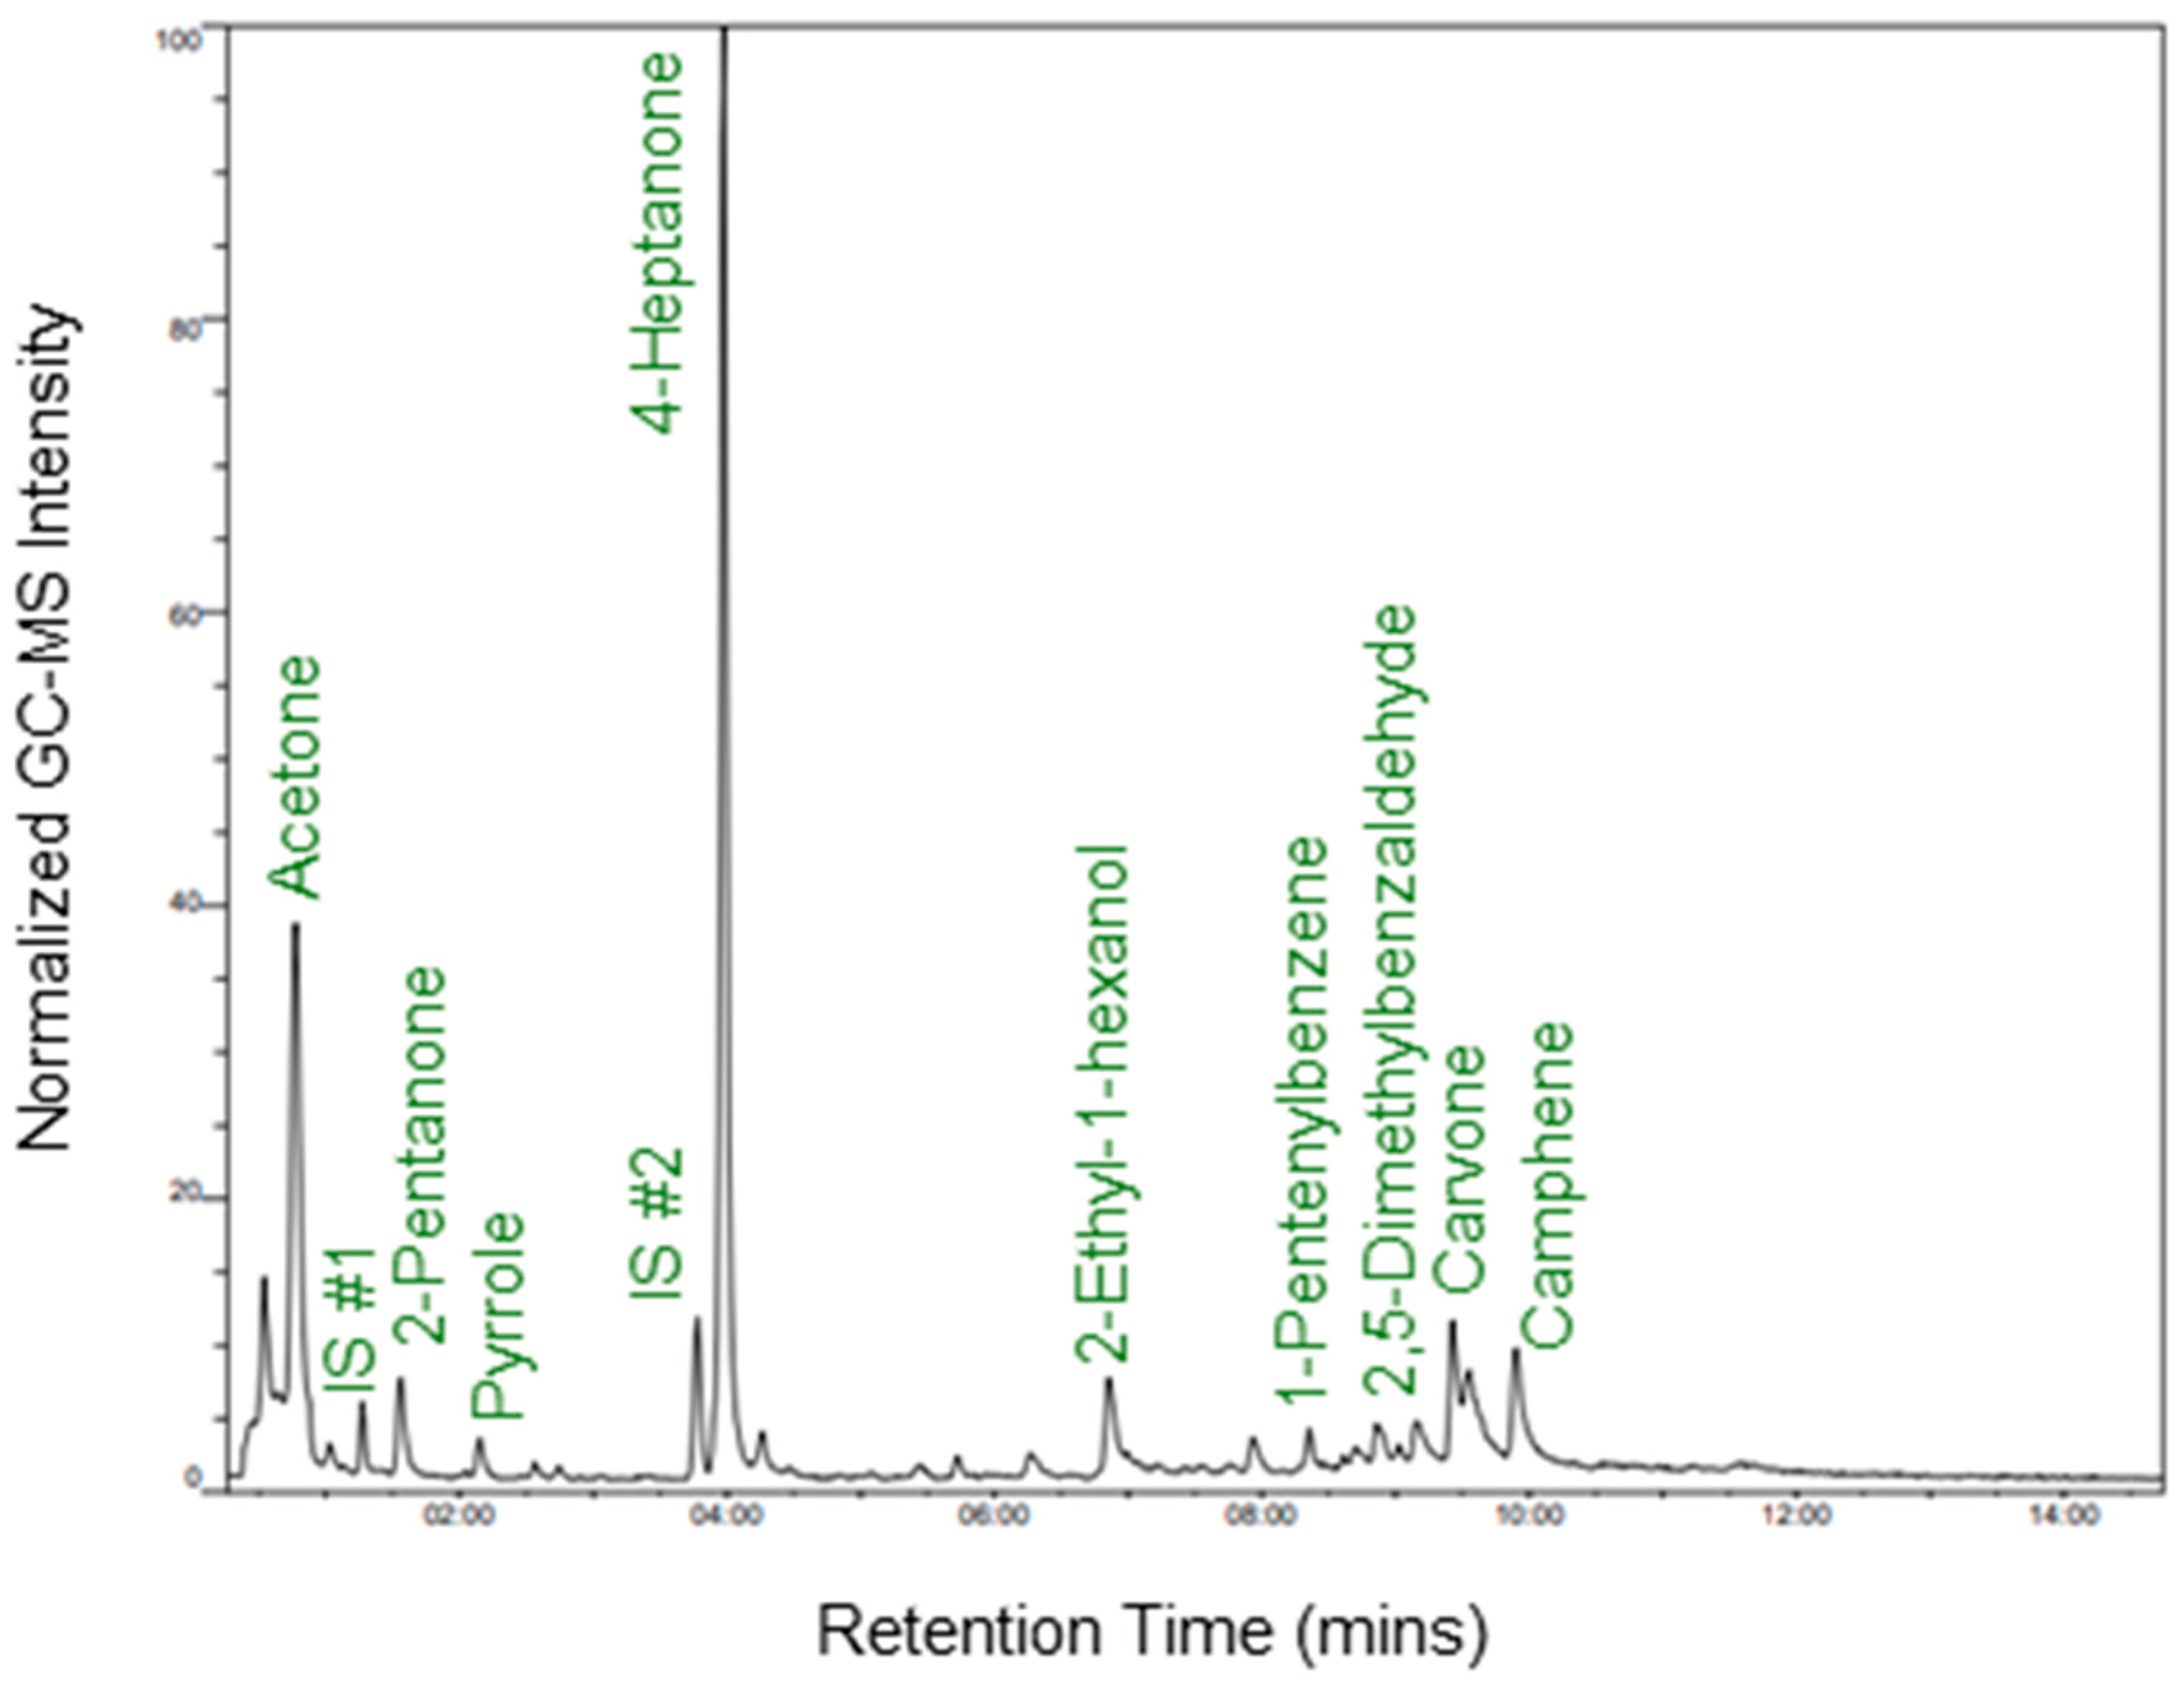
3.2. Exploration of Portable GC–MS Parameters

The team first sought to study instrumental parameters related to the air probe; if VOCs are not efficiently introduced into the GC–MS system, optimization of other parameters may be meaningless. The primary parameters for air probe optimization included the volume of gas sampled along with sampling time. Although both can be varied, the flow rate of sampling could not be changed, and therefore, the team held this constant at 100 mL/min. The standard sampling volume is 100 mL, and the team explored this parameter at higher and lower levels (50 mL and 200 mL, respectively). These experiments did not yield any significant differences regarding sensitivity or reproducibility. It should be noted that the urine sample headspace is only approximately 5 mL, and therefore the method can be considered as pseudo-dynamic with regard to headspace sampling. Given that the air probe is not well situated to analyze small volumes of gas (5 mL), the sampling regime must allow for proper airflow from the ambient environment. GC oven temperature programming was also explored, and the temperature ramps were reduced as described in the Methods section, but this did not show a significant increase in the number of compounds detected. This also increased the chromatographic run time to over 20 min, which is highly undesirable. Future experiments may be able to increase GC resolution (and the number of VOCs detected) by implementing alternative column types with different stationary phases.
Next, the team sought to explore standard and high-temperature methods for the membrane, heated lines, and valve oven. Standard methods up to this point have operated at temperatures 80 °C, 70 °C, and 70 °C, respectively. High-temperature methods may be more suitable for larger compounds including semi-volatiles, and use temperatures of 120 °C, 110 °C, and 110 °C, respectively. Comparison of these methods led to the realization that operating in high-temperature mode decreases the integrated signal for an array of urinary compounds including but not limited to 4-heptanone, acetone, camphene, carvone, 2-pentanone, and 2,5-dimethylbenzaldehyde (Figure 3A). Beyond urinary compounds, very interestingly, the internal standard gases also showed significantly reduced sensitivity using the high-temperature methods (Figure 3B). The reasoning for this is most likely because the membrane is composed of polydimethylsiloxane (PDMS), and it is generally accepted that at higher temperatures, volatiles do not partition into a hot PDMS membrane [34]. Additionally, the higher membrane temperatures induce a relatively higher MS total pressure (≈3 × 10⁻⁴ Pa from ≈2 × 10⁻⁴ Pa). Therefore, the pressure difference across the membrane is reduced in the high-temperature method and the VOCs may not permeate to the MS detector with the same efficiency. Regarding MS parameters, the team explored SIM modes for a handful of compounds previously detected in the optimization experiments. Although compounds had a reduced integrated signal in SIM given the lack of contribution of other fragmented ions, SIM did show the ability to reduce the signal of background or potentially interfering compounds. Therefore, the authors suggest that SIM may be useful in the future, after biomarkers for a given disease are initially screened in full-scan mode. Operation in SIM would be premature at this stage, as unique VOCs from different urine samples beyond the UTAK standard could be missed.

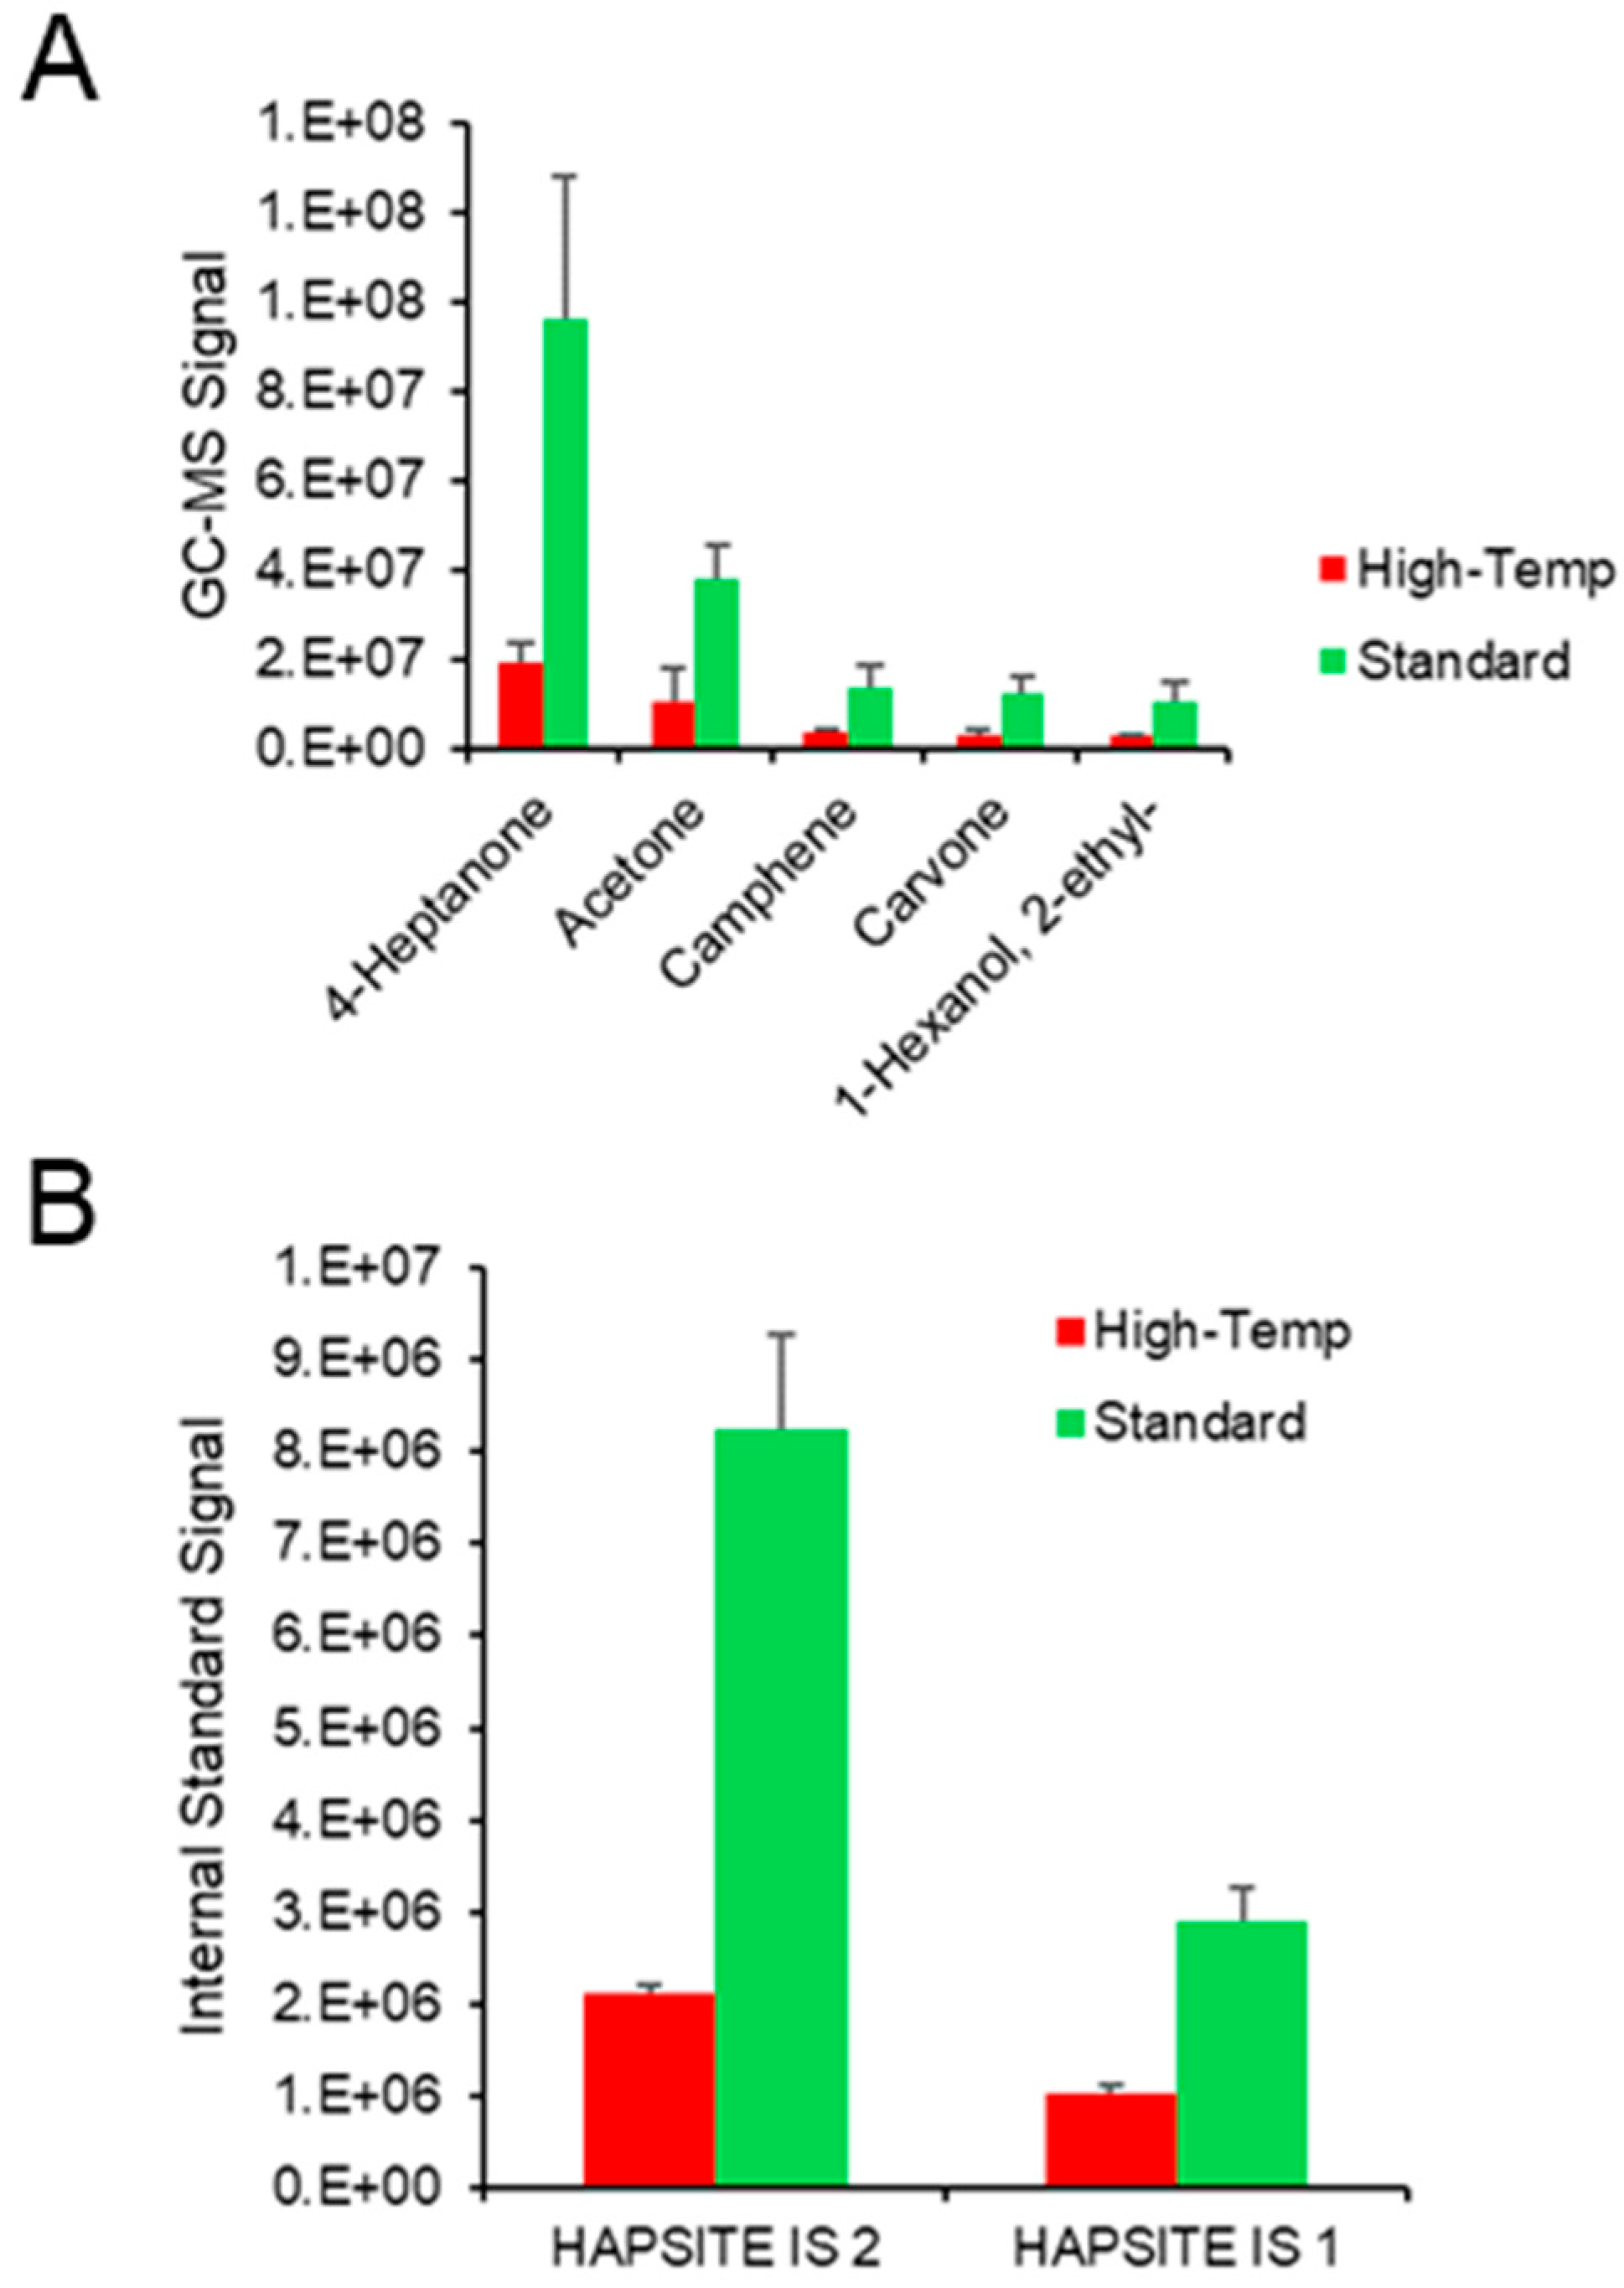
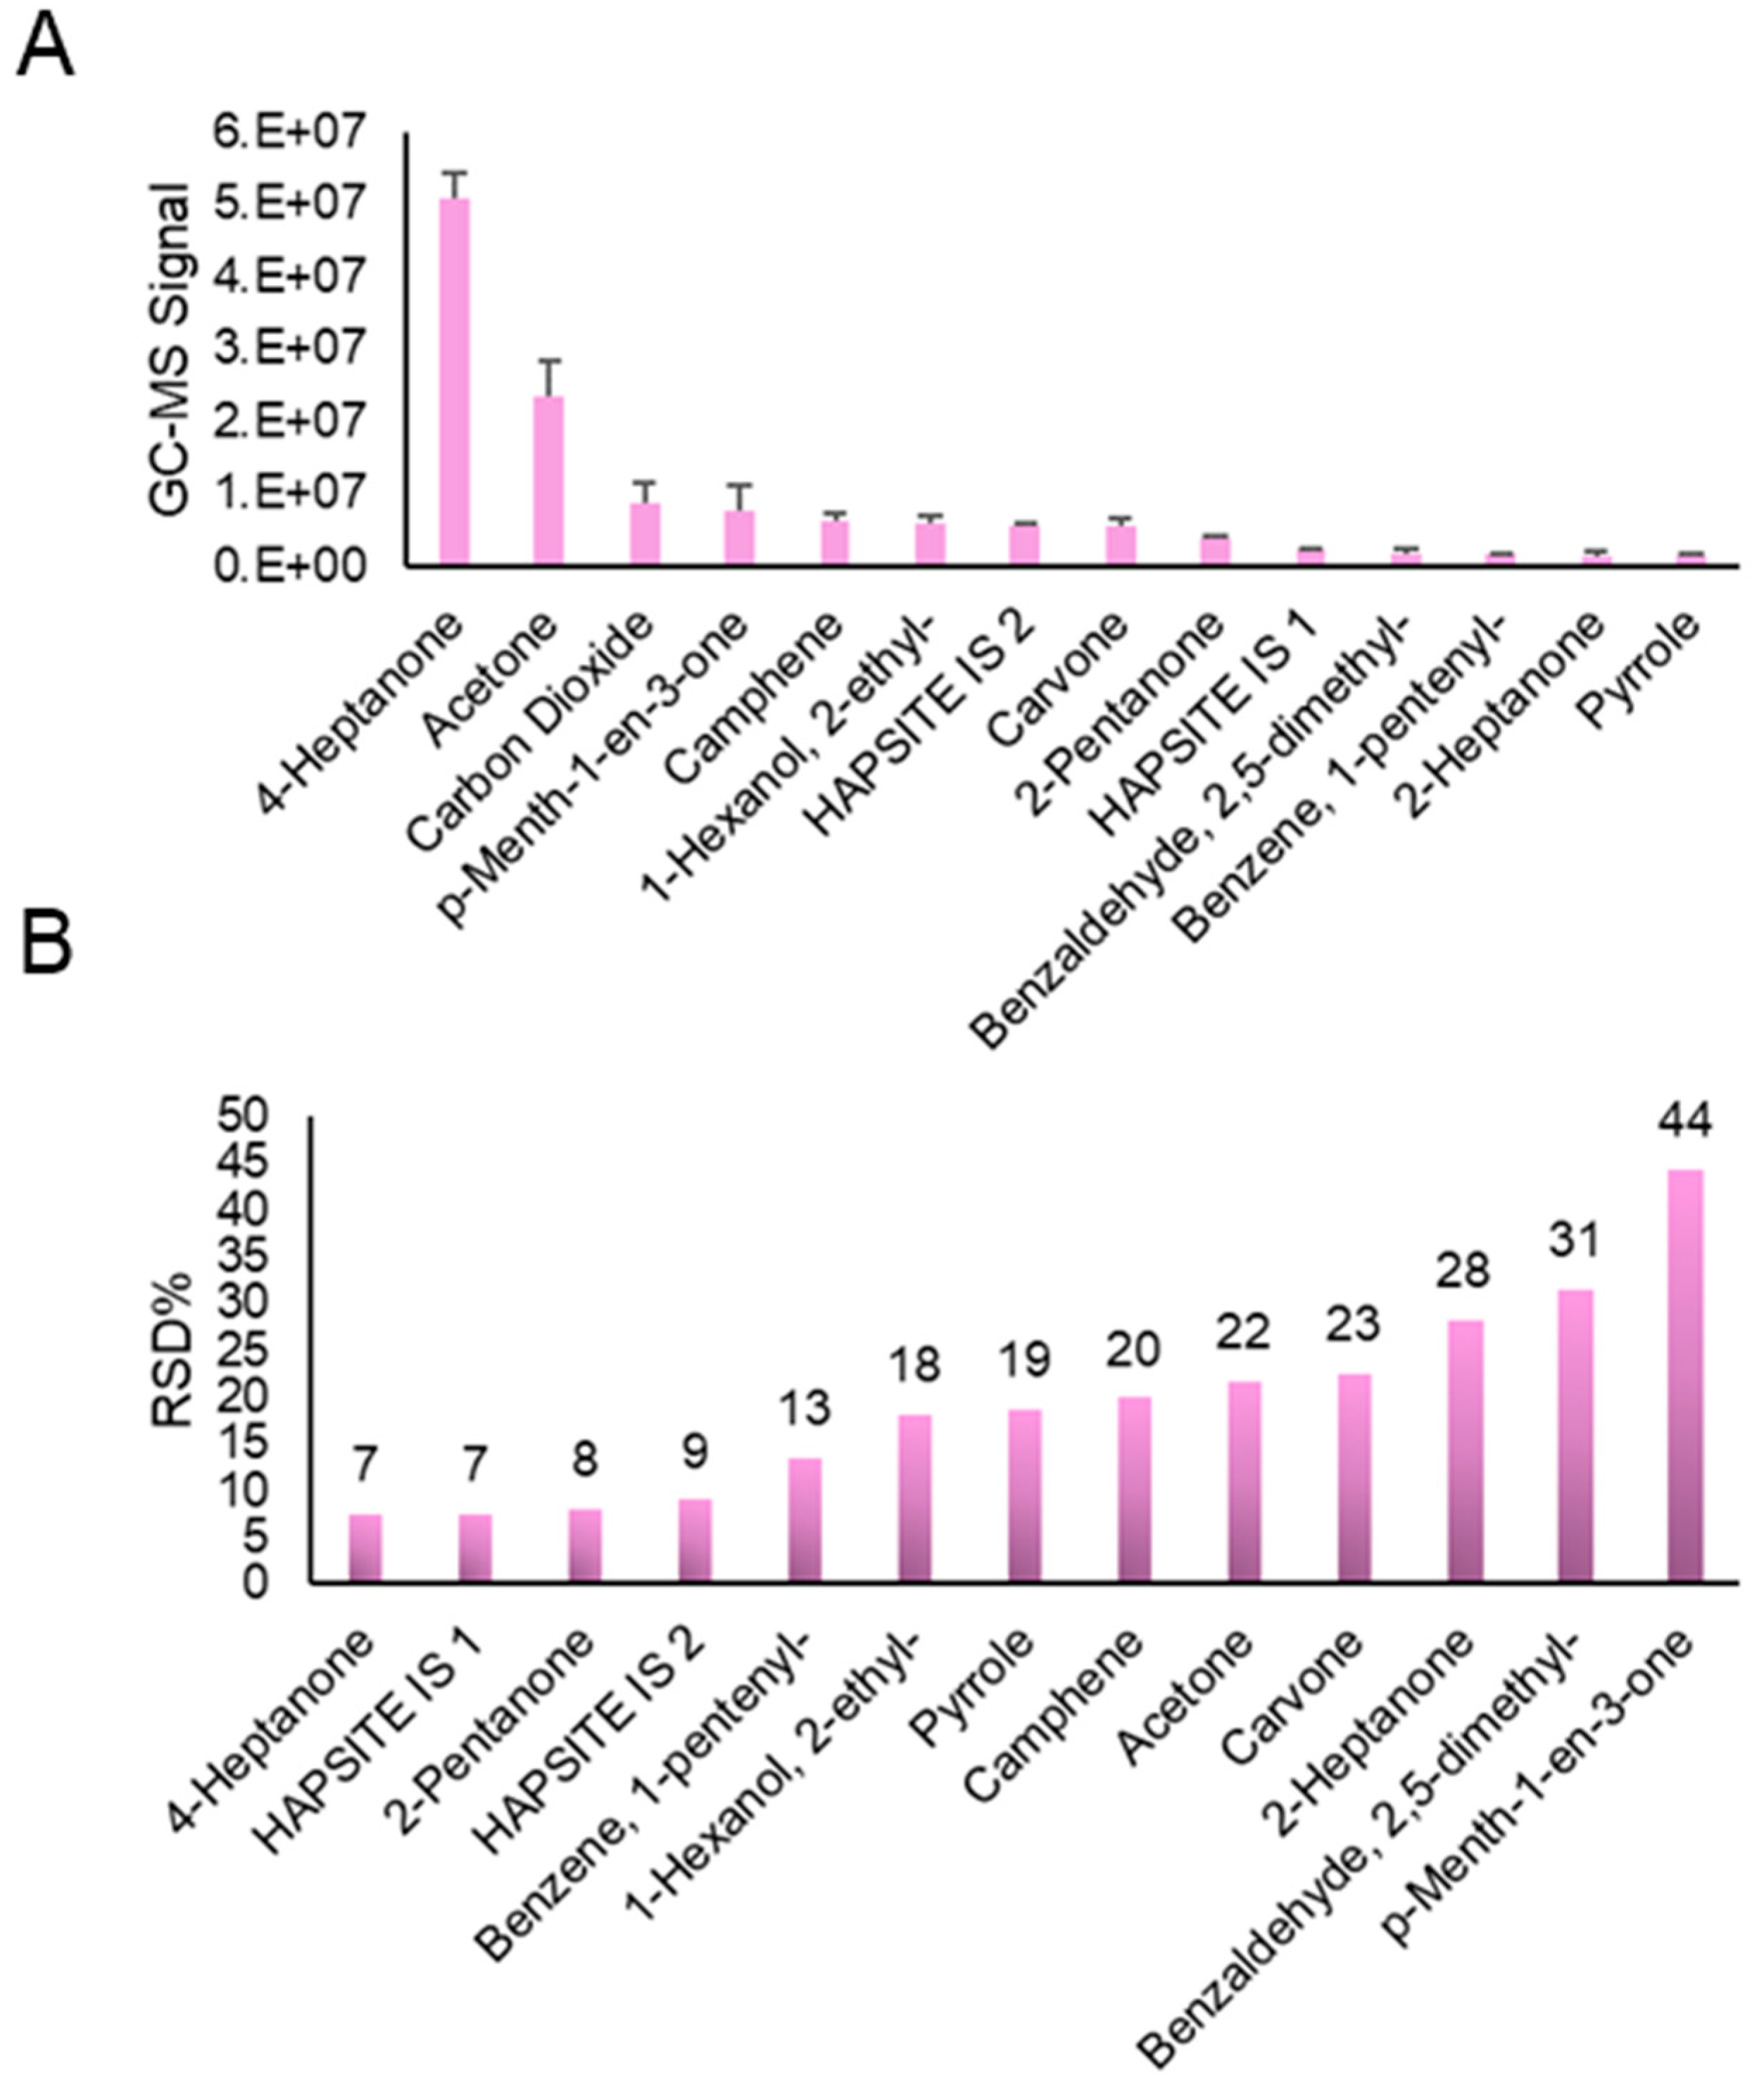
3.3. Benchmarking Intra-Day Reproducibility

Initially, to gain a deeper insight into method reproducibility, n = 10 replicates of the UTAK urine standard were analyzed using the optimized portable GC–MS method on a single day. An exemplary chromatogram of data obtained during these experiments is shown in Figure 4. Peaks that were reliably detected in all samples were identified using the NIST mass spectral library, and they are listed in Table 1 along with their retention times (RTs) and base m/z peak within the mass spectrum. Although it can be seen in Figure 4 that carvone and p-menth-1-en-3-one do not achieve high chromatographic resolution, the peak finder tool using TICs could distinguish and integrate the two peaks in every sample run. Integrated signals across the board were not controlled using the internal standard, as intra-day runs should require limited to no normalization. The average abundances of VOCs in the UTAK urine standard, along with the IS, are shown in Figure 5A. The compounds with the largest abundances were ketones and terpenes/terpenoids including but not limited to 4-heptanone, acetone, p-menth-1-en-3-one, and camphene. VOCs with relatively lower signals consisted of aromatics (2,5-dimethylbenzaldehyde and 1-pentenylbenzene) as well as other ketones (2-pentanone and 2-heptanone). RSD values were also calculated for this set of compounds (Figure 5B) and this showed that most compounds displayed RSD < 25%, except for 2-heptanone, 2,5-dimethylbenzaldehyde, and p-menth-1-en-3-one. It is hypothesized that the reason for the slightly increased RSDs for these compounds may be because they were some of the VOCs with the lowest abundance values. The increased RSD for p-menth-1-en-3-one, on the other hand, may be due to poor chromatographic resolution.

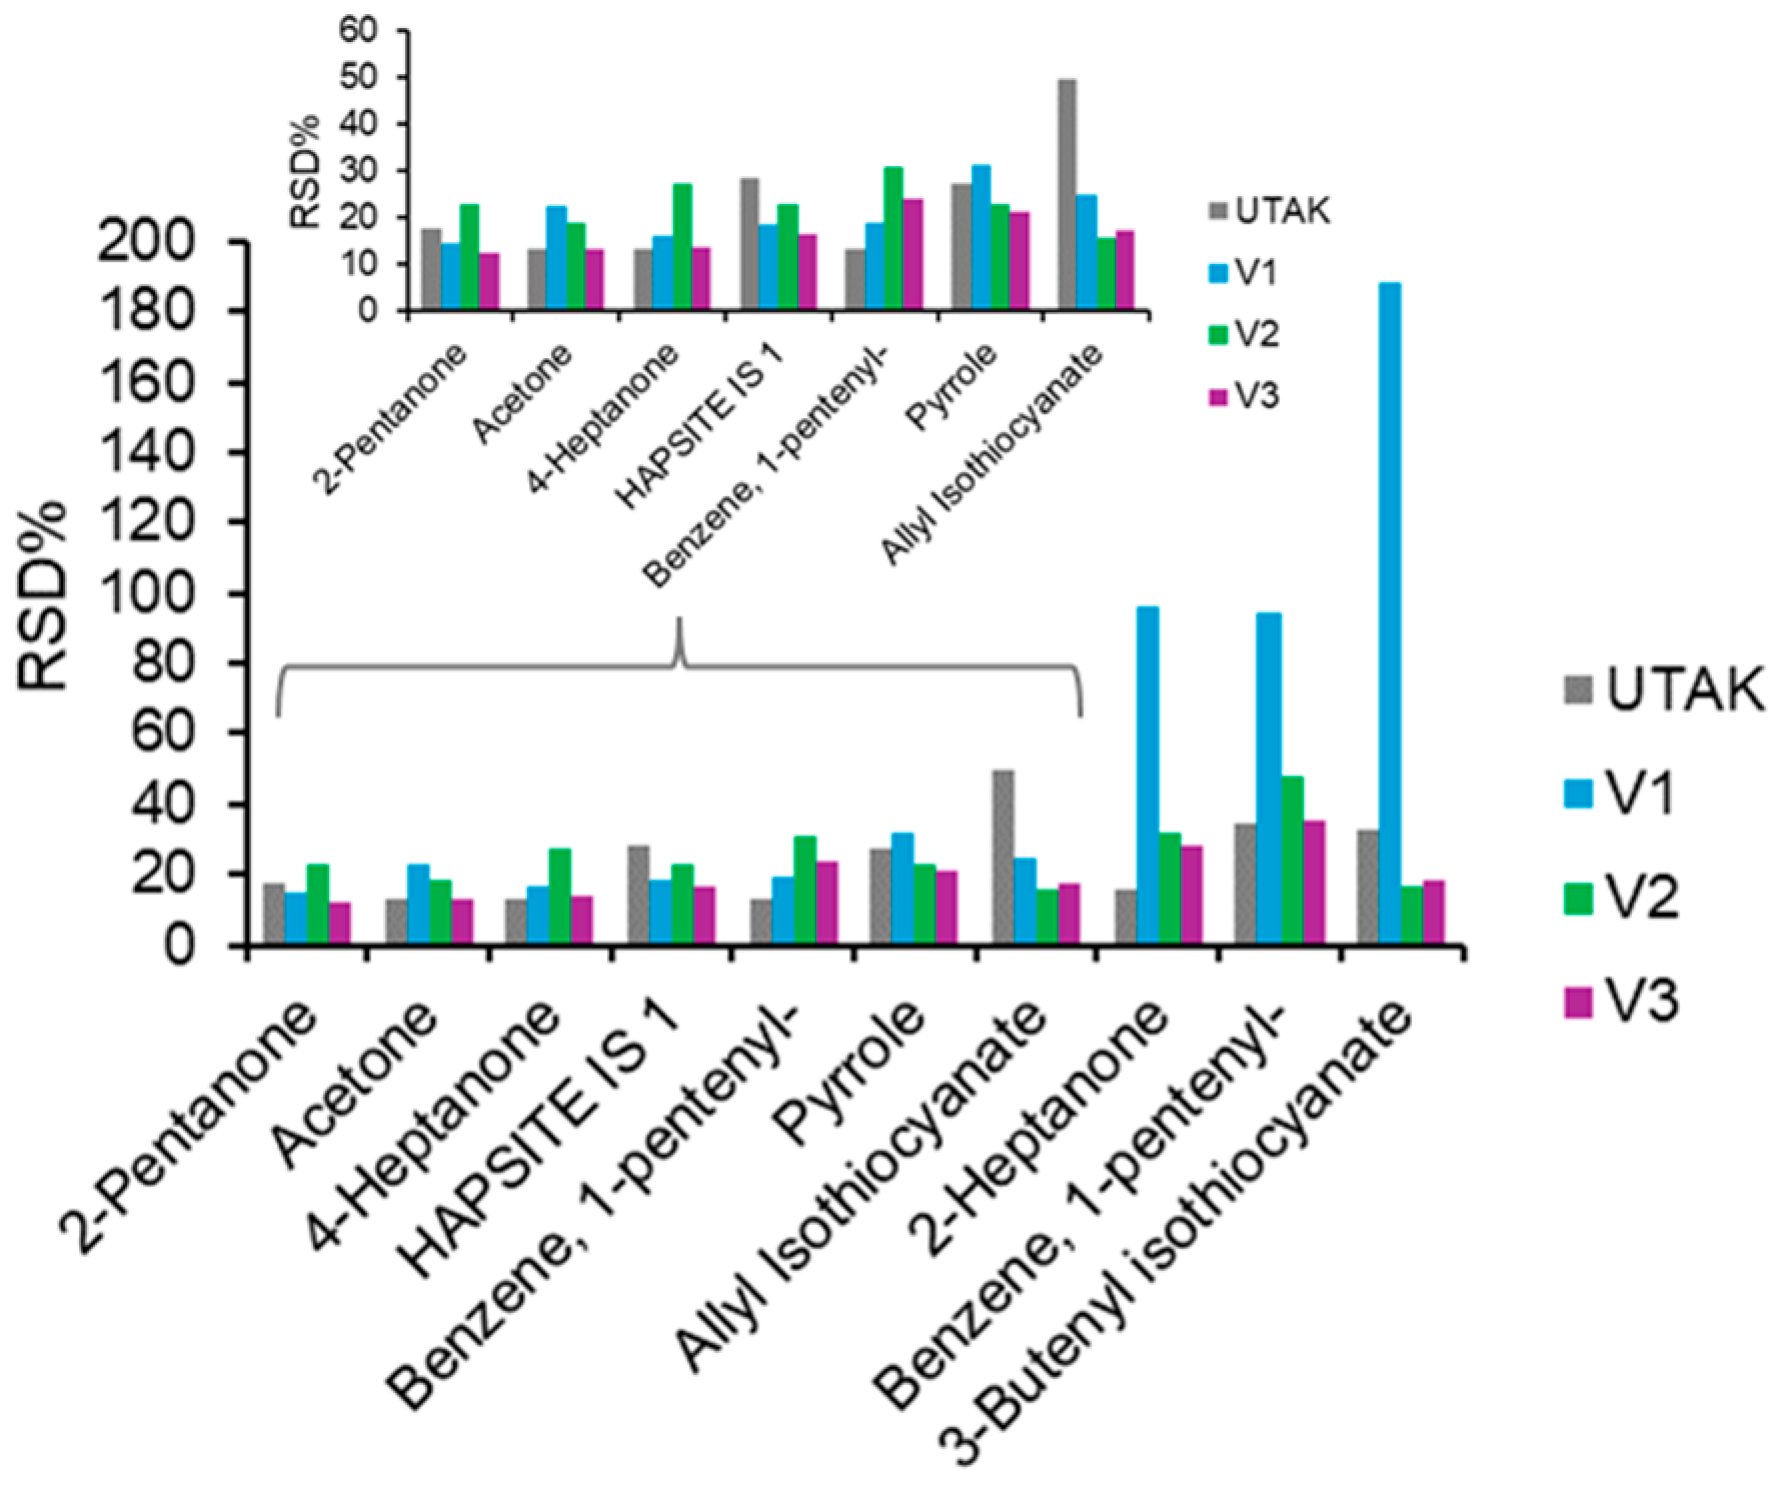
3.4. Inter-Day GC–MS Performance

After benchmarking intra-day reproducibility, urine replicates across the three lab volunteers (and the UTAK standard) were analyzed on four different days. The peak finder tool was used to identify conserved peaks across the different sample types. Once all the data were processed, it was soon realized that in some samples, the peak finder tool could not distinguish peaks that did not achieve baseline chromatographic resolution. Therefore, to isolate peaks that are more VOC-specific, EICs were utilized for a handful of compounds. For example, carvone and p-menth-1-en-3-one were not distinguishable in every sample, and analysis of multiple samples made it clear there were coeluting peaks including allyl isothiocyanate and 4-heptanone. Finally, EICs were also utilized to quantify 1-pententlybenzene due to the interference of some silanes/siloxanes (byproducts of method or column). All analytes that were detected in at least one of the sample types are listed in Table 2, along with their RTs and characteristic m/z peak. Prior to exploring differences, intra-day reproducibility was assessed for each sample type and RSD values were approximately 20% with a general range between 15 and 30% (Figure 6). These values are deemed acceptable and in range, given that IS #1 (normalized relative to IS #2) displayed similar RSD ranges. It should be noted that only VOCs were included in which a calculatable RSD could be achieved for each volunteer/standard (removal of peaks with sparse or zero values). In volunteer 1, increased RSD values were observed for 2-heptanone, 1-pentenylbenzene and 3-butenyl isothiocyanate. This is most likely because these compounds had sparse or low abundance values in this volunteer’s samples.
Next, to explore differences in expression among the four sample types, a hierarchical heatmap (Figure 7) was produced for the compounds listed in Table 2. On the heatmap, each VOC is listed as a row with the columns representing each of the sample replicates. Red colors are designated for relatively high expression levels, green for relatively low levels, and black for median signals. Hierarchical clustering on the left-hand side of the y-axis shows which features display similarities in expression in the collected sample types. In other words, VOCs that cluster together show homologous trends in the different sample types analyzed. Interestingly, the heatmap shows unique differences among the sample types consistently across the four different days of analysis. For example, for most compounds, volunteer 1 had the lowest signal, except for eucalyptol, which was unique to this volunteer. The UTAK standard had the most abundant profile in general, apart from a handful of compounds that showed enrichment in volunteer 2. It should be noted that the VOCs associated with volunteer 2 comprised mostly of sulfur compounds, which may or may not be due to dietary factors [35]. Finally, for pyrrole and 2-pentanone, volunteer 3 had the highest signal for these analytes.
Although the heatmap showed visual differences between analytes among sample types, PCA was used to visualize VOC profile differences among different volunteers in a lower, two-dimensional space. Using the analytes listed in Table 2, PCA was implemented to visualize global patterns within the data to ultimately demonstrate that the portable GC–MS and sampling methodology can distinguish between urinary profiles of different volunteers. Before visualizing the PCA scores in a two-dimensional space, the authors ensured that sufficient variation was captured by the first two principal components. The plot in Figure 8A shows the explained variation as a percentage for each PC. By analyzing the first two PCs alone, over 70% of the variation within this dataset was captured. Along the first two principal components illustrated in Figure 8B, PCA scores for the different volunteers and the UTAK urine standard were clearly distinguishable with 100% accuracy across all four days. Although the results show a limited number of compounds detected using the portable GC–MS compared to reports using benchtop systems [36], the comprehensive results demonstrate that this method can be reliably used to differentiate between volatilomic profiles in human urine. In the future, this methodology should be expanded to urine samples collected from humans diagnosed with medical conditions to more directly assess the ability of this technique to distinguish VOC biomarker profiles.

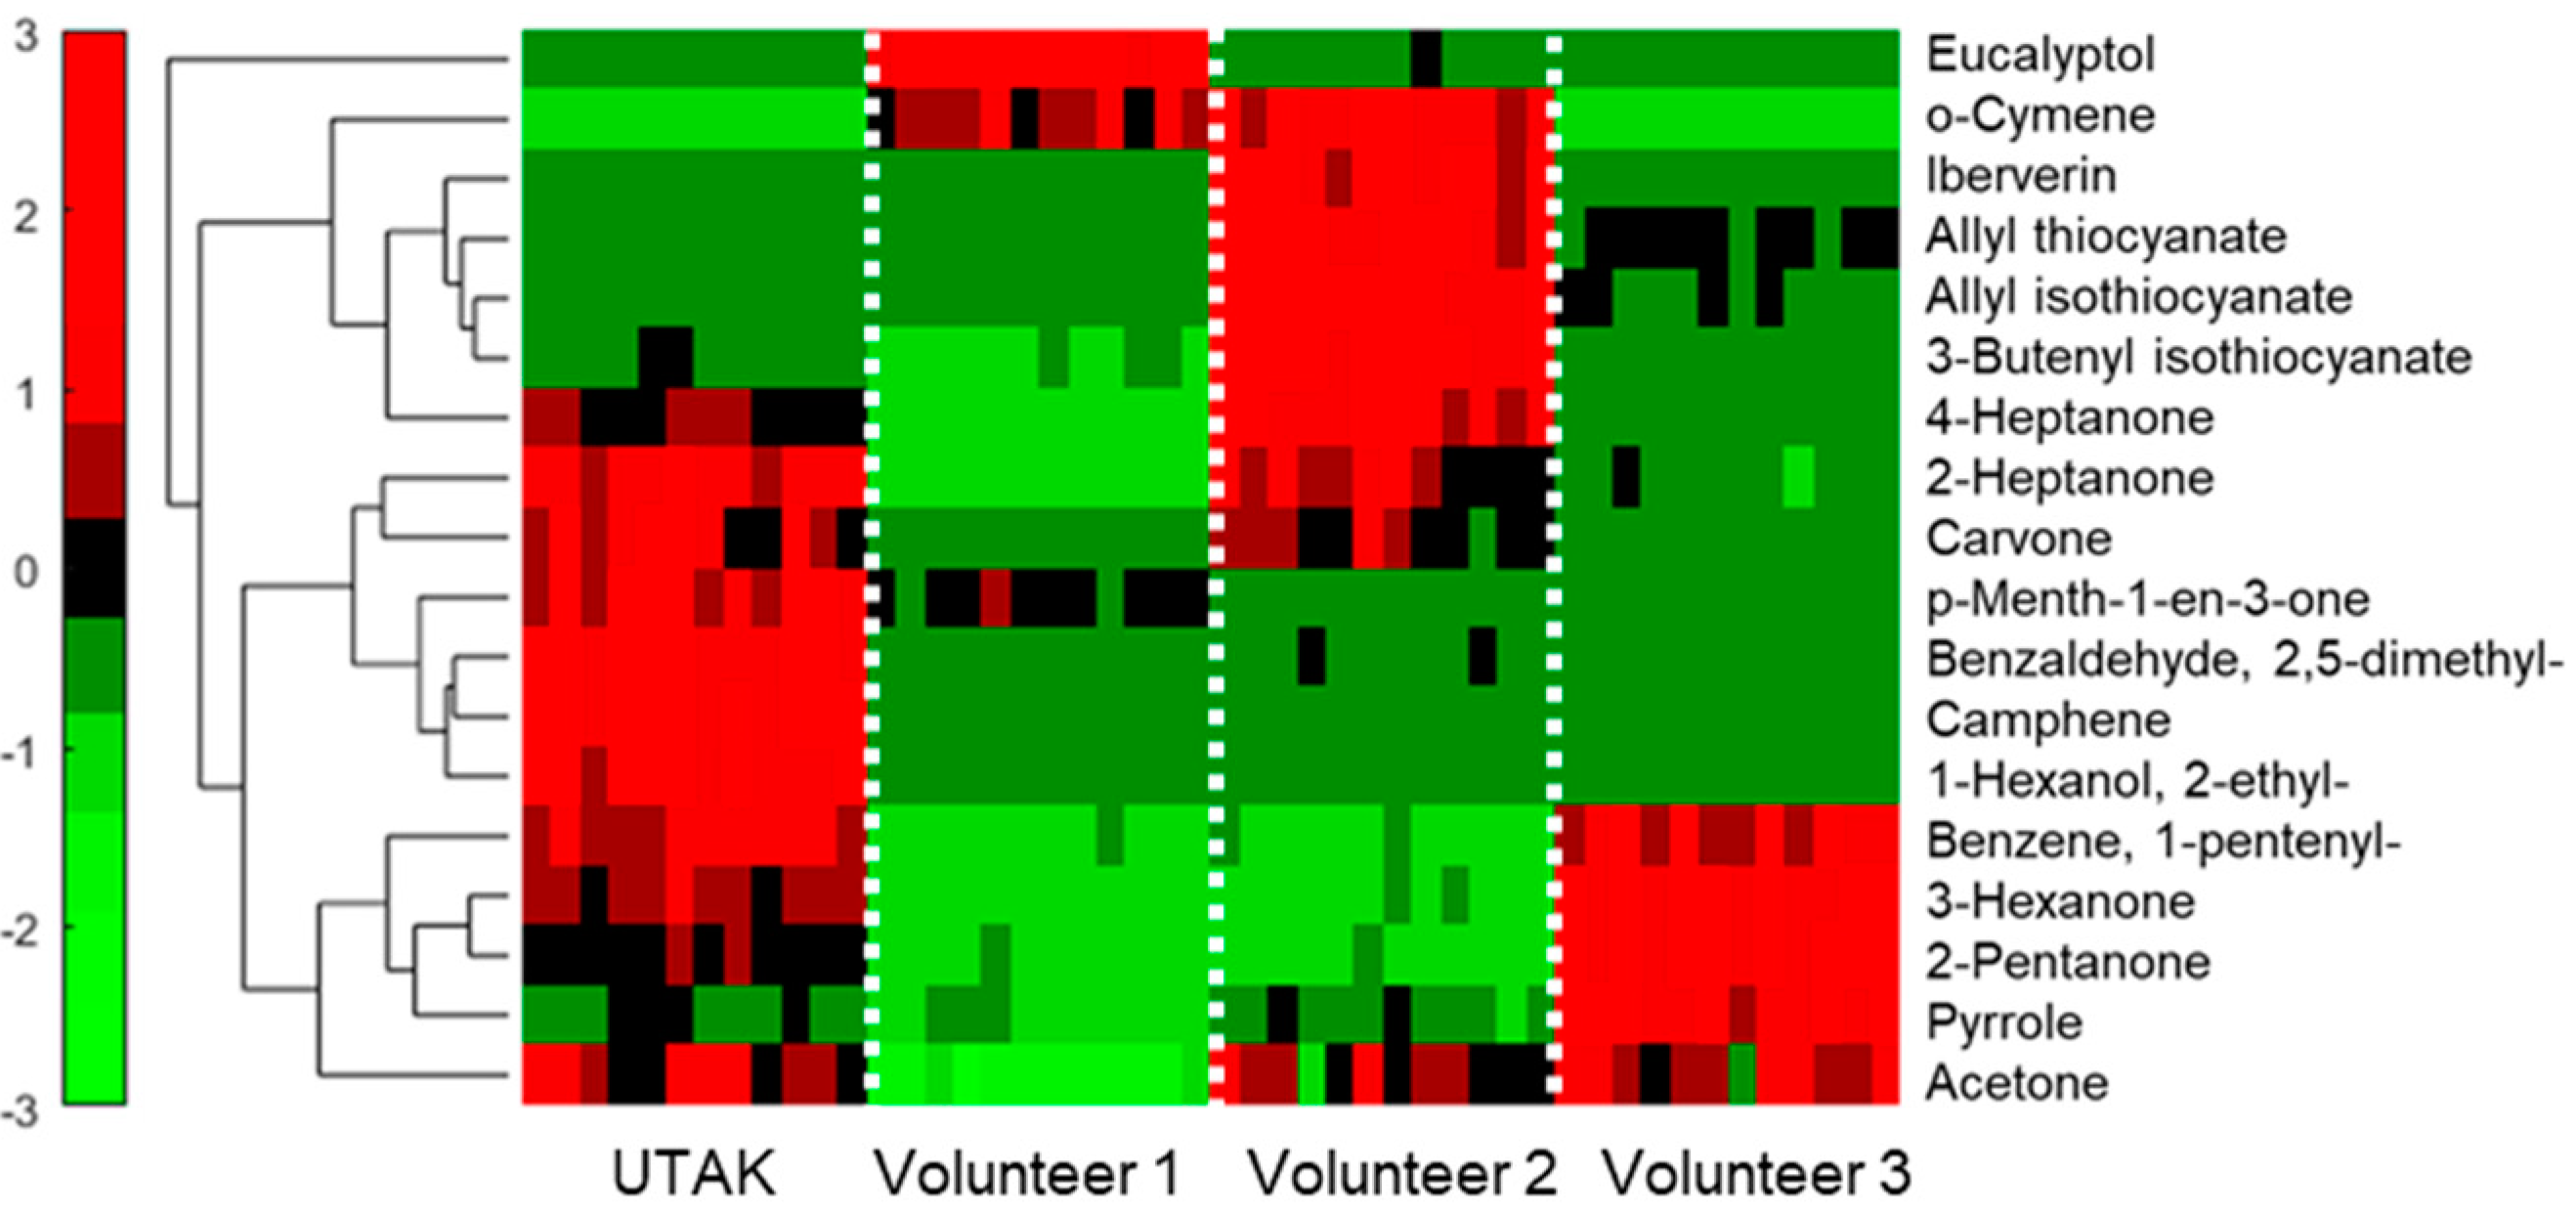
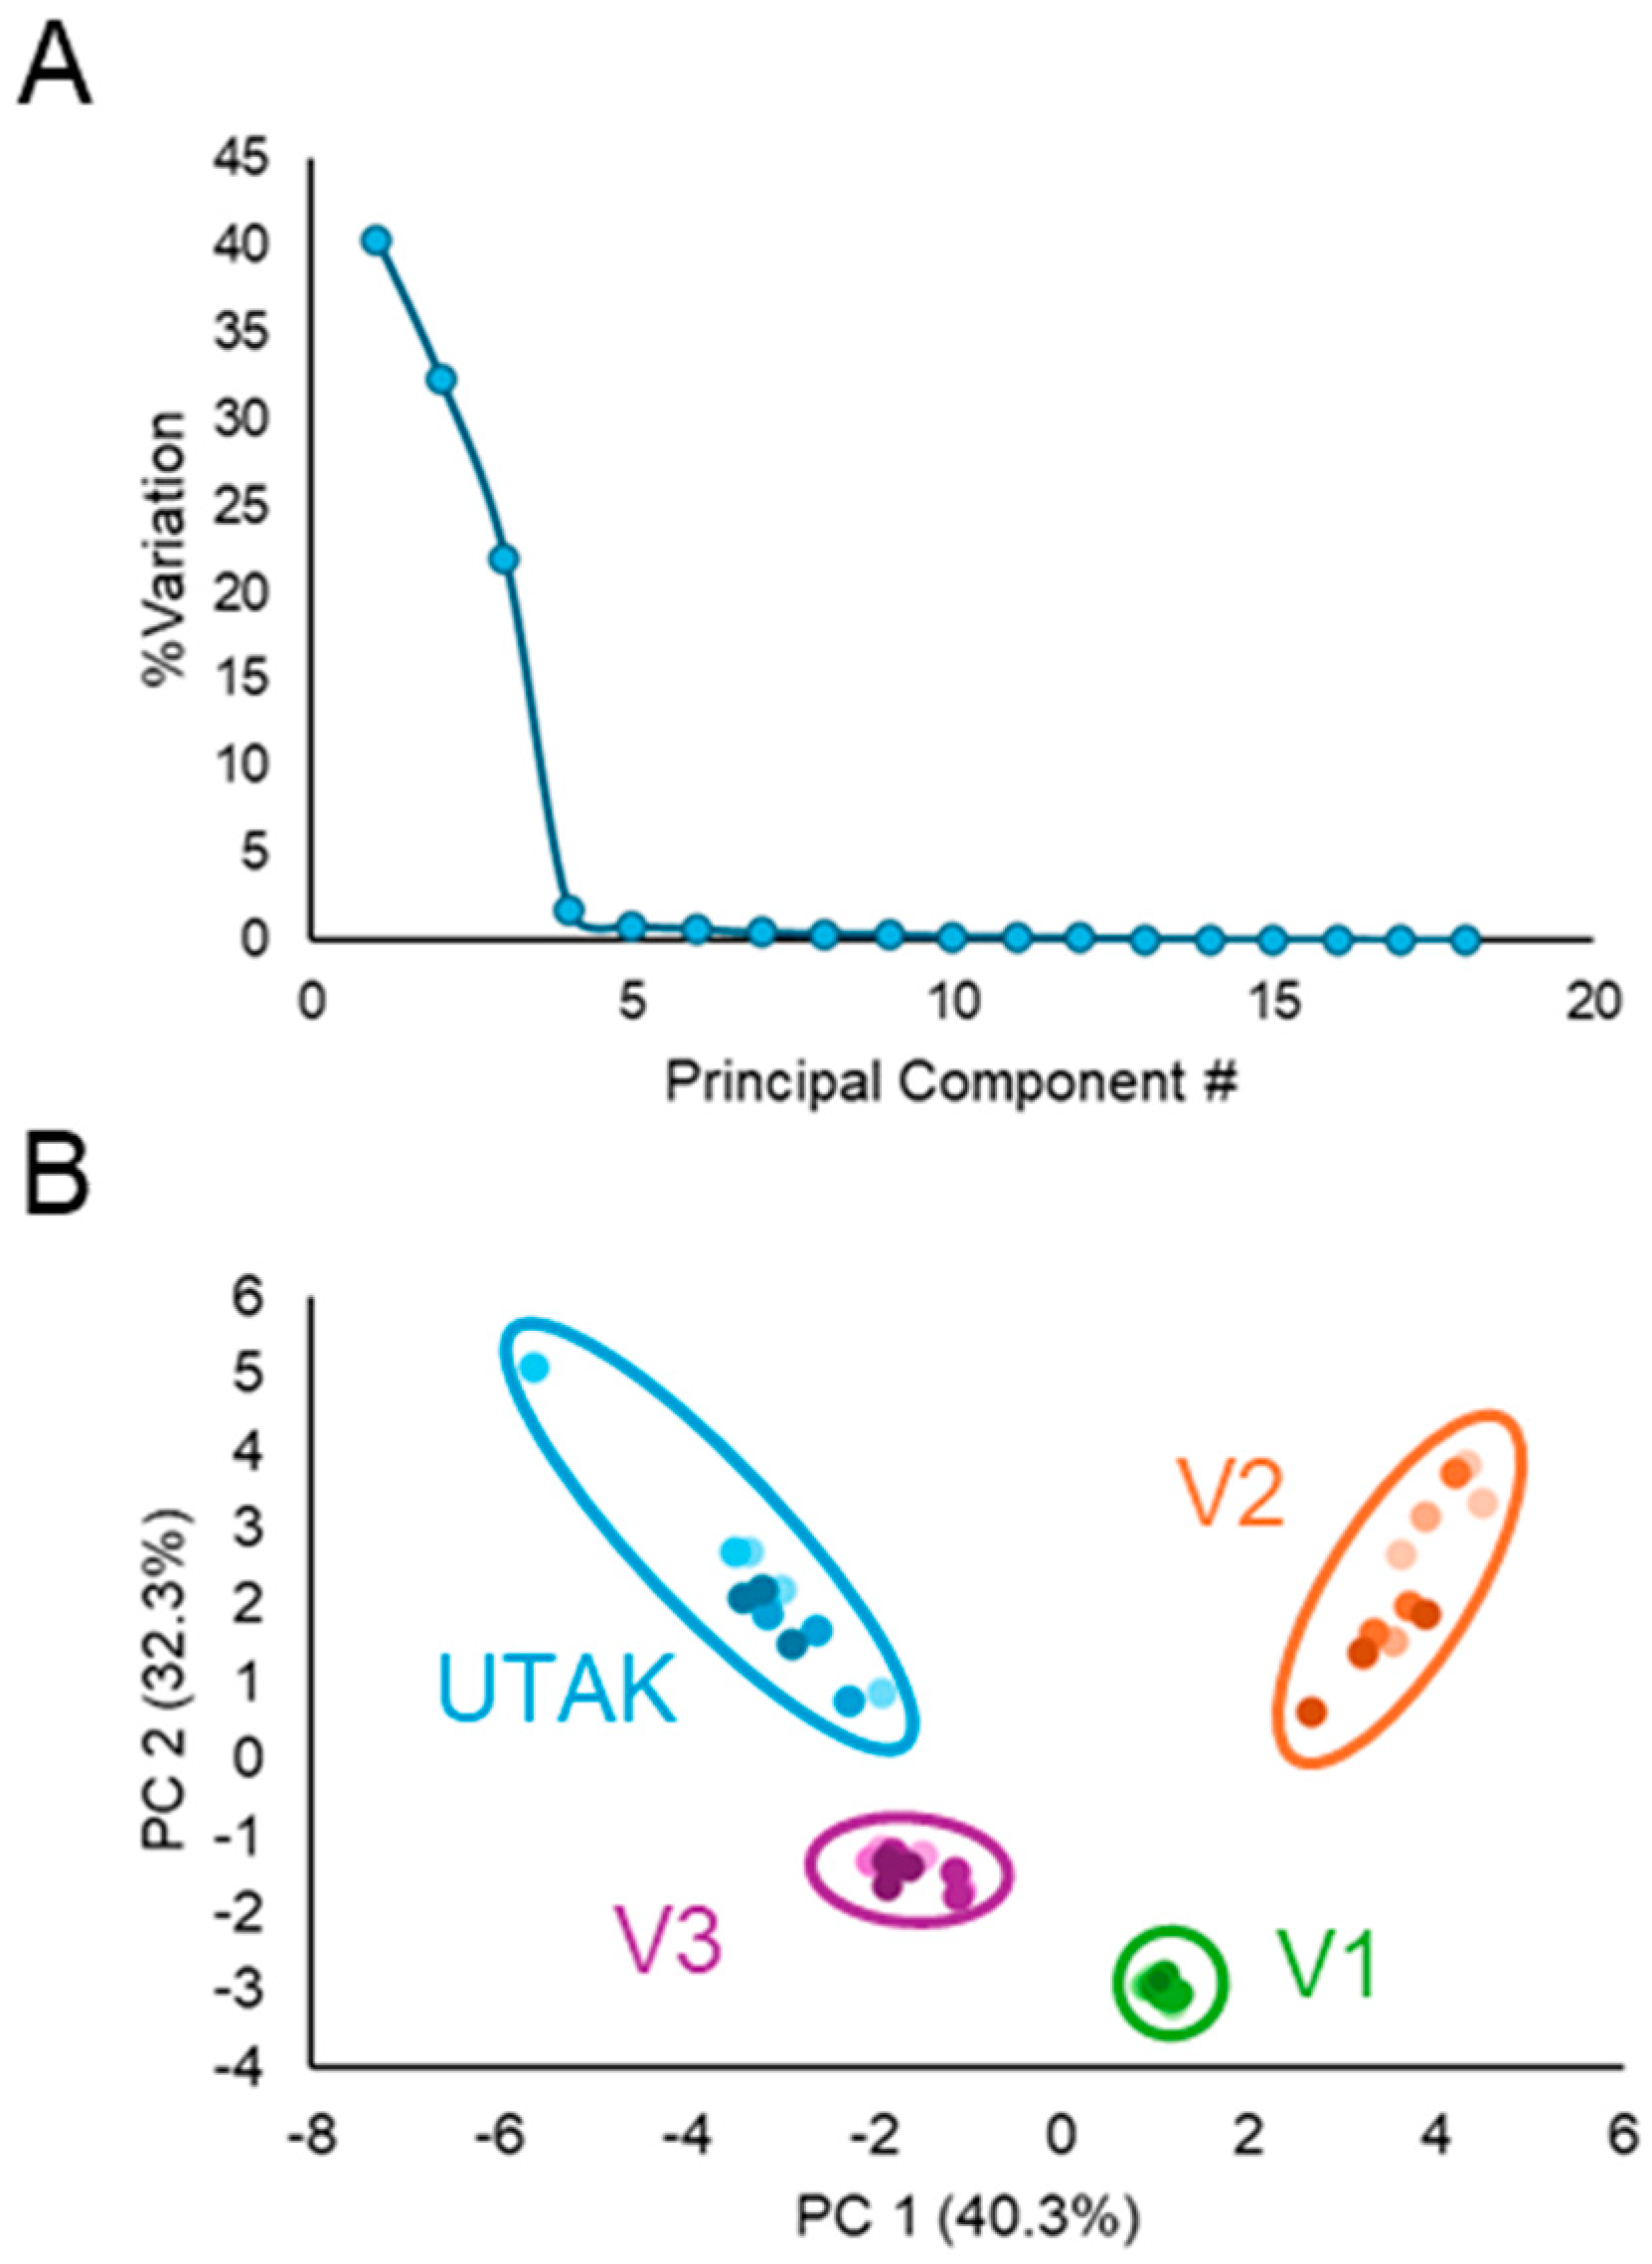
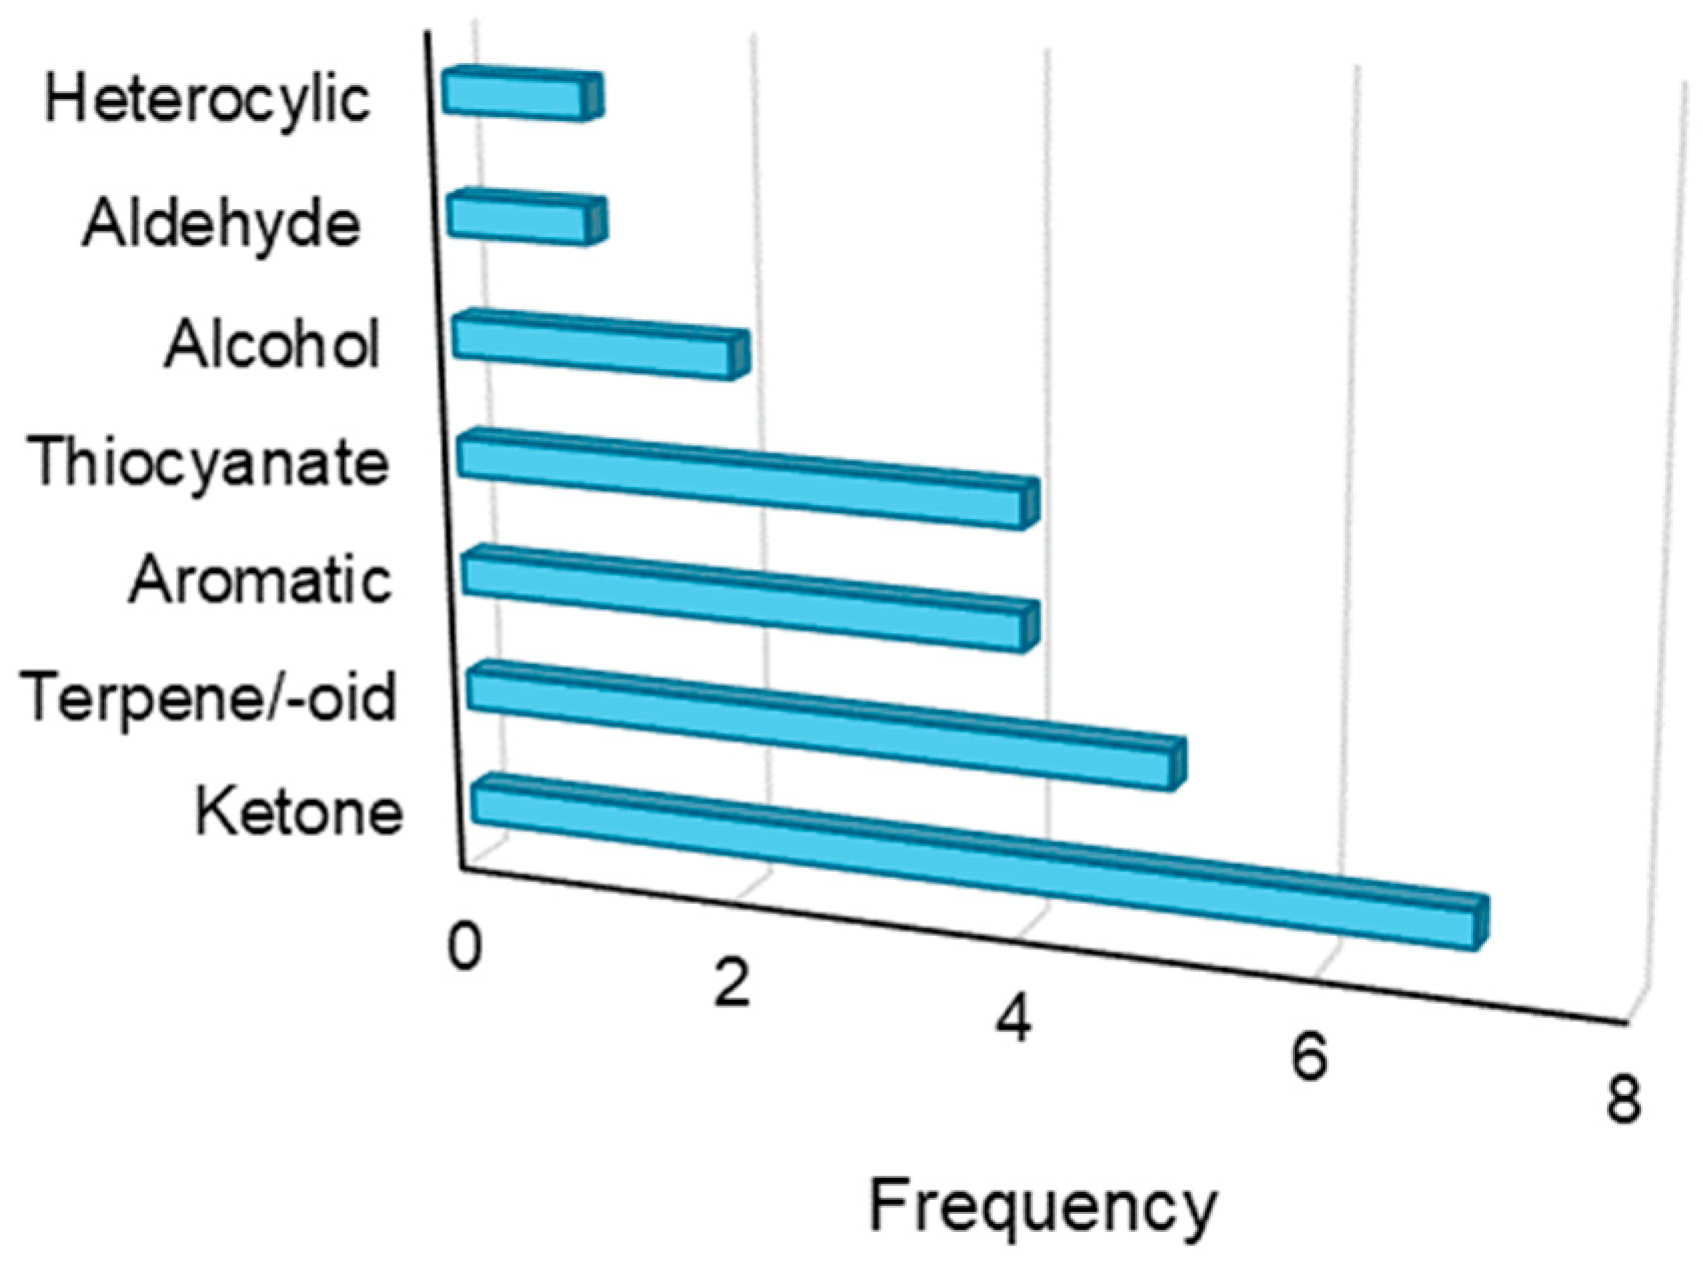
3.5. Interrogating VOC Functionality

For all compounds analyzed, functional group frequency was undertaken to explore structural features within the dataset (Figure 9). Among the VOCs, ketones, terpenes/terpenoids, aromatics, and thiocyanates were the functional groups with the highest frequency. Other functional groups with low frequency (only one compound detected) included an aldehyde and heterocycle. Most importantly, volatiles and functional groups reported to be detected by portable GC–MS in this study have also been reported using benchtop systems. Moreover, several analytes detected by the portable GC–MS are also implicated to be biomarkers for different medical conditions in previous reports. For example, acetone (both in urine and breath) is a well-established biomarker for diabetes that can be used to noninvasively measure blood glucose levels [37,38]. 2-Pentanone, another urinary ketone, is considered to be a candidate biomarker for lung cancer [39]. Ketones beyond the specific ones mentioned have also been implicated as urinary biomarkers for various types of cancer [18]. 2,5-Dimethylbenzaldehyde, an aromatic aldehyde, has been implicated as an important urinary biomarker for prostate cancer screening applications in multiple studies [40,41]. Finally, terpenes/terpenoids, including the specific analytes identified in this study, have been previously reported to be biomarkers for breast cancer and other conditions [42,43], although their biological origin and clinical relevance are still up for debate. Taken as a whole, especially given the low diversity of sample types collected in this pilot study, the portable GC–MS is well-situated to detect previously proposed VOCs that may be clinically relevant in noninvasive health monitoring.

4. Conclusions

In this study, an optimized method was developed to deploy the HAPSITE® ER portable GC–MS to detect VOC profiles emanating from human urine headspace using the standard air probe attachment/module. Various off-column, on-column, and MS parameters were explored to ensure the elucidation of the densest VOC profile with high fidelity and reproducibility. By analyzing a high number of replicates on the same day, as well as different days, the team robustly benchmarked intra- and inter-day variability to be between 20 and 30% for most analytes identified in urine, except for some analytes that displayed low-intensity signals. Once reproducibility was determined, univariate and multivariate approaches were implemented to observe any differences in sample profiles. These analyses led to the realization that the portable GC–MS had sufficient sensitivity and resolution to discriminate healthy human VOC profiles with 100% accuracy (as evidenced by the three volunteers and the UTAK standard). These preliminary results show the promise of state-of-the-art portable GC–MS instrumentation to be potentially implemented in clinical and point-of-care scenarios for biomarker detection. Future studies should focus on increasing method sensitivity to gain a deeper volatilomic profile that is more reflective of results obtained using benchtop instruments. The team anticipates that exploring alternative preconcentration techniques, such as solid phase microextraction (SPME), needle trap microextraction (NTME), thin film microextraction (TFME), stir bar sorptive extraction (SBSE), and thermal desorption (TD), will significantly increase the signal-to-noise ratio of analytes and the number of VOCs detected. Future studies will be undertaken to compare these alternative techniques to the results presented in this manuscript using the air probe and Tri-Bed Concentrator Tube. Finally, portable GC–MS performance needs to be studied in the context of medical conditions to ultimately demonstrate clinical utility.

Author Contributions

Conceptualization, M.W. and M.A.; Methodology, M.W., S.E., E.S., S.N., S.B. and M.A.; Software, M.W., S.E., E.S. and S.B.; Validation, M.W., S.E., E.S. and M.A.; Formal Analysis, M.W., S.E., E.S., S.N., S.B. and M.A.; Investigation, M.W. and M.A.; Resources, M.A.; Data Curation, M.W., S.E., E.S., S.N., S.B. and M.A.; Writing—Original Draft Preparation, M.W., S.E. and E.S.; Writing—Review & Editing, M.W., S.E., E.S., S.N., S.B. and M.A.; Visualization, M.W., S.E., E.S. and S.B.; Supervision, M.W. and M.A.; Project Administration, M.A.; Funding Acquisition, M.W. and M.A. All authors have read and agreed to the published version of the manuscript.

Funding

The presented research was funded by the American Cancer Society (ACS); award no. 1076327.

Data Availability Statement

The authors provide no restriction on the availability of methods, protocols, instrumentation and data utilized in the following article. All data will be available from the corresponding author by request.

Acknowledgments

The authors would like to thank INFICON, inc. for all the support they provided regarding instrumentation operation over the course of the experiments presented in this study. We would also like to extend our appreciation to Andrew Christensen and Christianah Akingbehin for assisting with materials preparation for the results generated in this manuscript. Finally, the authors would like to acknowledge the ACS for providing financial support to the study.

Conflicts of Interest

Mangilal Agarwal has an ongoing collaboration with the NANOZ company and Scosche Industries to commercialize sensors to detect VOCs presented in this work for breath analysis and the detection of medical conditions. Mark Woollam and Mangilal Agarwal have non-disclosure agreements with INFICON inc. to help translate the HAPSITE® ER portable GC–MS for biomedical applications in prostate cancer screening through the analysis of urinary VOC biomarkers. It should be disclosed that Sara Button is employed as a Product Engineer at INFICON inc., and consequently, she has a vested interest in the successful application and commercialization of this device. All other authors report no conflicts of interest.

References

  1. Jendrny, P.; Twele, F.; Meller, S.; Osterhaus, A.D.M.E.; Schalke, E.; Volk, H.A. Canine olfactory detection and its relevance to medical detection. BMC Infect. Dis. 2021, 21, 838. [Google Scholar] [CrossRef] [PubMed]
  2. Angle, C.; Waggoner, L.P.; Ferrando, A.; Haney, P.; Passler, T. Canine Detection of the Volatilome: A Review of Implications for Pathogen and Disease Detection. Front. Vet. Sci. 2016, 3, 47. [Google Scholar] [CrossRef] [PubMed]
  3. Moser, E.; McCulloch, M. Canine scent detection of human cancers: A review of methods and accuracy. J. Vet. Behav. 2010, 5, 145–152. [Google Scholar] [CrossRef]
  4. da Costa, B.R.B.; De Martinis, B.S. Analysis of urinary VOCs using mass spectrometric methods to diagnose cancer: A review. Clin. Mass Spectrom. 2020, 18, 27–37. [Google Scholar] [CrossRef]
  5. Woollam, M.; Teli, M.; Angarita-Rivera, P.; Liu, S.; Siegel, A.P.; Yokota, H.; Agarwal, M. Detection of Volatile Organic Compounds (VOCs) in Urine via Gas Chromatography-Mass Spectrometry QTOF to Differentiate Between Localized and Metastatic Models of Breast Cancer. Sci. Rep. 2019, 9, 2526. [Google Scholar] [CrossRef]
  6. Wen, Q.; Boshier, P.; Myridakis, A.; Belluomo, I.; Hanna, G.B. Urinary Volatile Organic Compound Analysis for the Diagnosis of Cancer: A Systematic Literature Review and Quality Assessment. Metabolites 2020, 11, 17. [Google Scholar] [CrossRef]
  7. Hester, R.E.; Harrison, R.M. Volatile Organic Compounds in the Atmosphere; Royal Society of Chemistry: London, UK, 1995; Volume 4. [Google Scholar]
  8. Williams, J.; Koppmann, R.J. Volatile organic compounds in the atmosphere: An overview. Volatile Org. Compd. Atmos. 2007, 1, 1–32. [Google Scholar]
  9. Ninkovic, V.; Markovic, D.; Rensing, M. Plant volatiles as cues and signals in plant communication. Plant Cell Environ. 2021, 44, 1030–1043. [Google Scholar] [CrossRef]
  10. Amann, A.; Costello, B.d.L.; Miekisch, W.; Schubert, J.; Buszewski, B.; Pleil, J.; Ratcliffe, N.; Risby, T. The human volatilome: Volatile organic compounds (VOCs) in exhaled breath, skin emanations, urine, feces and saliva. J. Breath Res. 2014, 8, 034001. [Google Scholar] [CrossRef]
  11. Ruszkiewicz, D.M.; Sanders, D.; O’Brien, R.; Hempel, F.; Reed, M.J.; Riepe, A.C.; Bailie, K.; Brodrick, E.; Darnley, K.; Ellerkmann, R.J.E. Diagnosis of COVID-19 by analysis of breath with gas chromatography-ion mobility spectrometry-a feasibility study. eClinicalMedicine 2020, 29, 100609. [Google Scholar] [CrossRef]
  12. Woollam, M.; Angarita-Rivera, P.; Siegel, A.P.; Kalra, V.; Kapoor, R.; Agarwal, M. Exhaled VOCs can discriminate subjects with COVID-19 from healthy controls. J. Breath Res. 2022, 16, 036002. [Google Scholar] [CrossRef] [PubMed]
  13. Leemans, M.; Bauër, P.; Cuzuel, V.; Audureau, E.; Fromantin, I. Volatile Organic Compounds Analysis as a Potential Novel Screening Tool for Breast Cancer: A Systematic Review. Biomark. Insights 2022, 17, 11772719221100709. [Google Scholar] [CrossRef] [PubMed]
  14. Kure, S.; Satoi, S.; Kitayama, T.; Nagase, Y.; Nakano, N.; Yamada, M.; Uchiyama, N.; Miyashita, S.; Iida, S.; Takei, H.; et al. A prediction model using 2-propanol and 2-butanone in urine distinguishes breast cancer. Sci. Rep. 2021, 11, 19801. [Google Scholar] [CrossRef]
  15. Fink, H.; Maihöfer, T.; Bender, J.; Schulat, J. Indole as a new tentative marker in exhaled breath for non-invasive blood glucose monitoring of diabetic subjects. J. Breath Res. 2022, 16, 026001. [Google Scholar] [CrossRef]
  16. Siegel, A.P.; Daneshkhah, A.; Hardin, D.S.; Shrestha, S.; Varahramyan, K.; Agarwal, M. Analyzing breath samples of hypoglycemic events in type 1 diabetes patients: Towards developing an alternative to diabetes alert dogs. J. Breath Res. 2017, 11, 026007. [Google Scholar] [CrossRef]
  17. Phillips, M.; Cataneo, R.N.; Cheema, T.; Greenberg, J. Increased breath biomarkers of oxidative stress in diabetes mellitus. Clin. Chim. Acta 2004, 344, 189–194. [Google Scholar] [CrossRef]
  18. Janfaza, S.; Khorsand, B.; Nikkhah, M.; Zahiri, J. Digging deeper into volatile organic compounds associated with cancer. Biol. Methods Protoc. 2019, 4, bpz014. [Google Scholar] [CrossRef]
  19. Woollam, M.; Grocki, P.; Schulz, E.; Siegel, A.P.; Deiss, F.; Agarwal, M. Evaluating polyvinylidene fluoride-carbon black composites as solid phase microextraction coatings for the detection of urinary volatile organic compounds by gas chromatography-mass spectrometry. J. Chromatogr. A 2022, 1685, 463606. [Google Scholar] [CrossRef]
  20. Boeselt, T.; Terhorst, P.; Kroenig, J.; Nell, C.; Spielmanns, M.; Boas, U.; Veith, M.; Vogelmeier, C.; Greulich, T.; Koczulla, A.R.; et al. Specific molecular peak analysis by ion mobility spectrometry of volatile organic compounds in urine of COVID-19 patients: A novel diagnostic approach. J. Virol. Methods 2024, 326, 114910. [Google Scholar] [CrossRef]
  21. Nicolier, C.; Künzler, J.; Lizoain, A.; Kerber, D.; Hossmann, S.; Rothenbühler, M.; Laimer, M.; Witthauer, L. Detection of hypoglycaemia in type 1 diabetes through breath volatile organic compound profiling using gas chromatography–ion mobility spectrometry. Diabetes Obes. Metab. 2024, 26, 5737–5744. [Google Scholar] [CrossRef]
  22. Belluomo, I.; Boshier, P.R.; Myridakis, A.; Vadhwana, B.; Markar, S.R.; Spanel, P.; Hanna, G.B. Selected ion flow tube mass spectrometry for targeted analysis of volatile organic compounds in human breath. Nat. Protoc. 2021, 16, 3419–3438. [Google Scholar] [CrossRef] [PubMed]
  23. Jia, Z.; Ong, W.Q.; Zhang, F.; Du, F.; Thavasi, V.; Thirumalai, V. A study of 9 common breath VOCs in 504 healthy subjects using PTR-TOF-MS. Metabolomics 2024, 20, 79. [Google Scholar] [CrossRef] [PubMed]
  24. Bajo-Fernández, M.; Souza-Silva, É.A.; Barbas, C.; Rey-Stolle, M.F.; García, A. GC-MS-based metabolomics of volatile organic compounds in exhaled breath: Applications in health and disease. A review. Front. Mol. Biosci. 2023, 10, 1295955. [Google Scholar] [CrossRef] [PubMed]
  25. Ghazaly, C.; Biletska, K.; Thevenot, E.A.; Devillier, P.; Naline, E.; Grassin-Delyle, S.; Scorsone, E. Assessment of an e-nose performance for the detection of COVID-19 specific biomarkers. J. Breath Res. 2023, 17, 026006. [Google Scholar] [CrossRef]
  26. Maciel, M.; Sankari, S.; Woollam, M.; Agarwal, M. Optimization of Metal Oxide Nanosensors and Development of a Feature Extraction Algorithm to Analyze VOC Profiles in Exhaled Breath. IEEE Sens. J. 2023, 23, 16571–16578. [Google Scholar] [CrossRef]
  27. Binson, V.A.; Akbar, R.; Thankachan, N.; Thomas, S. Design and construction of a portable e-nose system for human exhaled breath VOC analysis. Mater. Today Proc. 2022, 58, 422–427. [Google Scholar] [CrossRef]
  28. Eckenrode, B.A. Environmental and Forensic applications of field-portable GC-MS: An overview. J. Am. Soc. Mass Spectrom. 2001, 12, 683–693. [Google Scholar] [CrossRef]
  29. Bussey, R.O., III. Uses of Portable Gas Chromatography Mass Spectrometers. In Novel Aspects of Gas Chromatography and Chemometrics; IntechOpen: London, UK, 2022. [Google Scholar]
  30. Harshman, S.W.; Rubenstein, M.H.; Qualley, A.V.; Fan, M.; Geier, B.A.; Pitsch, R.L.; Slusher, G.M.; Hughes, G.T.; Dershem, V.L.; Grigsby, C.C.; et al. Evaluation of thermal desorption analysis on a portable GC–MS system. Int. J. Environ. Anal. Chem. 2017, 97, 247–263. [Google Scholar] [CrossRef]
  31. Aggarwal, P.; Baker, J.; Boyd, M.T.; Coyle, S.; Probert, C.; Chapman, E.A. Optimisation of Urine Sample Preparation for Headspace-Solid Phase Microextraction Gas Chromatography-Mass Spectrometry: Altering Sample pH, Sulphuric Acid Concentration and Phase Ratio. Metabolites 2020, 10, 482. [Google Scholar] [CrossRef]
  32. Woollam, M. Created in BioRender. 2025. Available online: https://BioRender.com/j01t996 (accessed on 24 April 2025).
  33. McFarlanE, M.; MozdiaK, E.; Daulton, E.; Arasaradnam, R.; Covington, J.; Nwokolo, C. Pre-analytical and analytical variables that influence urinary volatile organic compound measurements. PLoS ONE 2020, 15, e0236591. [Google Scholar] [CrossRef]
  34. Seethapathy, S.; Górecki, T. Applications of polydimethylsiloxane in analytical chemistry: A review. Anal. Chim. Acta 2012, 750, 48–62. [Google Scholar] [CrossRef] [PubMed]
  35. Park, S.; Kim, H.-W.; Joo Lee, C.; Kim, Y.; Sung, J. Profiles of volatile sulfur compounds in various vegetables consumed in Korea using HS-SPME-GC/MS technique. Front. Nutr. 2024, 11, 1409008. [Google Scholar] [CrossRef] [PubMed]
  36. Woollam, M.; Siegel, A.P.; Munshi, A.; Liu, S.; Tholpady, S.; Gardner, T.; Li, B.-Y.; Yokota, H.; Agarwal, M. Canine-Inspired Chemometric Analysis of Volatile Organic Compounds in Urine Headspace to Distinguish Prostate Cancer in Mice and Men. Cancers 2023, 15, 1352. [Google Scholar] [CrossRef] [PubMed]
  37. Xu, W.; Zou, X.; Ding, H.; Ding, Y.; Zhang, J.; Liu, W.; Gong, T.; Nie, Z.; Yang, M.; Zhou, Q.; et al. Rapid and non-invasive diagnosis of type 2 diabetes through sniffing urinary acetone by a proton transfer reaction mass spectrometry. Talanta 2023, 256, 124265. [Google Scholar] [CrossRef]
  38. Rydosz, A. Sensors for Enhanced Detection of Acetone as a Potential Tool for Noninvasive Diabetes Monitoring. Sensors 2018, 18, 2298. [Google Scholar] [CrossRef]
  39. Rubio-Sánchez, R.; Ríos-Reina, R.; Ubeda, C. Effect of chemotherapy on urinary volatile biomarkers for lung cancer by HS-SPME-GC-MS and chemometrics. Thorac. Cancer 2023, 14, 3522–3529. [Google Scholar] [CrossRef]
  40. Lima, A.R.; Pinto, J.; Carvalho-Maia, C.; Jerónimo, C.; Henrique, R.; Bastos, M.d.L.; Carvalho, M.; Guedes de Pinho, P. A Panel of Urinary Volatile Biomarkers for Differential Diagnosis of Prostate Cancer from Other Urological Cancers. Cancers 2020, 12, 2017. [Google Scholar] [CrossRef]
  41. Lima, A.R.; Pinto, J.; Azevedo, A.I.; Barros-Silva, D.; Jerónimo, C.; Henrique, R.; de Lourdes Bastos, M.; Guedes de Pinho, P.; Carvalho, M. Identification of a biomarker panel for improvement of prostate cancer diagnosis by volatile metabolic profiling of urine. Br. J. Cancer 2019, 121, 857–868. [Google Scholar] [CrossRef]
  42. Woollam, M.; Teli, M.; Liu, S.; Daneshkhah, A.; Siegel, A.P.; Yokota, H.; Agarwal, M. Urinary Volatile Terpenes Analyzed by Gas Chromatography–Mass Spectrometry to Monitor Breast Cancer Treatment Efficacy in Mice. J. Proteome Res. 2020, 19, 1913–1922. [Google Scholar] [CrossRef]
  43. Patnaik, R.K.; Lin, Y.-C.; Agarwal, A.; Ho, M.-C.; Yeh, J.A. A pilot study for the prediction of liver function related scores using breath biomarkers and machine learning. Sci. Rep. 2022, 12, 2032. [Google Scholar] [CrossRef]
Figure 1. Illustration of apparatus and set-up for analysis of VOCs emanating from urine headspace using the HAPSITE® ER portable GC–MS system.
Separations 12 00118 g001
Figure 2. (A) The total number of VOCs detected for different volumes of urine specimen showed that 7.5 mL had decreased sensitivity. (B) Salting out and pH correction showed a higher number of VOCs detected in the urine headspace compared to untreated samples, with individual VOCs showing increased signal up to the saturation point of 1.8 g. (C) Optimization of urine heating temperature showed that 60 °C led to the highest signal of individual VOCs detected including 2-pentanone and acetone. (D) Exploration of agitation time led to the determination that 45 min showed increased trends of compounds including but not limited to 4-heptanone and 1-pentenylbenzene.
Separations 12 00118 g002
Figure 3. The integrated signals of (A) urinary VOCs and (B) the HAPSITE® internal standards (IS) show that the high-temperature method (for the membrane, heated lines, and valve oven) results in decreased VOC sensitivity.
Separations 12 00118 g003
Figure 4. Exemplary chromatogram of portable GC–MS analysis of the UTAK urine standard for qualification of intra-day variability.
Separations 12 00118 g004
Figure 5. Comprehensive results from experiments qualifying intra-day reproducibility of the UTAK urine standard (n = 10 replicates). (A) Bar plots show the TIC GC–MS signals for the VOCs listed in Table 1, with ketones and terpenes/terpenoids showing high abundance. (B) Reproducibility of VOC measurements across the 10 replicates through calculation of RSD values, with most analytes displaying < 25%.
Separations 12 00118 g005
Figure 6. Bar charts showing RSD% values for qualified VOCs in the inter-day VOC experiments, showing that except for some VOCs with a low-intensity signal in volunteer 1, most analytes had RSD at approximately 20%. This mirrored the reproducibility of the internal standard.
Separations 12 00118 g006
Figure 7. Hierarchical heatmap of qualified VOCs (listed in Table 2) detected in the inter-day portable GC–MS experiments, showing that the volunteers and UTAK urine standard had differences in VOC profiles and expression.
Separations 12 00118 g007
Figure 8. Principal component analysis (PCA) of VOC data collected during the inter-day analysis of urinary VOCs across the volunteers and the UTAK urine standard. (A) Latency scatter plot shows the amount of variation that each principal component accounts for. (B) PCA score plot in two-dimensions shows the ability of the method to discriminate between urinary VOC profiles from samples collected from different individuals (and the UTAK standard). Different colored shades in the PCA score plot correspond to different days of analysis.
Separations 12 00118 g008
Figure 9. Functional group frequency analysis of the urinary VOCs qualified and detected in the inter-day portable GC–MS experiments.
Separations 12 00118 g009
Table 1. List of VOCs reliably detected in the UTAK urine standard for qualification of intra-day reproducibility, along with their retention times (RTs) and base m/z peaks within the mass spectra.
VOCsRT (minutes)Base m/zCAS#
Acetone0:464367-64-1
HAPSITE IS 11:1769729-81-7
2-Pentanone1:3343107-87-9
Pyrrole2:0967109-97-7
HAPSITE IS 23:47117344-04-7
4-Heptanone3:5871123-19-3
2-Heptanone4:1658110-43-0
1-Hexanol, 2-ethyl-6:5257104-76-7
Benzene, 1-pentenyl-8:21117826-18-6
Benzaldehyde, 2,5-dimethyl-9:091345779-94-2
Carvone9:278299-49-0
p-Menth-1-en-3-one9:338289-81-6
Camphene9:559379-92-5
Table 2. List of VOCs reliably detected in at least one of the sample types (volunteers 1–3 and the UTAK standard) for inter-day GC–MS experiments. Retention times (RTs) and m/z peaks are listed for these VOCs.
VOCsRT (minutes)m/zCAS#
Acetone0:464367-64-1
2-Pentanone1:3343107-87-9
Pyrrole2:0967109-97-7
3-Hexanone2:3357589-38-8
Allyl thiocyanate3:3299764-49-8
Allyl Isothiocyanate3:559957-06-7
4-Heptanone3:5771123-19-3
2-Heptanone4:1658110-43-0
3-Butenyl isothiocyanate5:44723386-97-8
o-Cymene6:51119527-84-4
1-Hexanol, 2-ethyl-6:5257104-76-7
Eucalyptol7:0071470-82-6
Benzene, 1-pentenyl-8:21117826-18-6
Benzaldehyde, 2,5-dimethyl-9:091345779-94-2
Carvone9:2710899-49-0
p-Menth-1-en-3-one9:3311089-81-6
Iberverin9:51101505-79-3
Camphene9:559379-92-5
Disclaimer/Publisher’s Note: The statements, opinions and data contained in all publications are solely those of the individual author(s) and contributor(s) and not of MDPI and/or the editor(s). MDPI and/or the editor(s) disclaim responsibility for any injury to people or property resulting from any ideas, methods, instructions or products referred to in the content.

