Article

Free Fatty Acid Determination in Alcoholic and Non-Alcoholic Beers via Liquid Chromatography–High-Resolution Mass Spectrometry Analysis

by
Christiana Mantzourani
and
Maroula G. Kokotou
*
Laboratory of Chemistry, Department of Food Science and Human Nutrition, Agricultural University of Athens, 11855 Athens, Greece
*
Author to whom correspondence should be addressed.
Separations 2025, 12(5), 114; https://doi.org/10.3390/separations12050114
Submission received: 15 March 2025 / Revised: 25 April 2025 / Accepted: 28 April 2025 / Published: 1 May 2025

Abstract

:
In recent years, non-alcoholic beers have been gaining popularity. Among the various components that affect the flavor and sensory characteristics of beers, free fatty acids (FFAs) are minor components. However, due to their involvement in beer quality, fast and simple methods for analyzing FFAs in beers are of importance. In this work, we present a liquid chromatography–high-resolution mass spectrometry (LC-HRMS) method for the rapid determination of FFAs in beers, avoiding a tedious sample preparation and derivatization and allowing the simultaneous study of a large set of FAs, including medium-chain, long-chain, saturated, monounsaturated and polyunsaturated FAs. The method was applied in the analysis of twelve non-alcoholic and nine alcoholic beer samples from the local market, permitting the comparison of their FFA profiling. Among the 37 FAs studied, 29 were quantified, and palmitic, stearic, oleic and myristic acids were identified as the predominant FAs in both alcoholic and non-alcoholic beers. The majority of the predominant long-chain FAs, including palmitic, stearic and myristic acids, were found in decreased amounts in non-alcoholic beers, compared to the alcoholic ones, with the marked exception of oleic acid, which was increased in non-alcoholic beers. Among the medium-chain FAs, octanoic acid was found at lower concentrations in non-alcoholic beers, comparing to regular beers, while lauric acid was slightly increased. Principal component analysis (PCA) suggested the correlation of FFAs with the type of beer (alcoholic or non-alcoholic beer).

1. Introduction

Beer is a carbonated alcoholic beverage that is widely consumed around the world. Traditionally, beer is brewed from raw materials, such as malted barley (Hordeum vulgare), hops (Humulus lupulus L.), water and yeast, but it is sometimes supplemented with other fermentable grains or sugar sources called adjuncts [1]. Beers can be categorized as high-fermentation, known as ales, and low-fermentation, known as lagers, depending on the preferred working temperature of the selected yeast strain [1]. Beer is a complex mixture of numerous chemical components that may be formed and react at all stages of the brewing process [1]. Many volatile and non-volatile compounds affect flavor, which is a crucial factor that reflects the quality of a beer. For instance, lipids (triacylglycerols, diacylglycerols, monoacylglycerols, phospholipids, sphingolipids and free fatty acids) that are present in wort and beer can affect yeast growth and metabolism, while also having an impact on foam stability [2]. Specifically, although free fatty acids (FFAs) are minor constituents of beer, their presence can influence beer quality and its flavor profile both positively and negatively [3]. For example, such compounds can have an impact on the brewing process at an early stage by affecting the water uptake ability and lipid profile of the barley grain [4]. Medium-chain FAs (possessing C6 to C12 carbon atom chain lengths), such as hexanoic (or caproic) acid, octanoic (or caprylic) acid and decanoic (or capric) acid, can be formed during fermentation, depending on factors such as yeast strain, wort composition, degree of aeration, etc. [5]. These compounds are known to contribute a rancid off-flavor to the final product when their concentration increases, causing their determination to be useful in monitoring the progress of maturation [6,7]. On the other hand, long-chain FAs (possessing more than 13 carbon atoms), such as linoleic and linolenic acid, have been reported as precursors leading to the formation of a characteristic aging flavor due to oxidative degradation [8]. Even though their levels are usually very low in beer, when formed in excess and under inappropriate storage conditions, they can afford stale-flavored breakdown products [9]. Interestingly, it was reported that the ratio of unsaturated and saturated FAs seems to be related to beer gushing, since unsaturated FAs are reported as gushing suppressors and saturated FAs as gushing promoters [10]. In detail, several studies have reported that some of the most representative FFAs during the fermentation of the wort are palmitic and stearic acid, though unsaturated FAs, such as oleic and linoleic acid, are also found in considerable quantities [11,12,13].
It is worth noting that brewing by-products, such as FFAs and other lipids, can also be potential sources of functional products, despite their low abundance. For instance, lipid extracts from beers derived at different stages of the brewing process have been previously assessed for their antithrombotic properties and FA composition [14,15,16]. In particular, polar lipid fractions of beer samples were measured for their ability to inhibit platelet-activating factor-induced and thrombin-induced platelet aggregation, exhibiting low IC50 values of 7.8 ± 3.9 μg and 4.3 ± 3.0 μg, respectively [15]. These antiplatelet lipid constituents mainly comprise saturated FAs and a high ratio of n-6 to n-3 polyunsaturated FAs, and they are present in non-alcoholic beer as well, albeit in lower quantities [16].
In recent years, efforts have also been focused on the production of beers with a lower alcohol content but possessing similar organoleptic characteristics to their alcoholic counterparts [17]. Such beers contain varying amounts of alcohol by volume (ABV), complying with different country regulations. For instance, the maximum alcohol content for non-alcoholic beers according to the Food and Drug Administration (FDA) should not exceed 0.5% ABV [18]. Though non-alcoholic beers are produced starting from the same main ingredients as regular beers, their low alcohol content can be achieved through different methods, collectively classified into physical and biological processes [19]. In the first case, ethanol is removed from the beer through a thermal process, such as evaporation and vacuum distillation, or the use of membrane technology such as dialysis. In the case of biological processes, ethanol production is controlled during the fermentation stage with the use of special low ethanol-producing yeast strains and low fermentable wort (low sugar content), as well as the modification of the fermentation conditions in order to arrest yeast activity [19]. Non-alcoholic beers have been gaining popularity as they represent a healthier and safer alternative to regular beers and may be suitable for individuals receiving medical treatment, pregnant or breast-feeding women and people who are generally limited in drinking alcohol [2,20]. In fact, it was reported that the moderate consumption of non-alcoholic beers can have a positive outcome on human health due to an increase in gut microbiota diversity with beneficial bacteria and an increase in fecal alkaline phosphatase activity, improving intestinal barrier function [21,22]. Additionally, the development and consumption of non-alcoholic beers with a modified carbohydrate composition led to a better postprandial response compared to regular non-alcoholic beer according to a recent study [23].
The determination of the levels of FFAs throughout the brewing process is of importance. Although HPLC methods have been used for the analysis of FFAs in beer with UV [24] or mass spectrometry (MS) detectors [16], gas chromatographic (GC) methods have been most commonly applied, utilizing flame ionization detectors (FIDs) [5,6,7,9,25], as well as MS detectors [3,14,26,27]. In common sample preparation procedures, direct liquid–liquid extraction or steam distillation are employed [9], requiring large quantities of solvents, though techniques involving the solid phase extraction (SPE) of FFAs have been reported, minimizing the use of organic solvents and leading to good recoveries [5,7,28]. Furthermore, techniques that are completely solvent-free, such as solid-phase microextraction (SPME) and stir bar sorptive extraction (SBSE), have also been applied for the determination of FFAs, though the simultaneous extraction of medium- and long-chain FAs can pose difficulties [6,25,26]. Finally, following extraction, a derivatization step is usually necessary for the detection of FFAs in beer samples through their conversion to their corresponding methyl esters (FAMEs) using reagents such as boron-trifluoride/methanol and diazomethane [5,9]. Most recently, Lehnhardt et al. reported an LC-MS/MS method for the determination of FFAs in wort using an isolator column [13].
Although methods for the determination of FFAs in beers exist [5,6,28] and data on the contents of FFAs in alcoholic beers can be found in the literature, detailed data for FFAs in non-alcoholic beers are missing. In the case of non-alcoholic beers, their different production methods may result in variations in FFA content. Thus, the aim of the present work was the development and validation of an analytical method for the detection and quantification of a large set of FFAs in beers, applying a simple and mild protocol for sample preparation and avoiding a derivatization step. Herein, we present a liquid chromatography–high-resolution mass spectrometry (LC-HRMS) method, allowing the determination of a variety of medium- and long-chain FFAs in beer samples. This method was applied for the determination of FFAs in non-alcoholic and alcoholic beer samples from the local market, allowing the comparison of the FFA profiling of alcoholic and non-alcoholic beers. Furthermore, principal component analysis (PCA) was applied to explore the correlation of FFA profiling with the type of beer (alcoholic or non-alcoholic).

2. Materials and Methods

2.1. Chemicals and Reagents

The solvents used in this work were of LC-MS analytical grade. Isopropyl alcohol and methanol were obtained from Fisher Scientific (Loughborough, UK), and formic acid 98–100% was purchased from Chem-Lab (Zedelgem, Belgium). Hexanoic/caproic acid (C6:0) was obtained from Alfa Aesar (>98%, Lancashire, UK) and dodecanoic/lauric acid (C12:0, >99%) from Acros Organics (Geel, Belgium). The following FA standards, namely, heptanoic acid (C7:0, >99.5%), octanoic/caprylic acid (C8:0, >99.5%), decanoic/capric acid (C10:0, >99%), tetradecanoic/myristic acid (C14:0, >99.5%), 9-tetradecenoic/myristoleic acid (C14:1 n-5, >99%), pentadecanoic acid (C15:0, >99%), heptadecanoic/margaric acid (C17:0, >98%), 9,12-cis-octadecadienoic/linoleic acid (C18:2 n-6, >99%), 6,9,12-cis-octadecatrienoic acid/γ-linolenic (C18:3 n-6, >99%), 5,8,11,14-cis-eicosatetraenoic acid/arachidonic (C20:4 n-6, >99), docosanoic/behenic acid (C22:0, >99%), 7,10,13,16-cis-docosatetraenoic acid and 4,7,10,13,16,19-cis-docosahexaenoic acid (C22:6 n-3, >98%), were purchased from Sigma Aldrich (Steinheim, Germany). In addition, the following FA standards, namely, hexadecanoic/palmitic acid (C16:0), 9-hexadecenoic/cis-9-palmitoleic (C16:1 n-7), octadecanoic/stearic acid (C18:0), cis-9-octadecenoic/oleic acid (C18:1 n-9), cis-6-octadecenoic/petroselinic (C18:1 n-12) and 5,8,11,14,17-cis-eicosapentaenoic acid (C20:5 n-3), were of analytical standard grade and obtained from Fluka (Karlsruhe, Germany). Finally, the remaining FA standards were obtained from Cayman Chemical Company (Ann Arbor, MI, USA) and are listed as follows: nonanoic acid (C9:0, >98%), undecanoic acid (11:0, >98%), tridecanoic acid (13:0, >98%), 10-cis-heptadecenoic acid (C17:1 n-7, >98%), nonadecanoic acid (19:0, >98%), eicosanoic/arachidic acid (C20:0, >98%), 3,7,11,15-tetramethyl hexadecanoic acid/phytanic acid (C20:0, ≥96%), 9-eicosenoic/gadoleic acid (C20:1 n-11, >98%), 8,11,14-cis-eicosatrienoic/dihomo-γ-linolenic acid (C20:3 n-6, >98%), 5,8,11-cis-eicosatrienoic acid (C20:3 n-9, >98%), heneicosanoic acid (C21:0, >98%), 13-docosenoic/erucic acid (C22:1 n-9, >98%), 7,10,13,16,19-cis-docosapentaenoic acid (C22:5 n-3, >98%), tricosanoic acid (23:0, >98%), tetracosanoic/lignoceric acid (C24:0, >98%), 15-tetracosenoic acid/nervonic acid (24:1 n-9, >98%) and hexacosanoic/cerotic acid (26:0, >98%). The full set of analytes is listed in Table S1, which is provided in the Supplementary Materials.

2.2. Stock and Working Solutions

The analytical standards were dissolved in methanol at a concentration of 1000 mg/L (stock solutions) and stored at 4 °C. The daily preparation of fresh working solutions at concentrations of 500 and 1000 ng/mL was achieved through appropriate dilution.

2.3. Instrumentation

The LC-MS/MS analysis was performed on an ABSciex Triple TOF 4600 (ABSciex, Darmstadt, Germany) in conjunction with a micro-LC Eksigent (Eksigent, Darmstadt, Germany), featuring an autosampler maintained at 5 °C and a thermostated column compartment. All MS experiments employed electrospray ionization (ESI) in negative mode. The data acquisition method included a TOF-MS full scan at a range of m/z 50–850 and several information-dependent acquisition (IDA)-TOF-MS/MS product ion scans utilizing 40 V collision energy (CE) with a 15 V collision energy spread (CES) used for each candidate ion during each data acquisition cycle (1091). This workflow facilitates both quantitation (primarily using TOF-MS) and confirmation (using IDA-TOF-MS/MS) in a single run. The working conditions regarding MS resolution were as follows: ion energy 1 (IE1) −2.3, vertical steering (VS1) −0.65, horizontal steering (HST) 1.15 and vertical steering 2 (VS2) 0.00. A Halo C18 2.7 μm, 90 Å, 0.5 × 50 mm2 column purchased from Eksigent (Eksigent, Darmstadt, Germany) was employed for this study. The mobile phase was composed of a gradient system (A: acetonitrile/0.01% formic acid/isopropanol 80/20 v/v; B: H2O/0.01% formic acid) with the elution gradient commencing at 5% of phase A for 0.5 min, progressively increasing to 98% over the next 7.5 min at a flow rate of 55 µL/min. These conditions were maintained for 0.5 min, and then the initial conditions (95% solvent B, 5% solvent A) were reinstated within 0.1 min in order to re-equilibrate the column for 1.5 min prior to the next injection.
Data acquisition was performed with the use of PeakView 2.1 and MultiQuant 3.0.2 from ABSciex (Darmstadt, Germany). Extracted ion chromatograms (EICs) were obtained through MultiQuant 3.0.2, which produced base peak chromatograms for masses achieving a mass accuracy width of 0.01 Da. The relative retention time tolerance was established within a margin of ±2.5%.

2.4. Sample Preparation

Sample preparation was conducted as previously reported for the analysis of wine samples [29]. Briefly, isopropanol (950 μL) was added to the beer sample (50 μL) in a screw-cap glass centrifuge tube. After vortexing for 0.5 min, the sample was centrifuged at 4000× g for 10 min. In a vial, 500 μL of supernatant was then diluted with 500 μL of water and was directly utilized for LC-MS/MS analysis.

2.5. Method Validation

Beer samples were spiked at three concentration levels in order to estimate the recovery (%R), the intra-day variations RSDr (%), the inter-day variations RSDR (%) and the matrix effect (ME). The recovery was employed for the quantification of the selected compounds.

2.6. Sampling

Twenty-one lager beer products were collected from a local market in Athens, Greece. Twelve of them were non-alcoholic beers. For nine of the non-alcoholic beers, we were able to find in the market the alcoholic (4.8–5.0% ABV) equivalents (produced by the same brand). For the remaining three non-alcoholic beers, we were unable to find in the market their alcoholic counterparts (same brand). The ABV values of the twelve non-alcoholic beers varied from 0.0 to 0.5%. Among these samples, one alcoholic and two non-alcoholic beers were labeled as pilsners. Collectively, the alcohol content, %ABV, country of origin and type of beer are summarized in Table 1. Samples 13–21 are the non-alcoholic equivalents of samples 1–9, respectively.

2.7. Statistical Analysis

The level of significance was determined utilizing an Excel t-Test: two samples assuming unequal variances. Principal component analysis (PCA) was conducted with XLSTAT 2018 version (Addinsoft, New York, NY, USA).

3. Results

3.1. Sample Preparation and Method Validation

Based on our previous work on the determination of FFAs in wine samples [29], a mild and simple sample preparation procedure was followed, starting with the addition of isopropanol to the beer samples for extraction and protein precipitation. After centrifugation, part of the supernatant was further diluted with water and used for the analysis.
For the validation of the method, the trueness and the precision were verified following the guidelines of the EU Commission decision 2002/657/EC. The beer samples were spiked at three different concentration levels (50, 200 and 500 ng/mL) with three replicates for each fortification level. For the set of the 37 studied FAs, the recoveries ranged from 81, 80 and 82% to 95, 109 and 109% for the low, medium and high spike levels, respectively (Table 2). Thus, the trueness of the present method is indicated by its satisfactory recoveries. To investigate the precision of the method, the intra-day and the inter-day relative standard deviations (%RSD) were determined. The intra-day %RSDr and inter-day %RSDR values ranged from 0.1% to 15.8% and from 0.5% to 14.7%, respectively (Table 2).
The matrix effect was calculated as the ratio of the peak response in the presence of the matrix to the peak response in the pure solvent, following the guidelines of the EU Commission Regulation 2021/808. The determined matrix effect values are summarized in Table 2. A matrix effect value of <1 indicates signal suppression, while that of >1 signal enhancement.

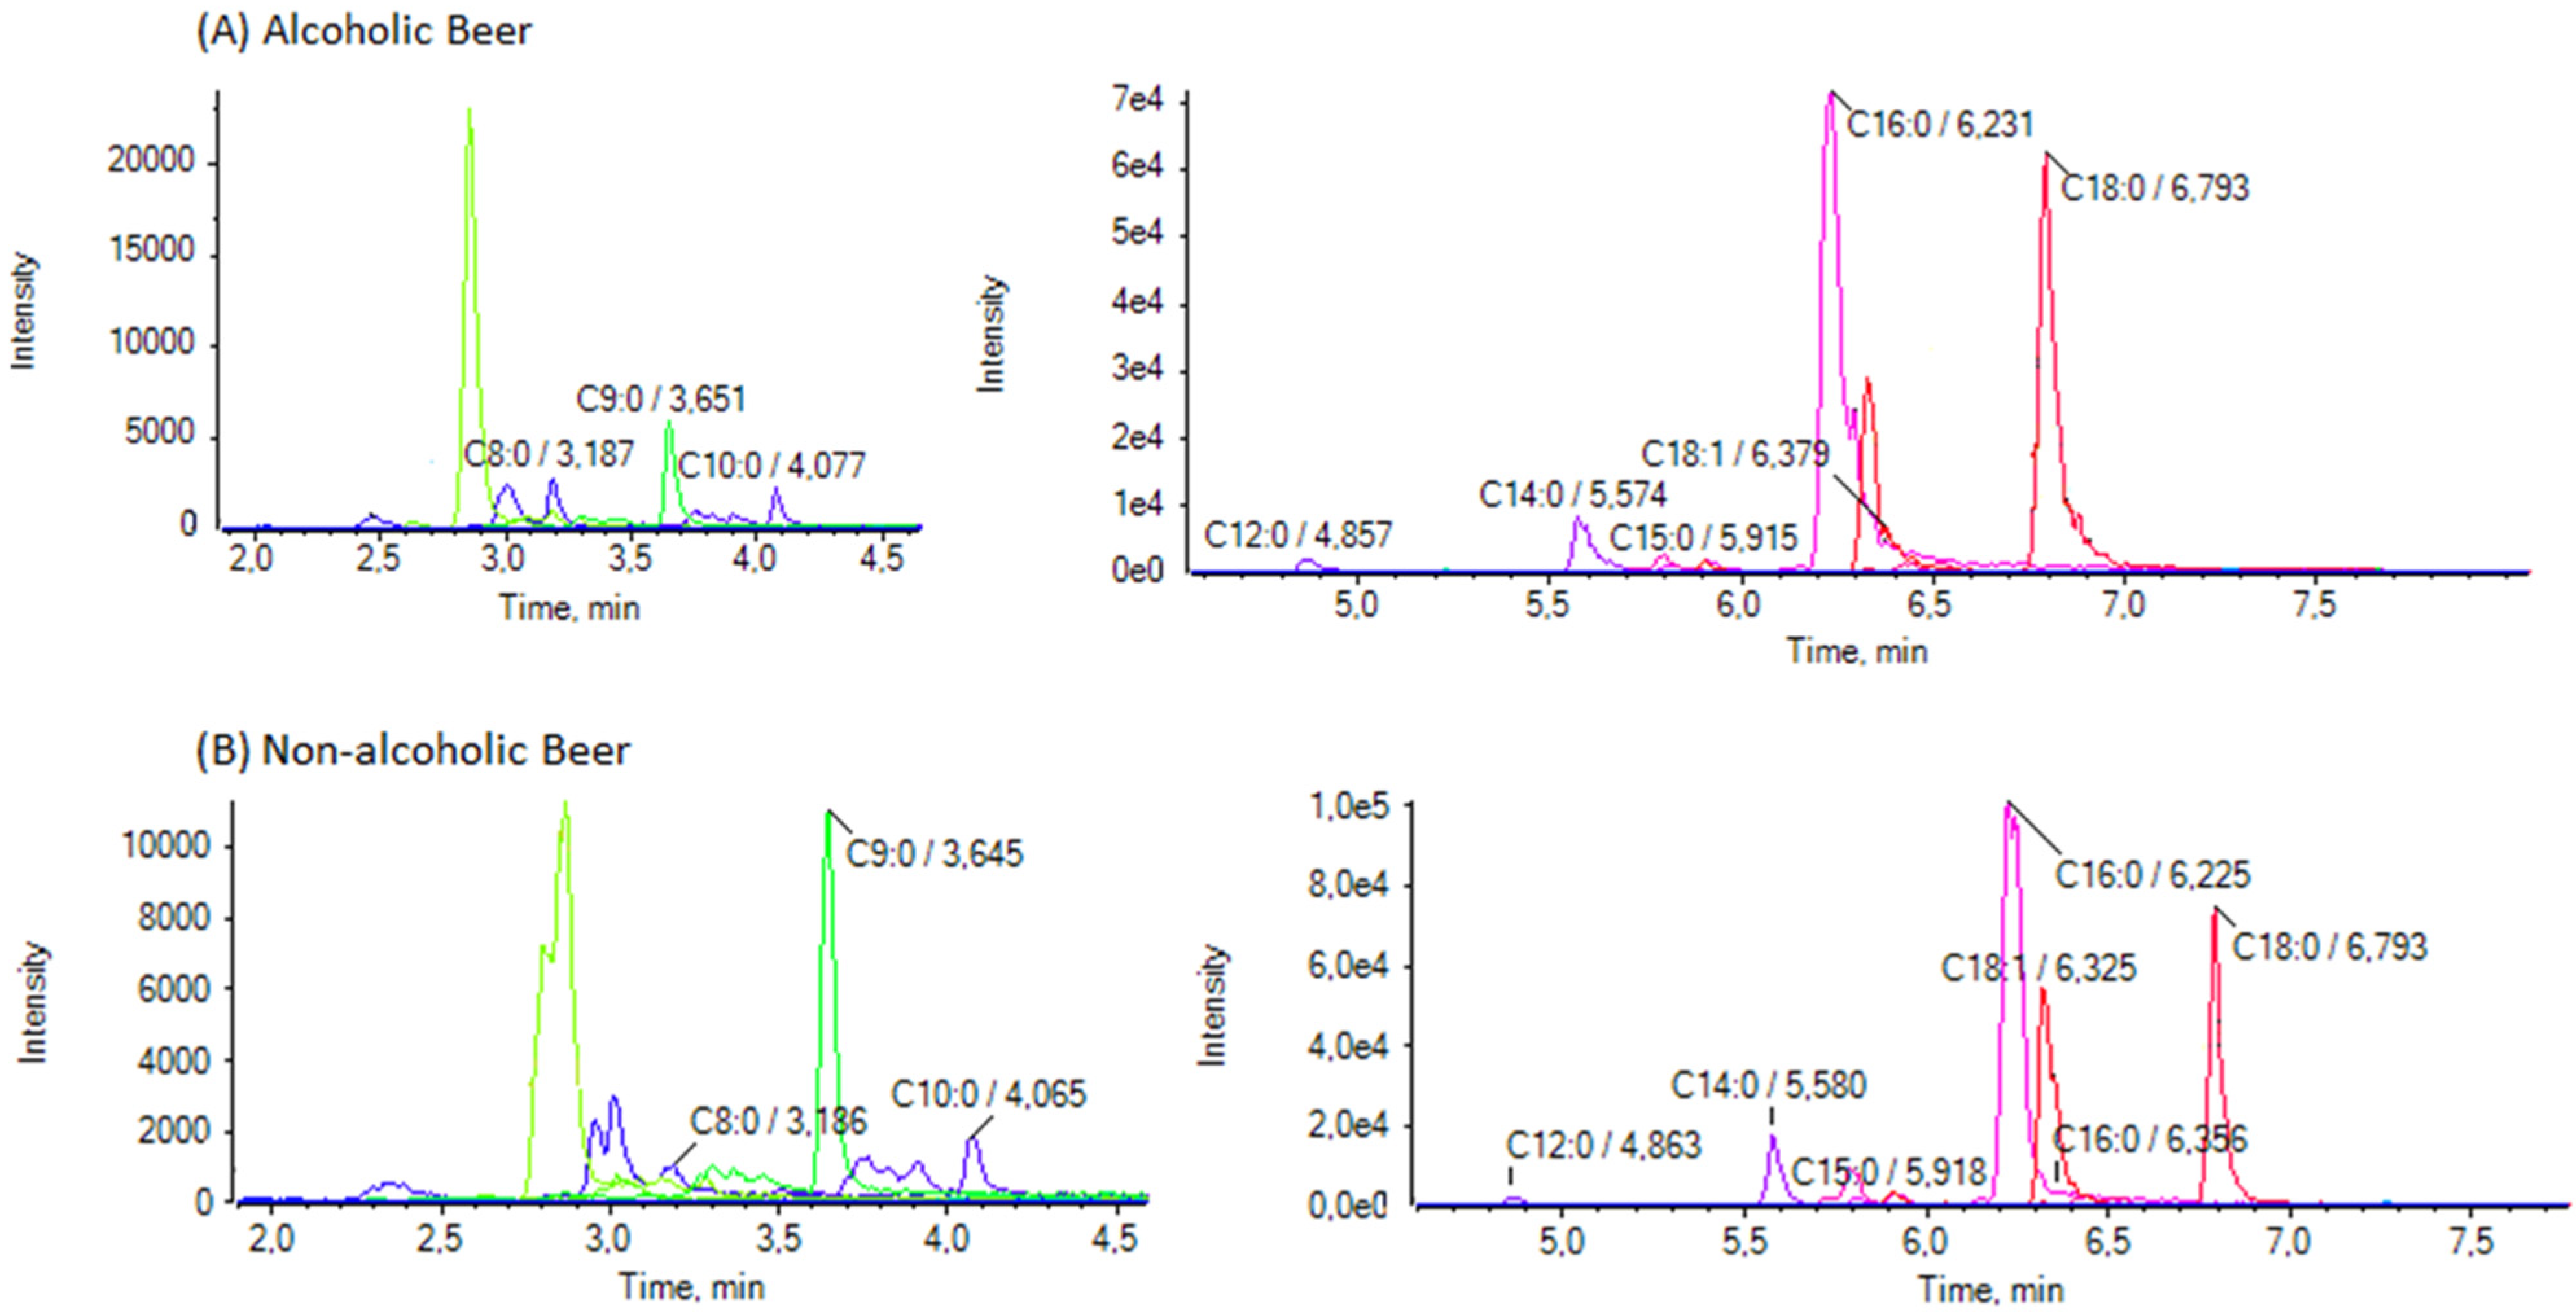
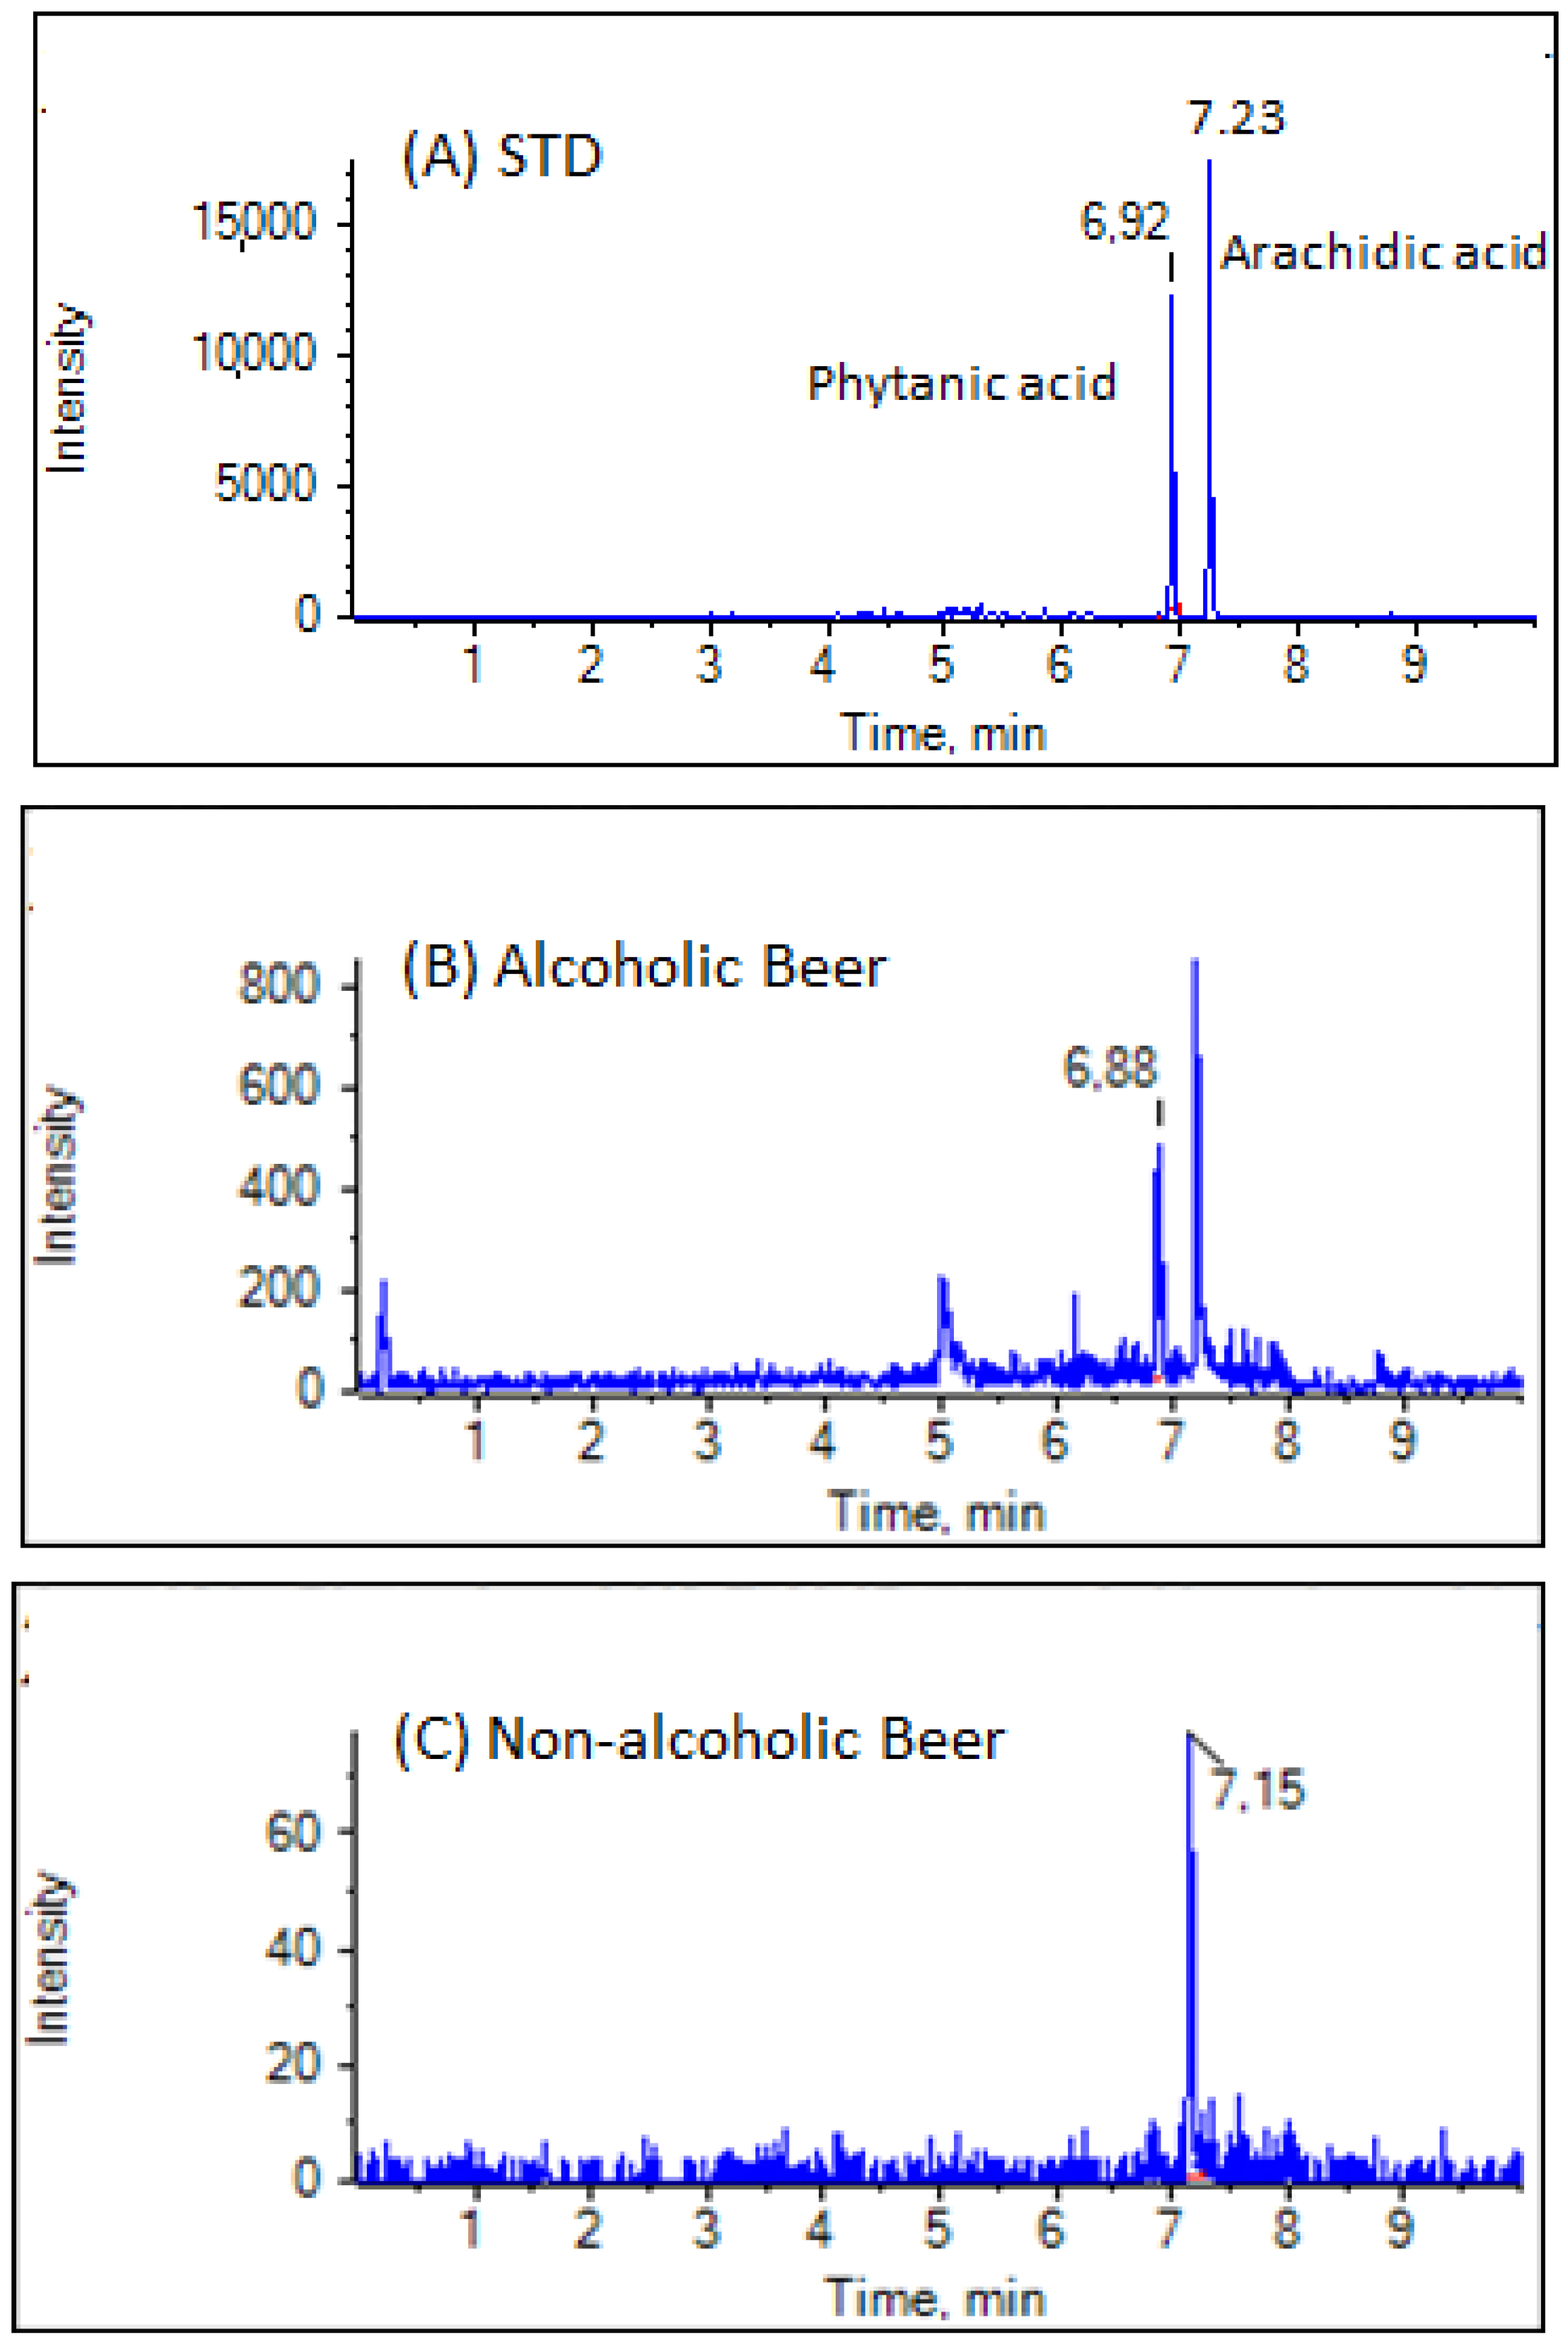
3.2. Analysis of Samples

We developed a rapid LC-HRMS method that allows the simultaneous determination of a variety of FFAs (thirty-seven) in beer samples in a 10-min run. In our study, we included FAs with odd and even numbers of carbon atoms, saturated, monounsaturated and polyunsaturated. More specifically, the following FAs were analyzed: C6:0, C7:0, C8:0, C9:0, C10:0, C11:0, C12:0, C13:0, C14:0, C14:1, C15:0, C16:0, C16:1, C17:0, C17:1, C18:0, C18:1 (oleic acid), C18:1 (petroselinic acid), C18:2, C18:3 total, C19:0, C20:0 (arachidic acid), C20:0 (phytanic acid), C20:1, C20:3 (bishomo-γ-linolenic acid), C20:3 (5,8,11-eicosatrienoic acid), C20:4, C20:5, C21:0, C22:0, C22:1, C22:4, C22:5, C22:6, C23:0, C24:0 and C24:1. Their exact masses [M − H] and their chromatographic retention times Rt, together with their limits of detection (LOD) and quantification (LOQ), are presented in Table S1 (Supplementary Materials).
The extracted ion chromatograms (EICs) of the common FFAs in a representative alcoholic beer sample (A) and a representative non-alcoholic beer sample (B) are presented in Figure 1. In the case of the two isobaric C20:0 FAs, namely phytanic and arachidic acid, the current chromatographic method provides a satisfactory chromatographic separation, as depicted in Figure 2. Both phytanic and arachidic acid possess identical molecular formulae and exact masses (C20H40O2, 312.3028); however, they are eluted at different retention times (Figure 2).
The contents of the FFAs in the beer samples (triplicates) are summarized in Table 3, and they are expressed as μg of FA per mL of beer. In the alcoholic beer samples, palmitic acid was the most predominant FA, found in quantities ranging from 13.5 to 18.1 μg/mL (Table 3). In addition, other FAs that were measured in high quantities were oleic acid (4.3 to 8.4 μg/mL), stearic acid (5.4 to 8.0 μg/mL), myristic acid (2.9 to 3.9 μg/mL), lauric acid (1.0 to 4.4 μg/mL) and octanoic acid (1.0 to 1.8 μg/mL). The remaining FAs were detected at concentrations lower than 1.0 μg/mL (Table 3).
In the non-alcoholic beer samples, the FFAs were generally detected in lower concentrations compared to the alcoholic beer samples (Table 3). Palmitic acid was again the most predominant FA, in quantities between 5.6 and 15.0 μg/mL, followed by oleic acid (5.0 to 11.9 μg/mL) and stearic acid (0.40 to 5.7 μg/mL). Subsequently, lauric acid was detected at concentrations ranging from 1.0 to 3.8 μg/mL and myristic acid from 0.5 to 1.8 μg/mL. The remaining FAs were detected at concentrations lower than 1.0 μg/mL, while C18:1 (petroselinic acid), C18:3, C20:3 (bishomo-γ-linolenic acid), C20:4, C22:1, C22:4 and C24:1 were not detected in any of the samples (Table 3).
It is worth noting that some FFAs were determined in higher quantities in the non-alcoholic beers compared to the alcoholic beers; for instance, C18:1 (oleic acid) was found at 5.7 and 7.6 μg/mL on average in the alcoholic and non-alcoholic beer samples, respectively. A similar trend, though not as pronounced, was observed for C12:0, C22:0, C22:5 and C24:0.
Overall, in the alcoholic beer samples tested, palmitic acid comprised 39.4% of the total FFAs, stearic acid 16.2%, oleic acid 13.8% and myristic acid 8.5%, respectively. Accordingly, in the non-alcoholic beer samples tested, palmitic acid comprised 34.6% of the total FFAs, oleic acid 28.1%, stearic acid 10.3%, lauric acid 9.7% and myristic acid 3.5%.

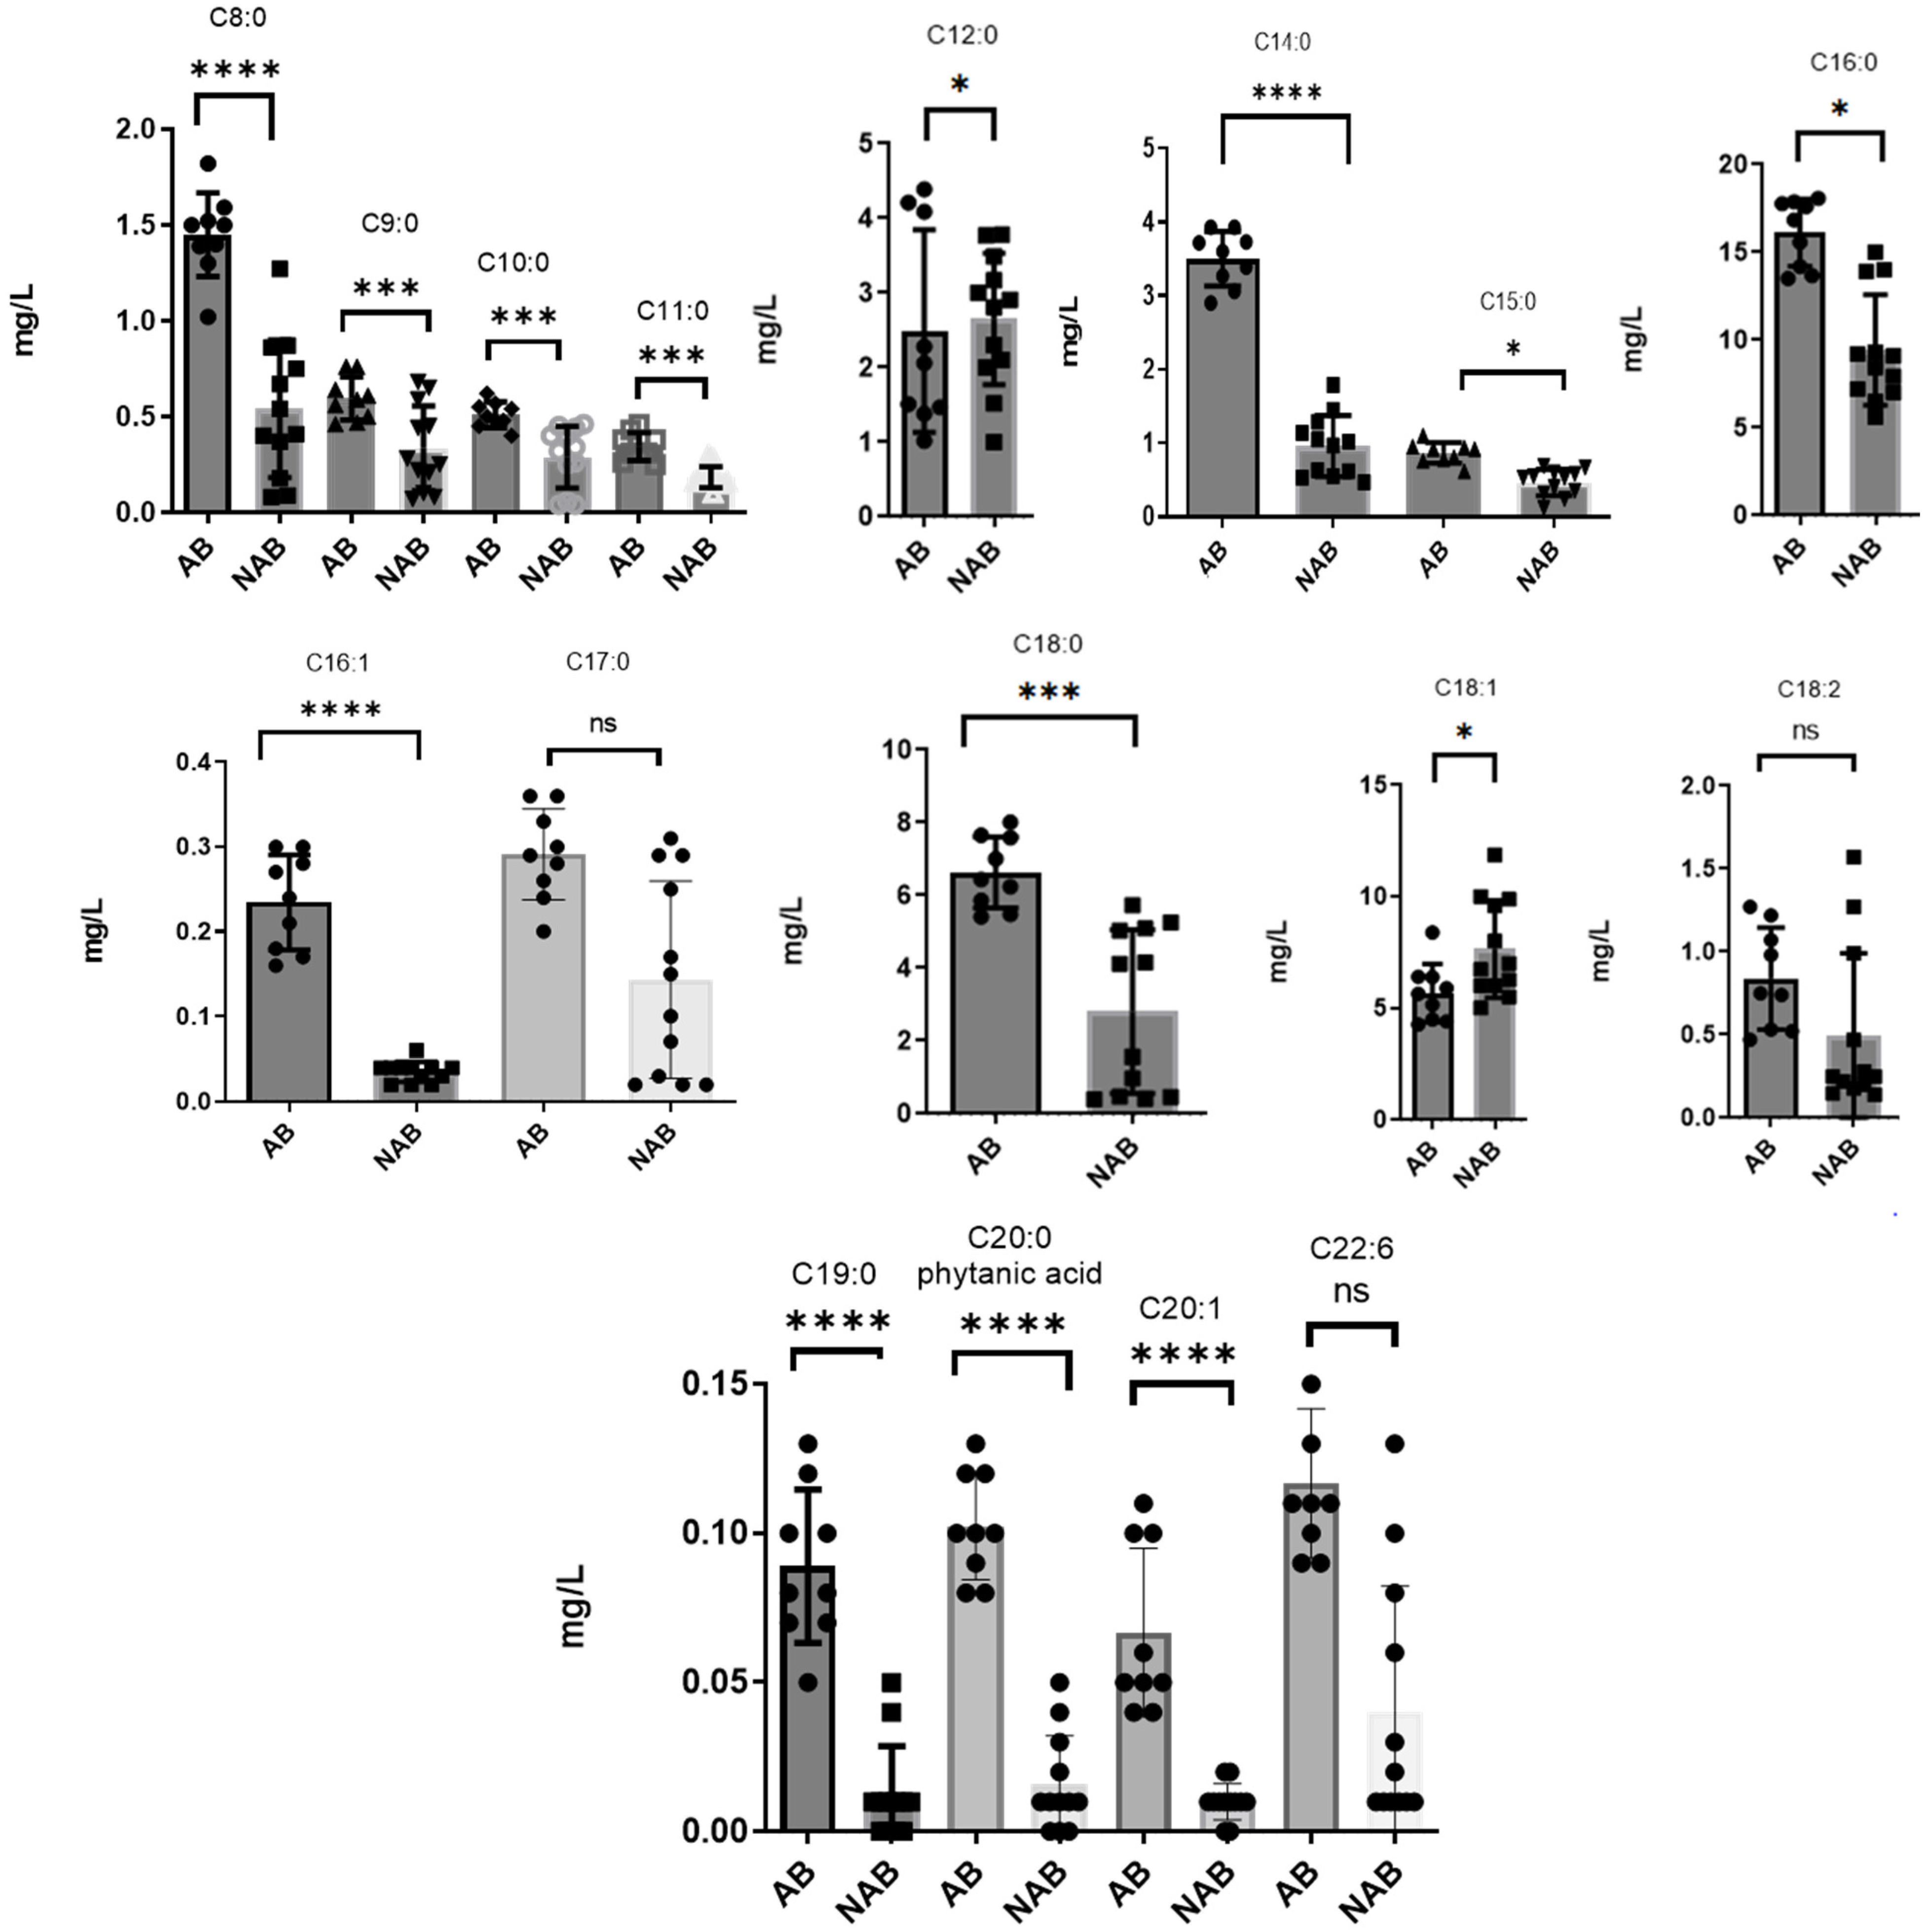
3.3. Comparison of FFA Levels in Alcoholic and Non-Alcoholic Beers

The results summarized in Table 3 show that for the majority of FFAs, their contents are clearly different in the alcoholic and non-alcoholic beer samples. These alterations are better shown in Figure 3. The medium-chain saturated FAs C8:0, C9:0, C10:0 and C11:0 were found in significantly higher quantities in the alcoholic beer samples, with C8:0’s average concentration (1.4 ± 0.2 μg/mL) being the highest in this group of compounds. However, C12:0 was found slightly elevated in the non-alcoholic beers. The long-chain saturated FAs C14:0, C15:0, C16:0, C17:0, C18:0, C19:0 and C20:0 (phytanic acid) were also found to be significantly more abundant in the alcoholic beer samples, with palmitic (16.1 ± 1.9 μg/mL) and stearic acid (6.6 ± 1.0 μg/mL) being the most abundant. Finally, the long-chain unsaturated FAs C16:1, C18:2, C20:1 and C22:6 were also more abundant in the alcoholic beer samples, though in the case of C18:2 and C22:6, not significantly, as depicted in Figure 3. Oleic acid constitutes a marked exception in this general trend. It was found clearly elevated in non-alcoholic beers (7.6 ± 2.2 μg/mL, representing 28.1% of total FFAs) compared to alcoholic beers (5.7 ± 1.3 μg/mL, representing 13.8% of total FFAs).

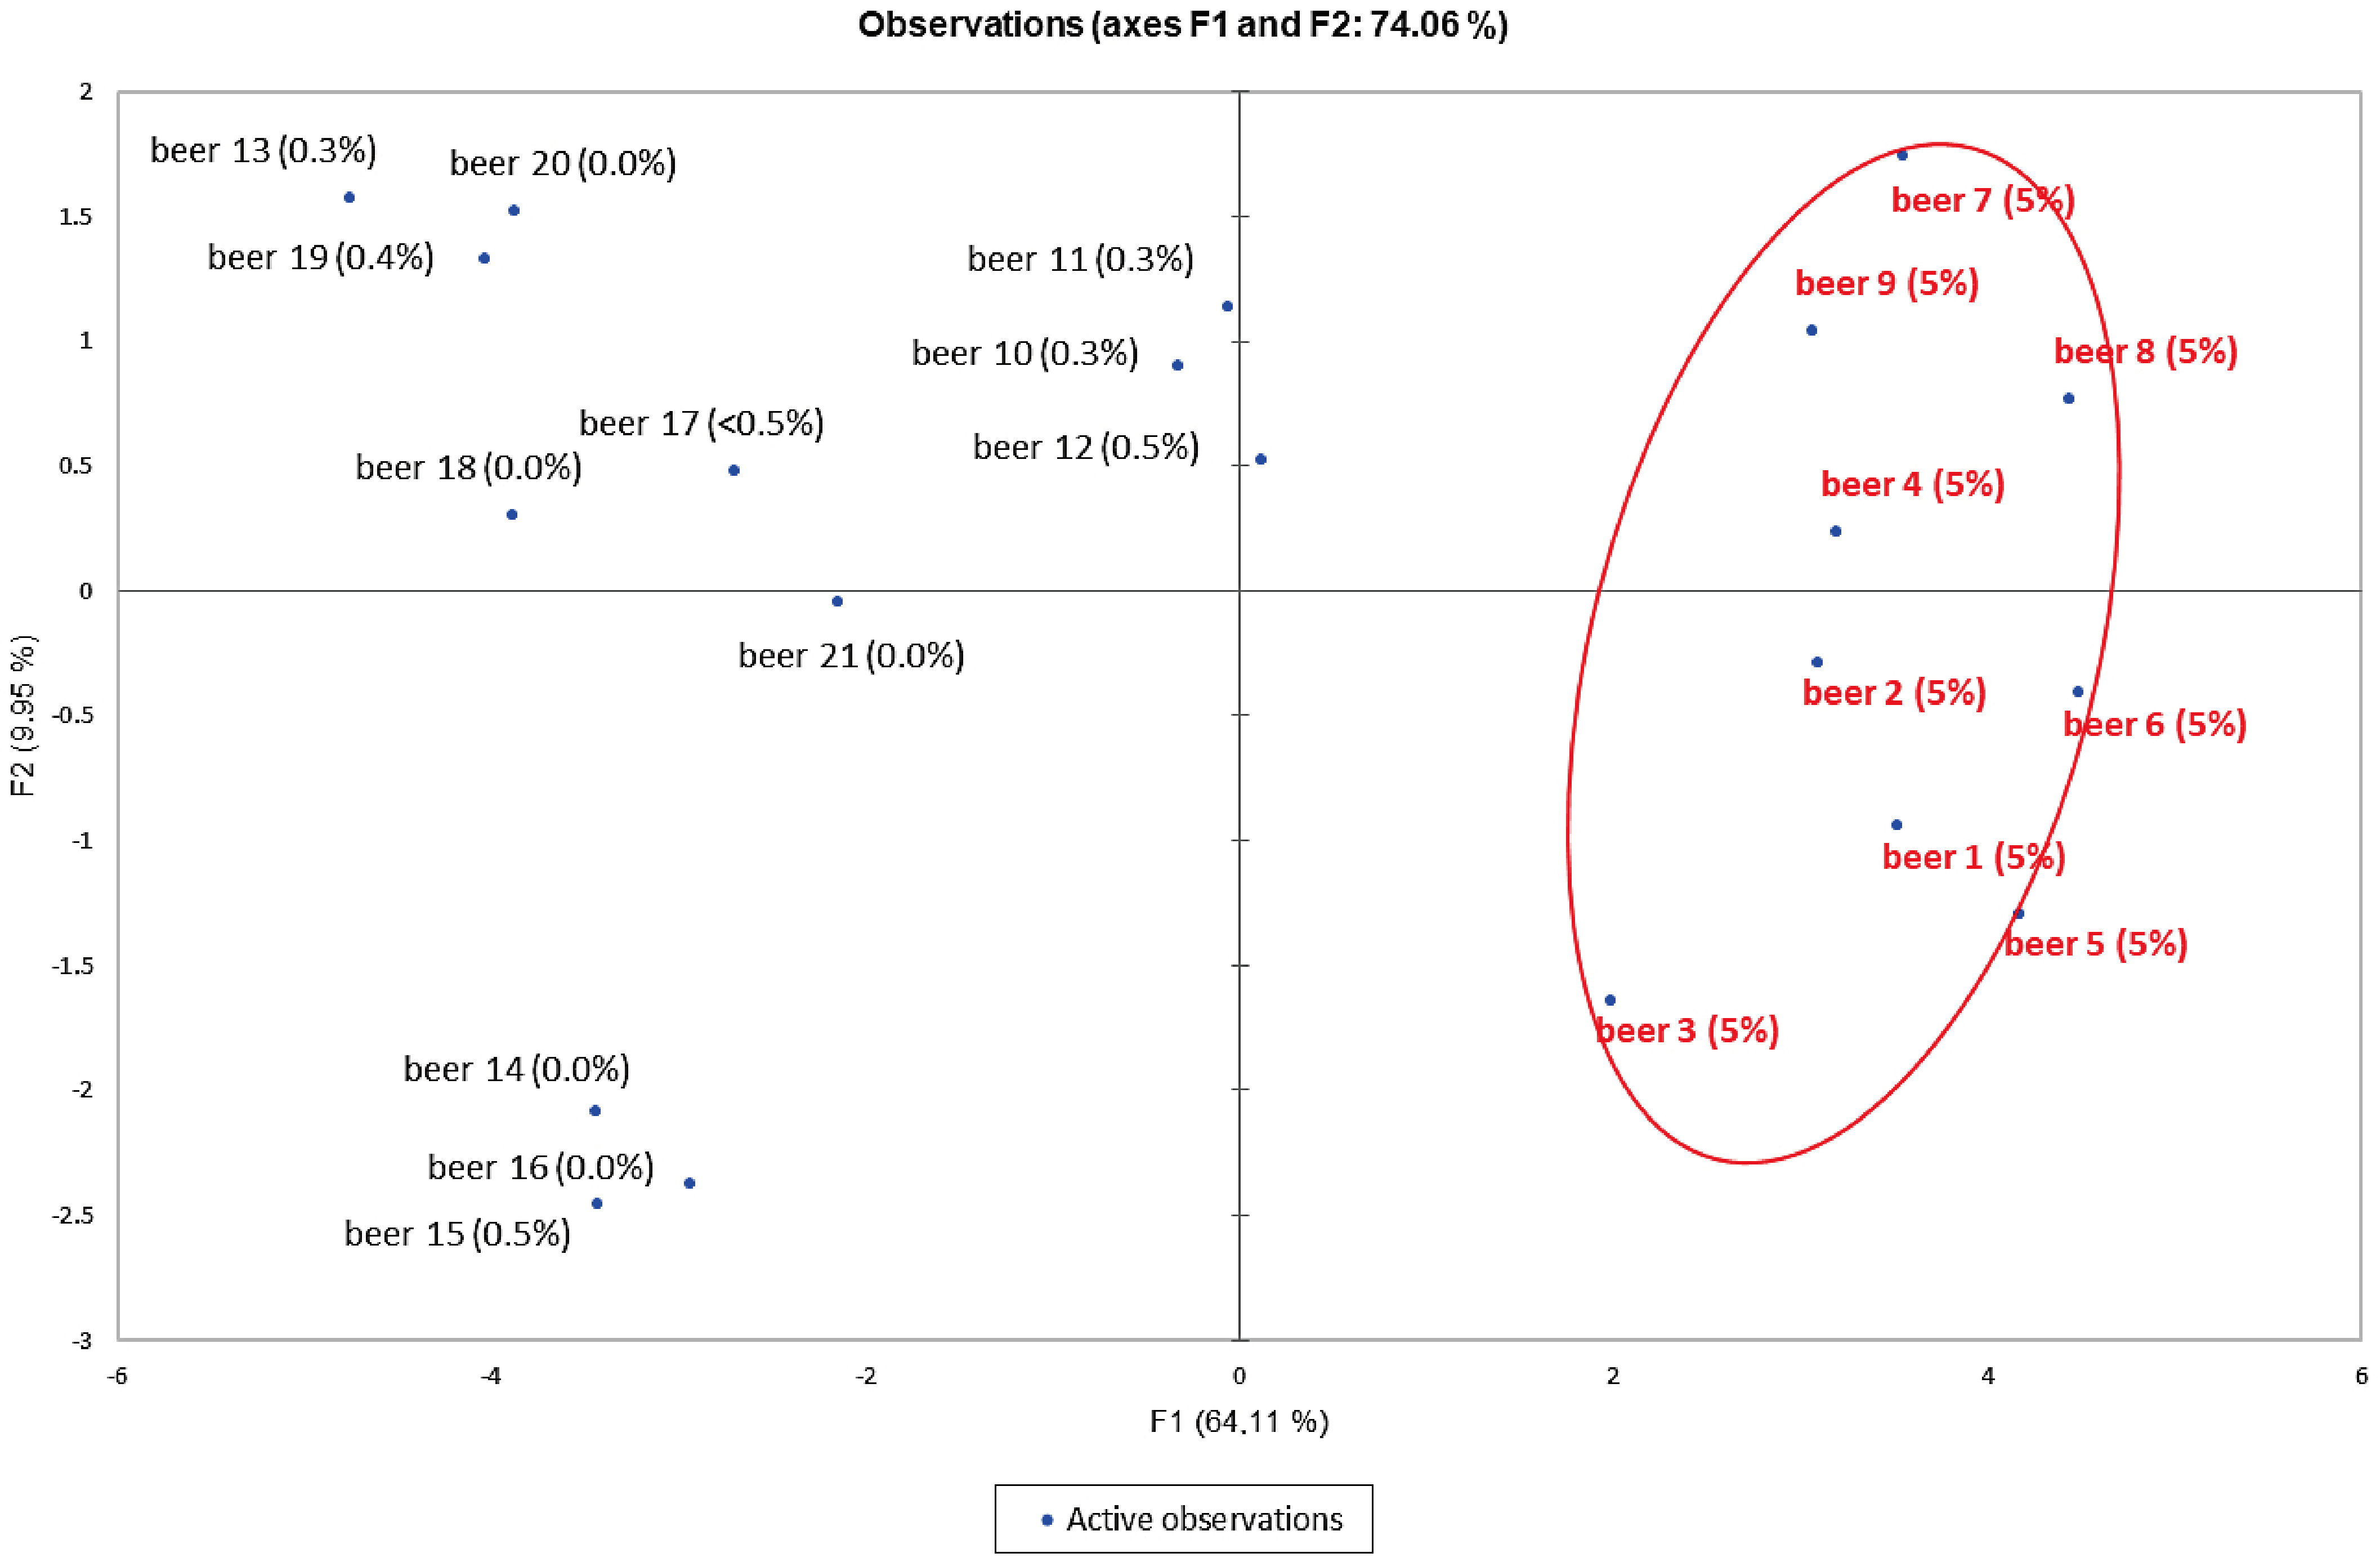
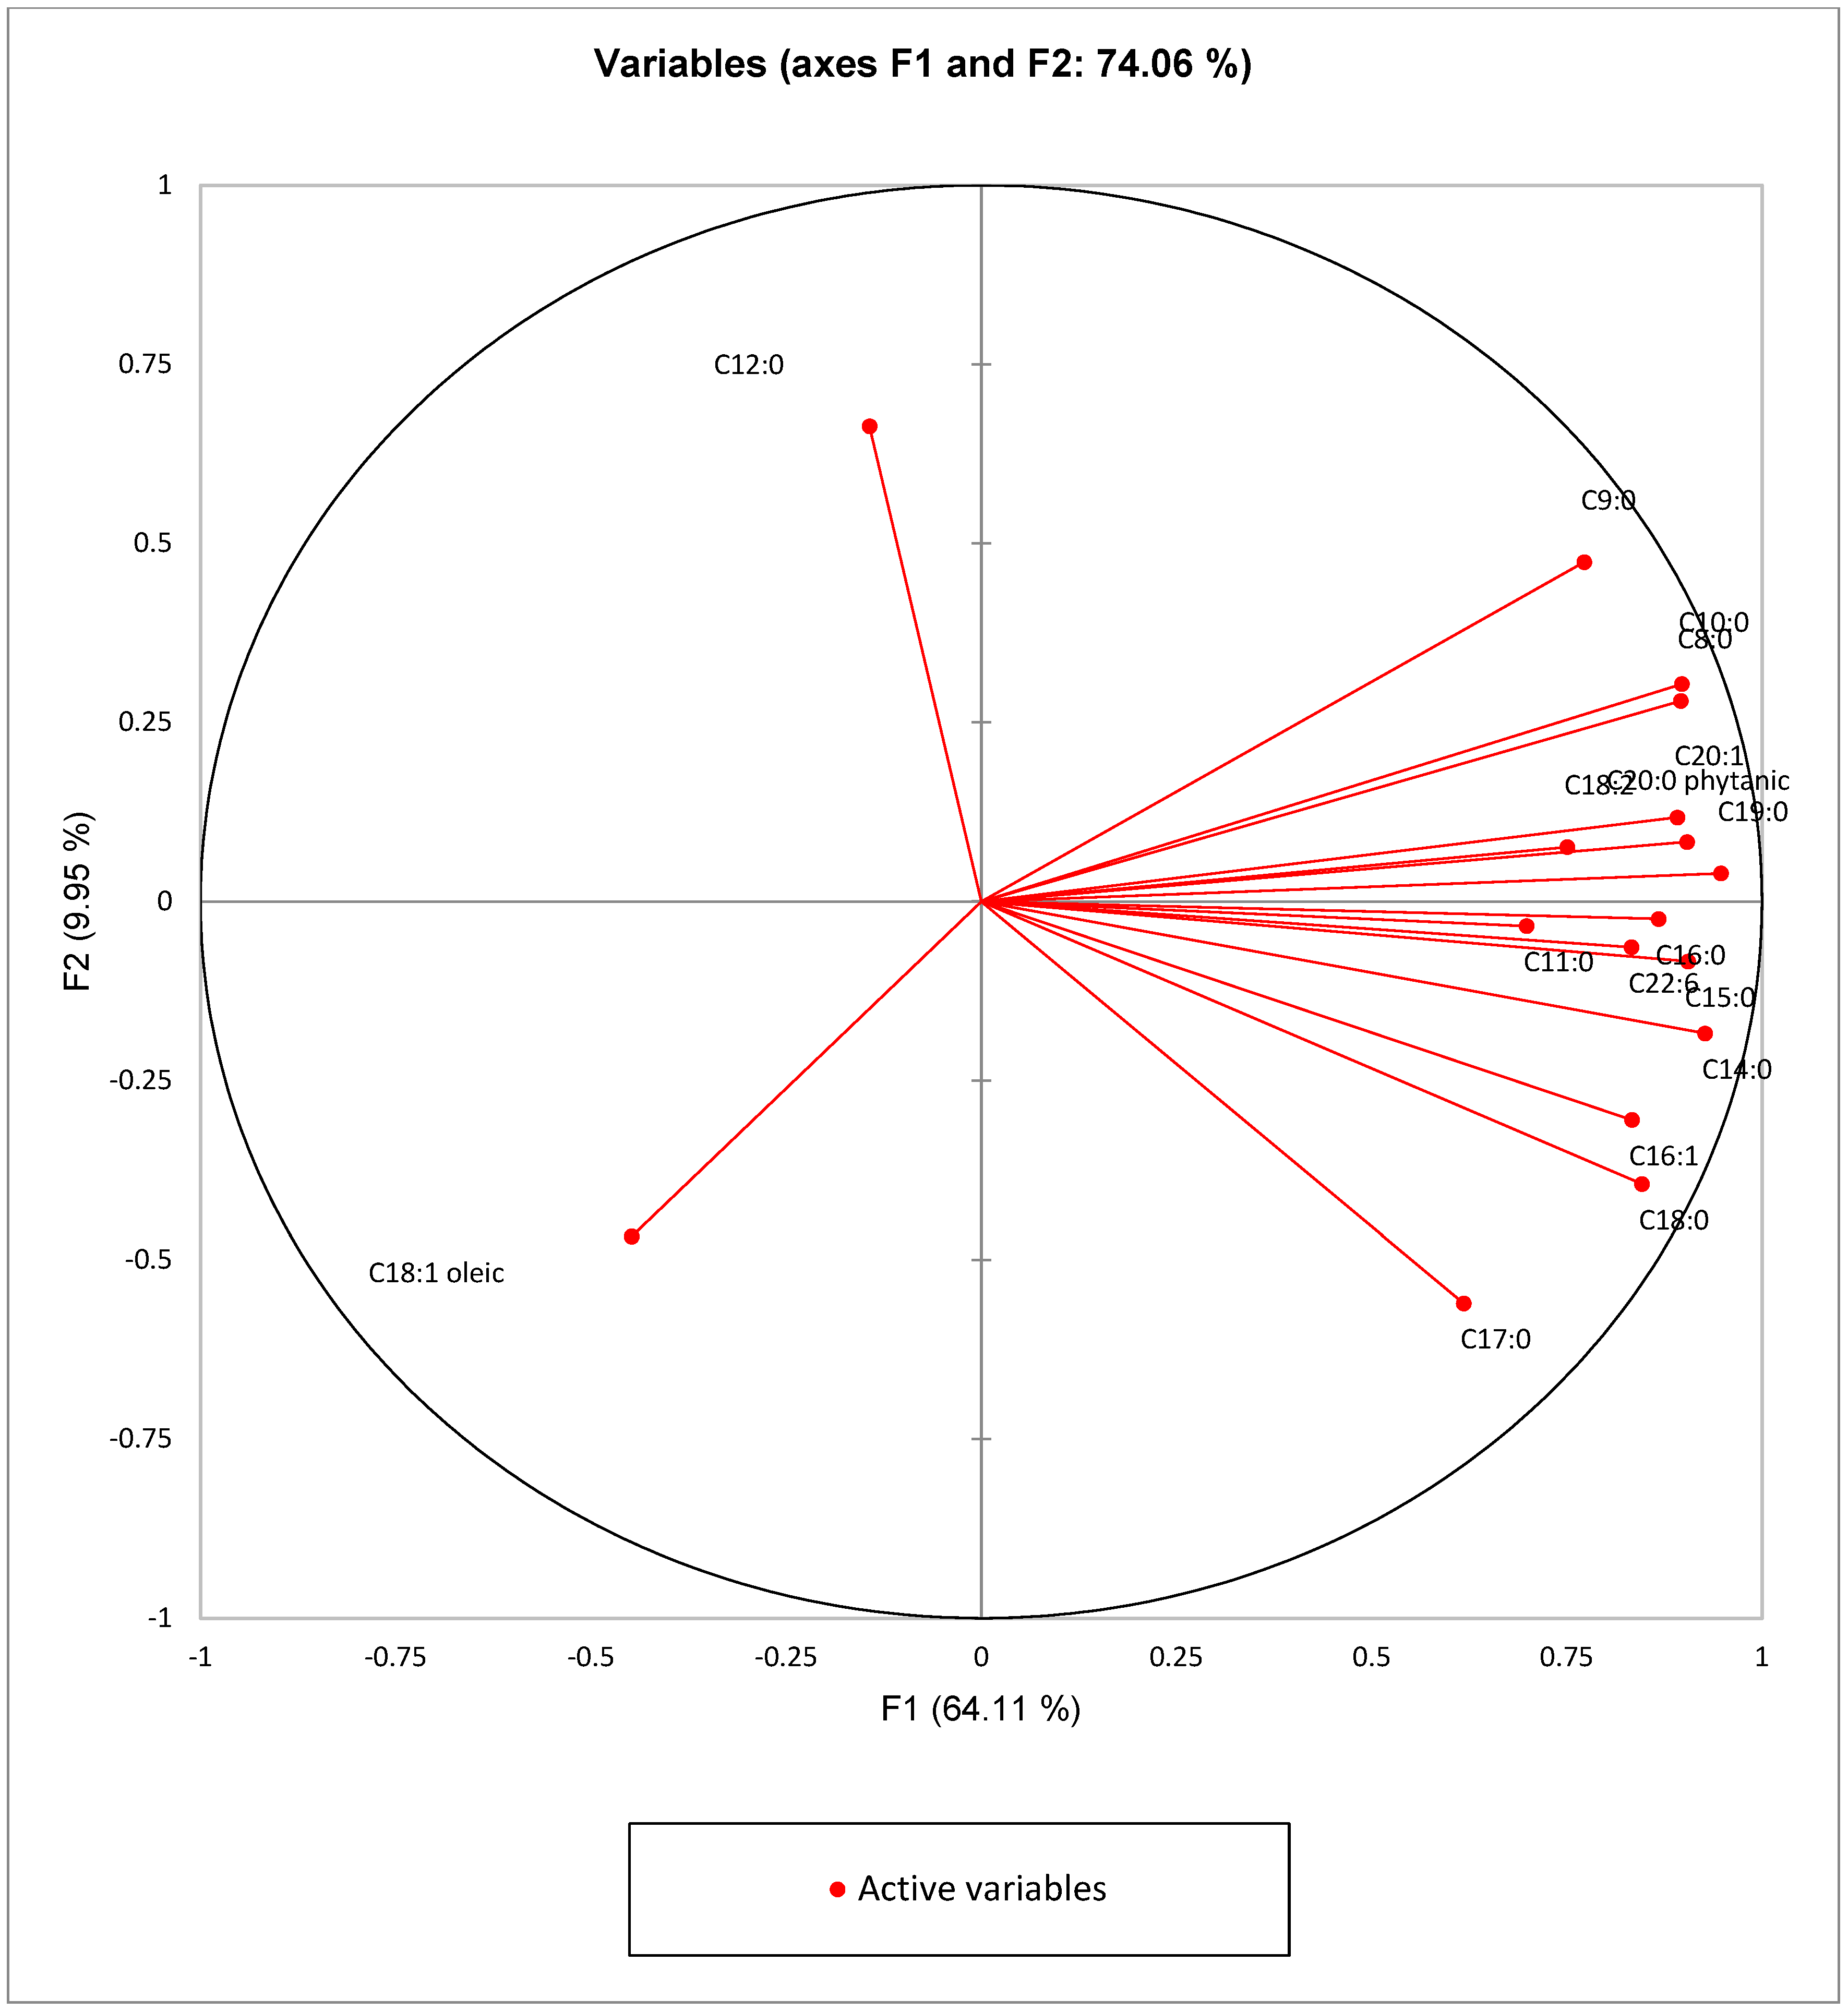
3.4. Principal Component Analysis (PCA)

Multivariate statistical analysis was employed in order to explore the correlation of FFA contents with the presence or absence of alcohol in beers. In this context, we attempted to map the distribution of the beer samples and identify the alcoholic and non-alcoholic beer samples. The FFA data were analyzed via PCA to establish any “clustering” with respect to the two groups (alcoholic and non-alcoholic beer samples). A PCA model was constructed using 17 variables (C8:0, C9:0, C10:0, C11:0, C12:0, C14:0, C15:0, C16:0, C16:1, C17:0, C18:0, C18:1 oleic acid, C18:2, C19:0, C20:0 phytanic acid, C20:1 and 22:6), corresponding to the FFAs examined. The scree plot is presented in Figure S1 (Supplemental Material), showing Eigen values of 10.90 and 1.69 for PC1 and PC2, respectively. As depicted in Figure 4, the first two components of the model (PC1 and PC2) explain 74.06% of the variance, and the score plot of PC1 (64.11%) versus PC2 (9.95%) indicates a good discrimination of the two groups of beer samples. The alcoholic beer samples are located at the right part, while the non-alcoholic beer samples are located at the left part of the plot. Figure 5 shows the contribution of the variables to the first two components. C8:0, C9:0, C10:0, C11:0, C14:0, C15:0, C16:0, C16:1, C17:0, C18:0, C18:2, C19:0, C20:0 phytanic acid, C20:1 and 22:6 considerably contribute to PC1, while C12:0 to PC2 (see Tables S2 and S3, Supplemental Materials). Lauric acid as well as C18:1 oleic acid, located at the left part of the plot, are correlated with the non-alcoholic beer samples, while C8:0, C9:0, C10:0, C11:0, C14:0, C15:0, C16:0, C16:1, C17:0, C18:0, C18:2, C19:0, C20:0 phytanic acid, C20:1 and 22:6, located at the right part, are correlated with the alcoholic beer samples.

4. Discussion

Lipids, including FAs, comprise approximately 1 to 3 g per kg of barley grain weight [30]. The germination of barley and the mashing process can lead to the loss of lipid content due to the release of FFAs, which are subsequently metabolized. Lipases are enzymes present in barley grains that catalyze the hydrolysis of triglycerides at the lipid–water interface to yield FFAs [11,31]. In addition, malt lipases have been reportedly found in the insoluble portion of the mash and were thermally stable as they were active at temperatures of 67 °C, indicating that the hydrolysis of triglycerides, as well as the release of FFAs, may continue through mashing [31]. On the other hand, in fermenting wort, long-chain unsaturated FAs are crucial for yeast activation and cell growth under anaerobic conditions, affecting the fermentation process [32]. Saturated FAs also play an important role in yeast physiology (e.g., cell membrane), where palmitic and stearic acids are typically the most abundant FAs [33]. When such FFAs are not provided by wort, several yeasts are able to generate lipases to facilitate the degradation of triglycerides to glycerol and FFAs [34]. Finally, FFAs can additionally be degraded in malt by lipoxygenases, a group of enzymes that catalyze the oxygenation of unsaturated FAs, such as linoleic acid, containing a cis,cis-1,4-pentadiene system, to form hydroperoxides, which are further decomposed into stale flavor compounds, such as trans-2-nonenal [35].
Taking into consideration the different parameters that can impact the contents of FFAs through the stages of beer production, variations are expected due to differences in barley varieties, malting processes, yeast strains, storage and aeration conditions, etc. [5,11,12]. Nevertheless, the determination of FFA contents during the brewing process can be a helpful tool for the quality control of the final product, as mentioned in the Introduction. Some studies focus on the determination of medium-chain FAs, reporting their contents as percentages of the total FFAs or expressed as mg per L. For example, hexanoic acid was found in quantities ranging from 0.1 to 3.83 mg/L or μg/mL [17,25,26,27], octanoic acid between 0.04 and 6.98 μg/mL and decanoic acid between 0.38 and 2.17 μg/mL [5,9,17,25,27]. The reported values for these FAs are in general agreement with those determined in our study. However, while we found palmitic acid, oleic acid and stearic acid to be the most abundant FAs in most beer samples, which seems to align with other studies [5], our results do not follow the general trend regarding the reported quantities in the same studies [5,9,27]. In previous studies, attention has been paid to the usual long-chain FAs (palmitic, stearic, oleic, linoleic, and linolenic) [5,28]. In the present study, we demonstrated that several additional long-chain FAs, such as the saturated C15:0, C17:0, C20:0 phytanic acid and C24:0, as well as the unsaturated C16:1 and C22:6, are present in alcoholic beers; however, they are present in concentrations lower than 1 μg/mL.
Assessing the volatile profile of low-alcohol and alcohol-free beers by HS-SPME–GC-MS, Riu-Aumatell et al. included in their study three medium-chain FFAs (hexanoic, octanoic and decanoic acids) and demonstrated that their contents were lower in non-alcoholic beers compared to regular beers [26]. In our study, we have shown that, in addition to these three medium-chain FAs, heptanoic and undecanoic acids were also found in lower concentrations in non-alcoholic beers. Among these five medium-chain FAs, the highest reduction was observed for octanoic acid (from 1.4 μg/mL to 0.5 μg/mL). It should be noticed that octanoic acid was found to be one of the key volatiles for the rapid and non-destructive determination of beer quality [27].
Collectively, in the present work for the first time, we studied in detail the free fatty acid profile of non-alcoholic beers, including a large set of FFAs (medium-chain, long-chain, saturated, monounsaturated and polyunsaturated FAs). Our results show that non-alcoholic beers are clearly differentiated from alcoholic ones by their FFA profiling. For the majority of FFAs, their content in alcoholic beers is higher than in non-alcoholic ones, with the marked exception of oleic acid, which was found in higher concentrations in non-alcoholic beers. PCA using FFA variables confirmed a clear clustering of alcoholic and non-alcoholic beer samples in two distinct groups.

5. Conclusions

In this work, a convenient and rapid LC-HRMS analytical method was developed and validated for the simultaneous quantitative determination of a variety of FFAs in alcoholic and non-alcoholic beer samples. The simple liquid–liquid extraction protocol employed for the sample preparation and the avoidance of a derivatization step, saving time and money, are clear advantages of the method. Thirty-seven saturated and unsaturated FFAs were analyzed in twelve non-alcoholic and nine alcoholic beer samples from the local market. Among the 29 FFAs that were quantified, palmitic, stearic, oleic and myristic acids were found to be the predominant FFAs in both the alcoholic and non-alcoholic beers. Significant differences in FFA profiling were observed between the alcoholic and non-alcoholic beers. The majority of the FFAs, including palmitic, stearic and myristic acids, were determined in decreased concentrations in non-alcoholic beers compared to the alcoholic ones. On the contrary, the content of oleic acid was significantly increased in non-alcoholic beers. The employment of PCA suggested the correlation of FFA profiling with the type of beer (alcoholic or non-alcoholic). The method developed herein may be implemented in future lipidomics studies, shedding light on the complex FFA profile of beer products.

Supplementary Materials

The following supporting information can be downloaded at https://www.mdpi.com/article/10.3390/separations12050114/s1, Figure S1: Principal component analysis: Scree plot of FFAs from alcoholic and non-alcoholic beers; Table S1: List of analytes together with their exact masses [M − H], their retention time Rf (min) and their limits of detection (LOD) and quantification (LOQ); Table S2: Principal component analysis: Contribution of the variables (%); Table S3: Principal component analysis: Squared cosines of the variables [36,37,38].

Author Contributions

Conceptualization, M.G.K.; methodology, C.M. and M.G.K.; validation, C.M. and M.G.K.; investigation, C.M. and M.G.K.; writing—original draft preparation, C.M. and M.G.K.; writing—review and editing, C.M. and M.G.K. All authors have read and agreed to the published version of the manuscript.

Funding

This research received no external funding.

Data Availability Statement

All data are available in the main text or the Supplementary Materials.

Acknowledgments

M.G.K. would like to thank L’Oréal-UNESCO for the award “For Women in Science 2023”.

Conflicts of Interest

The authors declare no conflicts of interest.

References

  1. Parker, D.K. Beer: Production, Sensory Characteristics and Sensory Analysis. In Alcoholic Beverages; Elsevier: Amsterdam, The Netherlands, 2012; pp. 133–158. ISBN 978-0-85709-051-5. [Google Scholar]
  2. Salanță, L.C.; Coldea, T.E.; Ignat, M.V.; Pop, C.R.; Tofană, M.; Mudura, E.; Borșa, A.; Pasqualone, A.; Anjos, O.; Zhao, H. Functionality of Special Beer Processes and Potential Health Benefits. Processes 2020, 8, 1613. [Google Scholar] [CrossRef]
  3. Zhu, L.; Hu, Z.; Gamez, G.; Law, W.S.; Chen, H.; Yang, S.; Chingin, K.; Balabin, R.M.; Wang, R.; Zhang, T.; et al. Simultaneous Sampling of Volatile and Non-Volatile Analytes in Beer for Fast Fingerprinting by Extractive Electrospray Ionization Mass Spectrometry. Anal. Bioanal. Chem. 2010, 398, 405–413. [Google Scholar] [CrossRef] [PubMed]
  4. Cozzolino, D.; Roumeliotis, S.; Eglinton, J.K. The Role of Total Lipids and Fatty Acids Profile on the Water Uptake of Barley Grain during Steeping. Food Chem. 2014, 151, 231–235. [Google Scholar] [CrossRef] [PubMed]
  5. Bravi, E.; Marconi, O.; Sileoni, V.; Perretti, G. Determination of Free Fatty Acids in Beer. Food Chem. 2017, 215, 341–346. [Google Scholar] [CrossRef]
  6. Horák, T.; Čulík, J.; Jurková, M.; Čejka, P.; Kellner, V. Determination of Free Medium-Chain Fatty Acids in Beer by Stir Bar Sorptive Extraction. J. Chromatogr. A 2008, 1196–1197, 96–99. [Google Scholar] [CrossRef]
  7. Battistutta, F.; Buiatti, S.; Zenarola, C.; Zironi, R. Rapid Analysis of Free Medium-chain Fatty Acids and Related Ethyl Esters in Beer Using SPE and HRGC. J. High Resolut. Chromatogr. 1994, 17, 662–664. [Google Scholar] [CrossRef]
  8. Gordon, R.; Power, A.; Chapman, J.; Chandra, S.; Cozzolino, D. A Review on the Source of Lipids and Their Interactions during Beer Fermentation That Affect Beer Quality. Fermentation 2018, 4, 89. [Google Scholar] [CrossRef]
  9. DeVries, K. Determination of Free Fatty Acids in Wort and Beer. J. Am. Soc. Brew. Chem. 1990, 48, 13–17. [Google Scholar] [CrossRef]
  10. Müller, M.P.; Schmid, F.; Becker, T.; Gastl, M. Impact of Different Hop Compounds on the Overfoaming Volume of Beer Caused by Primary Gushing. J. Inst. Brew. 2010, 116, 459–463. [Google Scholar] [CrossRef]
  11. Bravi, E.; Marconi, O.; Perretti, G.; Fantozzi, P. Influence of Barley Variety and Malting Process on Lipid Content of Malt. Food Chem. 2012, 135, 1112–1117. [Google Scholar] [CrossRef]
  12. Bravi, E.; Benedetti, P.; Marconi, O.; Perretti, G. Determination of Free Fatty Acids in Beer Wort. Food Chem. 2014, 151, 374–378. [Google Scholar] [CrossRef] [PubMed]
  13. Lehnhardt, F.; Lindtner, S.; Gastl, M. Profiling of Free Fatty Acids in Wort Using an Isolator Column-Assisted LC-MS/MS Approach. J. Food Compos. Anal. 2025, 140, 107215. [Google Scholar] [CrossRef]
  14. Lordan, R.; O’Keeffe, E.; Dowling, D.; Mullally, M.; Heffernan, H.; Tsoupras, A.; Zabetakis, I. The in Vitro Antithrombotic Properties of Ale, Lager, and Stout Beers. Food Biosci. 2019, 28, 83–88. [Google Scholar] [CrossRef]
  15. Lordan, R.; O’Keeffe, E.; Tsoupras, A.; Zabetakis, I. Total, Neutral, and Polar Lipids of Brewing Ingredients, By-Products and Beer: Evaluation of Antithrombotic Activities. Foods 2019, 8, 171. [Google Scholar] [CrossRef]
  16. Hans, S.; Harishkumar, R.; Shiels, K.; Saha, S.K.; Toohey, H.; Cunneen, L.; Nalewajka, A.; Zabetakis, I.; Lordan, R. Bioactive Lipids Derived from Red Wine, Beers, and Their Dealcoholized Variants Inhibit Platelet-Activating Factor (PAF) Induced Platelet Activation in Vitro. Food Biosci. 2024, 59, 104053. [Google Scholar] [CrossRef]
  17. Piornos, J.A.; Koussissi, E.; Balagiannis, D.P.; Brouwer, E.; Parker, J.K. Alcohol-free and Low-alcohol Beers: Aroma Chemistry and Sensory Characteristics. Compr. Rev. Food Sci. Food Saf. 2023, 22, 233–259. [Google Scholar] [CrossRef]
  18. Food and Drug Administration—FDA. CPG Sec. 510.400 Dealcoholized Wine and Malt Beverages—Labeling USA: FDA. 2005. Available online: https://www.fda.gov/regulatory-information/search-fda-guidance-documents/cpg-sec-510400-dealcoholized-wine-and-malt-beverages-labeling (accessed on 2 February 2025).
  19. Brányik, T.; Silva, D.P.; Baszczyňski, M.; Lehnert, R.; Almeida, E.; Silva, J.B. A Review of Methods of Low Alcohol and Alcohol-Free Beer Production. J. Food Eng. 2012, 108, 493–506. [Google Scholar] [CrossRef]
  20. Kokole, D.; Jané Llopis, E.; Anderson, P. Non-alcoholic Beer in the European Union and UK: Availability and Apparent Consumption. Drug Alcohol Rev. 2022, 41, 550–560. [Google Scholar] [CrossRef]
  21. Hernández-Quiroz, F.; Nirmalkar, K.; Villalobos-Flores, L.E.; Murugesan, S.; Cruz-Narváez, Y.; Rico-Arzate, E.; Hoyo-Vadillo, C.; Chavez-Carbajal, A.; Pizano-Zárate, M.L.; García-Mena, J. Influence of Moderate Beer Consumption on Human Gut Microbiota and Its Impact on Fasting Glucose and β-Cell Function. Alcohol 2020, 85, 77–94. [Google Scholar] [CrossRef]
  22. Marques, C.; Dinis, L.; Barreiros Mota, I.; Morais, J.; Ismael, S.; Pereira-Leal, J.B.; Cardoso, J.; Ribeiro, P.; Beato, H.; Resende, M.; et al. Impact of Beer and Nonalcoholic Beer Consumption on the Gut Microbiota: A Randomized, Double-Blind, Controlled Trial. J. Agric. Food Chem. 2022, 70, 13062–13070. [Google Scholar] [CrossRef]
  23. Lamiquiz-Moneo, I.; Pérez-Calahorra, S.; Gracia-Rubio, I.; Cebollada, A.; Bea, A.M.; Fumanal, A.; Ferrer-Mairal, A.; Prieto-Martín, A.; Sanz-Fernández, M.L.; Cenarro, A.; et al. Effect of the Consumption of Alcohol-Free Beers with Different Carbohydrate Composition on Postprandial Metabolic Response. Nutrients 2022, 14, 1046. [Google Scholar] [CrossRef] [PubMed]
  24. Kaneda, H.; Kano, Y.; Kamimura, M.; Osawa, T.; Kawakishi, S. Analysis of Long-Chain Fatty Acids in Beer by an HPLC-Fluorescence Detection Method. J. Agric. Food Chem. 1990, 38, 1363–1367. [Google Scholar] [CrossRef]
  25. Liu, M.; Zeng, Z.; Xiong, B. Preparation of Novel Solid-Phase Microextraction Fibers by Sol–Gel Technology for Headspace Solid-Phase Microextraction-Gas Chromatographic Analysis of Aroma Compounds in Beer. J. Chromatogr. A 2005, 1065, 287–299. [Google Scholar] [CrossRef] [PubMed]
  26. Riu-Aumatell, M.; Miró, P.; Serra-Cayuela, A.; Buxaderas, S.; López-Tamames, E. Assessment of the Aroma Profiles of Low-Alcohol Beers Using HS-SPME–GC-MS. Food Res. Int. 2014, 57, 196–202. [Google Scholar] [CrossRef]
  27. Yang, M.; Zhai, X.; Huang, X.; Li, Z.; Shi, J.; Li, Q.; Zou, X.; Battino, M. Rapid Discrimination of Beer Based on Quantitative Aroma Determination Using Colorimetric Sensor Array. Food Chem. 2021, 363, 130297. [Google Scholar] [CrossRef]
  28. Horák, T.; Čulík, J.; Čejka, P.; Jurková, M.; Kellner, V.; Dvořák, J.; Hašková, D. Analysis of Free Fatty Acids in Beer: Comparison of Solid-Phase Extraction, Solid-Phase Microextraction, and Stir Bar Sorptive Extraction. J. Agric. Food Chem. 2009, 57, 11081–11085. [Google Scholar] [CrossRef]
  29. Kokotou, M.G. Fatty Acid Profiling in Greek Wines by Liquid Chromatography–High-Resolution Mass Spectrometry (LC-HRMS). Separations 2024, 11, 321. [Google Scholar] [CrossRef]
  30. Cozzolino, D.; Degner, S. An Overview on the Role of Lipids and Fatty Acids in Barley Grain and Their Products during Beer Brewing. Food Res. Int. 2016, 81, 114–121. [Google Scholar] [CrossRef]
  31. Schwarz, P.; Stanley, P.; Solberg, S. Activity of Lipase during Mashing. J. Am. Soc. Brew. Chem. 2002, 60, 107–109. [Google Scholar] [CrossRef]
  32. Bravi, E.; Perretti, G.; Buzzini, P.; Della Sera, R.; Fantozzi, P. Technological Steps and Yeast Biomass as Factors Affecting the Lipid Content of Beer during the Brewing Process. J. Agric. Food Chem. 2009, 57, 6279–6284. [Google Scholar] [CrossRef]
  33. Tehlivets, O.; Scheuringer, K.; Kohlwein, S.D. Fatty Acid Synthesis and Elongation in Yeast. Biochim. Biophys. Acta BBA-Mol. Cell Biol. Lipids 2007, 1771, 255–270. [Google Scholar] [CrossRef]
  34. Moonjai, N.; Verstrepen, K.J.; Delvaux, F.R.; Derdelinckx, G.; Verachtert, H. The Effects of Linoleic Acid Supplementation of Cropped Yeast on Its Subsequent Fermentation Performance and Acetate Ester Synthesis. J. Inst. Brew. 2002, 108, 227–235. [Google Scholar] [CrossRef]
  35. Yu, J.; Huang, S.; Dong, J.; Fan, W.; Huang, S.; Liu, J.; Chang, Z.; Tian, Y.; Hao, J.; Hu, S. The Influence of LOX-Less Barley Malt on the Flavour Stability of Wort and Beer: Influence of LOX-Less Barley Malt on Flavour Stability. J. Inst. Brew. 2014, 120, 93–98. [Google Scholar] [CrossRef]
  36. Kokotou, M.G.; Mantzourani, C.; Kokotos, G. Development of a Liquid Chromatography–High Resolution Mass Spectrometry Method for the Determination of Free Fatty Acids in Milk. Molecules 2020, 25, 1548. [Google Scholar] [CrossRef]
  37. Mantzourani, C.; Batsika, C.S.; Kokotou, M.G.; Kokotos, G. Free fatty acid profiling of Greek yogurt by liquid chromatography-high resolution mass spectrometry (LC-HRMS) analysis. Food Res. Int. 2022, 160, 111751. [Google Scholar] [CrossRef]
  38. Kokotou, M.G. Determination of Free Fatty Acids in Breast Milk Reveals the Presence of Hydroxypalmitic and Stearic Acids. Biomolecules 2024, 14, 1602. [Google Scholar] [CrossRef]
Figure 1. Extracted ion chromatograms (EICs) of FFAs in a representative sample of alcoholic beer (A) and non-alcoholic beer (B). Zoom-ins on selected areas of the chromatograms are also depicted in both cases.
Separations 12 00114 g001
Figure 2. EICs of phytanic and arachidic acid in standard solutions (1000 ng/mL) (A) in a representative alcoholic beer sample (B) and in a representative non-alcoholic beer sample (C).
Separations 12 00114 g002
Figure 3. Comparison of beer concentrations (mg/L) of C8:0, C9:0, C10:0, C11:0, C12:0, C14:0, C15:0, C16:0, C16:1, C17:0, C18:0, C18:1 (oleic acid), C18:2, C19:0, C20:0 phytanic acid, C20:1 and C22:6 between alcoholic and non-alcoholic beer samples. AB: alcoholic beers; NAB: non-alcoholic beers. One-way ANOVA statistical analysis was performed for each separate set comparing to control. ns (not significant): p > 0.05. * p < 0.05, *** p < 0.001, **** p < 0.0001.
Separations 12 00114 g003
Figure 4. Principal component analysis (PCA) plot of FFAs from alcoholic and non-alcoholic beer samples using 17 variables. Red circle indicates the cluster of alcoholic beers.
Separations 12 00114 g004
Figure 5. Graph depicting the contribution of the variables.
Separations 12 00114 g005
Table 1. Code, alcohol content, country of origin and type of the beers studied.
Code% ABV aCountry of OriginType
15.0%GreeceLager
25.0%GreeceLager
35.0%GreeceLager
45.0%GreeceLager
55.0%GreeceLager
65.0%GreeceLager
75.0%GreeceLager
85.0%BelgiumLager
94.8%GermanyLager (Pilsner)
100.3%NetherlandsLager
110.3%GermanyLager (Pilsner)
120.5%GermanyLager
130.3%GreeceLager
140.0%GreeceLager
150.5%GreeceLager
160.0%GreeceLager
17<0.5%GreeceLager
180.0%GreeceLager
190.4%GreeceLager
200.0%BelgiumLager
210.0%GermanyLager (Pilsner)
a ABV: alcohol by volume.
Table 2. Trueness (recovery %) and precision data (RSD %) in the spiked beer samples.
AnalyteSpike Level
50 ng/mL
Spike Level
200 ng/mL
Spike Level
500 ng/mL
Recovery (%R)RSDr (%)RSDR (%)MERecovery (%R)RSDr (%)RSDR (%)MFRecovery (%R)RSDr (%)RSDR (%)ME
C6:0873.96.20.98511.814.20.8822.83.30.8
C7:0922.56.41.0996.46.60.9860.812.20.9
C8:0959.66.40.9936.45.60.89110.710.50.8
C9:0903.27.50.99413.21.70.9892.96.40.9
C10:0852.612.70.9880.18.60.8854.99.00.8
C11:09110.911.30.910515.810.70.810312.52.40.8
C12:0895.212.00.8916.28.60.9882.93.10.8
C13:0845.79.30.8874.410.40.9858.28.70.8
C14:0868.79.90.910314.29.00.81095.78.51.1
C14:1843.21.30.8851.74.60.9872.68.60.8
C15:0835.84.30.9944.22.70.8916.810.91.0
C16:0824.211.31.11091.68.10,91038.07.41.1
C16:1816.23.10.8898.214.00.9929.08.71.0
C17:0815.21.50.9803.11.41.1809.35.61.1
C17:1824.81.70.9822.82.20.9826.61.61.1
C18:0871.610.31.11060.25.91.11052.614.71.0
C18:1 oleic acid832.41.81.2950.35.50.99710.80.81.2
C18:1 petroselinic acid832.03.21.0911.23.21.0922.00.91.1
C18:2846.510.20.8874.13.90.9858.19.21.1
total-C18:3813.26.60.9840.60.80.9859.06.21.0
C19:0862.06.60.8861.26.01.0861.614.71.0
C20:0 arachidic acid833.24.00.9812.60.70.8848.013.10.9
C20:0 phytanic acid861.31.10.8843.67.21.1853.68.91.1
C20:1851.36.10.9870.24.21.1852.27.21.1
C20:3
bishomo-γ-linolenic acid
855.67.61.3861.75.91.08710.97.31.2
C20:3
5,8,11-eicosatrienoic acid
856.910.90.8893.14.91.09414.537.31.1
C20:4845.25.90.9891.96.00.9876.678.01.1
C20:5826.312.80.9823.73.80.88713.325.71.1
C21:0865.210.01.0890.50.50.8869.2112.70.8
C22:0849.69.81.0852.71.40.88512.5013.20.8
C22:1835.78.61.0848.83.40.91085.861.11.0
C22:4826.53.20.8845.210.20.88911.247.61.2
C22:5823.21.00.9892.11.60.8846.671.20.9
C22:6846.47.91.0831.27.90.98910.624.61.0
C23:0854.26.70.9856.211.60.8865.4112.80.9
C24:0844.26.60.9845.212.50.81002.4413.70.8
C24:1856.85.80.9857.62.11.08514.822.51.1
Table 3. Contents of free fatty acids in beer samples (μg/mL).
Free
Fatty Acid
Alcoholic Beers (n = 9), TriplicatesNon-Alcoholic Beers (n = 12), Triplicates
Minimum Value (μg/mL)Maximum Value
(μg/mL)
Mean Value ± SD
(μg/mL)
%Minimum Value
(μg/mL)
Maximum Value
(μg/mL)
Mean Value ± SD
(μg/mL)
%
C6:00.090.170.12 ± 0.030.30.050.340.12 ± 0.090.4
C7:00.130.380.24 ± 0.070.60.160.290.22 ± 0.040.8
C8:01.01.81.4 ± 0.23.50.081.30.54 ± 0.362.0
C9:00.460.760.59 ± 0.111.40.070.680.33 ± 0.221.2
C10:00.400.620.51 ± 0.071.30.040.460.29 ± 0.161.1
C11:00.250.460.34 ± 0.070.80.100.300.18 ± 0.050.7
C12:01.04.42.5 ± 1.46.11.03.82.6 ± 0.99.7
C13:00.030.130.08 ± 0.030.20.010.110.04 ± 0.030.2
C14:02.93.93.50 ± 0.378.50.471.80.96 ± 0.413.5
C14:10.010.030.02 ± 0.010.1-0.040.02 ± 0.010.1
C15:00.61.10.87 ± 0.142.10.120.690.47 ± 0.181.7
C16:013.518.116.1 ± 1.939.45.615.09.4 ± 3.234.6
C16:10.160.300.24 ± 0.060.60.020.060.03 ± 0.010.1
C17:00.200.360.29 ± 0.050.70.020.310.14 ± 0.120.5
C17:10.030.050.03 ± 0.010.10.000.020.01 ± 0.010.0
C18:05.48.06.6 ± 1.016.20.405.72.8 ± 2.210.3
C18:1 oleic acid4.38.45.7 ± 1.313.85.011.97.6 ± 2.228.1
C18:1 petroselinic acid--------
C18:20.471.30.84 ± 0.312.10.141.60.50 ± 0.491.8
total-C18:3-0.010.01 ± 0.000.0---0.0
C19:00.050.130.09 ± 0.030.2-0.050.01 ± 0.010.0
C20:0 arachidic acid0.030.060.04 ± 0.010.1-0.110.04 ± 0.040.2
C20:0 phytanic acid0.080.130.10 ± 0.020.2-0.050.02 ± 0.020.1
C20:10.040.110.07 ± 0.030.2-0.020.01 ± 0.010.0
C20:3
Bishomo-γ-linolenic acid
--------
C20:3
5,8,11-eicosatrienoic acid
--------
C20:4--------
C20:50.010.240.05 ± 0.070.1-0.060.02 ± 0.020.1
C21:00.020.080.05 ± 0.020.1-0.010.01 ± 0.000.0
C22:00.020.050.03 ± 0.010.10.010.210.07 ± 0.090.3
C22:10.020.080.05 ± 0.020.1---0.0
C22:40.010.010.01 ± 0.000.0-0.020.01 ± 0.010.0
C22:5---0.0-2.20.31 ± 0.681.1
C22:60.090.160.12 ± 0.020.30.010.130.04 ± 0.040.2
C23:0-0.060.02 ± 0.020.1-0.020.01 ± 0.000.0
C24:00.170.370.29 ± 0.080.70.090.790.33 ± 0.261.2
C24:1--------
Disclaimer/Publisher’s Note: The statements, opinions and data contained in all publications are solely those of the individual author(s) and contributor(s) and not of MDPI and/or the editor(s). MDPI and/or the editor(s) disclaim responsibility for any injury to people or property resulting from any ideas, methods, instructions or products referred to in the content.

