Abstract
The banana inflorescence (BI) is a rich source of antioxidants and dietary fiber, making it a valuable by-product of banana harvesting. This study aimed to maximize the ultrasound-assisted extraction (UAE) of antioxidant compounds from BI and analyze the residue’s composition and functional properties. The Box–Behnken Design was applied to test different ultrasound powers, temperatures, and sample-to-solvent ratios on the total phenolic content (TPC) and total flavonoid content (TFC). The UAE conducted at 350 W, 55 °C, 1:30 (g/mL) ratio for 30 min resulted in the highest TPC (1637.12 mg/100 g) and TFC (22.97 mg/100 g). Isovanillin, caffeine, naringin, sinapaldehyde, nicotinic acid, quinic acid, malic acid, and fumaric acids were reported for the first time for BI. The extract obtained by UAE showed a higher content of these compounds and higher antioxidant activity than that obtained through conventional extraction (orbital shaking). The residue obtained after UAE presented dietary fiber as the main component (71.91 g/100 g) and a higher oil absorption index (5.78 g/g) than untreated BI. Therefore, BI is a source of bioactive compounds, and both the extract and residue can be used in the pharmaceutical, food, and cosmetic industries, enabling the productive sector to move closer to the circular economy.
1. Introduction
Banana harvesting is widespread in Brazil, with almost 7 million tons produced in 2023 [1]. This plant belongs to the Musaceae family, with three genera, Ensete, Musella, and Musa, the latter being the most common and consumed worldwide [2]. During banana harvesting, by-products, such as peels, leaves, pseudostems, stems, and inflorescences, are generated [3,4]. Banana inflorescence (BI), also known as mangará, banana heart, or banana flower, has been consumed as food in several countries [5,6]. The names refer to the dark-purple, reddish heart-shaped flower bud found at the end of the stem; however, after the last bunch of bananas is open, BI is removed, and, currently, it is used only to fertilize the soil or feed animals [7].
BI is considered a Non-Conventional Food Plant (NCFP) due to its low utilization and high nutritional value [8,9]. Among the compounds already identified in BI are phenolic acids (gallic, hydroxybenzoic, gentisic, vanillic, caffeic, ferulic, syringic, ferulic, chlorogenic, coumaric, and sinapic) and flavonoids (catechin, epicatechin, quercetin, and rutin) [4,5,10]. These compounds are important both for human nutrition and applications in pharmaceuticals or cosmetics, as they are correlated with antioxidant activity, which reduces the oxidative attack on biomolecules and, therefore, premature aging [4].
Antioxidant compounds are extracted mainly using conventional methods, such as orbital shaking extraction (OSE), whose purpose varies from the components’ simple mixing to the increase in mass transfer [11]. Emerging technologies for antioxidant compound extraction, such as ultrasound-assisted extraction (UAE), have promoted greater interaction between the solvent and sample, increasing process efficiency [12]. The UAE promotes the rupture of plant cell walls, facilitating solvent diffusion, with advantages in terms of reproducibility, speed, and costs [13]. However, it is necessary to evaluate several parameters for an efficient extraction process with better use of natural resources. For the UAE, process conditions, such as power, temperature, sample-to-solvent ratio, and time, may have a great effect on the yield of phenolic and flavonoid extraction [13,14,15].
The extracted antioxidant compounds have numerous applications as natural preservatives in food, pharmaceutical, and cosmetic products. However, after extraction, a low-value-added residue is generated, which is concentrated in dietary fiber, proteins, and carbohydrates. BI of Musa cavendishii presents dietary fiber (52.16 g/100 g), proteins (15.84 g/100 g), ashes (11.73 g/100 g), lipids (4.22 g/100 g), and carbohydrates (16.01 g/100 g) [16] in its composition. Bhaskar et al. [10] reported that 88.87% of BI dietary fiber corresponds to the insoluble fraction. Therefore, studying the residue generated after the extraction of antioxidants and investigating its properties is important to promote the full use of this raw material, increasing its commercial value. This is the first report about a process for obtaining an extract, rich in antioxidants, and a residue, rich in dietary fibers from BI, with different application possibilities, that can contribute to the circular economy of the production sector.
Thus, this study aimed to (i) maximize the UAE conditions of total phenolic content (TFC) and total flavonoid content (TFC) from BI; (ii) compare the extracts obtained by UAE and by OSE regarding TPC, TFC, and antioxidant activity (AA); (iii) characterize the residue obtained after the most effective extraction condition, regarding composition and functional properties.
2. Materials and Methods
2.1. Raw Material Preparation
The banana inflorescences (male flowers and bracts) from M. cavendishii were harvested in August 2024 in Pérola-Paraná, Brazil (23.8040° S, 53.6872° W). BIs were cleaned in running water, sanitized with sodium hypochlorite (100 ppm) for 15 min, and dried in an oven under forced air circulation (MA 035, Marconi, Piracicaba, Brazil) at 45 °C for 24 h until a moisture of ~10% was reached. The dried material was crushed (knife mill, A11, Ika, Campinas, Brazil), sieved (0.55 mm), and stored in hermetic bags at −18 °C until analyses.
2.2. Ultrasound-Assisted Extraction
The UAE followed the Box–Behnken Design, with three independent factors, twelve middle-edge nodes, and three center nodes. The extractions were carried out using an ultrasonic cell disruptor with a probe (Biobase®, Ji’nan, China), as shown in Figure 1. The following independent factors were evaluated: ultrasound power (200, 350, and 500 W), temperature (25, 40, and 55 °C), and sample-to-solvent ratio (mass/volume) of 1:10, 1:20, and 1:30. The experiments were performed for a fixed time of 30 min [16], using 80% ethanol (v/v) as the extracting solution, according to preliminary tests. The response variables were total phenolic content (TPC) and total flavonoid content (TFC).
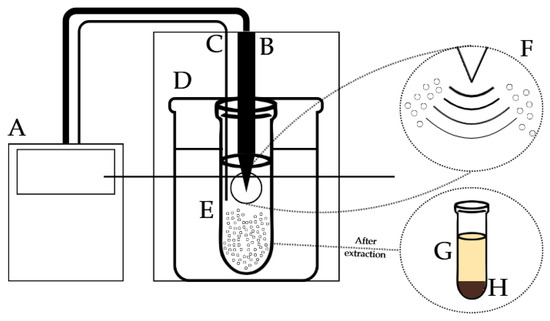
Figure 1.
Scheme of ultrasound-assisted extraction of banana inflorescence. A—ultrasound generator, B—ultrasound cylinder probe, C—temperature sensor, D—water bath, E—extraction procedure, F—bubble cavitation phenomenon, G—banana inflorescence extract, H—banana inflorescence residue.
In the UAE conditions that rendered the highest TPC and TFC (ultrasound power of 350 W, temperature of 55 °C, and sample-to-solvent ratio of 1:30 g/mL), UAE was performed at different times (15, 30, 45, and 60 min) and ultrasound powers (600, 700, and 800 W).
2.3. Orbital Shaking Extraction
Conventional extraction by orbital shaking (Shaker, Marconi, Piracicaba, Brazil) at 200 rpm (maximum equipment rotation) was performed for comparison, keeping all the other conditions the same as those for maximum extraction of TPC and TFC by UAE (55 °C, 30 min, and sample-to-solvent ratio of 1:30 using ethanol 80% v/v). The extract was quantified for its TPC and TFC [17].
2.4. Total Phenolic Content and Total Flavonoid Content
The TPC was determined by mixing of extracts with 0.9 N Folin-Ciocalteau reagent and 7.5% (m/v) sodium carbonate solution. The absorbance was read at 760 nm in a spectrophotometer (Shimadzu® (Kyoto, Japan), 1900). From the analytical curve (R2 > 0.99) of gallic acid (50 to 500 mg/L), the results were calculated in gallic acid equivalents (GAE) on a dry basis (d.b.) [18].
The extracts were diluted and gradually added with NaNO2 (50 g/L), AlCl3 (100 g/L), NaOH (1 M), and deionized water to assess TFC content. The solution was stirred and read at 510 nm in a spectrophotometer. The TFC content was calculated based on the analytical curve (R2 > 0.99) of quercetin and expressed in quercetin equivalent (QE), d.b [19].
2.5. Characterization of Extracts Obtained Under Maximized Conditions
2.5.1. Antioxidant Activity
The extracts obtained under conditions that rendered the highest TPC and TFC by UAE and OSE had their antioxidant activity (AA) determined by different analytical methods: (a) 2,2-diphenyl-1-picrylhydrazyl (DPPH) free radical scavenging method; (b) iron reducing power (FRAP); (c) 3-ethylbenzothiazoline-6-sulfonic acid ABTS free radical scavenging. For quantification, analytical curves (R2 > 0.99) were prepared for each method with Trolox (6-hydroxy-2,5,7,8-tetramethylchroman-2-carboxylic acid) solutions. The results were expressed in Trolox equivalent (TE), d.b. [20].
2.5.2. Phytochemical Identification
The extracts obtained under maximized conditions by UAE and OSE were characterized regarding phenolic compound profile by ultra-high-performance liquid chromatography coupled with tandem mass spectrometry (UHPLC-MS/MS) (Shimadzu® model 8050 MS and Nexera® X2 HPLC). The injection volume was 1 µL. The mobile phases were Milli-Q water acidified with 0.1% formic acid (A) and methanol-grade MS (Merck® (Darmstadt, Germany)) (B), operated at a flow rate of 0.5 mL/min, in linear gradient mode: 1–9 min (20% B), 10–15 min (40% B), and 16–30 min (10% B). The run was performed using a C18 column (5 µm, 150 × 4.6 mm, Shimadzu®), without a precolumn. The temperature of the autosampler and column was maintained at 40 °C. The MS/MS detector was operated in scan mode for 15 min (scanning rate until 30,000 u/s). It was monitored in negative and positive electrospray ionization source (EIS), scanned with multiple reaction monitoring (MRM) mode (until 555 MRMs/s). Collision energy was −15 V (positive) and 30 V (negative). The flow rates of nebulizing gas and drying gas were 3 L/min and 10 L/min, respectively. The values for interface voltage, current, and temperature were 3 kV, 7µA, and 300 °C, respectively, while the temperature of desolvation was 526 °C. Argon was used as a collision gas at a maximum pressure of 20 mPa. Dwell time was 2–12 s. Insight Software version 5.123 (Shimadzu®) was used for quantification of the detected compounds, based on the analytical curves (10–250 µg/L) of the following compounds: catechol, morin, isovanillin, gallic acid, quercetin, hydroxybenzaldehyde, naringenin, syringaldehyde, chlorogenic acid, syringic acid, protocatechuic acid, vanillic acid, salicylic acid, vanillin, ferulic acid, p-hydroxybenzoic acid, naringin, p-coumaric acid, caffeic acid, coniferyl aldehyde, sinapic acid, syringaldazine, catechin, sinapaldehyde, luteolin, rutin, theobromine, epicatechin, baicalin, chrysin, quinic acid, malic acid, kaempferol, coumarin, caffeine, resorcylic acid, nicotinic acid, and fumaric acids [21].
2.6. Characterization of Residue
After the extraction was conducted in the condition of maximum TPC and TFC (Section 2.2), the material was centrifuged, and the residue was dried at 60 °C until constant mass (~10% moisture).
The proximate composition was determined according to the Association of Official Analytical Chemists [22]. Moisture (method n. 925.09B), ashes (method 923.03), proteins (method 920.87), lipids (method 920.85), and dietary fiber (method 985.29) were determined for the extraction residue and for a sample of the BI (obtained as described in Section 2.1), without undergoing the extraction process. The results were expressed on a dry basis.
The functional properties, water solubility index (WSI), water absorption index (WAI), oil absorption index (OAI), emulsifying activity (EA), and emulsion stability (ES) were determined according to the methodology of Seibel and Beléia [23].
The instrumental color of the products was measured using a colorimeter (Konica Minolta, model CR-400), and their colors were obtained through the CIE coordinates. L* (lightness) varies from zero (darker) to 100 (lighter), and the chromaticity coordinates a* and b*, from −a* (green) to +a* (red), and from −b* (blue) to +b* (yellow).
2.7. Statistical Analysis
UAE followed the Box–Behnken Design, and the data were statistically treated using the Statistica 7.0 software (StatSoft® Inc., Tulsa, OK, USA) at a 5.0% significance level (p < 0.05), in which the mathematical models were obtained. The models were subjected to an analysis of variance (ANOVA) and the coefficient of determination (R2). From the desirability profile, it was possible to define the level of the variables that provided higher extraction of TPC and TFC. In the maximized condition, the extraction was repeated (triplicate), and the result was compared to the predicted value.
Characterization analyses were performed in triplicate (n = 3). The results were statistically treated using the Statistica 7.0 software (StatSoft® Inc., Tulsa, OK, USA) by ANOVA (with one source of variation) and t-test (two variables) or Tukey’s test (more than two variables), at a 5.0% significance level (p < 0.05).
3. Results and Discussion
3.1. Conditions of Maximum Extraction of TPC and TFC by UAE
Table 1 shows the experimental data for the TPC and TFC extraction from the BI (M. cavendishii). The TPC ranged from 591.77 to 1637.12 mg GAE/100 g, while the TFC ranged from 14.39 to 22.97 mg QE/100 g, demonstrating that the conditions used in the experimental design affected the responses obtained. The results of experiments 13 to 15 (central point) were similar, which indicates adequate experimental repeatability.

Table 1.
Experimental conditions and total phenolic content (TPC) and total flavonoid content (TFC) of the BI extracts obtained by ultrasound-assisted extraction (UAE).
Temperature showed a linear effect only for TPC (Table 2), exemplified in experiments 9 and 10, in which, by increasing the temperature from 25 to 55 °C, keeping the other conditions fixed, the TPC content was increased by 108% (Table 1). Irakli et al. [24] reported a 10% increase in TPC extraction from olive leaves in the same temperature range. Schmidt et al. [16] also noted a favorable effect of increasing temperature extraction of BI (M. cavendishii) and obtained the highest TPC and TFC at 60 °C. According to Beaufils et al. [25], the increase in extraction temperature reduces the solvent viscosity and surface tension, facilitating the diffusion and solubility of phenolic compounds.
Table 2.
Estimated effects, statistical significance, and regression coefficients for the independent variables power (X1), temperature (X2), and sample-to-solvent ratio (X3) on the dependent variables total phenolic content (TPC) and total flavonoid content (TFC) of the BI extracts.
The sample-to-solvent ratio showed positive effects on the extraction of the compounds of interest, linear and quadratic for TPC and only linear for TFC (Table 2). When the ratio was changed from 1:10 to 1:30, in experiments 6 and 8, under fixed temperature and power conditions, there were ~49.5% and ~105.6% increases in the TPC and TFC, respectively (Table 1). These results indicate that a higher proportion of solvents can improve extraction efficiency. The same effect was observed by Neves et al. [26] in the UAE of curcuminoids from Curcuma longa L., which was attributed to the minimization of solvent saturation during extraction at higher sample-to-solvent ratios. Girotto et al. [27] also reported that the ratio increased from 1:10 to 1:30, enhancing from 2- to 5-times the TPC extraction of Pfaffia glomerata leaves when applying OSE. The authors attributed this effect to the swelling of the solid matrix, which can break the cell wall structure, favoring the release of bioactive compounds.
The ultrasound power and the interactions between the variables did not affect the extraction of TPC and TFC (Table 2). Thus, considering only the coefficients that presented significant effects, it was possible to obtain the empirical mathematical models for TPC (Equation (1)) and TFC (Equation (2)). The equations are valid since the F-value was lower than F (calculated), 3.48 and 47.68 for TPC, and 4.67 and 36.85 for TFC, respectively (Table S1, Supplementary Data). A good data fitting was obtained for TPC since the R2 was 0.98. At the same time, for TFC, the R2 was lower (0.74), which can be attributed to the model having only one variable with a significant effect (sample-to-solvent ratio).
where X1 is the variable power, X2 is temperature, and X3 is the sample-to-solvent ratio.
TPC = 1233.27 + 299.36 X2 + 218.06 X3 − 112.57 X32
TFC = 17.02 + 4.05 X3
Considering the desirability profile for maximum TPC and TFC extraction, the maximum level (1: temperature of 55 °C and sample-to-solvent ratio of 1:30 g/mL) of the experimental design was replaced in Equations (1) and (2). The maximum predicted values were 1637.85 mg GAE/100 g (TPC) and 21.07 mg QE/100 g (TFC). For TPC, the predicted value was similar (p > 0.05) to that found in assay 12 (350 W, 55 °C, and 1:30 g/mL), 1637.12 mg GAE/100 g. This content was similar to the one reported by Basumatary and Nath [28] in BI from M. balbisiana (1631.82 mg GAE/100 g). Assay 12 also exhibited the highest TFC and TPC among the experiments conducted (Table 1), and so its conditions were used in further experiments.
Regarding the effect of extraction time (Figure 2), under extraction conditions previously defined (1:30 g/mL, 55 °C, and 350 W), it was observed that the TFC reached its peak in 30 min, after which a decrease in its contents occurred. Maximum TPC extraction also occurred in 30 min, remaining constant after this time.
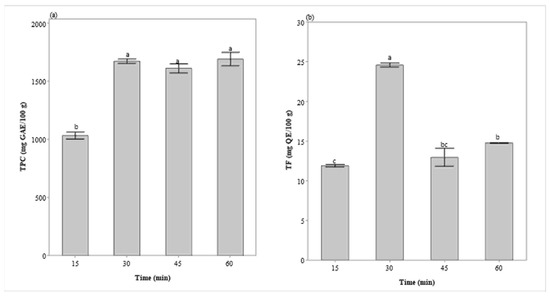
Figure 2.
Extraction kinetics of total phenolic content (a) and total flavonoid content (b) in BI extract (350 W, 1:30 g/mL, and 55 °C). GAE—gallic acid equivalent, QE—quercetin equivalent. Values on a dry basis. Different letters represent significant differences (Tukey’s test, p = 0.05).
The 30-min extraction was also recommended for the extraction of TPC and TFC in other works [14,15,16,29,30]. This result is due to the dynamics of diffusion and solubilization of phenolic compounds in UAE, which can be divided into two stages. The first one occurs in the first minutes due to the faster dissolution of soluble compounds from the surface of the plant matrix, increasing TFC and TPC levels. In the second stage, known as slow extraction, diffusion and osmotic processes are responsible for the mass transfer of the solute from the plant matrix [31]. Thus, longer UAE times cannot favor phenolic release, but it may also cause decomposition of some compounds [32,33], which can explain the decrease in TFC after 30 min of extraction.
Keeping the maximized conditions (55 °C, 1:30 g/mL, and 30 min) and varying the power within the equipment limits (200 to 800 W), it was noted that there were no significant changes in the TPC and TFC, whose values ranged from 1600.26 ± 62.76 to 1669.80 ± 27.45 mg GAE/100 g and from 21.98 ± 1.68 to 23.56 ± 0.36 mg QE ± 0.37 mg/100 g, respectively. The increase in ultrasound power can promote higher cavitation and vibration, rupturing the cell wall and causing a higher diffusion of phenolic compounds [32,34]. However, higher power levels can degrade these compounds due to the more intense collapse of the bubbles generated by the cavitation [35]. It can also explain the lack of significant effects for the ultrasound power levels investigated in this work (Table 2).
3.2. Characterization of Extracts Obtained by UAE and OSE
In the UAE (350 W, 55 °C, 1:30 g/mL, and 30 min), TPC and TFC were 3.5- and 1.6-times higher than the contents obtained by OSE, 472.84 ± 0.19 mg GAE/100 g (TPC) and 14.67 ± 0.09 mg QE/100 g (TFC), conducted at 200 rpm, 55 °C, 1:30 g/mL, and 30 min.
The data presented in Table 3 highlight the effectiveness of UAE compared to OSE for obtaining phenolic compounds and organic acids from BI. Of the 38 compounds evaluated, 22 were detected in the UAE samples by MS/UHPLC. Moreover, the UAE extract showed higher concentrations of several phenolic compounds, such as protocatechuic acid (1.48 mg/100 g vs. 0.53 mg/100 g), malic acid (69.24 mg/100 g vs. 7.81 mg/100 g), and quinic acid (40.51 mg/100 g vs. 24.16 mg/100 g), in addition to presenting compounds (caffeic and chlorogenic acids, epicatechin, and catechin) absent in the OSE. These results suggest that UAE is more efficient for these bioactive molecules’ extraction, possibly due to cavitation that increases solvent penetration into plant cells, facilitating the release of the compounds [36].
Table 3.
Composition of the BI extracts obtained by ultrasound-assisted extraction (UAE) and orbital shaking extraction (OSE).
The lower content of flavonoids (rutin, epicatechin, catechin, naringin) when compared to phenolic acids and polyphenols detected in BI extracts is in line with the TFC and TPC values. Lau et al. [4] reported that polyphenols are the major group of secondary metabolites present in the BI. In this by-product, from several cultivars, the phenolic acids gallic, p-hydroxylbenzoic, protocatechuic, gentisic, vanillic, caffeic, syringic, ferulic, p-coumaric, chlorogenic, sinapic, trans-cinnamic, tannic, vanillin, hydroxybenzaldehyde, and catechol were previously detected, as were the flavonoids catechin, epicatechin, quercetin, kaempferol, and rutin [5,10,37,38,39]. Most of these compounds were found in the present study; however, isovanillin, caffeine, naringin, sinapaldehyde, and the nicotinic, quinic, malic, and fumaric acids were reported for the first time.
The phenolic compounds detected in BI are correlated with several biological activities [8,39,40,41,42]. Among the most abundant compounds, quinic acid exhibits antioxidant, antimicrobial, antiviral, antiaging, antinociceptive, antidiabetic, anticancer and analgesic properties [43], while fumaric acid is recognized for its anti-inflammatory, immunomodulatory, chemophobic effects, and as a potent antioxidant, due to the powerful free radical scavenging properties [44].
Similar to what was observed for the phenolic composition, the extract obtained by UAE presented the highest antioxidant activity, evaluated by the DPPH, ABTS, and FRAP methods (Table 4). Higher ABTS values were observed when compared to DPPH results, as also reported by Gayathry and John [7] for BI from three different cultivars. Such an effect can be attributed to the affinity of ABTS with both hydrophilic and hydrophobic compounds, while DPPH predominantly interacts with hydrophobic compounds [45].
Table 4.
Antioxidant activity of the BI extracts obtained by ultrasound-assisted extraction (UAE) and orbital shaking extraction (OSE).
The BI extracts showed higher activity via FRAP than the ABTS and DPPH methods. Marikkar et al. [42] also reported this effect for BI from M. acuminate and M. balbisiana. The FRAP assay possesses high sensitivity and precision, and it is based on iron reduction (Fe3+ to Fe2+), differing from scavenging activity toward free radicals, such as the ABTS and DPPH methods [46]. In comparison with the results of the present work, lower values for FRAP were found by Basumatary and Nath [28] for BI from M. balbisiana, extracted with methanol (108 µmol TE/g of dried extract), and Schmidt et al. [16] for BI from M. cavendishii, extracted with ethanol by stirring (29.62 μmol TE/g). Therefore, BI is rich in antioxidant compounds; nevertheless, the variations in its phytochemicals and antioxidant activities are pronounced, which may be related to cultivar, maturation, growing season and region, and the analytical methodology applied [8,40,41].
3.3. Characterization of Residue of UAE and Untreated Sample
Given the best results obtained in UAE regarding phenolic composition and antioxidant activity, and aiming at BI’s full use, the composition and functional properties of the residue obtained after extract removal were studied compared to untreated BI, i.e., that did not undergo UAE (Table 5).
Table 5.
Proximate composition, functional properties, and color coordinates of BI residue of UAE compared to BI.
The major components of dried BI were ashes, proteins, and dietary fiber [10,39]. Ash contents were similar between the samples, with a value close to 11 g/100 g (d.b.). Lau et al. [4] reported 10.9 to 24.2 g/100 g (b.s.) of ashes in BI from different species of Musa spp. According to Ramu et al. [39], BI from Musa spp. has phosphorus (10.63 mg/g) and calcium (4.01 mg/g) as the major macronutrients, and iron (30.65 ppm), manganese (27.86 ppm), and zinc (16.60 ppm) are highlighted among the micronutrients.
There was a 6% decrease in the protein content after UAE, which indicates a slight release of proteins during extraction. Nonetheless, protein contents were in the range of those found in other works: 12.34 g/100 g [28] and 19.60 g/100 g [39]. According to Ramu et al. [39], the BI from Musa spp. can be considered a source of essential amino acids, highlighting leucine (63.8 mg/g of protein), lysine (40.0 mg/g of protein), and phenylalanine (31.0 mg/g of protein).
Dietary fiber (DF) was the major component in the samples. The total DF and insoluble DF contents were ~14% higher in the residue obtained after UAE than in the untreated sample, while the soluble DF content was similar among the samples. This can be explained by the soluble proteins and carbohydrates released during UAE, which promoted the DF concentration. Bhaskar et al. [10] reported 65.6 g/100 g of DF of BI from Musa spp. var. elakki bale (89% insoluble and 11% soluble). In this study, 95% of DF was insoluble, i.e., composed of cellulose, hemicellulose, and lignin, while 5% was soluble DF, mostly formed by pectin and some fractions of hemicellulose. The high dietary fiber content is important due to the association of its consumption with the prevention of chronic diseases, such as cancer, cardiovascular disease, hypertension, high blood cholesterol, obesity, and diabetes [10,47].
The functional properties of the residue of BI extraction have not been reported in the literature so far. The functional properties investigated in this study were similar between the samples, except for the OAI, which was ~1.6 times higher in the sample obtained after UAE. OAI is associated with the retention of aromatic compounds, exerting a stabilizing effect on foods with high fat content and emulsions [48,49]. The OAI values found in this study were higher than those found for banana flour (2.22 g/g) [50] and banana peel flour (2.09 g/g) [51]. Thus, it can be inferred that the UAE positively affected OAI, probably due to the increase in DF content in the BI residue.
The WSI and WAI values found in this work are within the values reported for banana flour (13–36%) [52] and banana peel flour (6.49–8.11 g/g) [51]. WSI is associated with the quality of powders, such as their digestibility [52]. WSI is related to the presence of some soluble components, such as carbohydrates and proteins, that can also contribute to WAI due to the presence of hydrophilic groups. WAI is an important parameter for flour applications, promoting the bulking and consistency of products, especially in baking applications [53].
UAE did not have a significant impact on the EA and ES parameters, with the EA values within the values (30.77 and 59.27%) reported for banana peel protein fractions [54]. The results of emulsifying properties indicate the potential application of BI, or its extraction residue, in food colloidal systems. It can be related to emulsifier compounds, probably proteins, that reduce the interfacial tension by being adsorbed into droplet surfaces, thus increasing the stability and ease of emulsification [55].
The color parameters were similar for the by-product before and after extraction, indicating that they were not affected by the UAE performed. The color showed average luminosity (L*) and a greater tendency towards yellow (positive b* values). BI flour has a darker color (L* around 47) when compared to other vegetable flours, such as rye (L* = 62.17), corn (L* = 84.3), and wheat (L* = 86.92) flours [56]. Darkening of the banana peel flour was considered a consequence of pigment degradation [57], resulting from polyphenol oxidation and nonenzymatic browning reactions, such as caramelization and the Maillard reaction, which occur during drying [53,57].
4. Conclusions
The UAE of BI conducted at 350 W, 55 °C, and 1:30 g/mL (sample-to-solvent ratio) for 30 min showed the highest efficiency to extract TPC (1637.12 mg GAE/100 g) and TFC (22.97 mg QE/100 g), whose values were 3.5- and 1.6-times higher than the values obtained by OSE. Consequently, UAE promoted the highest removal of phenolic acids and flavonoids, such as p-hydroxybenzoic acid, protocatechuic acid, rutin, and organic acids (malic acid and quinic acid), favoring antioxidant activity. UAE increased the fiber content of the residue, which led to an improved OAI when compared to untreated BI. BI residue also showed emulsifying properties, such as WSI and WAI, which can favor its application in food products. Thus, these results provide a solid basis for future research and industrial applications, emphasizing the potential of ultrasound in the extraction of bioactive compounds from BI, fostering the upcycling of the banana harvesting sector. Future research can be conducted to evaluate the potential of the extract as an antioxidant in foods, cosmetics, or other types of products, and the residue can be applied to fortify food products as a source of dietary fiber. The results of this work also encourage the study of the pharmacological properties of the extract obtained by UAE.
Supplementary Materials
The following supporting information can be downloaded at: https://www.mdpi.com/article/10.3390/separations12050109/s1, Table S1: ANOVA for total phenolic content (TPC) and total flavonoid content (TFC) of the BI extracts considering the significant effects (Table 2).
Author Contributions
Conceptualization, M.C.F. and B.C.B.B.; methodology, F.D.B.J. and É.M.P.C.; software, F.D.B.J. and B.C.B.B.; formal analysis, F.D.B.J., É.M.P.C., M.C.F. and B.C.B.B.; resources, M.C.F., F.D.B.J., É.M.P.C. and B.C.B.B.; data curation, M.C.F., F.D.B.J. and B.C.B.B.; writing—original draft preparation, M.C.F., F.D.B.J. and B.C.B.B.; writing—review and editing, M.C.F., F.D.B.J., É.M.P.C. and B.C.B.B.; supervision, M.C.F. and B.C.B.B.; project administration, B.C.B.B. All authors have read and agreed to the published version of the manuscript.
Funding
This research was funded by CNPQ (National Council for Scientific and Technological Development), grant number 310472/2022-9.
Data Availability Statement
The original contributions presented in this study are included in the article. Further inquiries can be directed to the corresponding author(s).
Acknowledgments
The authors would like to thank CNPQ (National Council for Scientific and Technological Development) for financial support.
Conflicts of Interest
The authors declare no conflicts of interest.
References
- IBGE—Instituto Brasileiro de Geografia e Estatística. Produção de Banana No Brasil. 2023. Available online: https://www.ibge.gov.br/explica/producao-agropecuaria/banana/br (accessed on 26 February 2025).
- Mathew, N.S.; Negi, P.S. Traditional uses, phytochemistry and pharmacology of wild banana (Musa acuminata Colla): A review. J. Ethnopharmacol. 2017, 196, 124–140. [Google Scholar] [CrossRef] [PubMed]
- Padam, B.S.; Tin, H.S.; Chye, F.Y.; Abdullah, M.I. Banana by-products: An under-utilized renewable food biomass with great potential. J. Food Sci. Technol. 2012, 51, 3527–3545. [Google Scholar] [CrossRef]
- Lau, B.F.; Kong, K.W.; Leong, K.H.; Sun, J.; He, X.; Wang, Z.; Mustafa, M.R.; Ling, T.C.; Ismail, A. Banana inflorescence: Its bio-prospects as an ingredient for functional foods. Trends Food Sci. Technol. 2020, 97, 14–28. [Google Scholar] [CrossRef]
- Kraithong, S.; Issara, U. A strategic review on plant by-product from banana harvesting: A potentially bio-based ingredient for approaching novel food and agro-industry sustainability. J. Saudi Soc. Agric. Sci. 2021, 20, 530–543. [Google Scholar] [CrossRef]
- Thagunna, B.; Kandel, K.; Lamichhane, B. Banana blossom: Nutritional value, health benefits, and its utilization. Rev. Food Agric. 2023, 4, 66. [Google Scholar] [CrossRef]
- Gayathry, K.S.; John, J.A. Phenolic profile, antioxidant, and hypoglycaemic potential of pseudostem and inflorescence extracts of three banana cultivars. Biomass-Convers. Biorefin. 2023, 15, 2387–2395. [Google Scholar] [CrossRef]
- Sheng, Z.W.; Ma, W.H.; Gao, J.H.; Bi, Y.; Zhang, W.M.; Dou, H.T.; Jin, Z.Q. Antioxidant properties of banana flower of two cultivars in China using 2,2-diphenyl-1-picrylhydrazyl (DPPH) reducing power, 2,2′-azinobis-(3-ethylbenzthiazoline-6-sulphonate (ABTS), and inhibition of lipid peroxidation assays. Afr. J. Biotechnol. 2011, 10, 4470–4477. [Google Scholar]
- Qamar, S.; Shaikh, A. Therapeutic potentials and compositional changes of valuable compounds from banana—A review. Trends Food Sci. Technol. 2018, 79, 1–9. [Google Scholar] [CrossRef]
- Bhaskar, J.J.; Mahadevamma, S.; Chilkunda, N.D.; Salimath, P.V. Banana (Musa sp. var. elakki bale) Flower and Pseudostem: Dietary Fiber and Associated Antioxidant Capacity. J. Agric. Food Chem. 2012, 60, 427–432. [Google Scholar] [CrossRef]
- Bai, G.; Bee, J.S.; Biddlecombe, J.G.; Chen, Q.; Leach, W.T. Computational fluid dynamics (CFD) insights into agitation stress methods in biopharmaceutical development. Int. J. Pharm. X 2012, 423, 264–280. [Google Scholar] [CrossRef]
- Espada-Bellido, E.; Ferreiro-González, M.; Carrera, C.; Palma, M.; Barroso, C.G.; Barbero, G.F. Optimization of the ultrasound-assisted extraction of anthocyanins and total phenolic compounds in mulberry (Morus nigra) pulp. Food Chem. 2017, 219, 23–32. [Google Scholar] [CrossRef] [PubMed]
- Chemat, F.; Rombaut, N.; Sicaire, A.-G.; Meullemiestre, A.; Fabiano-Tixier, A.-S.; Abert-Vian, M. Ultrasound-assisted extraction of food and natural products. Mechanisms, techniques, combinations, protocols and applications. A review. Ultrason. Sonochem. 2017, 34, 540–560. [Google Scholar] [CrossRef]
- Rusli, R.; Mahata, M.; Yuniza, A.; Zurmiati, Z.; Reski, S.; Hidayat, C.; Hilmi, M.; Mutia, R. Optimization of solvent and extraction time on secondary metabolite content of mangosteen leaf (Garcinia mangostana L.) as a feed additive candidate on poultry. J. Adv. Veter-Anim. Res. 2024, 11, 139. [Google Scholar] [CrossRef]
- Strižincová, P.; Šurina, I.; Jablonský, M.; Majová, V.; Ház, A.; Hroboňová, K.; Špačková, A. Analyzing the effect of extraction parameters on phenolic composition and selected compounds in clove buds using choline chloride and lactic acid as extraction agents. Processes 2024, 12, 653. [Google Scholar] [CrossRef]
- Schmidt, M.M.; Prestes, R.C.; Kubota, E.H.; Scapin, G.; Mazutti, M.A. Evaluation of antioxidant activity of extracts of banana inflorescences (Musa cavendishii). CyTA—J. Food 2015, 13, 498–505. [Google Scholar] [CrossRef]
- Caldas, T.W.; Mazza, K.E.L.; Teles, A.S.C.; Mattos, G.N.; Brígida, A.I.S.; Conte-Junior, C.A.; Borguini, R.G.; Godoy, R.L.O.; Cabral, L.M.C.; Tonon, R.V. Phenolic compounds recovery from grape skin using conventional and non-conventional extraction methods. Ind. Crop Prod. 2018, 111, 86–91. [Google Scholar] [CrossRef]
- Singleton, V.L.; Orthofer, R.; Lamuela-Raventós, R.M. Analysis of total phenols and other oxidation substrates and antioxidants by means of folin-ciocalteu reagent. Methods Enzymol. 1999, 299, 152–178. [Google Scholar]
- Boateng, J.; Verghese, M.; Walker, L.; Ogutu, S. Effect of processing on antioxidant contents in selected dry beans (Phaseolus spp. L.). LWT-Food Sci. Technol. 2008, 41, 1541–1547. [Google Scholar] [CrossRef]
- Thaipong, K.; Boonprakob, U.; Crosby, K.; Cisneros-Zevallos, L.; Hawkins Byrne, D. Comparison of ABTS, DPPH, FRAP, and ORAC assays for estimating antioxidant activity from guava fruit extracts. J. Food Compos. Anal. 2006, 19, 669–675. [Google Scholar] [CrossRef]
- Stevanato, N.; Hoscheid, J.; Peron, A.P.; Coelho, É.M.P.; da Silva, C.; da Silva, E.A. Green extraction of valuable compounds from the byproduct of oil extraction from forage radish seed. Ind. Crops Prod. 2025, 224, 120257. [Google Scholar] [CrossRef]
- AOAC (Association of Official Analytical Chemists). Official Methods of Analysis, 22nd ed.; AOAC International: Rockville, MD, USA, 2023. [Google Scholar]
- Seibel, N.F.; Beléia, A. The chemical characteristics and technological functionality of soybean-based ingredients [Glycine max (L.) Merrill]: Carbohydrates and proteins. Braz. J. Food Technol. 2009, 12, 113–122. [Google Scholar] [CrossRef]
- Irakli, M.; Chatzopoulou, P.; Ekateriniadou, L. Optimization of ultrasound-assisted extraction of phenolic compounds: Oleuropein, phenolic acids, phenolic alcohols and flavonoids from olive leaves and evaluation of its antioxidant activities. Ind. Crop Prod. 2018, 124, 382–388. [Google Scholar] [CrossRef]
- Beaufils, N.; Boucher, J.; Peydecastaing, J.; Rigal, L.; Vilarem, G.; Villette, M.-J.; Candy, L.; Pontalier, P.-Y. The effect of time and temperature on the extraction of xylose and total phenolic compounds with pressurized hot water from hardwood species used for pulp and paper production in the South of France. Bioresour. Technol. Rep. 2021, 16, 100832. [Google Scholar] [CrossRef]
- Neves, M.I.L.; Strieder, M.M.; Vardanega, R.; Silva, E.K.; Meireles, M.A.A. Biorefinery of turmeric (Curcuma longa L.) using non-thermal and clean emerging technologies: An update on the curcumin recovery step. RSC Adv. 2020, 10, 112–121. [Google Scholar] [CrossRef]
- Girotto, L.M.; Herrig, S.P.; Nunes, M.G.I.; Sakai, O.A.; Barros, B.C. Extraction of phenolic compounds from Pfaffia glomerata leaves and evaluation of composition, antioxidant and antibacterial properties. An. Acad. Bras. Ciências 2025, 97, e20240317. [Google Scholar] [CrossRef] [PubMed]
- Basumatary, S.; Nath, N. Assessment of chemical compositions and in vitro antioxidant properties of Musa balbisiana Colla inflorescence. Int. J. Pharm. Res. 2018, 10, 80–95. [Google Scholar]
- Al-Dhabi, N.; Karuppiah, P.; Maran, P. Development and Validation of Ultrasound-Assisted Solid-Liquid Extraction of Phenolic Compounds from Waste Spent Coffee Grounds. Ultrason. Sonochem. 2016, 34, 206–213. [Google Scholar] [CrossRef]
- Zampar, G.G.; Zampar, I.C.; Beserra da Silva de Souza, S.; da Silva, C.; Barros, B.C.B. Effect of solvent mixtures on the ultrasound-assisted extraction of compounds from pineapple by-product. Food Biosci. 2022, 50, 102098. [Google Scholar] [CrossRef]
- Şahin, S.; Şamlı, R. Optimization of olive leaf extract obtained by ultrasound-assisted extraction with response surface methodology. Ultrason. Sonochem. 2013, 20, 595–602. [Google Scholar] [CrossRef]
- Wen, C.; Zhang, J.; Zhang, H.; Dzah, C.S.; Zandile, M.; Duan, Y.; Ma, H.; Luo, X. Advances in ultrasound assisted extraction of bioactive compounds from cash crops—A review. Ultrason. Sonochem. 2018, 48, 538–549. [Google Scholar] [CrossRef]
- Yang, S.; Liu, B.; Tang, M.; Yang, J.; Kuang, Y.; Zhang, M.; Zhang, C.; Wang, C.; Qin, J.; Guo, L.; et al. Extraction of flavonoids from Cyclocarya paliurus (Juglandaceae) leaves using ethanol/salt aqueous two-phase system coupled with ultrasonic. J. Food Process. Preserv. 2020, 44, e14469. [Google Scholar] [CrossRef]
- Donadone, D.B.d.S.; Giombelli, C.; Silva, D.L.G.; Stevanato, N.; Silva, C.; Barros, B.C.B. Ultrasound-assisted extraction of phenolic compounds and soluble sugars from the stem portion of peach palm. J. Food Process. Preserv. 2020, 44, e14636. [Google Scholar]
- Nipornram, S.; Tochampa, W.; Rattanatraiwong, P.; Singanusong, R. Optimization of low power ultrasound-assisted extraction of phenolic compounds from mandarin (Citrus reticulata Blanco cv. Sainampueng) peel. Food Chem. 2018, 241, 338–345. [Google Scholar] [CrossRef]
- Shen, L.; Pang, S.; Zhong, M.; Sun, Y.; Qayum, A.; Liu, Y.; Rashid, A.; Xu, B.; Liang, Q.; Ma, H.; et al. A comprehensive review of ultrasonic assisted extraction (UAE) for bioactive components: Principles, advantages, equipment, and combined technologies. Ultrason. Sonochem. 2023, 101, 106646. [Google Scholar] [CrossRef]
- Nisha, P.; Mini, S. Flavanoid-rich ethyl acetate fraction of Musa paradisiaca inflorescence down-regulates the streptozotocin-induced oxidative stress, hyperglycaemia and mRNA levels of selected inflammatory genes in rats. J. Funct. Foods 2013, 5, 1838–1847. [Google Scholar] [CrossRef]
- Gayathry, K.S.; John, J.A. Physical, functional and bioactive properties of microencapsulated powders from banana pseudostem and inflorescence extracts. Food Prod. Process. Nutr. 2024, 6, 74. [Google Scholar] [CrossRef]
- Ramu, R.; Shirahatti, P.; Anilakumar, K.; Nayakavadi, S.; Zameer, F.; Dhananjaya, B.; Prasad, M.N. Assessment of nutritional quality and global antioxidant response of banana (Musa sp. CV. Nanjangud Rasa Bale) pseudostem and flower. Pharmacogn. Res. 2017, 9 (Suppl. S1), S74. [Google Scholar]
- Sheng, Z.W.; Ma, W.H.; Jin, Z.Q.; Bi, Y.; Sun, Z.G.; Dou, H.T.; Li, J.Y.; Han, L.N. Investigation of dietary fiber, protein, vitamin E, and other nutritional compounds of the banana flower of two cultivars grown in China. Afr. J. Biotechnol. 2010, 9, 3888–3895. [Google Scholar]
- Krishnan, S.A.; Sinija, V.R. Proximate composition and antioxidant activity of banana blossom of two cultivars in India. Int. J. Agric. Food Sci. Technol. 2016, 7, 13–22. [Google Scholar]
- Marikkar, J.M.N.; Tan, S.J.; Salleh, A.; Azrina, A.; Shukri, M.A. Evaluation of banana (Musa sp.) flowers of selected varieties for their antioxidative and antihyperglycemic potentials. Int. Food Res. J. 2016, 23, 1988–1995. [Google Scholar]
- Benali, T.; Bakrim, S.; Ghchime, R.; Benkhaira, N.; El Omari, N.; Balahbib, A.; Taha, D.; Zengin, G.; Hasan, M.M.; Bibi, S.; et al. Pharmacological insights into the multifaceted biological properties of quinic acid. Biotechnol. Genet. Eng. Rev. 2024, 40, 3408–3437. [Google Scholar] [CrossRef] [PubMed]
- Kaur, G.; Shivanandappa, T.B.; Kumar, M.; Kushwah, A.S. Fumaric acid protect the cadmium-induced hepatotoxicity in rats: Owing to its antioxidant, anti-inflammatory action and aid in recast the liver function. Naunyn-Schmiedeberg’s Arch. Pharmacol. 2020, 393, 1911–1920. [Google Scholar] [CrossRef] [PubMed]
- Sadowska-Bartosz, I.; Bartosz, G. Evaluation of The Antioxidant Capacity of Food Products: Methods, Applications and Limitations. Processes 2022, 10, 2031. [Google Scholar] [CrossRef]
- Rumpf, J.; Burger, R.; Schulze, M. Statistical evaluation of DPPH, ABTS, FRAP, and Folin-Ciocalteu assays to assess the antioxidant capacity of lignins. Int. J. Biol. Macromol. 2023, 233, 123470. [Google Scholar] [CrossRef]
- Akhlaghi, M. The role of dietary fibers in regulating appetite, an overview of mechanisms and weight consequences. Crit. Rev. Food Sci. Nutr. 2024, 64, 3139–3150. [Google Scholar] [CrossRef]
- Felli, R.; Yang, T.A.; Abdullah, W.N.W.; Zzaman, W. Effects of incorporation of jackfruit rind powder on chemical and functional properties of bread. Trop. Life Sci. Res. 2018, 29, 113. [Google Scholar] [CrossRef] [PubMed]
- Lima, L.E.d.M.; Maciel, B.L.L.; Passos, T.S. Oil frying processes and alternative flour coatings: Physicochemical, nutritional, and sensory parameters of meat products. Foods 2024, 13, 512. [Google Scholar] [CrossRef]
- Kunyanee, K.; Ngo, T.; Kasumawardani, S.; Luangsakul, N. Enhancing banana flour quality through physical modifications and its application in gluten-free chips product. Foods 2024, 13, 593. [Google Scholar] [CrossRef]
- Bakar, S.K.S.A.; Ahmad, N.; Jailani, F. Chemical and functional properties of local banana peel flour. J. Food Nutr. Res. 2018, 6, 492–496. [Google Scholar]
- Jha, P.; Meghwal, M.; Prabhakar, P.K.; Singh, A. Exploring effects of different pretreatments on drying kinetics, moisture diffusion, physico-functional, and flow properties of banana flower powder. J. Food Process. Preserv. 2021, 45, e15356. [Google Scholar] [CrossRef]
- Asouzu, I.; Oly-Alawuba, N.M.; Umerah, N.N. Functional Properties and Chemical Composition of Composite Flour Made from Cooking Banana (Musa paradisiaca) and Yellow Maize (Zea mays). Res. J. Food Nutri. 2020, 4, 6–12. [Google Scholar] [CrossRef]
- Deb, S.; Kumar, Y.; Saxena, D. Functional, thermal and structural properties of fractionated protein from waste banana peel. Food Chem. X 2022, 13, 100205. [Google Scholar] [CrossRef] [PubMed]
- Shafiei, M.; Kazemzadeh, Y.; Martyushev, D.A.; Dai, Z.; Riazi, M. Effect of chemicals on the phase and viscosity behavior of water in oil emulsions. Sci. Rep. 2023, 13, 4100. [Google Scholar] [CrossRef] [PubMed]
- Popovska, O. Determination of some flour characteristics. Eur. J. Agric. Food Sci. 2023, 5, 8–12. [Google Scholar] [CrossRef]
- Vu, H.T.; Scarlett, C.J.; Vuong, Q.V. Effects of drying conditions on physicochemical and antioxidant properties of banana (Musa cavendish) peels. Dry. Technol. 2017, 35, 1141–1151. [Google Scholar] [CrossRef]

Disclaimer/Publisher’s Note: The statements, opinions and data contained in all publications are solely those of the individual author(s) and contributor(s) and not of MDPI and/or the editor(s). MDPI and/or the editor(s) disclaim responsibility for any injury to people or property resulting from any ideas, methods, instructions or products referred to in the content. |
© 2025 by the authors. Licensee MDPI, Basel, Switzerland. This article is an open access article distributed under the terms and conditions of the Creative Commons Attribution (CC BY) license (https://creativecommons.org/licenses/by/4.0/).