Abstract
A five-bed, seven-step vacuum pressure swing adsorption (VPSA) system was computationally modeled to assess carbon monoxide (CO) separation from CO/N2 mixed gas (30/70, v/v). Two adsorbents with distinct isotherm characteristics (steep-slope CuCl/NaY and flat-slope CuCl/AC) were comparatively evaluated for their process performance, focusing on CO purity, recovery, productivity, and energy consumption. The simulation results demonstrate that under industrial-grade specifications requiring both adsorbents to achieve CO purity > 97% and recovery > 83%, CuCl/AC achieves a 3.9-fold higher productivity (27.238 vs. 7.016 mol kg−1 h−1) than CuCl/NaY while maintaining a comparable energy consumption. This performance disparity stems from CuCl/AC’s enhanced bed layer CO desorption amount during a cyclic VPSA operation, which enhances feed gas throughput per unit adsorbent mass. This study demonstrates that CuCl/AC, with its flat-slope adsorption isotherm and high desorption amount, can serve as a promising adsorbent for achieving high-purity CO with a significantly enhanced productivity via the VPSA process.
1. Introduction
Carbon monoxide (CO) is a critical synthetic raw material for organic chemical products and intermediates [1,2,3]. CO is mainly derived from syngas obtained from the conversion of coal and natural gas [4]. In addition, blast furnace gas, as the main byproduct gas of steel plants, is rich in CO and can be an important source for purifying CO [5]. Extracting high-purity CO from blast furnace gas and using it for the production of chemical products can not only reduce carbon emissions [6,7], but also realize the efficient resource utilization of industrial exhaust gas.
Blast furnace gas is composed of N2, CO, CO2, O2, sulfide, and other components. After pretreatment, such as dust removal, desulfurization, and decarbonization, blast furnace gas becomes a mixture of 30% CO and 70% N2 [8]. The feasible technologies for separating and purifying CO from a mixture of CO and N2 gas include cryogenic distillation, absorption, and adsorption process [9]. Cryogenic distillation requires a large amount of energy and has difficulty obtaining high-purity CO due to the similar boiling points of CO and N2 (82 vs. 72 K). In the absorption method, the Cu+ ions in the absorbent are unstable and prone to irreversible reactions. In contrast, the pressure swing adsorption (PSA) process [10] based on the adsorption–desorption continuous cycle is the most suitable method for CO enrichment due to its simple operation and low operating costs. Furthermore, the key to achieving superior separation performance in PSA is the selection of excellent adsorbents that satisfy the requirements of effective process design. The most typical adsorbent currently used in industrial pressure swing adsorption is a Cu(Ⅰ)-based adsorbent supported by carbon or zeolite [11,12], which utilizes the reversible π-complexation between Cu(Ⅰ) and CO to selectively adsorb CO. From the shape of the CO adsorption curve, CuCl/NaY exhibits steeper adsorption isotherms and adsorb more CO at low pressures. However, CuCl/AC exhibits a flatter adsorption curve, with less adsorption at low pressure and more adsorption at high pressure [13,14]. Therefore, within a certain adsorption–desorption pressure range in the PSA process, these two types of adsorbents will have different CO/N2 separation performance values.
To assess the applicability of adsorbents for the adsorption separation process, several studies have reported on VPSA process simulation. Gao and Li et al. [15,16] both simulated a five-bed VPSA process for CO recovery from syngas (32.3% CO), using Cu(I)AC and Cu(I)Y adsorbents, respectively, but only focusing on purity and recovery, without discussing the results in terms of productivity and economics. Zhou et al. [17] used a hybrid packing of CuCl@AC and Cu(I)Y adsorbents to simulate a five-bed CO-VPSA process for enriching CO from synthesis gas (32.3% CO). Hyunmin Oh et al. [18] selected the adsorbent CuCl/boehmite and used a numerical model validated by experimental data to determine the appropriate bed operation configuration for vacuum pressure swing adsorption (VPSA). So far, there has been no comprehensive study to evaluate how adsorbent types (steep-slope CuCl/NaY and flat-slope CuCl/AC) affect key performance indicators in the VPSA process for separating CO from CO/N2 mixed gas (30/70, v/v). The key parameters include CO purity, recovery, productivity, and energy consumption.
In this work, we prepared and used two types of adsorbents, CuCl/NaY with steeper isotherms and CuCl/NaY with flatter isotherms, to enrich CO from CO/N2 mixed gas (30/70, v/v). The static and dynamic adsorption experimental data were parameterized to analyze the transport of each component within the adsorption bed. Subsequently, models for mass transfer, momentum transfer, heat transfer, and adsorption isotherms were constructed. The comparative breakthrough data obtained from the experiment verify the accuracy of the established adsorption separation model. A reasonable process timing chart was designed, and a five-bed VPSA system was used to simulate CO/N2 separation. Through process simulation, the adsorption behavior within the adsorption bed at the end of each step was studied. Specifically, this involved analyzing the amount of solid-phase adsorption and the concentration of gas-phase at the end of each step. Finally, the purity, recovery, productivity, and energy consumption of the five-bed pressure swing adsorption separation process were calculated, the two adsorbents were comprehensively compared, and support was provided for the industrial use of the adsorbents.
2. Experimental Section
2.1. Adsorbent Materials
Cu(I)/AC and CuCl/NaY adsorbents were employed in our work. These two adsorbents were prepared using the solid thermal dispersion method as described in a previous study [19] using NaY (catalyst plant of Nankai University) and laboratory-prepared porous carbon [20] as support materials and CuCl and CuCl2 as copper sources. CuCl/AC and CuCl/NaY were further activated under vacuum at 423 K for 2 h before further testing. In addition, the chemical agents used as the adsorbates were high purity CO (99.99%) and N2 (99.99%).
2.2. Adsorption Equilibrium Isotherms
Static adsorption equilibrium isotherms of CO and N2 were measured using a volumetric method (Micromeritics ASAP 2020 analyzer) at 298 K; the results are presented in Figure 1. It can be seen that both CuCl/AC and CuCl/NaY adsorbents had a much larger adsorption capacity for CO than N2, which is due to the π-complexation between Cu(I) and CO, which preferentially adsorbs CO. From the characteristics of the CO adsorption isotherms, CuCl/NaY exhibited a typical type-I adsorption curve, which is steep in the low-pressure region and close to saturation at 0.1 bar, whereas CuCl/AC presented a flatter isotherm. Based on the analysis of the CO adsorption isotherms, there was a significant difference in the cyclic desorption amount between the two adsorbents. Under fixed adsorption (1 bar) and desorption (0.2 bar) pressures, flat-slope CuCl/AC achieved a dynamic CO desorption amount of 1.97 mmol/g, significantly higher than the 0.35 mmol/g achieved using steep-slope CuCl/NaY.
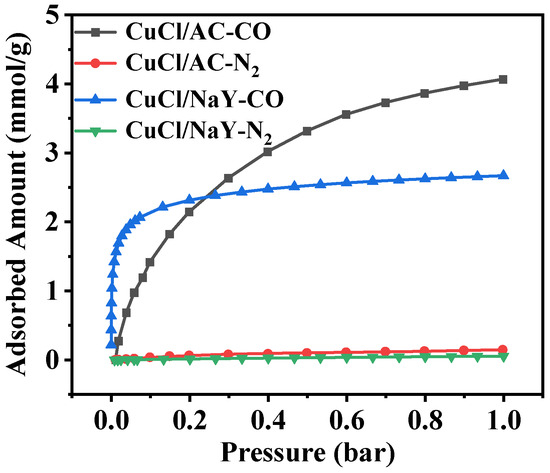
Figure 1.
Adsorption isotherms of CO and N2 on CuCl/NaY and CuCl/AC.
In this work, the adsorption equilibrium was fitted. For the CuCl/NaY adsorbent, the NaY zeolite possessed a highly ordered microporous structure and uniform surface properties. The adsorption of N2 is a physisorption process, with uniform energy distribution across all adsorption sites. Therefore, the N2 adsorption isotherm of CuCl/NaY was simulated using the single-site Langmuir model. In contrast, the CO adsorption process involved both weak chemisorption via π-complexation with Cu(I)-active sites and physisorption. Thus, the CO adsorption isotherm of CuCl/NaY was fitted with the dual-site Langmuir model. For the CuCl/AC adsorbent, the activated carbon (AC) support exhibited a hierarchical pore structure (including micropores and mesopores). The surface chemical heterogeneity and non-uniform pore size distribution led to energetic heterogeneity in the adsorption process. Consequently, both CO and N2 adsorption isotherms of CuCl/AC were analyzed using the dual-site Langmuir model. The isotherm model is shown in Equations (1) and (2). The isotherm model parameters for CuCl/NaY and CuCl/AC can be found in Table 1.
where qi is the adsorbed phase concentration with bulk component i (kmol kg−1) and Pi is the pressure of component i (bar).

Table 1.
Adsorption isotherm parameters.
2.3. Fixed-Bed Breakthrough Measurement
The CO/N2 breakthrough experiments were performed in a home-made dynamic gas breakthrough apparatus at 298 K and 1 bar, where 0.48 g of CuCl/AC and 1.37 g of CuCl/NaY were packed in a fixed-bed with a height of 12 cm and an inner diameter of 4 mm, respectively. The adsorbents were regenerated at 453 K for 5 h under Ar flow (10 mL min−1). After cooling, the fixed-bed was kept under evacuation for 0.5 h; CO/N2 mixed gas (30/70, v/v) was then introduced at a rate of 10 mL min−1. The outlet gas concentration was monitored using a mass spectrometer (DSMS, Hiden). The fixed-bed breakthrough curve can evaluate the actual separation effect of adsorbents on mixed gases and provide validation for modeling calculations in subsequent process simulation work.
2.4. Simulation Method
In this work, we used Aspen Adsorption V14 (Aspen Technology, Inc., Bedford, MA, USA) for adsorption process modeling and VPSA system design. Aspen Adsorption is a professional adsorption separation simulation software that integrates design, modeling, operation, and optimization, encompassing most of the existing adsorption separation theoretical models. The software provides dynamic simulation capabilities, allowing for the simulation of the entire adsorption cycle, analysis of system transient behavior, and assistance in optimizing parameters, such as cycle time and pressure settings. This dynamic modeling capability enhances the precision and efficiency of VPSA system design.
3. Computational Analysis
3.1. Mass, Energy, and Momentum Balance Model
Partial differential equations (PDEs) were employed to model the mass, energy, and momentum transfer processes of each component within the adsorption bed. The finite difference method (FDM) was then utilized to discretize these PDEs along the axial direction of the bed, dividing it into 20 discrete points.
When a gas mixture passes through an adsorption bed, it undergoes axial and radial diffusion, with mass transfer occurring between the gas phase and the gas–solid interface. Under the assumption of axial gas flow, radial diffusion can be neglected. Equation (3) presents a simplified mass balance equation for this system.
where Dax is the axial diffusion coefficient (m2 s−1), t is the time (s), εb is the bed void fraction, εp is the particle porosity, ρs is the adsorbent density (kg m−3), vg is the gas velocity (m s−1), ci is the gas-phase concentration of component i (mol m−3), z is the axial coordinate (m), wi is the adsorbed phase concentration of component i (mol kg−1), rp is the adsorbent particle radius (m), and Dm is the molecular diffusivity coefficient (m2 s −1).
The adsorption rate was determined using the lumped resistance method and expressed with the linear driving force model (LDF) [21,22], as shown in Equation (5):
where wi* is the adsorbed phase concentration in equilibrium with bulk component i (mol kg−1) and MTCi is the constant mass transfer coefficient (s−1).
The momentum balance model (Equation (6)) is described using the Ergun equation [23]:
where P is the pressure (bar), μ is the gas viscosity (kg m−1 s−1), Ψ is the particle sphericity, M is the molecular weight (kg mol−1) and ρg is the gas-phase molar density (mol m−3).
The energy balance is established in Equations (7)–(9):
where kg is the gas-phase thermal conductivity (W·m−1·K−1), ks is the solid thermal conductivity (W·m−1·K−1), kw is the thermal conductivity of the bed wall (W·m−1·K−1), Tg is the gas-phase temperature (K), Ts is the solid temperature (K), Tw is the bed wall temperature (K), Cvg is the specific gas-phase heat capacity at a constant volume (kJ·kmol−1·K−1), HTCap is the gas−solid heat transfer coefficient (W·m−2·K−1), Hw is the gas–wall heat transfer coefficient (W·m−2·K−1), Db is the adsorption bed’s inner diameter (m), T0 is the inner temperature of the bed wall (K), Cps is the specific heat capacity of the adsorbent (kJ·kg−1·K−1), Cpa,i is the specific heat capacity of the adsorbed phase of component i (kJ·kmol−1·K−1), ΔHi is the isosteric heat of adsorption of component i (kJ·mol−1), ρw is the density of the bed wall (kg·m−3), Cpw is the specific heat capacity of the bed wall (kJ·kg−1·K−1), Hw is the gas–wall heat transfer coefficient (W·m−2·K−1), WT is the thickness of the bed wall (m), Hamb is the wall–ambient heat transfer coefficient (W·m−2·K−1), and Tamb is the ambient temperature (K).
3.2. Performance Parameters for the Evaluation of VPSA Cycles
To evaluate the separation performance of the adsorbent, four key parameters were defined: purity, recovery, productivity, and energy consumption [24].
where Fproduct is the molar flowrate of the product stream (mol s−1), xCO,product is the molar fraction of CO in the product stream, Ffeed is the molar flowrate of the feed stream (mol s−1), xCO,feed is the molar fraction of CO in the feed stream, Ecomp is the power of the replacement compressor (kW), Epump is the power of the vacuum pump (kW), MCO is the molecular weight of CO (g mol−1).
3.3. Fixed-Bed Breakthrough Simulation
Single-bed breakthrough simulations were conducted for the CuCl/NaY and CuCl/AC adsorbents synthesized in the laboratory. The single-bed breakthrough model (Figure 2) was established using Aspen Adsorption software. The adsorber bed parameters and operational conditions were set to match those of the experimental setup, aiming to simulate the breakthrough behavior of CO/N2 on the synthesized adsorbents.
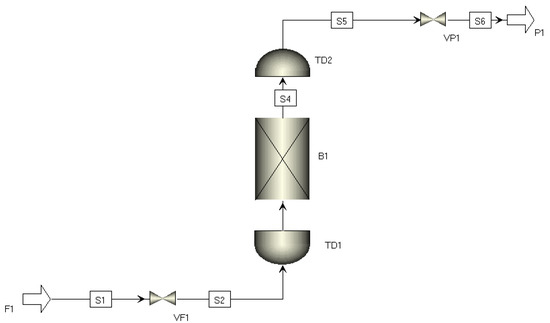
Figure 2.
Single-bed breakthrough model.
As shown in Figure 3, the experimentally measured breakthrough curves were compared with the simulated ones. The single-bed model can accurately reflect the actual conditions, as evidenced by the consistency between the simulated breakthrough curves and the experimental data for the CuCl/NaY and CuCl/AC adsorbents, which were obtained through outlet CO concentration measurements.
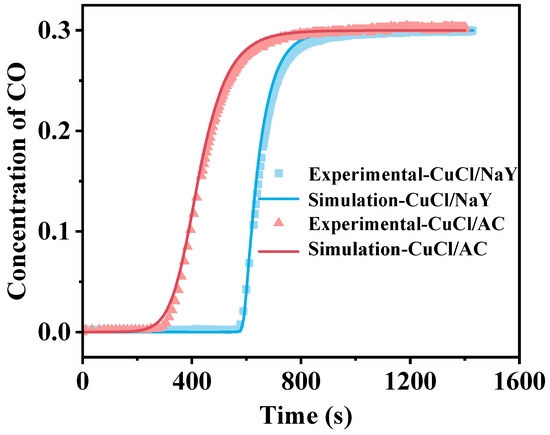
Figure 3.
The experimental and simulation breakthrough curves of CuCl/NaY and CuCl/AC.
3.4. Simulation of the VPSA Process
The VPSA process in industrial production is a continuous multi-bed separation operation. This study employed a five-bed seven-step vacuum pressure swing adsorption (VPSA) configuration, simulated via Aspen Adsorption software, to conduct a comparative analysis of CO separation performance between the CuCl/NaY and CuCl/AC adsorbents under the same adsorption and desorption pressure operating conditions. The cycle steady-state test tolerance was set to 1 × 10⁻³ in the Cycle Organizer. Meanwhile, the absolute and relative variable tolerances were set to 1 × 10⁻⁷. The simulation was carried out according to the process flow diagram in Figure 4 and the pressure history curve in Figure 5, in conjunction with the schedule control table (Table 2). The adsorption bed parameters and adsorbent characteristics used in this simulation are shown in Table 3. The specific process steps were as described below.
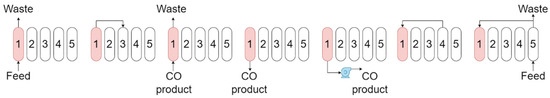
Figure 4.
Graphical cycle sequence introduced for VPSA process simulations (The arrows indicate the gas flow direction and the numbers indicate the beds).
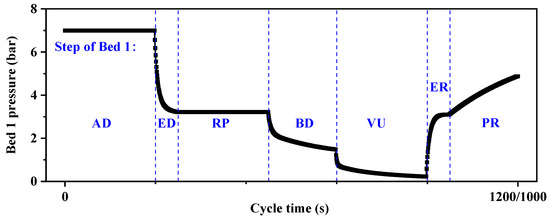
Figure 5.
Pressure history profile of the layered adsorption bed in a VPSA cycle.
Table 2.
Schedule control of the five-bed VPSA process.
Table 3.
Adsorbent and bed parameters used in Aspen Adsorption.
Adsorption (AD): feed gas was introduced from the bottom of the adsorption bed, where CO was adsorbed and fixed by the adsorbent, while N2 was desorbed and exited from the top of the bed. The adsorption pressure was maintained at 7 bar, and this process continued for 240/200 s.
Equalization−depressurization (ED): the connecting valve was opened between bed 1 and bed 3, which had just completed the vacuum process, and within 60/40 s, the pressure in bed 1 decreased from 7 bar to 3.22 bar.
Replacement (RP): part of the product gas was compressed by a compressor to a pressure slightly above 3.22 bar and fed into the system from the bottom of the bed. The adsorption front continuously moved upward, and the CO-poor gas in the interstitial space of the bed was discharged from the top.
Blow-down (BD): open the counter-current valves at the bottom of the bed, allowing the bed pressure to decrease to atmospheric pressure without the aid of a pump. This facilitates the initial desorption of the adsorption bed and enables the acquisition of high-purity CO product gas through counter-current flow.
Vacuum (VU): in this step, a vacuum pump was employed to reduce the bed pressure from the atmospheric level to 0.2 bar. Consequently, CO underwent desorption and was released, yielding high-purity product gas that flowed from the bottom to the product storage tank. This procedure was carried out for a duration of 240/200 s.
Equalization−repressurization (ER): after deep desorption in the adsorption bed, the bed layer was under negative pressure. Lean CO waste gas from the ED step’s outflow was introduced in a counterflow manner. Within 60/40 s, the adsorption pressure rose to 3.22 bar, conserving mechanical energy.
Pressurization (PR): part of the adsorption exhaust gas at the top of bed 5 was directly discharged, and part of it was used to charge the bed layer that had passed the equalization step to complete its final lifting step.
The feed temperature was set to 298.15 K, and the adsorption bed had been pressurized with pure N2 before the first cycle began, assuming the initial adsorption capacity of the adsorbent was conducive to the rapid stability of the whole process. On this basis, the above five-bed seven-step process simulation was carried out.
To evaluate the separation performance of the VPSA process for CO enrichment, four performance indicators are commonly used: product purity, product recovery, adsorbent productivity, and energy consumption. These four performance indicators are largely influenced by operating parameters, such as adsorption pressure, desorption pressure, feed flow rate, displacement flow rate, etc. In our VPSA process simulation work, we adjusted the optimal feed and replacement flow rate based on the characteristics of the adsorbents under the same adsorption and desorption pressures, ensuring the product gas purity reached 97% and the recovery was not less than 80%, comparing the productivity and energy consumption of the different adsorbents.
4. Results and Discussion
The vacuum pressure swing adsorption (VPSA) process is a dynamic cyclic operation for separating industrial off-gases. A five-bed seven-step VPSA process to separate CO/N2 (30/70, v/v) mixture at the ambient temperature was simulated and optimized through Aspen Adsorption, which could obtain a high-purity CO product. In order to understand the adsorption behavior of the adsorption bed during the process, the bed layer adsorption capacity and concentration of CO/N2 were analyzed.
4.1. Concentration and Adsorption Capacity at the End of Each Step
Figure 6 and Figure 7 depict the variations in the bed layer adsorption capacity and concentrations of CO throughout a cycle within an adsorption bed filled with different adsorbents, CuCl/AC and CuCl/NaY. After each step, a concentration gradient was established throughout the adsorption bed layer along the axial direction. The process involved seven corresponding curves per cycle. In the first AD step, the feed gas flowed into the bed from the bottom, and nearly half of adsorption bed reached CO adsorption saturation. The bed layer’s CO capacity of CuCl/AC reached 4.52 mmol/g, which is much higher than the 2.63 mmol/g of CuCl/NaY. This was due to the high adsorption capacity of CuCl/AC adsorbent at a total pressure of 7 bar (CO partial pressure of 2.1 bar). At the same time, it can be seen that in the bed layer gas phase, the CO concentration was consistent with the feed concentration at an axial distance ˂ 0.5 m in the adsorption bed. At an axial distance > 0.5 m, the CO concentration gradually decreased as the bed layer increased. In the ED step, the decrease in pressure led to a slight desorption of CO on the adsorption bed, resulting in a slight decrease in adsorption capacity. Therefore, the concentration of CO in the bed during the ED step was higher than the concentration at the end of the AD step. In addition, it can be observed that in the AD and ED steps, the CO adsorption breakthrough front of CuCl/AC was steeper than that of CuCl/NaY, resulting in a lower CO loss at the bed outlet. RP is the replacement step, which uses a high-purity CO product gas to rinse the bed, replacing the low-CO gas in the bed voids and dead volumes, and increases the concentration of CO in the adsorption bed. At the end of this step, the CO capacity on the bed reaches its maximum value, and the CO concentration in the gas phase approaches nearly 1.
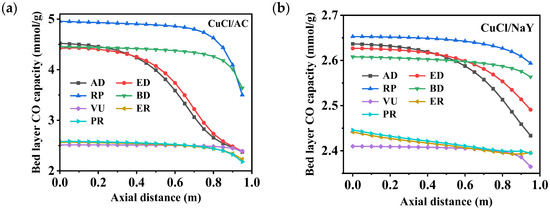
Figure 6.
Changes in the bed layer’s CO capacity distribution of (a) CuCl/AC and (b) CuCl/NaY along the axial bed at the end of each step.
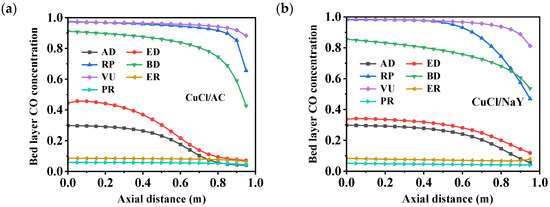
Figure 7.
Changes in the bed layer’s CO concentration distribution of (a) CuCl/AC and (b) CuCl/NaY along the axial bed at the end of each step.
The next step is desorption to produce a CO product gas, including the blow-down and vacuum steps. As the BD process progresses, the system pressure within the bed layer decreases, causing the N2 at the top of the bed to flow back into the bed layer. This results in a decrease in CO concentration. The vacuum step caused the bed pressure to rapidly decrease to 0.2 bar, and the CO on the adsorption bed was completely desorbed into the product tank. During this process, the CO concentrations in the CuCl/AC and CuCl/NaY beds reached 0.97 and 0.98, respectively. During the desorption process, the CO desorption amount in the CuCl/AC adsorption bed was 2.44 mmol/g, while the CO desorption amount in the CuCl/NaY adsorption bed was only 0.25 mmol/g. Completing the ER and PR steps required high-pressure CO-depleted gas from the other adsorption beds. This process added slightly to the CO adsorption amount within the bed. However, the significant residual N2 caused a rapid decline in CO concentration.
As shown in Figure 8, the bed layer adsorption capacity of CuCl/AC for N2 was higher than that of CuCl/NaY. However, the maximum adsorption capacity was only 0.29 mmol/g, which is significantly lower than the adsorbent’s capacity for CO, a key component. During the stages of AD, ED, and RP, the adsorption capacity of solid-phase N2 in the bed layer was gradually desorbed and discharged from the adsorption bed along with the tail gas. Throughout the entire VPSA process, N2 was primarily concentrated at the top of the bed layer, resulting in a purer CO at the bottom of the bed. The product gas was obtained through countercurrent flow from the bottom of the bed during the BD and VU steps, which reduced the impact of N2 on the purity of the product gas. The ER and PR were pressurized by adsorbing exhaust gases, with bed layers occupied by N2. In general, during the cyclic process, the adsorption behavior of both sorbents for the weakly adsorbed component N2 follows the same pattern. Figure 9 depicts the variations in gas-phase concentrations of N2 throughout a cycle within the adsorption bed filled with different adsorbents, specifically CuCl/AC and CuCl/NaY. Throughout the cycle, the concentrations of N2 and CO within the bed layer exhibited a dynamic interplay, constraining and influencing each other. The two adsorbents demonstrated a similar trend, with the bed gas-phase concentrations of N2 accounting for 70% at the end of the adsorption step. Meanwhile, at the top of the bed, the N2 concentration reached as high as 0.99, resulting in negligible CO wastage and thereby guaranteeing the recovery rate of CO. During the replacement and vacuum steps, under the conditions where the axial distance < 0.8, the partial pressure of N2 experienced a significant reduction compared to earlier steps, nearly reaching 0. This resulted in the production of a high-purity product gas.
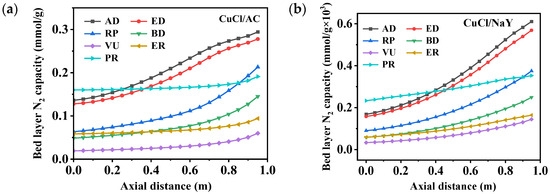
Figure 8.
Changes in the bed layer’s N2 capacity distribution of (a) CuCl/AC and (b) CuCl/NaY along the axial bed at the end of each step.
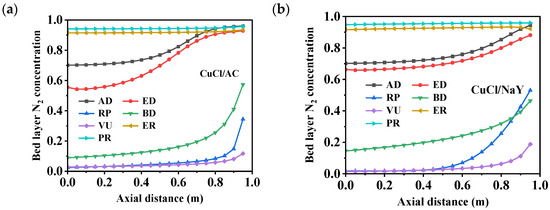
Figure 9.
Changes in the bed layer’s N2 concentration distribution of (a) CuCl/AC and (b) CuCl/NaY along the axial bed at the end of each step.
4.2. Computational Results
To evaluate the CO separation performance of two different adsorbents (CuCl/AC and CuCl/NaY), a simulation was conducted to analyze four key performance indicators: purity, recovery, productivity, and energy consumption. Under the experimental conditions of 7 bar adsorption pressure and 0.2 bar desorption pressure, the purity and recovery were evaluated by adjusting the feed and replacement flow rates. For CuCl/AC, under a feed flow rate of 4.4 × 10⁻⁴ kmol/s and a replacement flow rate of 1.1 × 10⁻⁴ kmol/s, the purity was 97.8% and the recovery was 83.9%. Similarly, for CuCl/NaY, under a feed flow rate of 1.5 × 10⁻⁴ kmol/s and a replacement flow rate of 2.8 × 10⁻⁵ kmol/s, the purity was 98.2% and the recovery was 87.1%. As shown in Figure 10, CuCl/AC demonstrated a higher productivity and similar energy consumption (CuCl/AC was 0.295 MJ kg−1, CuCl/NaY was 0.237 MJ kg−1) compared to CuCl/NaY, and both achieved comparable purity and recovery, satisfying industrial requirements. The productivity of the CuCl/AC adsorbent reached up to 27.238 mol kg−1 h−1, which is 2.9 times higher than that of CuCl/NaY (7.016 mol kg−1 h−1). High productivity indicates that a larger amount of feed can be processed per unit mass of adsorbent within the same operating time. The superior productivity of CuCl/AC compared to CuCl/NaY arises from its enhanced CO desorption amount during cyclic VPSA operations, which is fundamentally attributed to the adsorbent’s flat-slope isotherm that facilitates efficient regeneration while maintaining a high desorption amount.
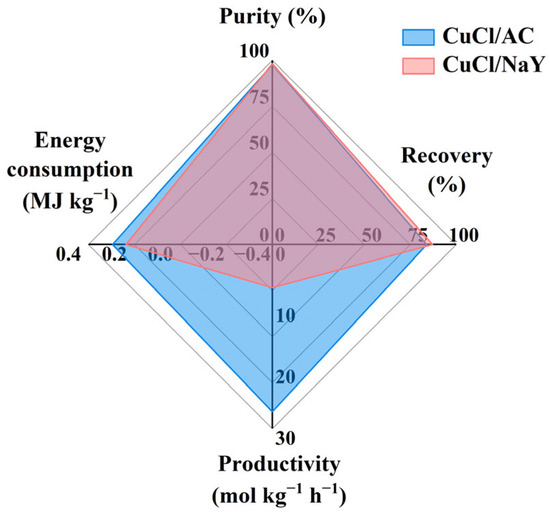
Figure 10.
Purity, recovery, productivity, and energy consumption for CuCl/AC and CuCl/NaY.
5. Conclusions
This study systematically investigated the critical role of adsorption isotherm characteristics in the vacuum pressure swing adsorption (VPSA) process performance through comparative analysis of the steep-slope CuCl/NaY and flat-slope CuCl/AC adsorbents. A five-bed seven-step VPSA model was used to simulate the process for separating CO from CO/N2 mixed gas (30/70, v/v). Prior to conducting the full-scale VPSA calculations, the pure component adsorption isotherms of CO and N2 on two adsorbents at 298 K were fitted using the Langmuir model and the dual-site Langmuir model. The adsorption kinetics and equilibrium of the CO/N2 mixture (30/70, v/v) were predicted in a single fixed-bed penetration curve, and the accuracy of the fixed-bed mathematical model used in the breakthrough simulation was verified.
The simulation results show that the product purity obtained from the CuCl/AC adsorbed bed was 97.8%, with a recovery of 83.9%, and the CuCl/NaY adsorbed bed achieved a product purity of 98.2% and a recovery of 87.1%. While its purity met industrial requirements and the recovery was comparable, CuCl/AC demonstrated a significantly higher productivity of 27.238 mol kg−1 h−1 compared to CuCl/NaY (7.016 mol kg−1 h−1), primarily due to its enhanced CO desorption amount during VPSA adsorption–desorption cycles, which enabled processing a larger feed volume per unit mass of adsorbent within the same operational timeframe. This study indicates that CuCl/AC can be considered a potential adsorbent for obtaining high-purity CO with considerable productivity through the VPSA process.
Author Contributions
Conceptualization, Q.S.; methodology, C.L. and X.G.; software, X.G., C.L., J.Y. and L.T.; validation, C.L. and X.G.; formal analysis, Q.S., C.L. and X.G.; investigation, C.L., X.G., L.T. and J.Y.; resources, Q.S.; data curation, X.G. and C.L.; writing—original draft preparation, X.G. and C.L.; writing—review and editing, Q.S., C.L. and X.G.; visualization, C.L. and X.G.; supervision, Q.S.; project administration, Q.S.; funding acquisition, Q.S. and X.G. All authors have read and agreed to the published version of the manuscript.
Funding
This research was funded by the Science Foundation for Distinguished Young Scholar of Shanxi Province (No. 202303021223002), and the National Natural Science Foundation of China (21822808) and Shanxi Provincial Postgraduate Research Innovation Project (RC2400005679).
Institutional Review Board Statement
Not applicable.
Informed Consent Statement
Not applicable.
Data Availability Statement
Data are available from the corresponding authors upon request.
Conflicts of Interest
The authors declare no conflicts of interest.
Nomenclature
| Dax | axial dispersion coefficient (m2 s −1) |
| ci | gas-phase concentration of component i (mol m−3) |
| Cpa,i | specific heat capacity of the adsorbed phase of component i (kJ·kmol−1·K−1) |
| Cps | specific heat capacity of the adsorbent (kJ·kg−1·K−1) |
| Cpw | specific heat capacity of the bed wall (kJ·kg−1·K−1) |
| Cvg | specific gas-phase heat capacity at the constant volume (kJ·kmol−1·K−1) |
| Db | bed diameter (m) |
| Dm,i | molecular diffusion coefficient of component i (m2·s−1) |
| Ecomp | compressor energy consumption (kW) |
| Epump | energy consumption of vacuum pumps (kW) |
| F | molar flow rate (mol·s−1) |
| HTCap | gas−solid heat transfer coefficient (W·m−2·K−1) |
| Hw | gas–wall heat transfer coefficient (W·m−2·K−1) |
| kg | gas–phase thermal conductivity (W·m−1·K−1) |
| ks | solid thermal conductivity (W·m−1·K−1) |
| kw | thermal conductivity of the bed wall (W·m−1·K−1) |
| M | molecular weight (kg mol−1) |
| P | pressure (bar) |
| qi | adsorbed phase concentration with bulk component i (kmol kg−1) |
| rp | adsorbent particle radius (m) |
| t | time (s) |
| T0 | inner temperature of the bed wall (K) |
| Tamb | ambient temperature (K) |
| Tg | gas–phase temperature (K) |
| Ts | solid temperature (K) |
| Tw | bed wall temperature (K) |
| wi | adsorbed phase concentration of component i (mol·kg−1) |
| wi* | adsorbed phase concentration in equilibrium with bulk component i (mol·kg−1) |
| Wt | thickness of the bed wall (m) |
| z | axial coordinate (m) |
| ΔHi | isosteric heat of adsorption of component i (kJ·mol−1) |
| εb | bed void fraction |
| ψ | shape factor |
| μ | gas viscosity (kg m−1 s−1) |
| νg | gas velocity (m s−1) |
| ρg | gas–phase molar density (mol·m−3) |
| ρs | adsorbent density (kg·m−3) |
| ρw | density of the bed wall (kg·m−3) |
References
- Evans, A.; Luebke, R.; Petit, C. The Use of Metal–Organic Frameworks for CO Purification. J. Mater. Chem. A 2018, 6, 10570–10594. [Google Scholar] [CrossRef]
- Mesters, C. A Selection of Recent Advances in C1 Chemistry. Annu. Rev. Chem. Biomol. Eng. 2016, 7, 223–238. [Google Scholar] [CrossRef] [PubMed]
- Martinelli, M.; Gnanamani, M.K.; LeViness, S.; Jacobs, G.; Shafer, W.D. An Overview of Fischer-Tropsch Synthesis: XtL Processes, Catalysts and Reactors. Appl. Catal. Gen. 2020, 608, 117740. [Google Scholar] [CrossRef]
- Heymans, N.; Alban, B.; Moreau, S.; De Weireld, G. Experimental and Theoretical Study of the Adsorption of Pure Molecules and Binary Systems Containing Methane, Carbon Monoxide, Carbon Dioxide and Nitrogen. Application to the Syngas Generation. Chem. Eng. Sci. 2011, 66, 3850–3858. [Google Scholar] [CrossRef]
- Karousos, D.S.; Theodorakopoulos, G.V.; Chiesa, F.; Barbe, S.; Bouroushian, M.; Favvas, E.P. CO2/CH4 and CO2/CO Selective Pebax-1657 Based Composite Hollow Fiber Membranes Prepared by a Novel Dip-Coating Technique. Separations 2025, 12, 3. [Google Scholar] [CrossRef]
- Ramírez-Santos, Á.A.; Castel, C.; Favre, E. A Review of Gas Separation Technologies within Emission Reduction Programs in the Iron and Steel Sector: Current Application and Development Perspectives. Sep. Purif. Technol. 2018, 194, 425–442. [Google Scholar] [CrossRef]
- Oh, H.; Beum, H.T.; Yoon, Y.-S.; Kim, J.; Han, Y.; Kim, J.; Lee, I.-B.; Lee, S.-Y.; Han, S.S. Experiment and Modeling of Adsorption of CO from Blast Furnace Gas onto CuCl/Boehmite. Ind. Eng. Chem. Res. 2020, 59, 12176–12185. [Google Scholar] [CrossRef]
- Tao, L.R.; You, Y.Y.; Liu, X.J. Numerical Studies of CO Separation and Enrichment from Blast Furnace Gas by Using a CuCl/Y Fixed Bed. Ironmak. Steelmak. 2021, 48, 1187–1199. [Google Scholar] [CrossRef]
- Dutta, N.N.; Patil, G.S. Developments in CO Separation. Gas Sep. Purif. 1995, 9, 277–283. [Google Scholar] [CrossRef]
- Kang, Y.; Liu, Y.; Liu, W.; Li, Y.; Sun, N.; Zhang, Q.; Li, Z.; Yang, X. Effect of Vacuum Process on Enrichment of Low-Concentration Coal Mine Methane by Adsorption. Separations 2025, 12, 56. [Google Scholar] [CrossRef]
- Zhu, L.; Tu, J.; Shi, Y. Separation of CO-CO2-N2 Gas Mixture for High-Purity CO by Pressure Swing Adsorption. Gas Sep. Purif. 1991, 5, 173–176. [Google Scholar] [CrossRef]
- Chen, Y.; Ning, P.; Xie, Y.; Chen, Y.; Sun, H.; Liu, Z. Pilot-Scale Experiment for Purification of CO from Industrial Tail Gases by Pressure Swing Adsorption. Chin. J. Chem. Eng. 2008, 16, 715–721. [Google Scholar] [CrossRef]
- Gao, F.; Wang, Y.; Wang, S. Selective Adsorption of CO on CuCl/Y Adsorbent Prepared Using CuCl2 as Precursor: Equilibrium and Thermodynamics. Chem. Eng. J. 2016, 290, 418–427. [Google Scholar] [CrossRef]
- Ko, K.-J.; Kim, H.; Cho, Y.-H.; Lee, H.; Kim, K.-M.; Lee, C.-H. Overview of Carbon Monoxide Adsorption Performance of Pristine and Modified Adsorbents. J. Chem. Eng. Data 2022, 67, 1599–1616. [Google Scholar] [CrossRef]
- Gao, F.; Wang, S.; Wang, W.; Duan, J.; Dong, J.; Chen, G. Adsorption Separation of CO from Syngas with CuCl@AC Adsorbent by a VPSA Process. RSC Adv. 2018, 8, 39362–39370. [Google Scholar] [CrossRef]
- Li, S.; Yang, H.; Zhang, D. Enrichment of CO from Syngas with Cu(I)Y Adsorbent by Five-Bed VPSA. Front. Chem. Sci. Eng. 2013, 7, 472–481. [Google Scholar] [CrossRef]
- Zhou, Y.; Shen, Y.; Fu, Q.; Zhang, D. CO Enrichment from Low-Concentration Syngas by a Layered-Bed VPSA Process. Ind. Eng. Chem. Res. 2017, 56, 6741–6754. [Google Scholar] [CrossRef]
- Oh, H.; Beum, H.T.; Lee, S.-Y.; Kim, J.; Kim, J.; Yun, Y.; Han, S.S. Bed Configurations in CO Vacuum Pressure Swing Adsorption Process for Basic Oxygen Furnace Gas Utilization: Experiment, Simulation, and Techno-Economic Analysis. Chem. Eng. J. 2023, 454, 140432. [Google Scholar] [CrossRef]
- Li, C.; Wang, J.; Wang, Z.; Dong, J.; Shi, Q. Understanding the Vacuum Autoreduction Behavior of Cu Species in CuCl/NaY Adsorbent for CO/N2 Separation. Microporous Mesoporous Mater. 2024, 365, 112904. [Google Scholar] [CrossRef]
- Yuan, M.; Liu, T.; Shi, Q.; Dong, J. Understanding the KOH Activation Mechanism of Zeolitic Imidazolate Framework-Derived Porous Carbon and Their Corresponding Furfural/Acetic Acid Adsorption Separation Performance. Chem. Eng. J. 2022, 428, 132016. [Google Scholar] [CrossRef]
- Cui, Y.; Su, W.; Xing, Y.; Hao, L.; Sun, Y.; Cai, Y. Experimental and Simulation Evaluation of CO2/CO Separation under Different Component Ratios in Blast Furnace Gas on Zeolites. Chem. Eng. J. 2023, 472, 144579. [Google Scholar] [CrossRef]
- Haghpanah, R.; Majumder, A.; Nilam, R.; Rajendran, A.; Farooq, S.; Karimi, I.A.; Amanullah, M. Multiobjective Optimization of a Four-Step Adsorption Process for Postcombustion CO2 Capture Via Finite Volume Simulation. Ind. Eng. Chem. Res. 2013, 52, 4249–4265. [Google Scholar] [CrossRef]
- Ergun, S. Fluid Flow through Packed Columns. Chem. Eng. Prog. 1952, 48, 89–94. [Google Scholar]
- Yu, C.; Guo, Z.; Yang, L.; Cui, J.; Chen, S.; Bo, Y.; Suo, X.; Gong, Q.; Zhang, S.; Cui, X.; et al. A Robust Metal-Organic Framework with Scalable Synthesis and Optimal Adsorption and Desorption for Energy-Efficient Ethylene Purification. Angew. Chem. Int. Ed. 2023, 62, e202218027. [Google Scholar] [CrossRef]
Disclaimer/Publisher’s Note: The statements, opinions and data contained in all publications are solely those of the individual author(s) and contributor(s) and not of MDPI and/or the editor(s). MDPI and/or the editor(s) disclaim responsibility for any injury to people or property resulting from any ideas, methods, instructions or products referred to in the content. |
© 2025 by the authors. Licensee MDPI, Basel, Switzerland. This article is an open access article distributed under the terms and conditions of the Creative Commons Attribution (CC BY) license (https://creativecommons.org/licenses/by/4.0/).