Article

Sustainable Soil Volatilome: Discrimination of Land Uses Through GC-MS-Identified Volatile Organic Compounds

by
Emoke Dalma Kovacs
1,
Teodor Rusu
2 and
Melinda Haydee Kovacs
1,*
1
Research Institute for Analytical Instrumentation, National Institute for Research and Development in Optoelectronics, INOE 2000, Donath 67, 400293 Cluj-Napoca, Romania
2
Department of Technical and Soil Sciences, Faculty of Agriculture, University of Agricultural Science and Veterinary Medicine of Cluj-Napoca, Calea Manastur 3-5, 400372 Cluj-Napoca, Romania
*
Author to whom correspondence should be addressed.
Separations 2025, 12(4), 92; https://doi.org/10.3390/separations12040092
Submission received: 7 March 2025 / Revised: 31 March 2025 / Accepted: 2 April 2025 / Published: 8 April 2025

Abstract

:
This study investigates soil volatilomics as an innovative approach to assessing the impact of land use on soil quality. This research addresses the critical need for sensitive diagnostic tools to distinguish subtle biochemical variations in soils influenced by different land use management practices. Soil samples were collected along a land use transect in Cluj County. Their volatile organic compounds were extracted by headspace solid-phase microextraction (HS–SPME) followed by a gas chromatography–mass spectrometry (GC–MS) analysis. A multivariate statistical method was used to differentiate the volatilome profile. Among the 106 detected compounds, oxygenated species dominated across all land uses, with the highest concentrations in forest soils (77%), followed by grasslands (71%) and agricultural soils (65%). Principal component analysis revealed distinct clustering patterns, with the first two components explaining 72.8% of the total variance (PC1: 41.7%, PC2: 31.1%). Supervised PLS-DA modeling demonstrated robust land use discrimination, achieving AUC values of 0.868 for agricultural versus forest comparisons and 0.810 for both forest versus grassland and grassland versus agricultural comparisons. The volatilome diversity analysis indicated that grasslands contained the highest number of distinct compounds (64), closely followed by forest soils (63), while agricultural soils showed reduced diversity (51). These key findings revealed distinct volatile signatures, with forest soils exhibiting the highest complexity and agricultural soils demonstrating a more homogeneous profile, whereas grassland soils presented high internal variability. These results underscore the potential of soil volatilome profiling as a sensitive indicator of the effects of land use on soil biochemical processes and support the utility of soil volatilomics in sustainable land management and ecosystem monitoring.

Graphical Abstract

1. Introduction

Land use is a key determinant of the quality and functionality of soil ecosystems. Diverse land management practices, including intensive agriculture, grazing regimes, and forest management, profoundly influence soil physicochemical properties and biogeochemical cycling [1], with consequences for microbial diversity and functionality [2]. For example, intensive agricultural practices characterized by frequent tillage, extensive agrochemical application, and monoculture cropping can lead to diminished soil organic matter [3], nutrient depletion [4], and altered microbial community structures [5]. In contrast, grassland systems managed through moderate grazing and natural vegetation regeneration tend to maintain relatively high levels of soil organic matter and microbial diversity [6,7], although the risk of overgrazing may induce soil compaction and further nutrient depletion [8]. Forest ecosystems, which benefit from a continuous supply of organic litter and complex root architectures, typically support enhanced organic carbon sequestration [9], improved soil structural stability [10], and robust nutrient cycling [11,12]. These different effects underscore the essential role of land use in shaping soil functionality and ensuring long-term ecosystem sustainability.
Recently, the soil volatilome has attracted attention as a highly sensitive indicator of the chemical and biological status of soils under various pressures [13,14]. Volatile substances arise from a range of biological processes, including organic matter degradation, nutrient turnover, and complex microbial metabolism [15]. First, they can be considered to be sensitive health indicators, reflecting complex biochemical and ecological interactions. Second, soil volatile organic compounds actively participate in nutrient cycling, microbial activity, and plant–microbe communication [12]. Characteristic volatile markers—such as terpenoids, short-chain alcohols, aldehydes, and volatile sulfur compounds—have been linked to key processes; for example, specific terpenoids correlate with fungal community dynamics and organic matter content, while alcohols and aldehydes may indicate active decompositions [14]. Recent advances in analytical chemistry have enabled the detailed characterization of soil volatilome profiles, enhancing our understanding of their role in soil quality [15]. A growing amount of evidence suggests that soils with superior ecological quality exhibit a richer and more diverse volatilome profile, mirroring the complex interplay of biodiversity components’ influences [15]. This richness in volatilome profile is increasingly recognized as a proxy for soil resilience and bioactivity [9]. In intensively managed agricultural soils, for example, the volatilome profile is often simplified because of reduced microbial complexity and altered metabolic processes [16]. In contrast, less disturbed systems such as natural grasslands [17] and forest soils [18] typically exhibit more complex volatilome profiles, reflecting stable microbial ecosystems and efficient biogeochemical cycles. These observations highlight the potential of volatile organic compound-based analyses to provide nuanced insights into soil health and ecosystem functions.
A significant challenge in soil volatilomics lies in the complexity of volatile profiles, which can include hundreds of distinct compounds spanning multiple chemical classes and concentration ranges [13]. This complexity is further amplified by the fact that soils from diverse land uses often have common volatile compounds but exhibit significantly different relative abundances or intensity patterns [14]. Such quantitative variations, rather than simple qualitative differences [19,20,21], may be crucial indicators of specific ecological processes or disturbances [14,22]. In addition, the multifunctional roles of various volatile organic compounds require a multidisciplinary approach to correlate soil volatilome profiles with traditional soil quality parameters. The complex nature of these profiles, characterized by both compositional diversity and intensity variations, requires sophisticated analytical strategies for their meaningful interpretation. State-of-the-art multivariate statistical techniques [23] and machine learning algorithms [24] have shown promise in analyzing these complex patterns, but rigorous validation remains essential to ensure that these models maintain biological interpretability. Furthermore, integrating volatilomics with other omics platforms complicates analytical strategies but is essential for delineating the mechanistic relationships between volatile emissions and key soil processes [25,26]. Establishing consensus protocols for data preprocessing, normalization, and quality control, especially for managing the qualitative and quantitative aspects of volatile profiles, is an indispensable step to strengthening volatilomics as a reliable tool for diagnosing soil health.
The present study aims to advance soil volatilomics as a diagnostic tool by leveraging high-dimensional analytical techniques and robust data integration methodologies. Specifically, our research objectives are twofold. First, the soil volatilome profiles along a land use transect are characterized and compared. We used agricultural, grassland, and forest ecosystems that are next to each other, thereby revealing unique volatile signatures indicative of distinct land use practices, with a focus on the presence and relative abundance of key volatile compounds. Second, the current challenges in volatilomics data interpretation can be overcome by developing and rigorously validating a multivariate statistical framework suitable for large datasets that can effectively capture qualitative and quantitative variations in volatilome profiles. This study elucidates the mechanistic links between land use and soil biochemical dynamics by integrating targeted analytical techniques with state-of-the-art data interpretation approaches. Ultimately, our findings are able to enhance the utility of volatilomics in sustainable land management and ecological monitoring, providing novel insights into the volatile-mediated interactions that govern soil functionality in the context of global environmental change.

2. Materials and Methods

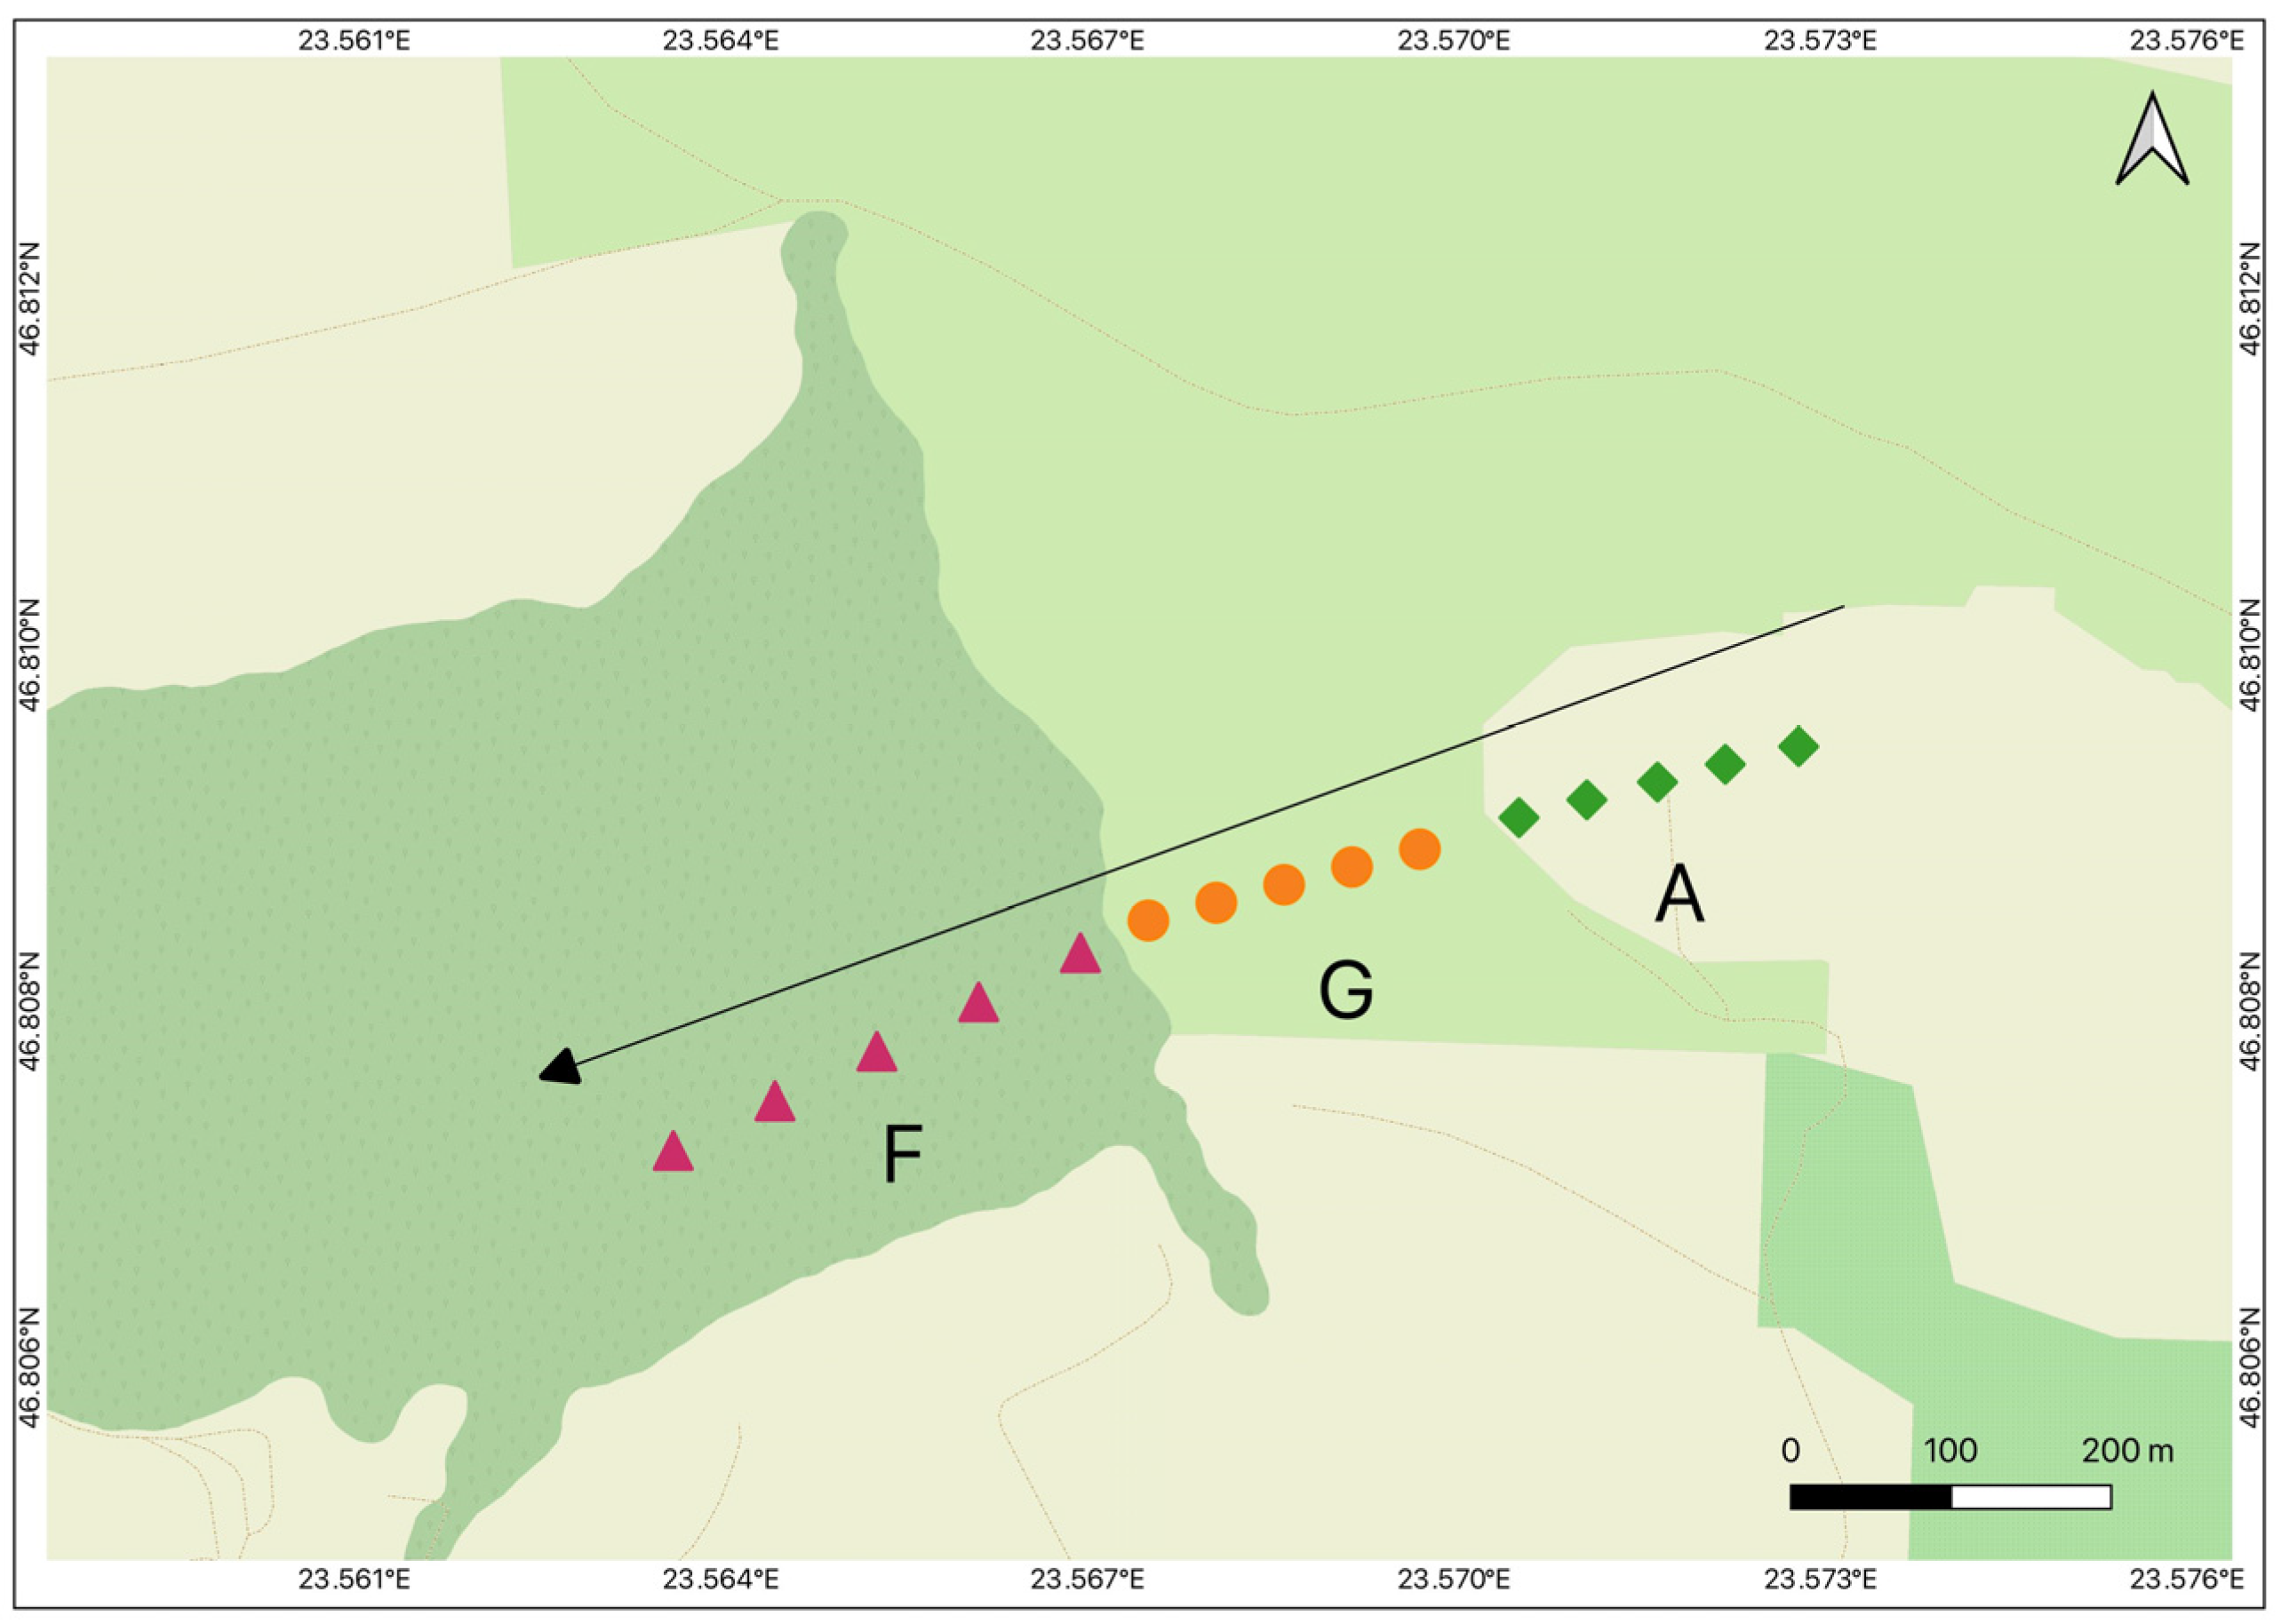
2.1. Sampling Design

Cambic chernozem soil samples with a clay–loam texture were collected from Cluj County, considering three land use transects (Figure 1): agriculture (A), grassland (G), and forest (F). Samples were taken in the first part of March 2023 from a 0–15 cm depth horizon after the removal of coarse debris and litter material. We selected March for sampling as it marks the onset of the growing season, when soil biodiversity reactivates post dormancy, capturing early biotic responses and the lingering effects of prior land management on the soil volatilome. For each sampling point, five samples were collected according to the Lucas methodology before being thoroughly mixed and treated as a single sample. The samples were placed in a sterile bag and kept refrigerated until arrival at the laboratory. The samples were stored at −20 °C until analysis, but for no longer than 30 days.

2.2. Soil Characteristics

The physicochemical characteristics of the sieved soil samples (mesh size < 2 mm) were determined. The soil texture was determined by the Jar test method [27]. The soil pH and extractable ion concentration were determined by Multi Ion 10 equipment (Imacimus, NT Sensors, El Catllar, Spain) using the methodology provided by the producer. The organic matter content was determined by the Walkley–Black method [28]. The results obtained are presented in Table S1.

2.3. HS-SPME-GC-MS Analysis of Soil Volatilome Profile

Five grams of sieved soil samples were placed in 20 mL headspace vials containing 1 mL of 20% saltwater (0.2 g NaCl/1 mL double-distilled water). The inclusion of salt in this step of the HS-SPME procedure facilitated the extraction of a complex array of compounds, ranging from polar to non-polar ones, with diverse physicochemical properties and varying vapor pressures. The headspace vials were sealed with crimp-top caps with PTFE-silicone headspace septa (Thermo Fisher Scientific, Waltham, MA, USA). The headspace vials were incubated at 45 °C for 30 min with the preconditioned (10 min at 45 °C) 1 cm length three-phase divinylbenzene/carboxen/poly-dimethylsiloxane (50 μm (DVB layer), 30 μm (CAR/PDMS layer)) extraction fiber. The captured volatile organic compounds were then thermally desorbed for 5 min onto the GC–MS (Trace GC 1310 TSQ 9000 MS, Thermo Fisher Scientific, Waltham, MA, USA) injection port, which was set at 250 °C in splitless mode. The volatile organic compounds were separated using a DB-WAX capillary column (30 m × 0.25 mm i.d. × 0.25 μm film thickness; J & W Scientific Inc., Folsom, CA, USA). Ultra-high-purity helium was used as the carrier gas at a linear velocity of 1 mL·min−1. The oven temperature program was as follows: an initial temperature of 35 °C, heated to 180 °C at a rate of 5 °C·min−1, increased to 230 °C at a rate of 15 °C·min−1, and then held there for 1 min. Mass spectra were recorded in electron impact (EI) ionization mode at 70 eV using a mass spectrometer (TSQ 9000 MS, ThermoFischer Scientific, Bremen, Germany). The quadrupole mass detector, ion source, and transfer line temperatures were set at 150, 230, and 280 °C, respectively. The mass spectra were scanned in the range of m/z 50–550 amu. VOCs were identified by comparing the mass spectra with the NIST 14 database system library and linear retention index. The criterion for compound identification was a mass-spectrum matching score of ≥80%. The results were expressed as a percentage of the relative peak area of a peak for each soil sample, which was calculated by dividing the peak area by the total peak area of all identified peaks in each chromatogram. Each sample’s total ion chromatogram (TIC) was used for peak-area integration.

2.4. Data Preprocessing and Data Pretreatment

Furthermore, the gas chromatography–mass spectrometry (GC–MS) data were processed using MS-DIAL software v.4., http://prime.psc.riken.jp/compms/msdial/main.html (accessed on 2 June 2024), following the procedure described by Lai et al. [29] and Oliveira et al. [30]. The analysis commenced with the upload of the .cdf MS files into the software. The processing parameters were set as follows: a mass range of 50–550 Da and a retention time window extending from 0 to 33 min; the analysis was performed using a single thread. Additionally, centroiding employs a mass slice width and a mass accuracy of 0.5 Da. For signal processing, a linear weighted moving average smoothing method was applied with a smoothing level of 3 scans, an average peak width of 10 scans, and a sigma window value of 0.5. An amplitude threshold of 10 was used as the electron ionization (EI) spectra cut-off.

2.5. Statistical Analysis

Statistical differences in soil properties among the three studied land uses (F, G, A) were assessed by nonparametric Kruskal–Wallis tests followed by Dunn’s test with Bonferroni adjustment for multiple comparisons (p < 0.05), implemented using the ‘dunn.test’, ‘tidyr’, and ‘dplyr’ packages in R software (version 4.3.2). Multivariate statistical analysis was performed using R software, with a principal component analysis (PCA) and hierarchical cluster analysis (HCA) implemented on the basis of Euclidian distances and Ward’s minimum variance method (ward.D2). The analysis was executed using the ‘factoextra’, ‘ggplot2’, and ‘dendextend’ packages, with confidence ellipses (95%) computed for PCA group discrimination. Partial least squares discriminant analysis (PLS-DA) and receiver operating characteristic (ROC) curve analysis were performed utilizing the ‘mixOmix’ and ‘mROC’ packages in R software. PLS-DA was applied to assess our ability to discriminate between the three land uses (F, G, A) by deriving latent variables (LVs) that optimize class separation on the basis of the soil volatilome profile. Model performance was further assessed by ROC curve analysis, where AUC values quantified model accuracy and robustness, confirming statistically significant separations. In addition, a VIP (Variable Importance Projection) score was calculated from the PLS-DA model to evaluate the contribution of each volatile organic compound (VOC) to class discrimination. VOCs with VIP scores exceeding 1 were considered significant as this threshold is widely recognized in the literature to indicate the variables that have a greater influence on the model than the average predictor.

3. Results

3.1. Soil Physicochemical Properties

To determine whether soil volatilome profiles can effectively distinguish between different land use types and their effects on soil functionality, we first examined variations in the general physicochemical properties of soil samples collected along the land-use transects.
According to the results obtained (Table 1), only the bulk density and the silt, potassium, chloride, and nitrate contents significantly differed between the land use types. Statistically significant differences were found between soils collected from agricultural (A) and forest (F) soils in terms of bulk density and nitrate content and between grassland (G) and agricultural (A) soils in terms of extractable potassium ions. Moderate differences were observed between the F and G soils in terms of bulk density, silt content, and extractable chloride ions and between the G and A soils in terms of silt and nitrate contents. Moderate differences in extractable potassium ions were observed only between A and F soils.

3.2. Soil Volatilome Profile

An HS-SPME/GC–MS system was used to acquire the chromatograms of the soil volatilome profiles from different land uses, i.e., forest (F), grassland (G), and agricultural land (A), as displayed in Figure 2. Analyzing this overview of representative total ion chromatograms (TICs) for each land use, it was possible to note peaks of higher intensity in the region of the first section of the TIC, with a retention time (tR) of 10 min, followed by the second section, which was between tR values of 10 and 20 min. In the last section, fewer peaks were obtained (tR) between 20 and 33 min (Table S2).
A total of 106 volatile compounds were detected in the samples from all land uses. These volatile organic compounds belong to different categories (Figure S1), such as hydrocarbons (alkane, alkene), oxygenated compounds (aldehyde, alcohol, acid, ketone, ester, ether), terpenoids (isoprene, monoterpenoid, sesquiterpenoid), and N- and S-containing compounds (including benzenoid).
The dominant compounds in the soil samples studied were oxygenated compounds, which accounted for more than 60% (Figure S1) of the total identified compounds. Higher intensities of oxygenated compounds were detected in the soil samples from forests (77%, Figure S1c), followed by those collected from grasslands (71%, Figure S1b) and those from agricultural land (65%, Figure S1a). Among the oxygenated compounds, alcohols were predominant (30–48), followed by ketones (14–16%). The hydrocarbon content varied from 11 to 16%, depending on land use, with relatively high values identified in the soil samples from agricultural land (Figure S1a). Among the terpenoid compounds, monoterpenes were the representative class (Figure S1).

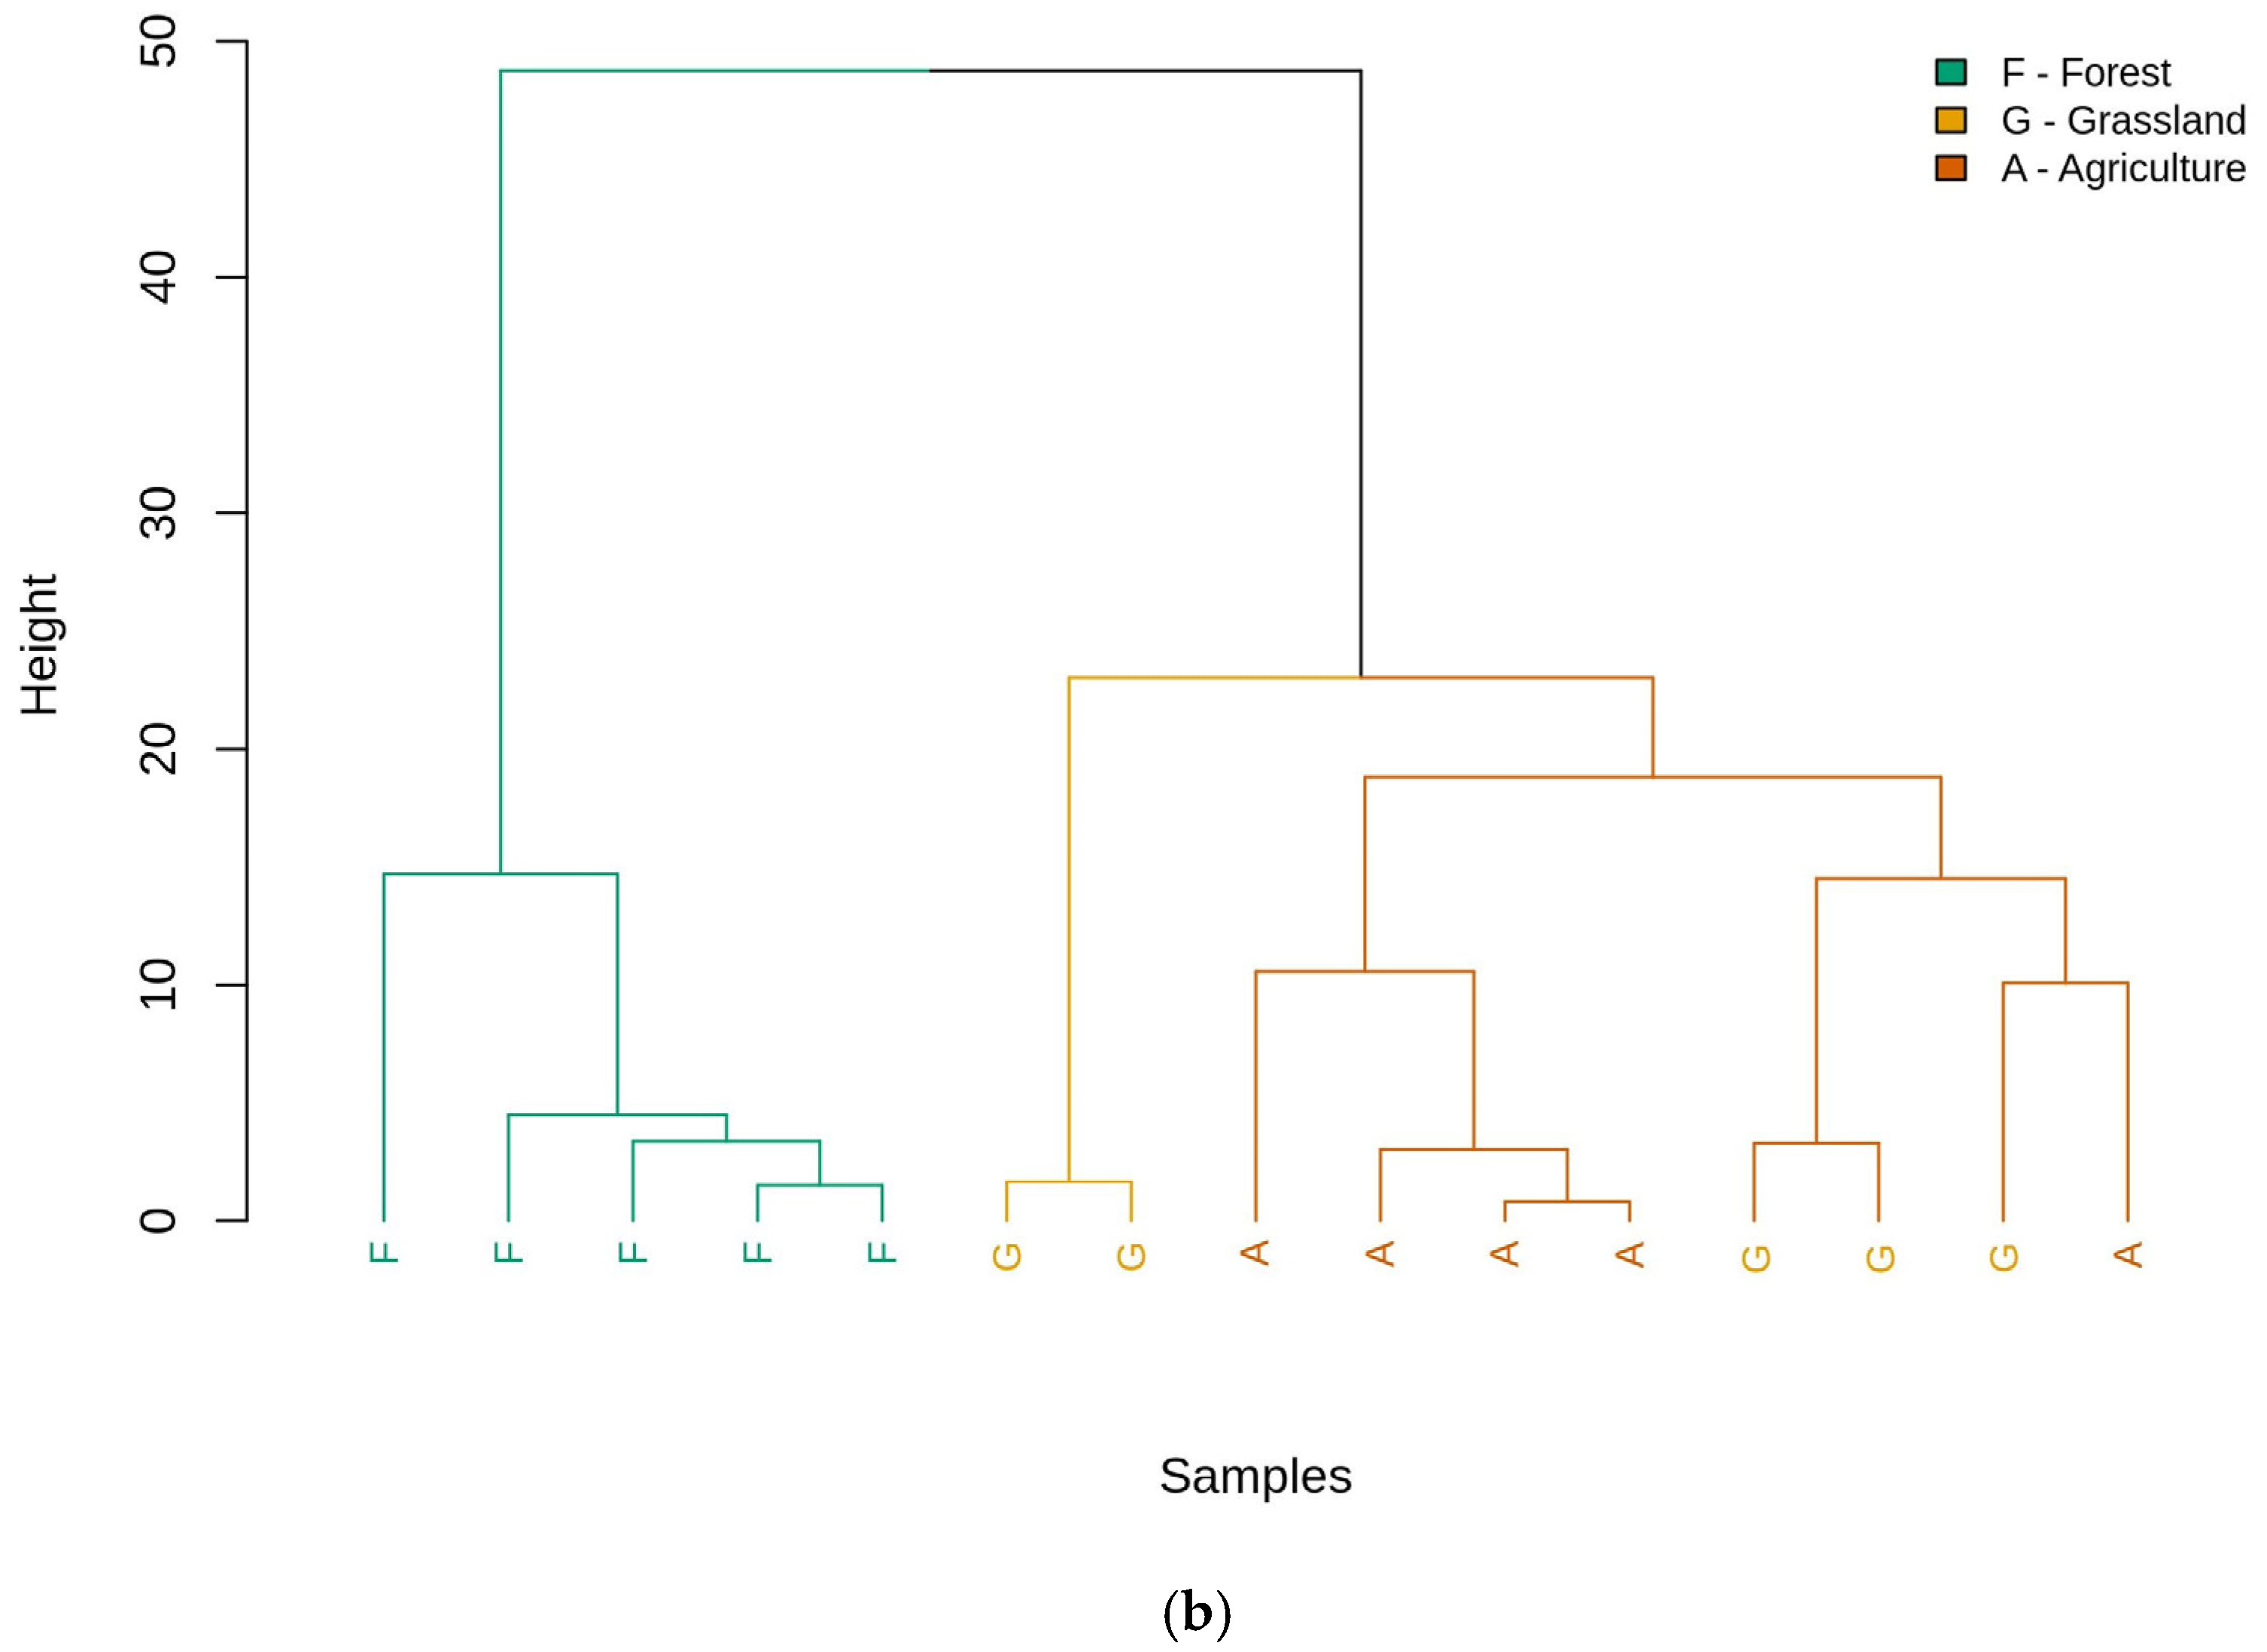
3.3. Exploratory Analysis

The application of statistical tools such as principal component analysis (PCA) and hierarchical clustering analysis (HCA) enabled the evaluation of similarities and differences in the volatilome profiles of the soil samples across the studied land use transects (Figure 3). The PCA plot (Figure 3a) highlights the compositional differences among the three land use types: forest (F), grassland (G), and agriculture (A). The first principal component (PC1) explained 41.7% of the variance, whereas the second principal component (PC2) accounted for 31.1%, with both together capturing 72.8% of the total variability in the dataset. The volatilome profiles of soil samples are distinct across land uses. Agricultural soils exhibit high internal similarity and unique compositional characteristics, whereas forest soils display moderate variability within their group. In contrast, grassland soils demonstrate greater internal variability than the other two land use soils do. The inclusion of 95% confidence ellipses reveals slight overlaps, suggesting that some compositional characteristics are shared among the groups while their overall distinctiveness is maintained.
The HCA dendrogram (Figure 3b) further corroborates these findings, showing the apparent clustering of samples by land use. Samples from the same land use category tend to cluster together, underscoring the significant influence of land use on their volatilome profiles. Forest soils form tight clusters, indicating high internal similarity within this category. Grassland soil also clusters together but exhibits slightly more significant variability. The agricultural samples formed distinct clusters that were clearly separate from those in the other two categories. The branch heights in the dendrogram reflect the level of dissimilarity between clusters, with shorter branches indicating more remarkable similarity. The PCA and HCA analyses provide robust evidence that land use significantly shapes the volatilome profiles, but distinct compositional characteristics were also observed for each land use type.

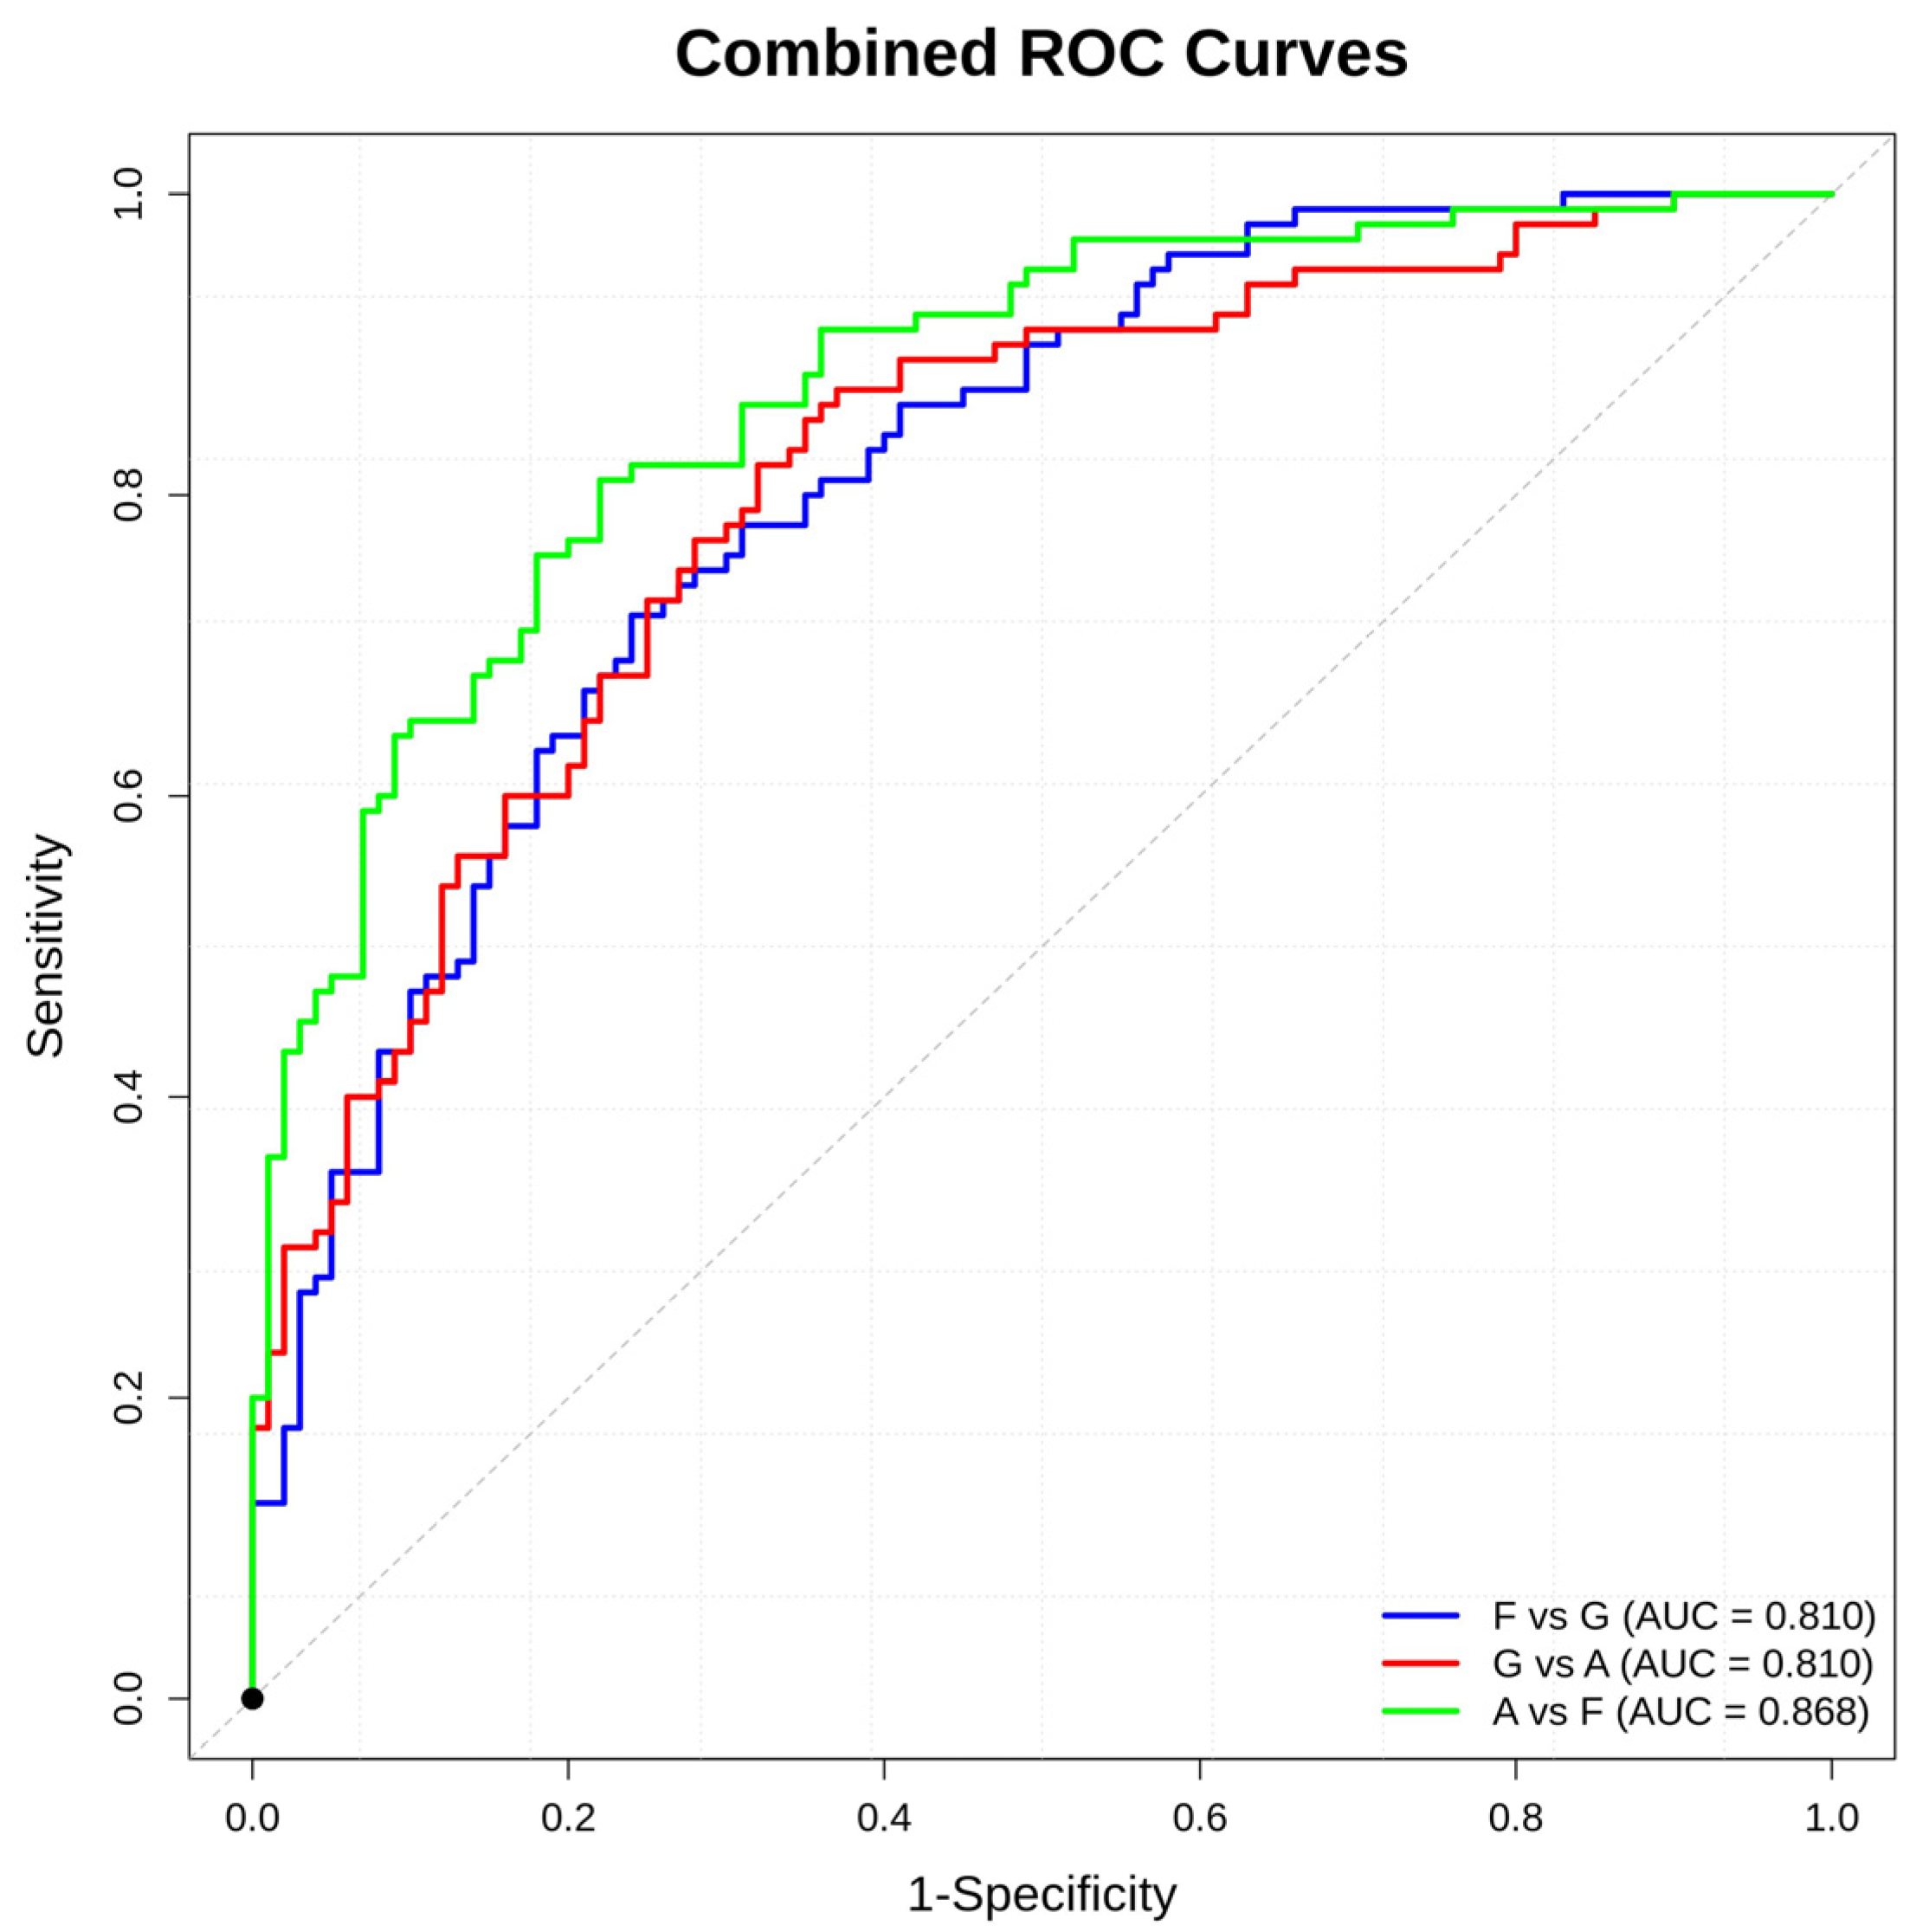
3.4. Supervised Analysis

The supervised analysis used a partial least squares discriminant analysis (PLS-DA) with two latent variables (LVs) to optimize discrimination and evaluate the differential volatile organic compound profiles of each land use type. The obtained PLS-DA models are presented in Figure S2, and the method’s performance after cross-validation is summarized in Table 2. The table includes the area under the curve (AUC) values, which quantify the classification performance of the models, and the sensitivity and specificity values, which further validate the models’ performance in distinguishing between the land use types.
Figure S2 shows the variance captured by the first two latent variables (LV1 and LV2) of the PLS-DA model, with LV 1 being the primary contributor to the discrimination between the land use types. Complete discrimination between forest (F), grassland (G), and agricultural (A) land use types was achieved by LV1 and LV2, which accounted for 77.7% (Figure S2a), 81.5% (Figure S2b), and 79.2% (Figure S2c) of the explained variance, respectively, without overlapping 95% confidence intervals. In all cases, LV1 was the primary contributor to the discrimination, with its highest contribution (73.2%, Figure S2c) observed for the discrimination between the volatilome profiles of the forest and agricultural soils.
The receiver operating characteristic (ROC) curves (Figure 4) complement the PLS-DA analysis by quantitatively evaluating the classification performance of the model. The AUC values for F vs. G (0.810), G vs. A (0.810), and A vs. F (0.868) confirm the model’s strong discriminatory ability. The analysis revealed that the classification model for A vs. F exhibited a superior performance, as indicated by an area under the curve (AUC) of 0.868. In contrast, the models for F vs. G and G vs. A both presented an AUC of 0.810. Although these values reflect a robust performance that significantly exceeds chance, they are marginally inferior to those of the A vs. F classifier. Furthermore, the ROC plot includes a reference diagonal line, representing a random classifier with an AUC of 0.5. The ROC curves’ deviation from the diagonal line of random classification underscores the model’s robustness in distinguishing between the land use types. The sensitivity and specificity values derived from these curves further validated the model’s performance (Table 2).
The fact that all the models significantly surpass this threshold confirms their effectiveness in discriminating between the different classes. The highest AUC values align with the clear separation observed in the PLS-DA plot. Notably, the A vs. F curve consistently maintains higher true positive rates over a range of false positive rates, emphasizing its optimal sensitivity–specificity balance under various threshold conditions.

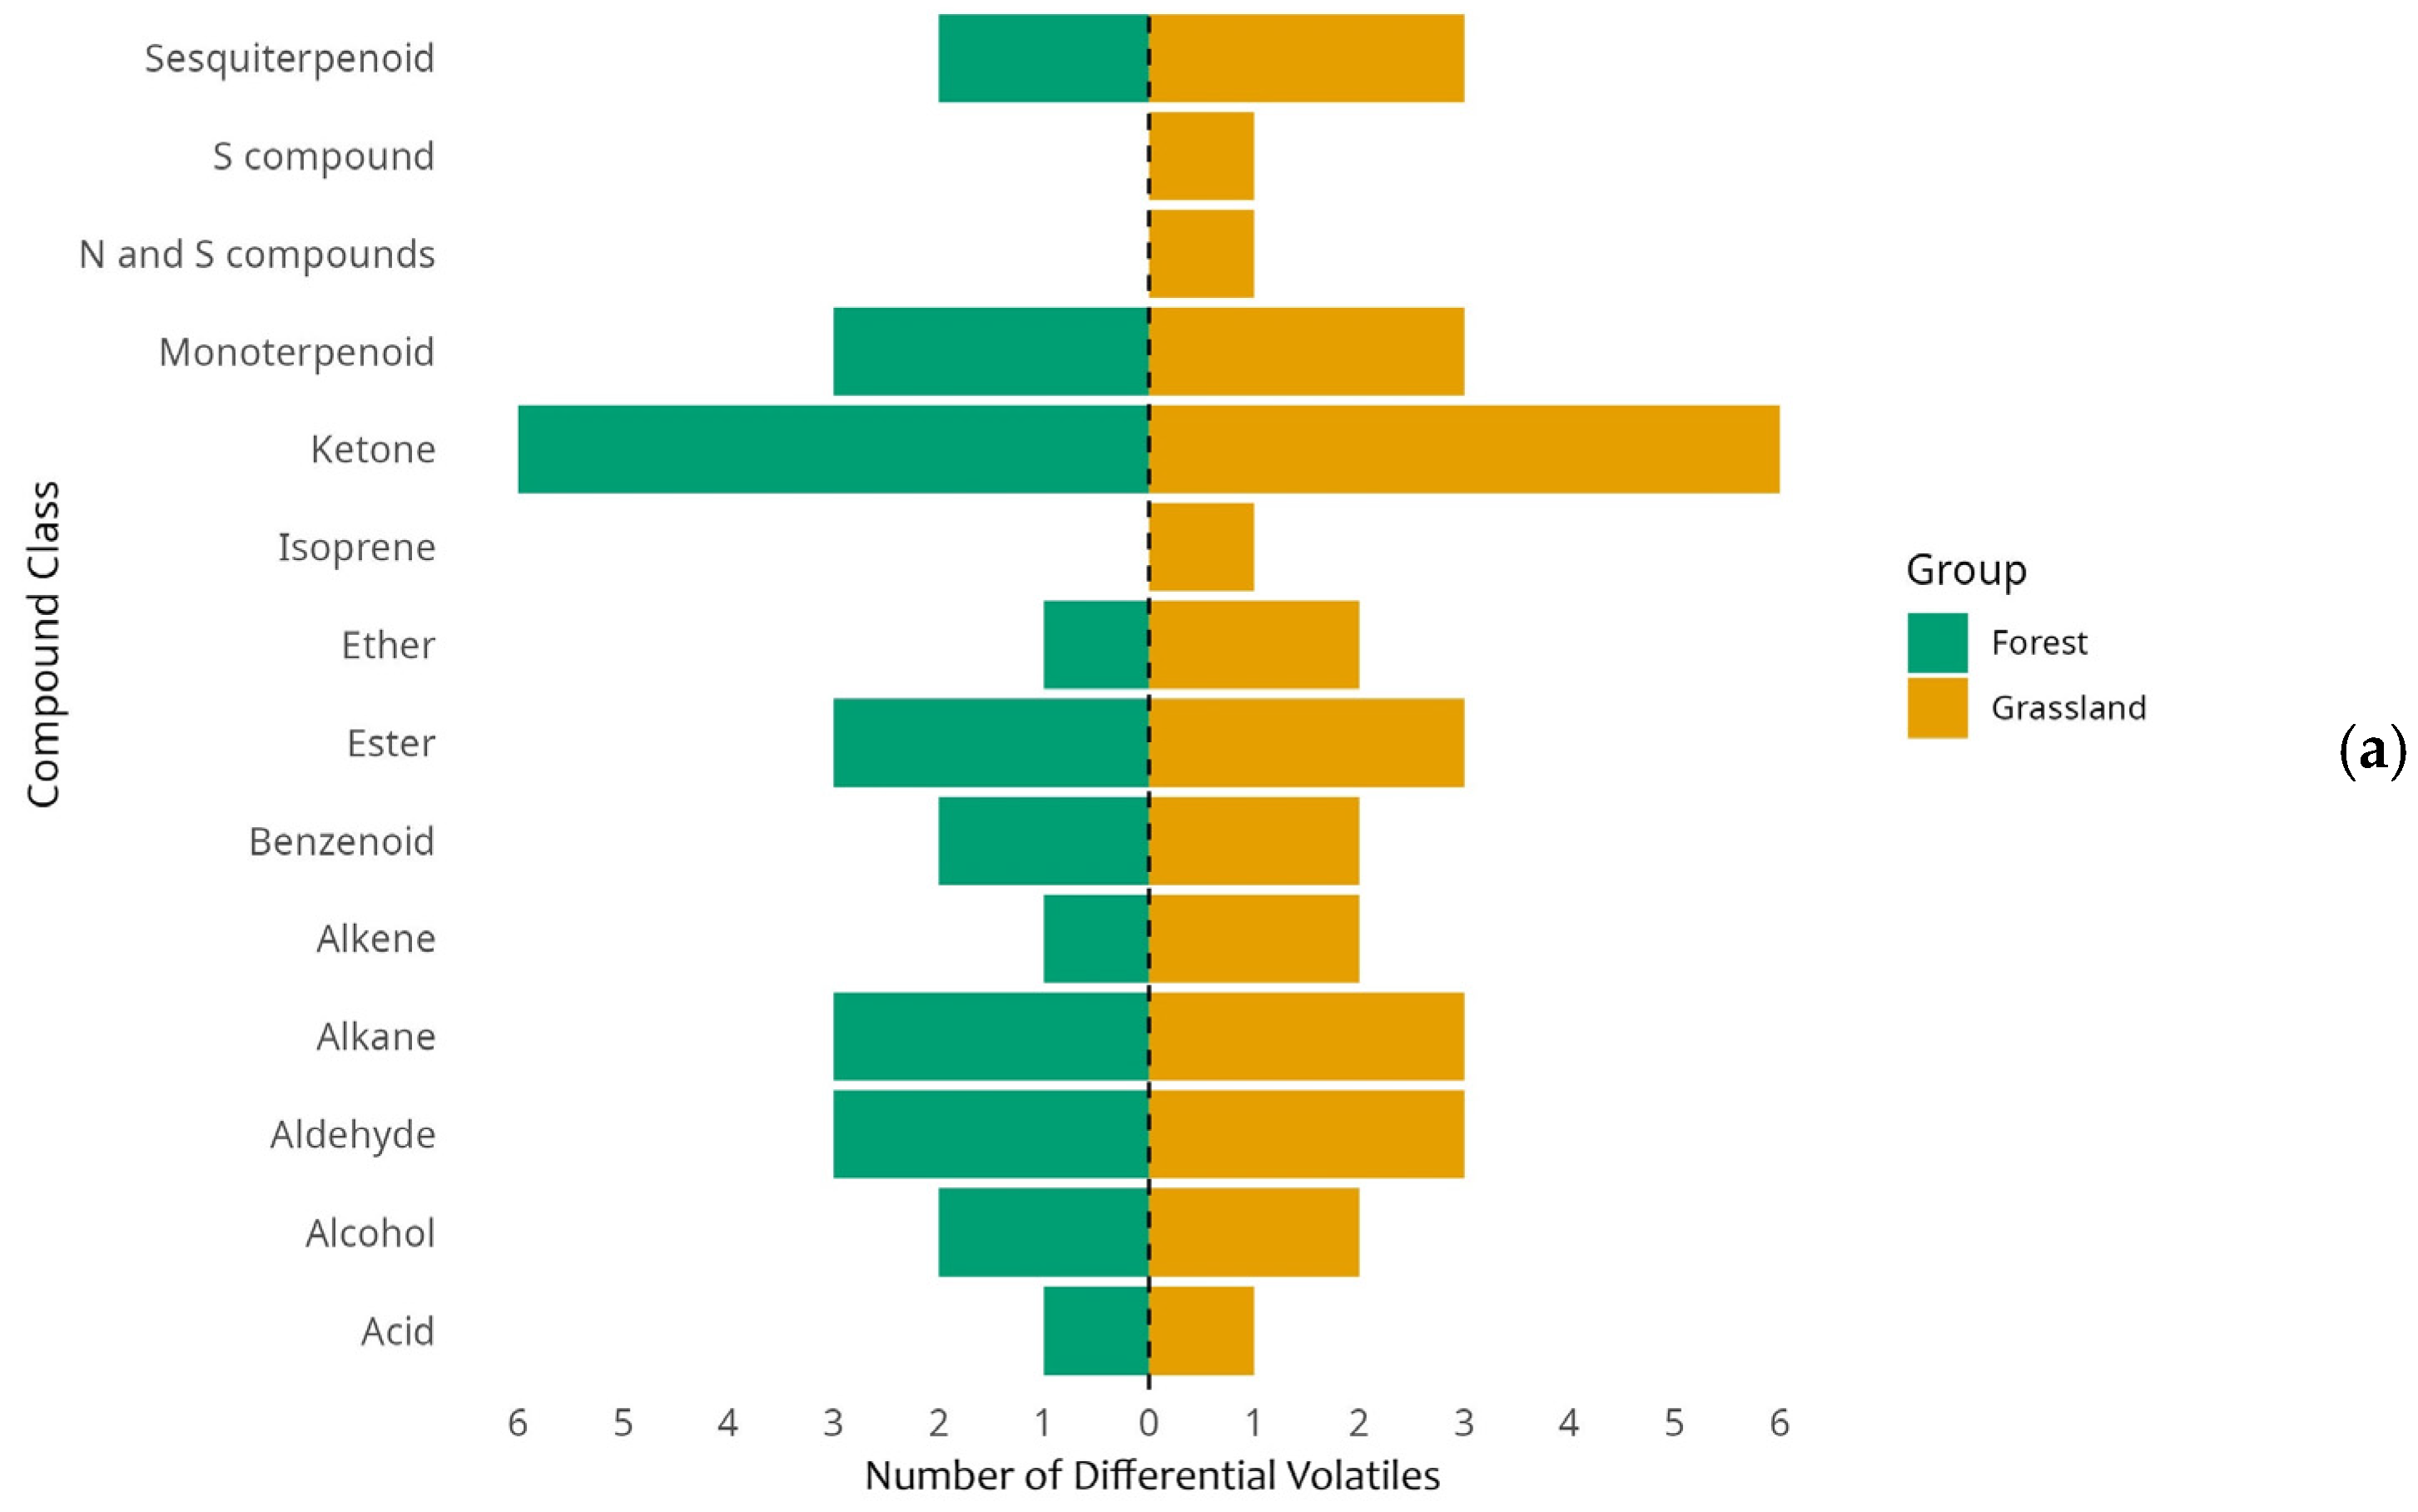
3.5. Differential Volatile Organic Compounds

The different volatile classes found belong to various classes of oxygenated compounds, hydrocarbons, terpenoids, and others (Figure 5). Through pairwise comparisons between different land uses, a greater number of differentiated volatiles were identified between the F and A soils (63 compounds in total, Figure 5a), followed by the F and G soils (60 compounds in total, Figure 5b) and the G and A soils (56 compounds in total, Figure 5c). The volatilome profile of the grassland soil differed the most, with a greater number of volatile organic compounds (a total of 64 compounds), followed by the forest soil (a total of 63 compounds) and the agricultural land soil (a total of 51 compounds).
The differential volatile organic compounds were obtained using two statistical criteria: a p-value from a t-test lower than 0.05 and the contribution of the variable importance to projection (VIP) score of LV1 from the PLS-DA model (Table S3). The VIP scores range from 1.09 to 1.41, and all reported p-values are consistent, reflecting a uniform threshold for statistical significance across the comparisons. The F vs. G comparison presented a mean VIP score of 1.24, with hexanal registering the highest VIP score (1.41). Benzaldehyde presented a VIP score of 1.24, followed by nonanal (VIP: 1.21), decanal (VIP: 1.18), and benzothiazole (VIP: 1.15). The compounds demonstrated a mean VIP score of 1.21 in the G vs. A comparison. Hexanal had a VIP score of 1.38, whereas the other compounds presented VIP scores ranging from 1.09 to 1.21. The A vs. F comparison yielded a mean VIP of 1.18.

4. Discussion

4.1. Soil Volatilomics in Decoding Complex Land Use-Specific Patterns

The current study presents a comprehensive investigation of soil volatilome profiles across a land use transect, offering new insights into the qualitative and quantitative variation in soil volatile organic compounds. Our results revealed differences in the soil volatilome profiles among forest, grassland, and agricultural soils (Figure 1 and Figure S1). The lack of significant differences in the physicochemical properties (Table 1) of the cambic chernozem soil samples suggests that land use influences the volatile organic compound profile. This finding aligns with data available from the literature, where differences in volatile organic compound content were observed in soils from various land uses and management practices [18,31]. Mu et al. [18] reported that shrublands have a higher content of volatile organic compounds in their soil than Mediterranean oak forests do by almost 65%. These authors linked these differences to the composition of the contrasting plant species in the two ecosystems. Another study that compared the soil volatilome profiles of an urban forest and other urban green areas in Thailand revealed that the forest had a greater biogenic origin and oxygenated volatile organic compound content than other urban green regions did [31]. Guo et al. [32] also reported the prevalence of oxygenated volatile organic compounds. In our study, the content of volatile organic compounds was more intense in forest soils than in the other two land uses (Figure 2). We determined the prevalence of oxygenated volatile organic compounds in the soils of all the studied land uses (65%—grassland; 71%—agricultural land; and 77%—forest). The predominant oxygenated volatile organic compounds in our study were alcohols, accounting for 30–48% of the total amount, followed by ketones, accounting for 14–16% of the total amount. These findings are in line with those reported by Mu [18] and Guo [32]. Although Pripdeevech [31] reported that alkanes were the dominant volatile organic compound class in forest soils, accounting for 44–47% of the total amount, in our study, the alkane content was less than 10%, with the greatest amount detected in soils from grasslands (8.5%, Figure S2). Studies in the literature have attributed differences in the profile and concentrations of volatile organic compounds mainly to seasonal variations [18,31] and vegetation cover [32]. However, management practices [16,19] and meteorological anomalies [21,33] have also been reported to influence the soil volatilome profile. In our study, although the profiles of volatile organic compounds differed (Figure 5), in most cases, these differences were predominantly quantitative (Figure S1). This result was similar to that reported by Boone et al. [14], who reported that the content of volatile organic compounds in soil is strongly affected by the intensity of soil management practices.
Li et al. [13] and Boone et al. [14] recommend the use of the soil volatilome profile as a biomarker that could provide insight into the ecological functions and mechanisms of microbiome–microbiome, microbiome–plant, plant–microbiome, and plant–plant interactions under various abiotic and biotic conditions. However, in our study, similar to other studies, the differences in the soil volatilome were predominantly quantitative (Figure S1). We employed a combination of exploratory, supervised, and differential analyses to unravel the dynamics of the soil volatilome profile in the land use transect. The unsupervised exploratory analysis, conducted through PCA and HCA (Figure 3), revealed distinct signature characteristics in the volatilome of each land use type. The volatile profiles of agricultural soils were highly consistent, suggesting that anthropogenic management practices may homogenize soil biochemical processes. This observation aligns with the findings of Al-Shammary et al. [34], who reported that agricultural management practices tend to standardize soil microbial communities and their metabolic outputs. Forest soils presented moderate internal variability, reflecting the natural heterogeneity of woodland ecosystems. This finding aligns with studies by Li et al. [35] and Baldrian [36], who demonstrated that the structural complexity of forest ecosystems promotes diverse microbial niches and, consequently, varied volatile signatures. The patterns observed in the grassland soils, which presented the greatest internal variability, align with the concept of the intermediate disturbance hypothesis, where moderate levels of disturbance promote greater biological diversity and metabolic variation [37]. The implementation of PLS-DA revealed robust discrimination between land use types, with particularly strong differentiation between agricultural and forest soils (AUC = 0.868). This marked separation suggests fundamental differences in biochemical processes and microbial communities between these contrasting ecosystems. The high explained variance (77.7–81.5%) achieved through the first two latent variables demonstrates the robust discriminatory power of soil volatilomes as indicators of land use change, supporting similar findings of Boone et al. [14] and Brown et al. [38] in their volatilomic and metabolomic studies of different land use and management practices. The intermediate discrimination observed between the grassland and other land uses (AUC = 0.810 for both F vs. G and G vs. A) suggests that grassland ecosystems may represent a transitional state between forest and agricultural systems in terms of their volatile profiles. This observation aligns with ecological succession theories and supports the findings of Schramski et al. [39] and Pascual-Garcia and Bell [40] regarding the intermediate nature of the metabolic signatures of grassland ecosystems.
The identification of different volatile organic compounds could provide insight into the biochemical adaptations associated with different land uses. The greater number of differential compounds between forest and agricultural soils (63 compounds, Figure 5) than between the other pairs reflects the contrasting natures of these ecosystems. This finding supports the works of Boone et al. [14], Gao et al. [41], and Bloor et al. [42], who demonstrated that land use intensification significantly alters soil metabolic networks. The prevalence of specific volatile compounds, such as hexanal, benzaldehyde, and nonanal, as key differentiators suggests their potential role as biomarkers of land use change. These compounds, which have high VIP scores in the PLS-DA models, may serve as indicators of specific soil processes or microbial activities. For example, the elevated levels of benzothiazole in agricultural soils align with previous studies by Zou et al. [43], who linked this compound to agricultural management practices and altered microbial communities. The observation that grassland soils harbor the greatest number of unique volatile organic compounds (64 compounds, Table S3) suggests that these ecosystems maintain distinct metabolic processes that may be crucial for ecosystem resilience. This finding aligns with recent work by Li et al. [13] on the role of soil volatile diversity in maintaining ecosystem stability.
The multi-analytical approach employed in this study reveals that soil volatilomes serve as sensitive indicators of the effects of land use on soil biochemical processes. The clear differentiation between land use types, particularly between agricultural and forest systems, suggests that human management significantly impacts soil metabolic networks. These findings have important implications for land use management and soil health monitoring, as volatile profiles could serve as early warning indicators of ecosystem changes. The results also highlight the potential of soil volatilomics in understanding ecosystem responses to land use changes, supporting the development of more sustainable land management practices. Future research should focus on understanding the temporal dynamics of these volatile signatures and their responses to specific management interventions, which could potentially lead to the development of volatile-based indicators for soil health assessment and monitoring.

4.2. Ecological Implications

Soil volatilomics has emerged as a potential diagnostic tool for comprehensive soil health assessments through the qualitative and quantitative characterization of volatile organic compound profiles in soil matrices [14]. The classical HS-SPME-GC–MS analytical approach, combined with exploratory, supervised, and differential analyses, enables the maximal separation of complex matrix classes, thereby elucidating the dynamic patterns of soil volatilome profiles across land use transects. This study helps us obtain insights into complex metabolic activities and ecosystem stability parameters, offering unprecedented resolution in monitoring soil biochemical processes. In diverse land use scenarios, distinct volatilome profiles manifest as unique molecular signatures, reflecting the intricate interplay between underlying biochemical pathways and microbial community dynamics [41]. These profiles serve as sensitive indicators of ecosystem functions, enabling the detection of subtle perturbations in soil metabolic networks [42]. The methodology’s high resolution allows for the capture of dynamic changes in soil biochemistry, providing crucial information about ecosystem responses to environmental stressors and anthropogenic influences.
Forest ecosystems consistently present rich and heterogeneous volatilome profile compositions characterized by complex molecular signatures that indicate robust microbial interactions and optimized nutrient cycling processes. This diversity in their volatile profiles is strongly correlated with elevated levels of ecosystem resilience and functional redundancy within soil microbial communities [9,11]. The intricate volatilome patterns observed in these natural systems serve as valuable reference points for assessing ecosystem health and stability. Conversely, soils under intensive agricultural management regimes typically present more uniform volatilome composition signatures, suggesting reduced microbial diversity and altered biochemical functionality [3,5]. This homogenization of volatile profiles often correlates with decreased ecosystem resilience and modified carbon cycling pathways, highlighting the potential of volatilomics in identifying early indicators of soil degradation and ecosystem stress [4].
The integration of volatilomics with complementary omics methodologies, including metabolomics, metagenomics, and proteomics, enables a comprehensive analysis of soil biochemistry [23]. This multiomics approach facilitates the elucidation of the complex relationships between metabolic processes and broader ecological outcomes, providing a mechanistic understanding of soil ecosystem dynamics [26]. This integrated analysis supports the development of precise, targeted interventions for ecosystem restoration and sustainable land management practices. Furthermore, this assessment tool’s capacity to differentiate between subtle variations in volatile organic compound profiles makes it an indispensable tool for monitoring soil health, guiding conservation efforts, and informing strategic environmental management policies.

4.3. Further Research Directions and Applications

In this study, we employed a transect approach across adjacent land use types within a geographically and ecologically uniform region. This controlled design was specifically implemented to rigorously evaluate the performance of our multivariate statistical framework under conditions where similar volatile organic compounds are present across sites, but their intensities differ. Our method was primarily assessed for its capacity to delineate land use types even when common volatile organic compounds vary quantitatively. However, we acknowledge that variations in geographical locations, broader ecological environments, and soil types may affect both the composition and intensity of the soil volatilome profile in other regions. Therefore, while our land use transect sampling design was appropriate for testing the method’s efficiency under controlled variability, the generalizability of our findings to more heterogenous regions may be limited. Future research should extend this methodological framework to diverse settings to further elucidate the impact of regional and environmental variability on soil volatilome profiles. Further, the designation of specific volatile markers as universal indicators of soil quality extends beyond our current methodological scope due to several inherent limitations. Our transect-based study, while optimized for validating a robust statistical framework across adjacent land use types, captures only a spatiotemporal snapshot of the soil volatilome profile. The compex, dynamic nature of the soil volatilome, where compounds serve multiple ecological functions and exhibit quantitative rather than qualitative variations, necessitates longitudinal studies across diverse ecosystems to establish reliable quality indicators. Furthermore, the potential influence of geographical, ecological, and pedological variations on the volatilome’s composition and intensity suggests that marker compound identification requires broader spatial replication. These limitations present opportunities for further research to employ our validated statistical framework in comprehensive temporal and spatial studies aimed at identifying and validating universal volatile markers of soil quality across heterogenous environments.
Future research should aim to integrate soil volatilomics using metagenomics, transcriptomics, and metabolomics to establish a comprehensive system-level understanding of soil biochemical networks. This integration would allow researchers to correlate specific volatile organic compounds with microbial gene expression profiles and metabolic pathways, thereby elucidating the mechanistic relationships between soil chemistry and microbial function. Combining these approaches makes it possible to develop predictive models that link soil management practices with alterations in ecosystem functionality, offering a more robust framework for tracking biogeochemical cycles and diagnosing ecological stress. Moreover, advancing soil volatilomics necessitates the development of high-resolution, time series, and spatial sampling methodologies. Such studies should focus on capturing dynamic changes in volatilome profile patterns across different soil depths and seasonal cycles. These investigations enhance our understanding of fluctuations in soil ecosystem processes under varying environmental conditions and management practices. This refined monitoring can facilitate the early detection of ecosystem disturbances and help delineate the spatial gradients of soil health, thereby supporting more precise land management and restoration strategies. Expanding the application of soil volatilomics to environmental impact assessments could significantly increase the detection and quantification of anthropogenic influences on soil systems. Investigations should explore how shifts in volatilome profiles correlate with broader ecological indices, such as nutrient cycling efficiency and carbon sequestration potential. By identifying specific volatile organic compounds as biomarkers associated with soil degradation or restoration, researchers and policymakers can implement early warning systems that facilitate proactive intervention strategies and guide sustainable land management practices. Future initiatives should focus on constructing predictive models that integrate volatilomic data with environmental variables and land use practices. These models simulate soil ecosystem responses to climate change, land management, and anthropogenic disturbances. The development of decision-support tools based on these models could provide stakeholders with actionable insights for optimizing soil health and mitigating adverse environmental impacts. This multidisciplinary approach, bridging advanced analytics with ecological theory, will translate volatilomics findings into practical applications for sustainable agricultural and environmental stewardship.

5. Conclusions

This study demonstrates the potential of soil volatilomics as a robust tool for elucidating the complex biochemical profiles associated with distinct land use practices. These findings reveal that despite homogeneous physicochemical soil properties, there is a pronounced divergence in the volatilome profiles of forest, grassland, and agricultural soils. Notably, forest soils presented markedly greater intensities of volatile organic compounds, which are predominantly oxygenated species such as alcohols and ketones, underscoring their dynamic metabolic milieu relative to that of managed lands. This study delineates precise and reproducible signatures that can effectively discriminate between different land use regimes through a comprehensive multianalytical approach that combines unsupervised exploratory methods (PCA and HCA) with supervised techniques (PLS-DA). The unsupervised techniques provided an unbiased view of the clustering of volatilome profiles. Moreover, the supervised PLS-DA confirmed and quantified these distinctions, highlighting particularly notable differences between various land uses. This duality of analysis reinforces the notion that the alterations observed are primarily quantitative, suggesting that shifts in metabolic activity rather than entirely novel compounds account for the differential patterns observed. The implications of these findings can be extended to sustainable ecosystem management and environmental monitoring. The sensitivity of soil volatilomics to anthropogenic interventions positions it as a compelling early warning system for tracking subtle yet critical shifts in ecosystem function. Moreover, integrating volatilomics data with other omics methodologies holds promise for providing a more nuanced understanding of soil biochemical networks and their interactions with ecological processes. Such comprehensive insights are essential for developing targeted strategies that mitigate the potential adverse impacts of land use changes while promoting soil health and ecosystem resilience. Therefore, this investigation positions soil volatilomics at the forefront of environmental biochemistry. This study provides a novel perspective on the effects of land use on soil metabolism and a foundation for future research aimed at decoding the biochemical underpinnings of soil ecosystem dynamics in response to both natural and anthropogenic drivers.

Supplementary Materials

The following supporting information can be downloaded at https://www.mdpi.com/article/10.3390/separations12040092/s1, Figure S1: Variation in the volatile organic compounds’ classes in soil samples along a land use transect; Figure S2: PLS-DA score plots for the discrimination between land uses—(a) F vs. G; (b) G vs. A; (c) A vs. F; Table S1: Summary statistics of soil physicochemical properties by land use type; Table S2: Soil volatilome profile components identification and confirmation. Table S3. Differential volatilome profiles after pairwise comparisons and their variable importance to projection (VIP) scores from PLS-DA model and p-values from t-test. References [44,45,46,47,48] are cited in the supplementary materials.

Author Contributions

Conceptualization, M.H.K. and E.D.K.; methodology, E.D.K.; software, E.D.K.; validation, M.H.K. and E.D.K.; formal analysis, T.R.; writing—original draft preparation, E.D.K.; writing—review and editing, T.R.; visualization, T.R.; supervision, M.H.K.; All authors have read and agreed to the published version of the manuscript.

Funding

This research was funded by the Ministry of Research, Innovation and Digitization through Program 1—Development of the national research & development system, Subprogram 1.2—Institutional Performance—Projects that finance RDI excellence, Contract No. 18PFE/30.12.2021, and the APC was provided by MDPI (Multidisciplinary Digital Publishing Institute).

Data Availability Statement

Data are available on request.

Conflicts of Interest

The authors declare no conflicts of interest.

References

  1. Plassart, P.; Prevost-Boure, N.C.; Dequiedt, S.; Stone, D.; Creamer, R.; Griffiths, R.I.; Bailey, M.J.; Lemanceau, P. Soil parameters, land use, and geographical distance drive soil bacterial communities along a European transect. Sci. Rep. 2019, 9, 605. [Google Scholar]
  2. Burton, V.J.; Contu, S.; De Palma, A.; Hill, S.L.L.; Albrecht, H.; Bone, J.S.; Carpenter, D.; Corstanje, R.; De Smedt, P.; Farrell, M.; et al. Land use and soil characteristics affect soil organisms differently from above-ground assemblages. BMC Ecol. Evol. 2022, 22, 135. [Google Scholar]
  3. Igor, B.; Telak, L.J.; Pereira, P. Agriculture Management Impacts on Soil Properties and Hydrological Response in Istria (Croatia). Agronomy 2020, 10, 282. [Google Scholar] [CrossRef]
  4. Li, T.; Ciu, L.; Filipovic, V.; Tang, C.; Lai, Y.; Wehr, B.; Song, X.; Chapman, S.; Liu, H.; Dalal, R.C.; et al. From soil health to agricultural productivity: The critical role of soil constraint management. Catena 2025, 250, 108776. [Google Scholar]
  5. Gorska, E.B.; Stepien, W.; Hewelke, E.; Lata, J.C.; Gworek, B.; Gozdowski, D.; Sas-Paszt, L.; Bazot, S.; Lisek, A.; Gradowski, M.; et al. Response of soil microbiota to various soil management practices in 100-year-old agriculture field and identification of potential bacterial ecological indicator. Ecol. Indic. 2024, 158, 111545. [Google Scholar]
  6. Liu, Y.; Zhang, M.; Wang, X.; Wang, C. The impact of different grazing intensity and management measures on soil organic carbon density in Zhangye grassland. Sci. Rep. 2024, 14, 17556. [Google Scholar]
  7. Teague, R.; Kreuter, U. Managing grazing to restore soil health ecosystem function, and ecosystem services. Front. Sustain. Food Syst. 2020, 4, 534187. [Google Scholar]
  8. Yang, Z.; Miao, P.; Zheng, Y.; Guo, J. Impacts of grazing on vegetation and soil physicochemical properties in northern Yinshan Mountain grasslands. Sustainability 2023, 15, 16028. [Google Scholar] [CrossRef]
  9. Zhang, Y.; Tang, Z.; You, Y.; Guo, X.; Wu, C.; Liu, S.; Sun, O.J. Differential effects of forest-floor litter and roots on soil organic carbon formation in a temperate oak forest. Soil. Biol. Biochem. 2023, 180, 109017. [Google Scholar]
  10. Zhao, X.; Tian, P.; Wang, Q. Roots have greater effects on the accumulation of soil microbial residue carbon in microaggregate fractions than leaf litter in a subtropical forest. Geoderma 2024, 442, 116803. [Google Scholar]
  11. Zhu, L.; Huang, R.; Guan, H.; Wang, J.; Huang, Z.; Fang, H.; Zou, X.; Li, J.; Liu, P. Litter, root, and mycorrhiza manipulations and seasonal effects on soil physicochemical properties and microbial communities in a subtropical coniferous and broad-leaved mixed forest. Appl. Soil. Ecol. 2024, 204, 105721. [Google Scholar] [CrossRef]
  12. Swiatek, B.; Pietrzykowski, M. Impact of Leaf Litter and Fine Roots in the Pool of Carbon, Nitrogen and Phosphorus Accumulated in Soil in Various Scenarios of Regeneration and Reconstruction of Forest Ecosystems. Forests 2022, 13, 1207. [Google Scholar] [CrossRef]
  13. Li, F.; Gao, W.; Lin, Y.; Liu, J.; Su, Y.; Zhang, Y.; Cai, K. Soil volatile organic compounds: Source-sink, function, mechanism, detection, and application analysis in environmental ecology. TrAC Trends Anal. Chem. 2025, 184, 118125. [Google Scholar] [CrossRef]
  14. Boone, R.W.C.; Meurs, J.; Rinnan, R.; de Caluwe, H.; Wakely, A.A.; Takke, J.W.C.; Cristescu, S.M.; Van der Putten, W.; de Kroon, H.; Robroek, B.J.M. Microbial scents: Soil microbial Volatile Organic Compounds (mVOCs) as biomarkers for grasslands across a land use gradient. Soil. Biol. Biochem. 2025, 204, 109749. [Google Scholar] [CrossRef]
  15. Honeker, L.K.; Graves, K.R.; Tfaily, M.M.; Krechmer, J.E.; Meredith, L.K. The Volatilome: A Vital Piece of the Complete Soil Metabolome. Front. Environ. Sci. 2021, 9, 649905. [Google Scholar] [CrossRef]
  16. Baloch, F.B.; Zeng, N.; Gong, H.; Zhang, Z.; Zhang, N.; Baloch, S.B.; Ali, S.; Li, B. Rhizobacterial volatile organic compounds: Implications for agricultural ecosystems’ nutrient cycling and soil health. Heliyon 2024, 10, e40522. [Google Scholar] [CrossRef]
  17. Wang, L.; Lun, X.; Wu, J.; Wang, Q.; Tao, J.; Dou, X.; Zhang, Z. Investigation of biogenic volatile organic compounds emissions in the Qinghai-Tibetan Plateau. Sci. Total Environ. 2023, 902, 165877. [Google Scholar] [CrossRef]
  18. Mu, Z.; Asensio, D.; Llusia, J.; Filella, I.; Ogaya, R.; Yi, Z.; Penuelas, J. Annual and seasonal variations in soil volatile organic compound concentrations in a Mediterranean shrubland and holm oak forest. Geoderma 2022, 405, 115401. [Google Scholar] [CrossRef]
  19. Yang, K.; Llusia, J.; Preece, C.; Ogaya, R.; Tur, L.M.; Mu, Z.; Chengming, Y.; Xu, Z.; Tan Yu Penuelas, J. Impacts of seasonality, drought, nitrogen fertilization, and litter on soil fluxes of biogenic volatile organic compounds in a Mediterranean forest. Sci. Total Environ. 2024, 906, 167354. [Google Scholar] [CrossRef]
  20. Leff, J.W.; Fierer, N. Volatile organic compound (VOC) emissions from soil and litter samples. Soil. Biol. Biochem. 2008, 40, 1629–1636. [Google Scholar] [CrossRef]
  21. Legros, T.; Temime-Roussel, B.; Kammer, J.; Quivet, E.; Wortham, H.; Reiter, I.M.; Santonja, M.; Fernandez, C.; Ormeno, E. Decline of soil volatile organic compounds from a Mediterranean deciduous forest under a future drier climate. Atmos. Environ. 2025, 340, 120909. [Google Scholar]
  22. Brown, R.W.; Bull, I.D.; Journeaux, T.; Chadwick, D.R.; Jones, D.L. Volatile organic compounds (VOCs) allow sensitive differentiation of biological soil quality. Soil. Biol. Biochem. 2021, 156, 108187. [Google Scholar]
  23. Parastar, H.; Weller, P. Benchtop volatilomics supercharged: How machine learning based design of experiment helps optimizing untargeted GC-IMS gas phase metabolomics. Talanta 2024, 272, 125788. [Google Scholar] [CrossRef] [PubMed]
  24. Skawinski, M.; Van Schooten, F.J.; Smolinska, S. A comprehensive guide to volatolomics data analysis. J. Breath Res. 2025, 19, 015001. [Google Scholar]
  25. Yuan, Z.; Liu, Q.; Mo, L.; Pang, Z.; Hu, C. Integrating the Soil Microbiota and Metabolome Reveals the Mechanism through Which Controlled Release Fertilizer Affects Sugarcane Growth. Int. J. Mol. Sci. 2023, 24, 14086. [Google Scholar] [CrossRef]
  26. Song, Y.; Yao, S.; Li, X.; Wang, T.; Jiang, X.; Bolan, N.; Warren, C.R.; Northen, T.R.; Chang, S.X. Soil metabolomics: Deciphering underground metabolic webs in terrestrial ecosystems. Eco-Environ. Health 2024, 3, 227–237. [Google Scholar]
  27. Sitton, J.D.; Story, B.A. Estimating soil classification via quantitative and qualitative field testing for use in constructing compressed earth blocks. Procedia Eng. 2016, 145, 860–867. [Google Scholar]
  28. Chen, Y.C.; Vowles, P.D.; McTainsh, G.H.; Simpson, R.W.; Cohen, D.D.; Bailey, G.M. Use of a modified Walkley-Black method to determine the organic and elemental carbon content of urban aerosols collected on glass fibre filters. Chemosphere 1995, 31, 4403–4411. [Google Scholar]
  29. Lai, Z.; Wohlgemuth, G.; Mehta, S.; Mueller, M.; Zheng, Y.; Ogiwara, A.; Meissen, J.; Showalter, M.; Takeuchi, K.; Kind, T.; et al. Identifying metabolites by integrating metabolome databases with mass spectrometry chemoinformatics. Nat. Methods 2018, 15, 53–56. [Google Scholar] [CrossRef]
  30. Oliveira, L.F.C.; Pereira, T.F.D.; Matos, T.S.; Sayawa, A.C.H.F.; Sussulini, A. Sustainable food metabolome: Discrimination of agroecological, organic, and conventional pinto beans (Phaseolus vulgaris L.) through the volatile organic compounds profile. Microchem. J. 2024, 200, 110374. [Google Scholar]
  31. Pripdeevech, P.; Janta, R.; Sripahco, T.; Meesang, W.; Aiyathiti, C.; Prabamroong, T.; Mahatheeranont, S.; Poshyachind, S.; Pongpiachan, S.; Khruengsai, S. Seasonal volatile organic compound dynamics in urban and forest environments in Thailand: Implications for air quality and secondary pollutants. Environ. Pollut. 2025, 365, 125565. [Google Scholar] [CrossRef] [PubMed]
  32. Guo, S.; Ye, C.; Lin, W.; Chen, Y.; Zeng, L.; Yu, X.; Cui, J.; Zhang, C. Volatile organic compounds at a highland forest site in the southeast of the Tibetan Plateau: Source apportionment and reactivity contributions. Environ. Pollut. 2025, 366, 125410. [Google Scholar] [CrossRef] [PubMed]
  33. Pugliese, G.; Ingrisch, J.; Meredith, L.K.; Pfannerstill, E.Y.; Klupfel, T.; Meeran, K.; Byron, J.; Purser, J.; Gil-Loaiza, J.; Haren, J.; et al. Effects of drought and recovery on soil volatile organic compound fluxes in an experimental rainforest. Nat. Commun. 2023, 14, 5064. [Google Scholar] [CrossRef] [PubMed]
  34. Al-Shammary, A.A.G.; Al-Shihmani, L.S.; Fernandez-Galvez, J.; Caballero-Calvo, A. Optimizing sustainable agriculture: A comprehensive review of agronomic practices and their impacts on soil attributes. J. Environ. Manag. 2024, 364, 121487. [Google Scholar] [CrossRef]
  35. Li, F.; Zi, H.; Sonne, C.; Li, X. Microbiome sustains forest ecosystem functions across hierarchical scales. Eco-Environ. Health 2023, 2, 24–31. [Google Scholar] [CrossRef]
  36. Baldrian, P. Forest microbiome: Diversity, complexity and dynamics. FEMS Microbiol. Rev. 2017, 41, 109–130. [Google Scholar] [CrossRef]
  37. Chen, Z.; Wu, S.; Du, J.; Pan, H.; Lu, X.; Liu, Y.; Yang, L. Variations in the Diversity and Biomass of Soil Bacteria and Fungi under Different Fire Disturbances in the Taiga Forests of Northeastern China. Forests 2023, 14, 2063. [Google Scholar] [CrossRef]
  38. Brown, R.E.; Chadwick, D.R.; Zang, H.; Jones, D.L. Use of metabolomics to quantify changes in soil microbial function in response to fertiliser nitrogen supply and extreme drought. Soil Biol. Biochem. 2021, 160, 108351. [Google Scholar] [CrossRef]
  39. Schramski, J.R.; Dell, A.I.; Grady, J.M.; Silby, R.M.; Brown, J.H. Metabolic theory predicts whole-ecosystem properties. Proc. Natl. Acad. Sci. USA 2015, 112, 2617–2622. [Google Scholar] [CrossRef]
  40. Pascual-Garcia, A.; Bell, T. Community-level signatures of ecological succession in natural bacterial communities. Nat. Commun. 2020, 11, 2386. [Google Scholar] [CrossRef]
  41. Gao, G.; Hannula, E.S.; Bodegom, P.M.; Bezemer, T.M.; Vries, T.F.; Hassink, J.; Zandt, M.H.; Moinet, G.Y.K. Land use intensity differently affects soil microbial functional communities in arable fields. Appl. Soil Ecol. 2024, 204, 105723. [Google Scholar]
  42. Bloor, J.M.G.; Si-Moussi, S.; Taberlet, P.; Carrere, P.; Hedde, M. Analysis of complex trophic networks reveals the signature of land-use intensification on soil communities in agroecosystems. Sci. Rep. 2021, 11, 18260. [Google Scholar]
  43. Zou, Y.; Zhang, Y.; Liu, X.; Song, H.; Cai, Q.; Wang, S.; Yi, C.; Chen, J. Research progress of benzothiazole and benzoxazole derivatives in the discovery of agricultural chemicals. Int. J. Mol. Sci. 2023, 24, 10807. [Google Scholar] [CrossRef] [PubMed]
  44. Dossin, E.; Elyette, M.; Pierrick, D.; Castellon, A.; Monge, A.; Pospisil, P. Prediction Models of Retention Indices for Increased Confidence in Structural Elucidation during Complex Matrix Analysis: Application to Gas Chromatography Coupled with High-Resolution Mass Spectrometry. Anal. Chem. 2016, 88, 7539–7547. [Google Scholar] [CrossRef]
  45. Bianchi, F.; Careri, M.; Mangia, A.; Musci, M. Retention indices in the analysis of food aroma volatile compounds in temperature-programmed gas chromatography: Database creation and evaluation of precision and robustness. J. Sep. Sci. 2007, 30, 563–572. [Google Scholar] [CrossRef]
  46. Battaloglu, R.; Yagiz, F. Determination of Essential Oils Components of Maclura pomifera (Osage Orange) Fruit from Turkey. Int. J. Sec. Metab. 2017, 4, 459–462. [Google Scholar]
  47. Belhassan, A.; Chtita, S.; Lakhlifi, T.; Bouachrine, M. QSRR study of linear retention indices for volatile compounds using statistical methods. Chem. Sci. Trans. 2018, 7, 558–575. [Google Scholar]
  48. Fidelis, C.; Sampaio, P.; Krainavic, P.; Augusto, F.; Barata, L. Correlation between maturity of tree and GC × GC–qMS chemical profiles of essential oil from leaves of Aniba rosaeodora Ducke. Microchem. J. 2013, 109, 73–77. [Google Scholar] [CrossRef]
Figure 1. Map of the sampling points along a land use transect. F—forest; G—grassland; A—agricultural land.
Separations 12 00092 g001
Figure 2. GC–MS analysis provided staked TICs of the soil volatilome profile within the three land uses.
Separations 12 00092 g002
Figure 3. Soil volatilome profile discrimination across a land use transect. (a) PCA score plot; (b) HCA dendrogram. F means forest, G means grassland, and A means agricultural land.
Separations 12 00092 g003aSeparations 12 00092 g003b
Figure 4. Receiver operating characteristic (ROC) tests for the PLS-DA models considering F vs. G; G vs. A; and A vs. F.
Separations 12 00092 g004
Figure 5. Number of differential volatile organic compounds found in each comparison. (a) Forest vs. grassland; (b) grassland vs. agriculture; (c) agriculture vs. forest.
Separations 12 00092 g005aSeparations 12 00092 g005b
Table 1. Kruskal–Wallis test results and Dunn’s post hoc analysis of soil properties across different land uses.
Soil PropertiesKW TestPost Hoc
χ2pSignificance 1F-GG-AA-F
Bulk density
(g cm−3)
10.020.007**p = 0.035 *nsp = 0.003 **
Texture
(%)
Silt8.740.013*p = 0.024 *p = 0.011 *ns
Clay1.390.5nsnsnsns
Sand3.370.185nsnsnsns
pH3.40.183nsnsnsns
OC (%)5.060.08nsnsnsns
Water-soluble ions
(mg kg−1)
Ca2+4.750.093nsnsnsns
Mg2+0.740.689nsnsnsns
K+9.50.009**nsp = 0.007 **p = 0.02 *
Na+1.690.429nsnsnsns
Cl7.310.026*p = 0.015 *nsns
N H 4 + 5.20.074nsnsnsns
N O 3 9.750.008**nsp = 0.026 *p = 0.005 **
1 Significance levels: ** p < 0.01; * p < 0.05; ns—not significant.
Table 2. Figures of merit obtained for the PLS-DA model used to discriminate F vs. G, G vs. A, and A vs. F.
Figures of MeritRCutt PointQAccuracyAUCSensitivitySpecificity
F vs. G0.740.7140.8220.740.810.720.76
G vs. A0.7470.6970.8390.750.810.820.68
A vs. F0.7950.7510.8380.7950.8680.810.78
Disclaimer/Publisher’s Note: The statements, opinions and data contained in all publications are solely those of the individual author(s) and contributor(s) and not of MDPI and/or the editor(s). MDPI and/or the editor(s) disclaim responsibility for any injury to people or property resulting from any ideas, methods, instructions or products referred to in the content.

