Article

Solid-State Fermentation of Brewery Spent Grains to Enhance Biomolecule Extraction

Department of Applied Science and Technology, DISAT, Politecnico di Torino, C.so Duca degli Abruzzi 24, 10129 Torino, Italy
*
Author to whom correspondence should be addressed.
Separations 2025, 12(3), 58; https://doi.org/10.3390/separations12030058
Submission received: 20 January 2025 / Revised: 17 February 2025 / Accepted: 20 February 2025 / Published: 22 February 2025
(This article belongs to the Special Issue Novel Solvents and Methods for Extraction of Chemicals)

Abstract

:
In the present work, brewer’s spent grain, BSG, the main by-product of beer production, was applied for the recovery of total polyphenols (TPs). Whole and ground BSG (wBSG and gBSG), derived from a Pilsen beer, was subjected to a solvent extraction using ethanol/water (50:50 v/v), and then, to improve TP recovery, microwave, ultrasound bath or probe pre-treatments were applied. The highest total phenolic content (TPC) (5.8 mg GAE/gDW) was obtained with gBSG pre-treated with the ultrasound (US) probe for 15 min at 250 W. Solid-state fermentation (SSF) with Phanerochaete chrysosporium, in microcosms was investigated to improve the release of TPs. Microcosms were monitored by means of CO2 production, the total proteins, and laccase activity. Fungal growth on gBSG, after only 10 days of fermentation, resulted in a 30% increase in the TPC compared to the unfermented substrate. Applying US probe-assisted extraction to fermented, ground BSG resulted in a 51% improvement compared to the untreated sample.

1. Introduction

Brewer’s spent grain, BSG, is the primary by-product generated during beer production process, and it is commonly discarded in large quantities and sold off at a low price. The worldwide beer production growth rate, predicted from 2021 to 2026, is about 14.1%, and consequently, the amount of discharged BSG is expected to rise proportionally (about 40 million tonnes/year) [1,2]. Considering BSG’s chemical composition, apart from the main significative components, such as cellulose (14.0–40.9%), hemicellulose (14.9–40.0%), lignin (3.8–17.8%), protein (15.4–23.1%), and lipids (5.3–8.9%), various bioactive compounds, with health-benefitting properties, are also present [1]. For this reason, in the last decade, different studies have been carried out to exploit BSG for the recovery of added-value products to be applied in the biotechnological, pharmaceutical, and food fields [3]. In particular, BSG is considered a unique source of polyphenols, characterized by an in vitro antioxidant potential similar to that of α-tocopherol and ascorbic acid [4]; the two main families of phenolic acids, hydroxybenzoic (HBA) and hydroxycinnamic acids (HCA), are present in BSG in quantities equal to 12 mg/100g and 450 mg/g, respectively [5]. Phenolic acids are strictly bound to the plant cell wall, and for this reason, various BSG pre-treatments and extraction methods have been investigated to improve the extraction yield and to preserve the polyphenol antioxidant ability.
BSG pre-treatments, like grinding or milling and homogenization, cause damage to the plant cells and raise the surface area in contact with the solvent, thus increasing the extraction efficacy [5]. For this reason, the effects of different pre-treatments have been studied in [6], finding that the milling of wet BSG, carried out without adding water, does not alter the BSG moisture content and is preferred to the milling of BSG dried overnight at 60 °C.
Following the pre-treatment phase, polyphenols are typically extracted from the raw BSG, applying traditional techniques such as chemical hydrolysis and solvent extraction. Ethanol, methanol, acetone, and isopropanol, pure or mixed with water, are the main organic solvents applied; moreover, solvent acidification, allowing for the production of H+ ions, is often carried out to stabilize the free radicals produced during extraction [7]. In order to increase the total polyphenol yield, chemical methods can be coupled with physical ones, like the microwave (MW)- or ultrasound (US)-assisted extraction [8].
Moreira et al. reported an improvement, thanks to electromagnetic waves, on the extraction yield of ferulic acid fivefold higher than that obtained using sole solid–liquid extraction by applying MWs for 15 min, at 100 °C, to 1 g of dried BSG with 20 mL of 0.75% NaOH [9]. Similarly, Carciochi et al. found that an 8% increase in extracted polyphenols, with respect to the untreated control, was achieved with MW-assisted extraction; additionally, the polyphenol extraction was faster (1.66 mg/g/min compared to 0.98 mg/g/min of the control) [10].
US-assisted extraction can be carried out in a bath or with US probes, depending on the sample volume. Iadecola et al. reported an increase in extracted phenolic compounds (4.1 mg GAE/gDW) by applying a US bath pre-treatment at 37 kHz for 50 min at 80 °C using a mixture of ethanol/water (80:20 v:v) compared to an extraction without the pre-treatment (1.6 mg GAE/gDW) [11]. Using a lower frequency of 20 KHz and a power of 45 W, an ethanol mixture at 70:30, and a solid/liquid ratio of 30:1 [10] achieved a positive effect of the US probe assistance and resulted in a 13% improvement in the extraction yield. The higher efficacy of the US in total polyphenol extraction was also demonstrated in [12] using water as a solvent: US was applied for 30 min with pulses of 5 s of 20 kHz waves at 47 °C.
Coupling the solvent extraction with physical methods such as MW and US extraction has a great advantage in the extraction yield [5,8,9,10]; despite this, physical treatments have some limitations, such as possible damage to the extracted molecules and the formation of unwanted and potentially harmful compounds. Moreover, they are expensive treatments because they require high energy consumption [13]. For this reason, alternative methods can be investigated to enhance the release of phenolic compounds bound to the ligninolytic structure of BSG. Among them, solid-state fermentation, SSF, is a promising cost- and energy-efficient alternative [14].
Untreated BSG, discharged from the beer production, is particularly suitable for SSF because its water activity and moisture content (about 70%) are within the range of typical SSF media, and consequently, BSG does not require additional drying or water supplementation [15,16]. Filamentous fungi, thanks to their ability to degrade the lignin’s complex structure, are the main candidates for the fermentation of BSG [17,18]. Genera such as Aspergillus, Trametes, and Fusarium have been applied in BSG treatment thanks to their capability to produce ligninolytic enzymes. In this concern, SSF carried out with different filamentous fungi on BSG was reported in [14] to evaluate the release of phenolic compounds. Among the five tested species, Aspergillus oryzae proved to be the most effective after 3 days of fermentation, allowing for the recovery of TPCs equal to about 8 mg GAE/g. In the work of [19], SSF of BSG with A. ibericus is reported as an efficient process to increase the production of lignocellulolytic enzymes and, consequently, the extraction of phenolic compounds. The use of T. versicolor was reported in the work of [20] for the production of lignolytic enzymes in SSF with BSG, with an increase in the extracted total polyphenols equal to 56% compared to that of unfermented BSG. T. versicolor, after 14 days of fermentation in the presence of BSG as the sole C and N source, allowed for a 3.4-fold increase in the extraction of total polyphenols compared with untreated BSG [21]. Cervantes-Ramirez et al. studied the SSF of blade-milled BSG with Fusarium oxysporum; in the first 48 h of incubation, a higher amount of free phenolic compounds with respect to BSG was reported (about 21 and 9 mg/g, respectively) [22]. In the literature, a single physical pre-treatment is generally applied to extract polyphenols from fermented BSG, but a lack of comparison between the different types of pre-treatments is evident.
In the present work, BSG was frozen as is, without drying, to prevent microbial deterioration, being maintained for more than 12 months. Thawed BSG was applied whole or simply blade ground. Different combinations of physical pre-treatments (i.e., MW, US bath, and US probe) and a biological one, SSF, have been applied on whole or ground BSG prior to standard solvent extraction to recover polyphenols.
SSF with the ligninolytic fungus Phanerochaete chrysosporium was performed for the first time on BSG, without the addition of mineral medium to promote mycelial growth and induce laccase production. Finally, the best physical pre-treatment was coupled with SSF.

2. Materials and Methods

2.1. Chemicals

All the utilized reagents were of analytical grade and were provided by MERCK KGaA (Darmstadt, Germany). D+ glucose (cod. 49139), malt extract (cod. 1.05391), peptone (cod. 90765), and agar (cod. 05040) were used for the preparation of malt extract agar, MEA. Sodium hydroxide, NaOH (cod. S5881), hydrochloric acid, HCl (cod. 1.00317), phenolphthalein (cod. 105945), and barium chloride, BaCl2 (cod. 217565) were applied to capture and measure the produced CO2. Ethanol (cod. 1.00983) was used for the total polyphenol extraction, and analytical determination was carried out with Folin–Ciocalteau reagent (cod. 1.09001.0100), sodium carbonate (cod. S7795), and gallic acid (cod. 27645). The reagents utilized for the laccase activity were sodium tartrate buffer (cod. S4797), manganese sulphate, MnSO4 (cod. 221287), 2,6-Dimethoxyphenol, 2,6-DMP (cod. D135550), and hydrogen peroxide, H2O2 (cod. 95321).
Whey protein isolate (cod. MILEI 90, MILEI GmbH, Leutkirch im Allgäu, Germany) was used for the calibration curve construction for the total protein evaluation.

2.2. Microorganism

SSF was carried out in the presence of Phanerochaete chrysosporium MUCL 19343, purchased from the Belgian Coordinate Collection of Microorganisms BCCM/MUCL, Universitè Catholique de Louvain, Louvain-la-Neuve, Belgium. The microorganism was maintained on MEA, (D + glucose 20 g/L, malt extract 20 g/L, peptone 2 g/, and 2% agar), at +4 °C until its utilization.

2.3. BSG

Wet BSG was supplied by a local beer producer located in Piemonte (Italy), originating from a Pilsen beer (50% Pilsner, 20% Pale Cara Ruby, 15% Pale Ale, and 15% oat flakes). It was freshly collected on the same day of production, kept at −20 °C, and thawed at room temperature before its utilization. Wet BSG was applied whole (wBSG) or blade ground (gBSG) by means of a knife until fragments of 4–5 mm were obtained.

2.4. SSF

Two SSF tests, indicated as test 1 and test 2, were realized in closed microcosms (Erlenmeyer flasks, 500 mL) filled with 40 g of wBSG or gBSG, sterilized in an autoclave (121 °C, 2 atm for 20 min) prior to be applied in abiotic controls, either without the inoculum (control wBSG and gBSG) or in biotic samples inoculated with P. chrysosporium (wfBSG and gfBSG) (Figure 1).
The standardized fungal inoculum for biotic samples was prepared starting from colonies grown for 4 days at 39 °C on MEA; conidia were resuspended in sterile water, the optical density was spectrophotometrically evaluated at 600 nm, OD600, and the suspension was opportunely diluted to obtain 0.8 < OD600 < 1; finally, 3 mL was homogeneously dispersed on the surface of sterile BSG (i.e., wfBSG or gfBSG); in the case of abiotic controls, the fungal inoculum was substituted with 3 mL of sterile distilled water (i.e., control wBSG and control gBSG). In test 2, in addition to the 3 mL of inoculum (biotic samples) or 3 mL of distilled water (abiotic controls), a further volume of distilled water (2 mL) was directly added to gBSG. The main characteristics of the microcosms, set-up as abiotic controls and biotic samples in SSF test 1 and test 2 (see Figure 1), are summarized in Table 1A,B, respectively.
During the time course of the incubation, in all microcosms, moisture was maintained by hanging, at the neck of the flask, a 5 mL plastic tube filled with 3 mL of water. At the beginning of each fermentation test and periodically during the incubation, closed microcosms were aerated by insufflating sterile moistened air for 5 min at a pressure of 0.98 bar.
In SSF test 1, flasks were incubated in the dark at 39 °C, and after 2 days, a temperature shift was carried out at 30 °C, being maintained till the end of the SSF (see Table 1A), while in test 2, the microcosms were maintained at 30 °C from the beginning of the fermentation (see Table 1B).

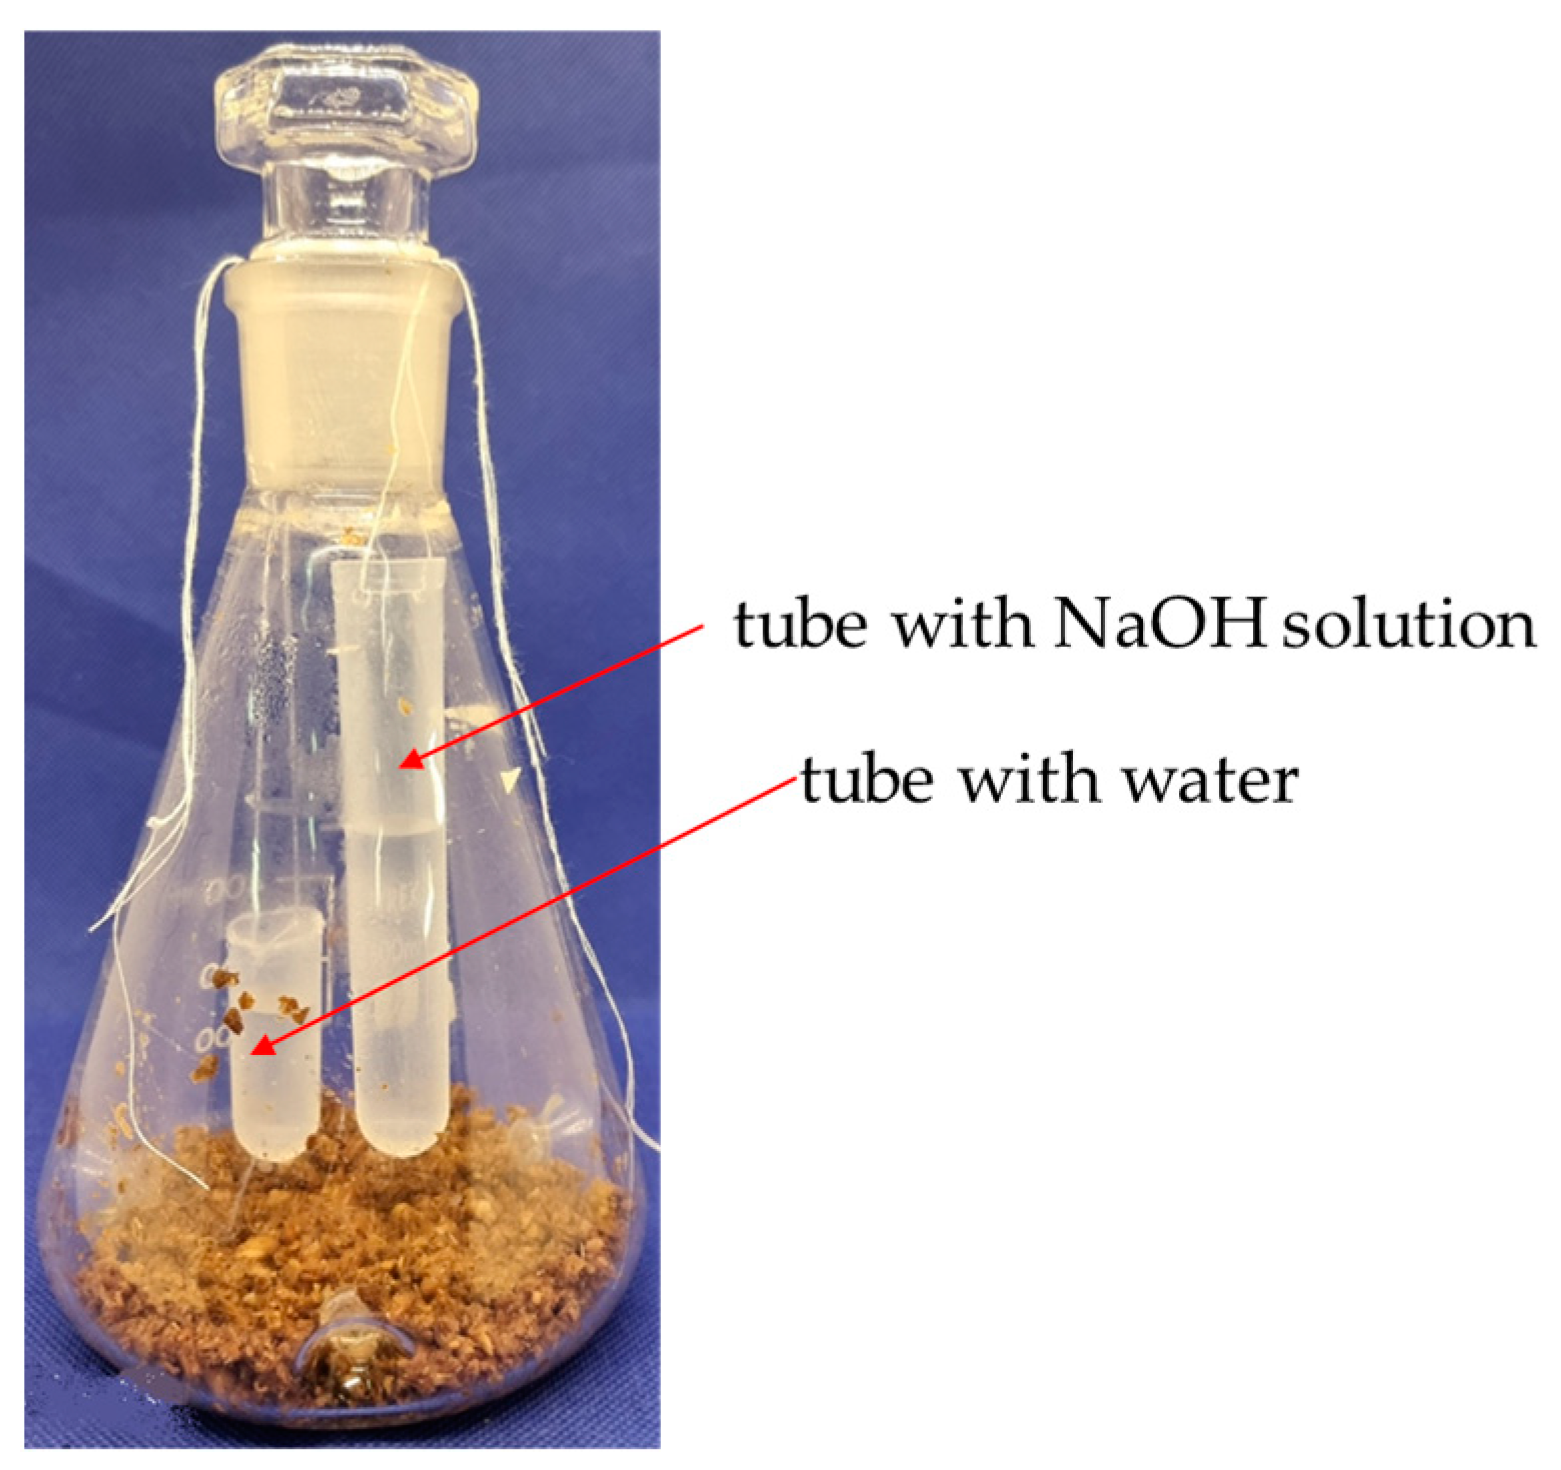
SSF Monitoring: Respirometric Determination

The respirometric evaluation in closed microcosms, abiotic and biotic, was performed measuring the produced CO2, captured in a 3M NaOH solution, according to the method described in [23]. The NaOH solution was dispensed into sterile polypropylene tubes (12 mL, see Figure 1); the captured CO2 was quantified using an acid–base titration with HCl 1.5 N, BaCl2 1 M as the precipitating agent, and a phenolphthalein solution, 1% in ethanol, as a color indicator. The CO2 quantity was calculated as follows (Equation (1)):
CO2 (mg) = (V0 − V) × f
where V0 is the HCl 1.5 N volume necessary to titrate the abiotic controls, V is the volume required for the biotic samples, and f is the conversion factor equal to 22 × M, where M is the HCl solution molarity.

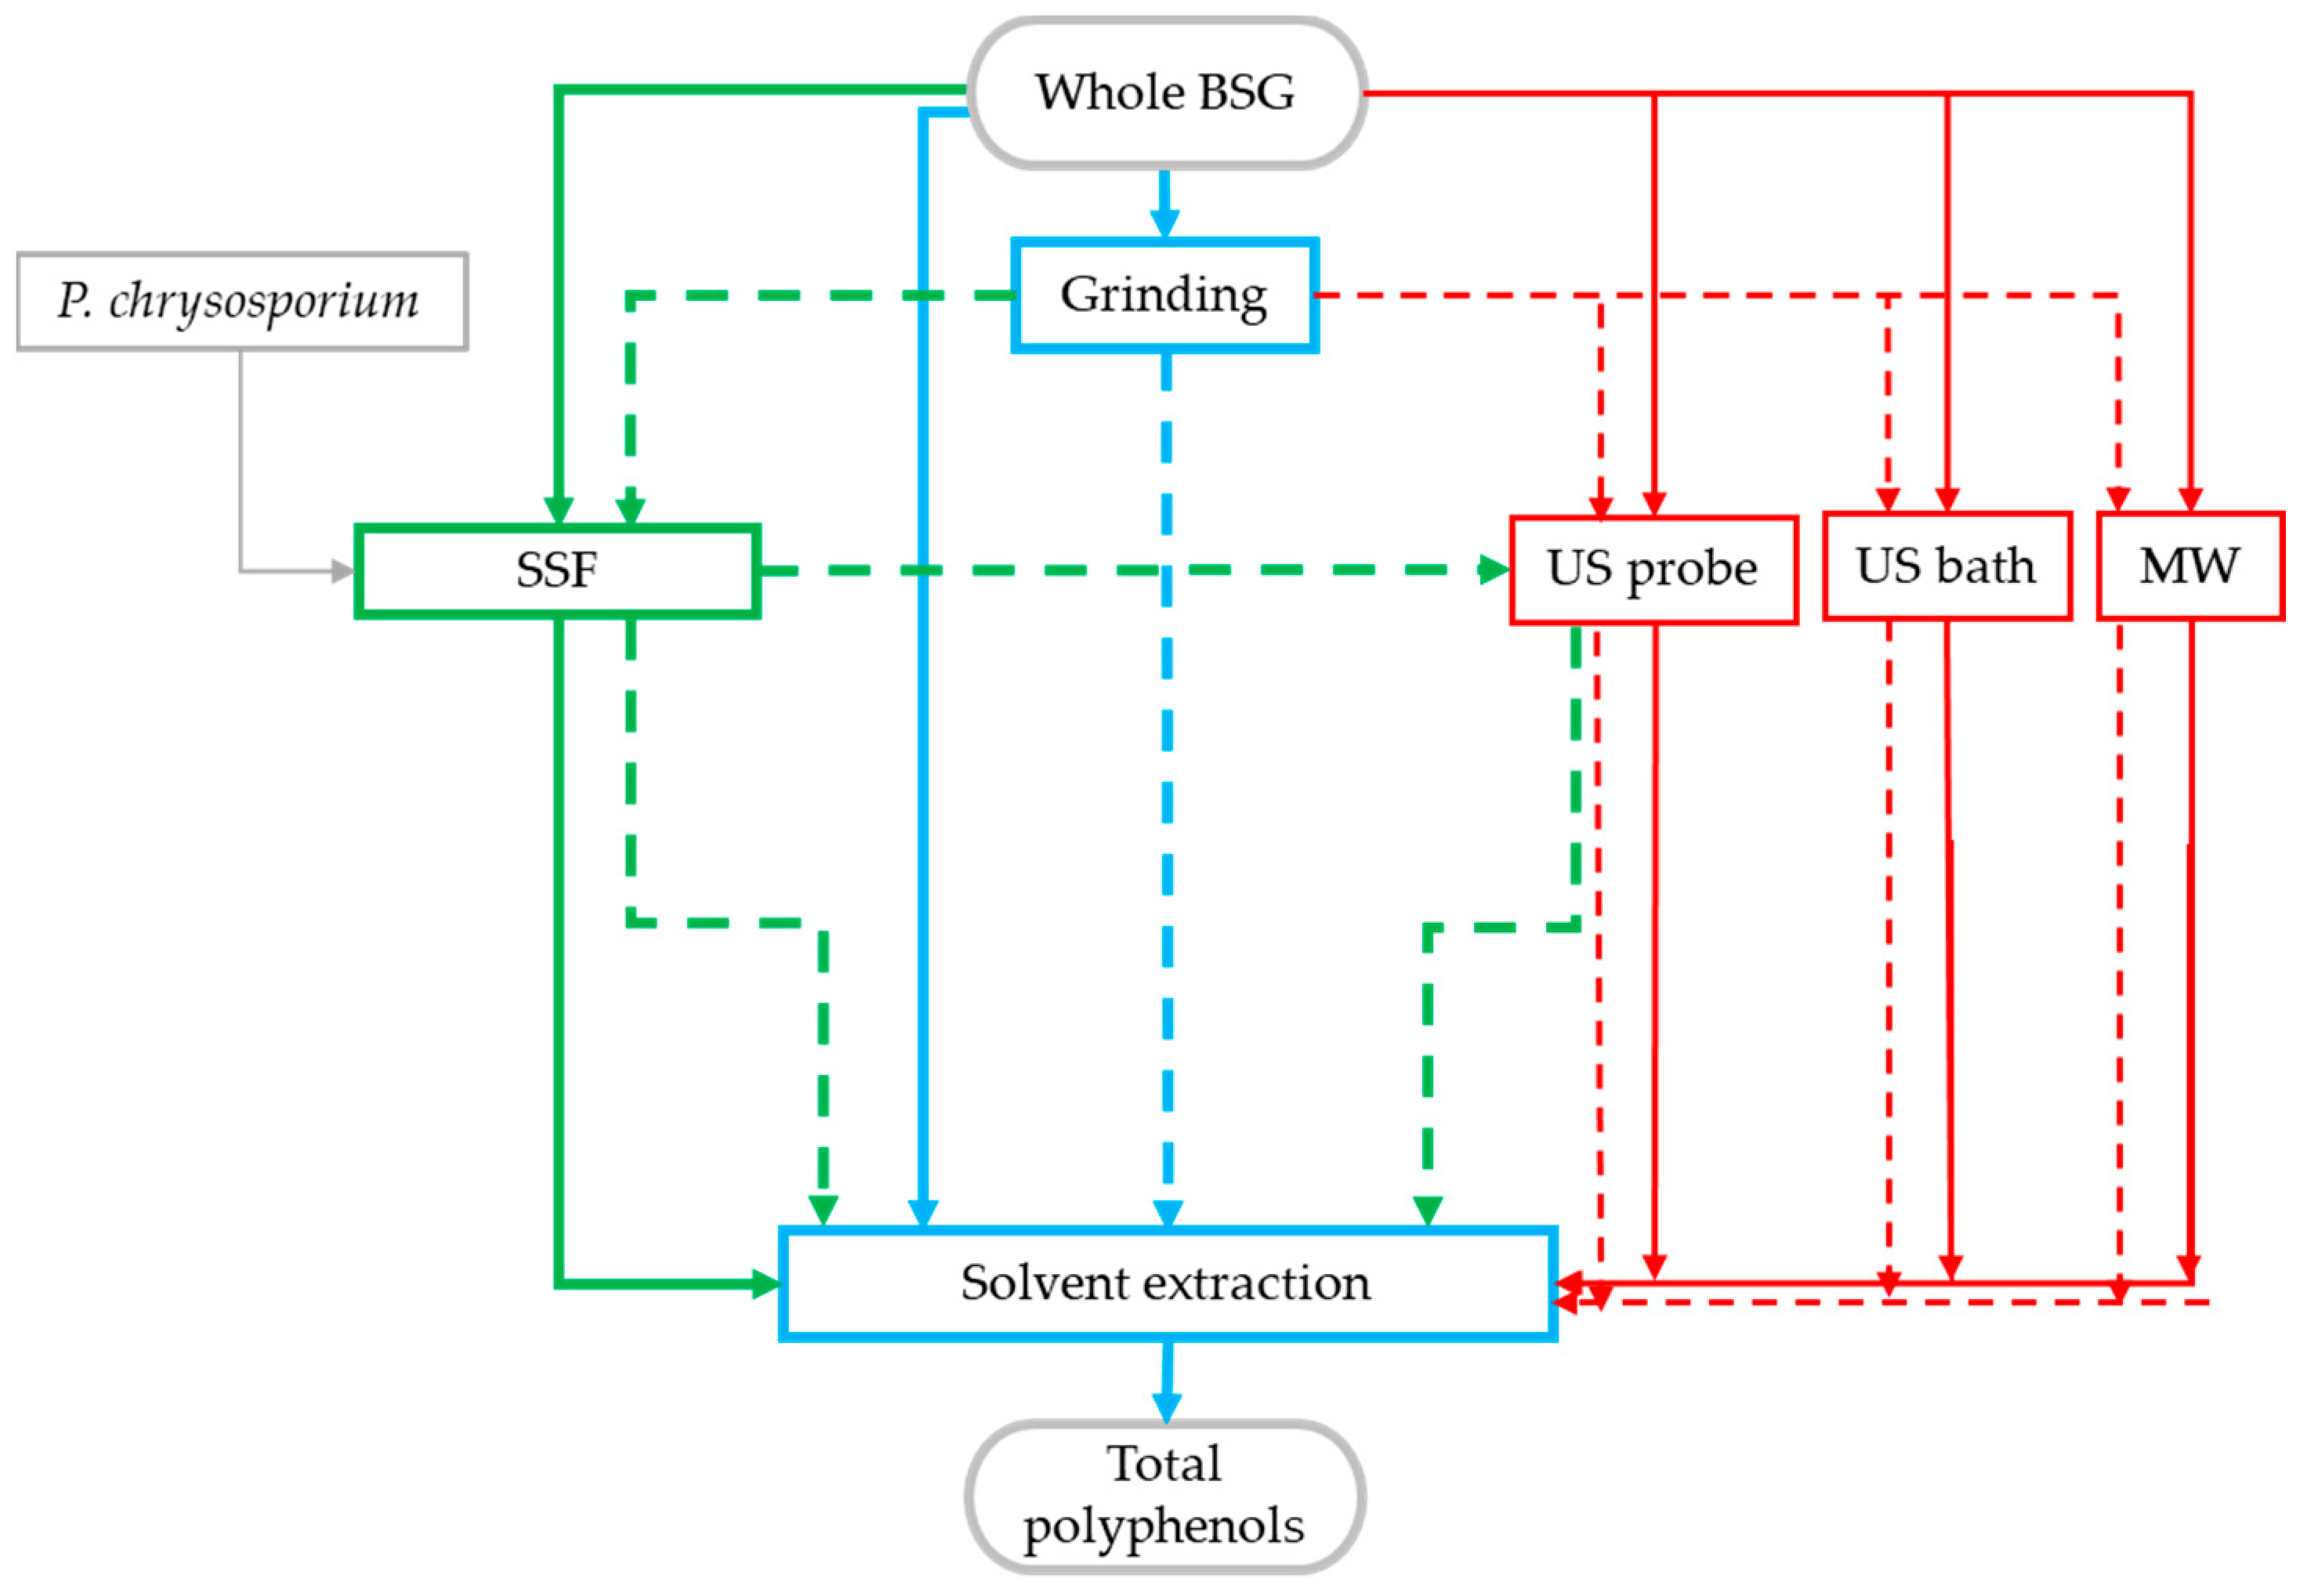
2.5. Total Polyphenol Recovery

After being characterized, wBSG and gBSG were applied as substrates for TP recovery. The solvent extraction was directly carried out, or it was preceded by three different BSG pre-treatments (MW, US bath, or US probe) using both the whole and the ground substrate. In regard to wfBSG and gfBSG, they straight underwent the solvent extraction, while only gfBSG was pre-treated with the US probe. All the experimental procedures that resulted in TP recovery, with or without SSF, are shown in Figure 2.

2.5.1. Solvent Extraction

The total polyphenols (TPs) were extracted using a mixture ethanol/water 50:50 (v/v) [24]. BSG (control wBSG, control gBSG, wfBSG, and gfBSG), previously dried at 80 °C, was combined with the solvent at a ratio of 1:40 and maintained in agitation in a water bath at 80 °C for two hours. Then, the extract was separated with Whatman filter paper N°1 (WHA1001090, Whatman Int. Ltd., Maidstone, UK) and spectrophotometrically evaluated as described in Section 2.7.7.

2.5.2. MW- and US-Assisted Extractions

Before TP solvent extraction, MWs and a US bath or probe were utilized for the pre-treatment of dried wBSG or gBSG. The BSG sample was mixed with water at a ratio of 1:20.
MW treatment was performed in a microwave oven (Dimension 4, Panasonic Marketing Europe GmbH, Munich, Germany, operating for 1 min in a continuous mode at 400 W or 800 W [25]. The US bath (Elmasonic P, Elma Schmidbauer GmbH, Singen, Germany) was utilized at a frequency of 37 kHz and a maximum power of 550 W for 20 or 40 min [11]. Finally, the US probe was applied using an ultrasound probe (Ø = 1/2”) operating in a pulsed mode (5 s on/5 s off) at a frequency of 20 KHz, with an amplitude of 100% and ultrasound power of 250 W, for 15 or 30 min (SFX250 Sonifier®, sBranson, Emerson, Milan, Italy) [12].
At the end of each pre-treatment, water was added to replenish that which had evaporated during the physical treatment; then, ethanol was added (ratio of 1:20), and the extraction protocol followed as described in Section 2.5.1.

2.6. BSG Water Extract

At the beginning of each experimental trial and in the time course of the fermentation, the control wBSG, control gBSG, wfBSG, and gfBSG, were mixed with distilled water at a ratio of 1:2.5 (w/v), at 25 °C, and under continuous stirring (C-MAG HS 4, IKA, 79219 Staufen, Germany) at 1000 rpm for 1 h. The extract, separated by means of centrifugation (centrifuge IEC CL30, Thermo SCIENTIFIC, Waltham, MA, USA), which was carried out at 4000 rpm for 12 min at 25 °C, was then characterized with the analytical determinations described in Section 2.7.

2.7. Analytical Determinations on BSG and BSG Extracts

2.7.1. Moisture% of BSG

BSG moisture% was checked in a thermobalance (MB120, OHAUS Europe GmbH Heuwinkelstrasse 3, 8606 Nänikon, Switzerland) at 80 °C, operating at a drying rate of 1 mg/90 s.

2.7.2. pH

The pH of the water extract (Section 2.6) was evaluated with a benchtop pH meter (pH730, inoLab, WTW, 82362 Weilheim, Germany).

2.7.3. Total Proteins

The total protein content of the water extract (Section 2.6) was spectrophotometrically evaluated at 280 nm (spectrophotometer Lambda 465, PerkinElmer, Waltham, MA, USA) using commercial whey protein isolate (MILEI 90, MILEI GmbH, Leutkirch im Allgäu, Germany) as the standard, in the range 0–1 g/L, for the calibration curve construction. Total protein values are reported as proteins per BSG dry weight, g/gDW.

2.7.4. Laccase Activity

The laccase activity of the water extract (Section 2.6) was measured by spectrophotometrically monitoring the oxidation of 2,6-DMP 10 mM at 468 nm (ε = 23,100 M−1 cm−1) and at 25 °C [26]. The reaction mixture contained the extract, sodium tartrate buffer (200 mM, pH 5.0), MnSO4 (10 mM), 2,6-DMP (1 mM), and H2O2 (0.1 mM). The reaction was initiated by adding hydrogen peroxide at 10 mM. One unit of the enzymatic activity was defined as 1 μmol of product formed per minute.

2.7.5. Degrees Brix

The degrees Brix (°Bx) of the water extract (Section 2.6) was evaluated with a refractometer (PAL-1, ATAGO, Saitama, Japan), measuring in the range 0–53%, using distilled water as a reference.

2.7.6. D-Glucose Content

The D-glucose content of the BSG water extract (Section 2.6) was spectrophotometrically determined using the commercial kit EnzytecTM Liquid D-Glucose Art. No. E8140 (R-Biopharm AG, Darmstadt, Germany).

2.7.7. Total Phenolic Content (TPC)

The TPC was measured using the Folin–Ciocalteu method [10]. The extract (see Section 2.5), at 0.5 mL, was mixed with the Folin–Ciocalteu reagent (1:10 diluted, 2.5 mL) and 7.5% sodium carbonate (2 mL). The prepared samples were stored in the dark, for 2 h, at room temperature, and then the absorbance was determined with a UV–Vis spectrophotometer at a wavelength of 765 nm, using gallic acid as the standard. Blank solutions were prepared via the same method, replacing the sample solution with distilled water. The TPC was expressed as the equivalent of Gallic acid (mg) per BSG dry weight (gDW), mg GAE/gDW [14].

2.8. Data Analysis and Statistics

All the reported data are means of three replicates with their standard deviations (SDs), shown in graphs as error bars. Each experiment was carried out with two technical replicates (n = 6). Differences between two given groups were tested for statistical significance using Student’s t-test (p < 0.05), while those between more than two groups were evaluated via one-way analysis of variance (ANOVA) followed by the Bonferroni test. Differences with p < 0.05 are considered to be statistically significant; “ns” is reported for p > 0.05, “*” for p < 0.05, “**” for p < 0.01, “***” for p < 0.001, and “****” for p < 0.0001.

3. Results

3.1. BSG Characterization

Table 2 lists the main parameters characterizing wBSG, gBSG, and BSG water extract (see Section 2.6); the TPC value (see Section 2.5.1) is also reported.
gBSG has a moisture content 17% higher than that of wBSG. In regard to the BSG water extract, the pH, total proteins, D-glucose amount, and °Bx are similar for wBSG and gBSG, with a difference lower than 10% for all the evaluated parameters.
Finally, considering the TPC (Section 2.5.1), the value of gBSG is 15% higher than that of wBSG.

3.2. TPCs of Pre-Treated wBSG and gBSG

As reported in Section 2.5.2 and Section 3.1, the TPs were extracted from wBSG and gBSG, applying the solvent extraction with ethanol/water at 50% (v/v). In order to improve the TP extraction, wBSG and gBSG underwent three different physical pre-treatments: MWs (400 or 800 W, for 1 min), US bath (550 W, for 20 or 40 min), and US probe (250 W, in a pulsed mode of 5 s on/5 s off, for 15 or 30 min). In all cases, the TPC of gBSG was always higher than that of wBSG; the results obtained with different pre-treatments are reported in Table 3. The highest TPC values were achieved with the US probe treatment on gBSG: 5.8 and 5.9 mg GAE/gDW, obtained for 15 and 30 min, respectively.
In Figure 3, the best extraction results referring to MWs (800 W for 1 min), an US bath (550 W for 40 min), and US probe (250 W for 30 min) are reported and compared with those attained without pre-treatments (continuous and dotted red lines for wBSG and gBSG, respectively). In regard to wBSG (white bars), pre-treated with the US bath, the TPC (3.5 mg GAE/gDW) was similar to that of the untreated wBSG (3.4 mg GAE/gDW) (p = 0.15). MWs and the US probe allowed us to obtain a TPC 15% (p = 0.0095) and 30% higher, respectively (p = 0.0012). Considering the gBSG (black bars), the US probe gave the best result (5.9 mg GAE/gDW): 19% and 31% higher than those obtained with the MWs and US bath (p = 0.0053 and p = 0.00067, respectively).

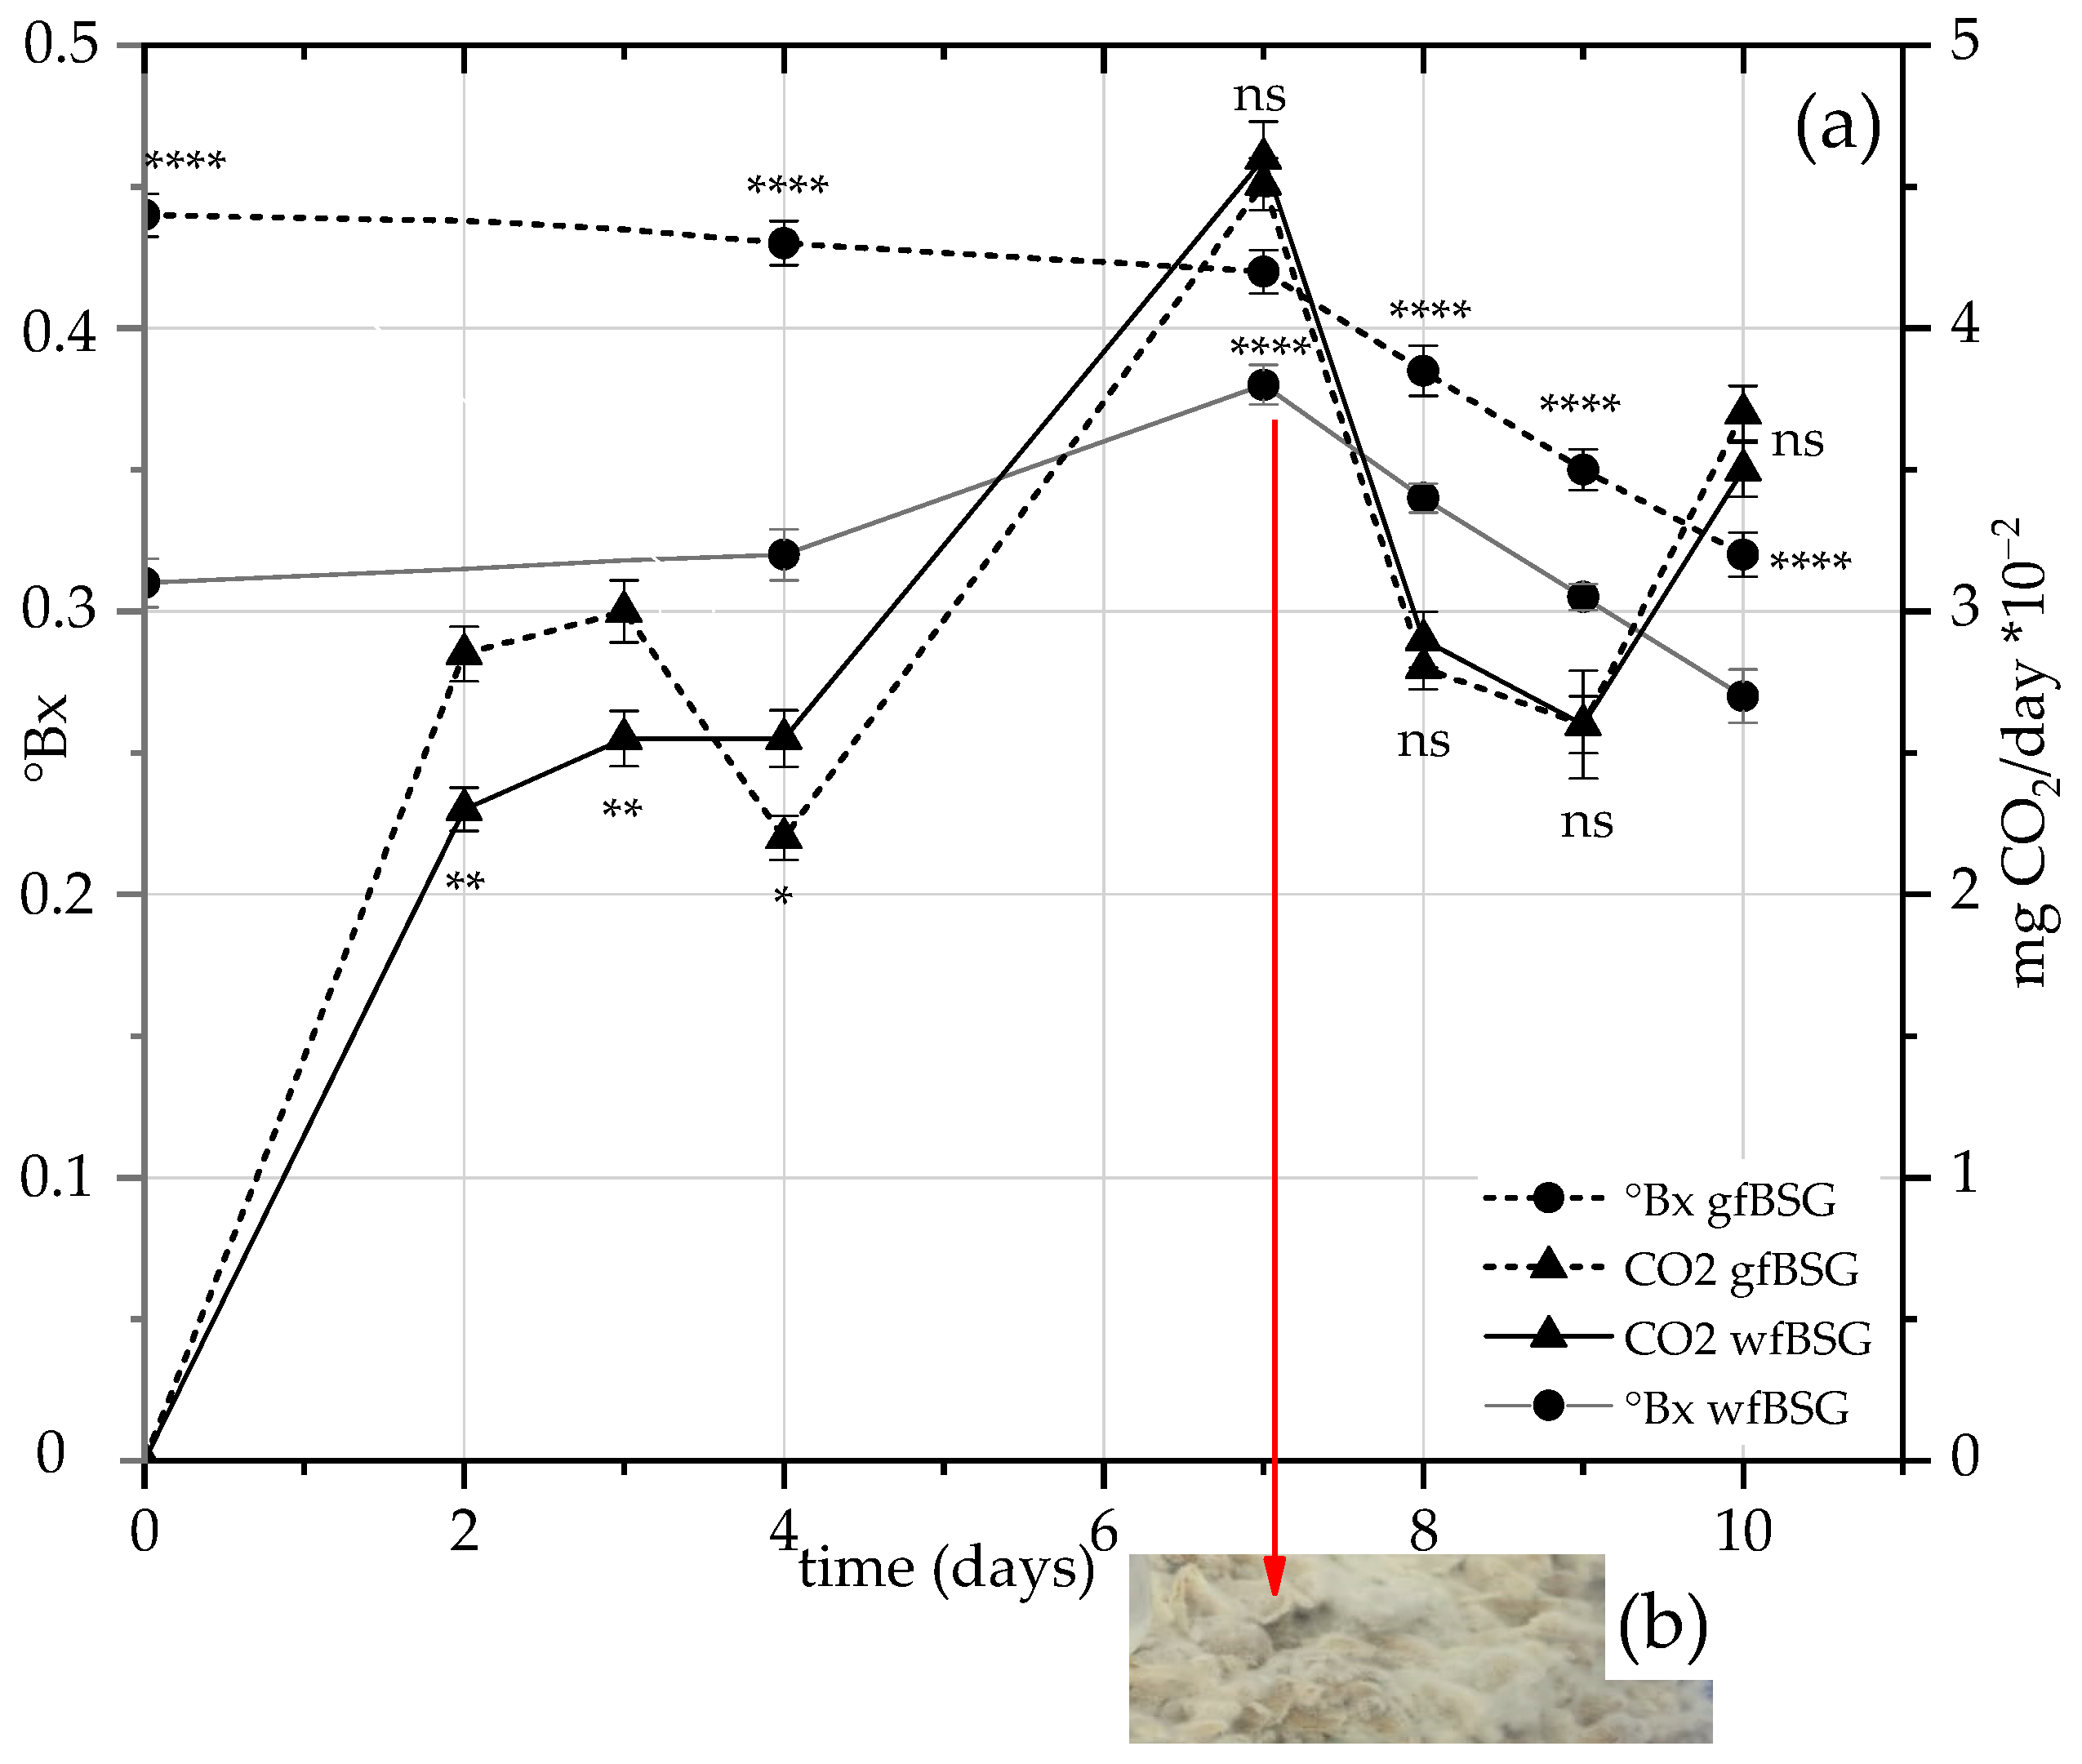
3.3. SSF in Microcosms with P. chrysosporium

3.3.1. TPCs of wfBSG and gfBSG: Test 1

SSF has been performed in closed microcosms with P. chrysosporium inoculated on wBSG or gBSG. In test 1, microcosms were incubated at 39 °C for 2 days, and then a temperature shift was carried out at 30 °C, maintained till the end of the incubation (10 days). BSG from abiotic (control wBSG and gBSG) and biotic microcosms (wfBSG and gfBSG) was sampled and characterized (see Section 2.7), and TPs were recovered with the solvent extraction (see Section 2.5.1).
In biotic samples, fungal growth was evaluated by means of CO2 production assessment. As shown in Figure 4, up to the 3rd day of incubation, the CO2 production rate was higher in the microcosms with gfBSG (300 mgCO2/day for gfBSG and 255 mgCO2/day for wfBSG), while from the 4th to the 7th day, about 14% higher values were registered in the microcosms with wfBSG. On the 7th day, in both microcosm types, the maximum rate was reached, with comparable values (451 and 460 mgCO2/day with gfBSG and wfBSG), followed by a similar trend maintained till the end of the incubation (10th day, 370 and 350 mgCO2/day for gfBSG and wfBSG). In the same figure, the °Bx trend is also reported; values referring to wfBSG show an increase in the first 7 days, being more evident between days 4 and 7, from 0.31 to 0.38, followed by a reduction to 0.27 at day 10. The °Bx of gfBSG is always higher than that of wfBSG and shows a decreasing trend from 0.44 at the beginning of the incubation to 0.32 on the 10th day.
Regarding abiotic controls, the moisture% level remained stable during the entire incubation period (62.3 and 77.3), and the pH (6.01 and 6.12 for control wBSG and gBSG), the °Bx (0.25 and 0.29 for control wBSG and gBSG), and the total proteins (0.01 g/gDW for both types of control BSGs) behaved similarly. Considering fermented BSG (see Table 4), as expected, the moisture content increased during the incubation, from 62.3 to 77.3% for wfBSG and from 77.3 to 79% for gfBSG. Regarding the pH value, in the first 4 days, it was stable with both types of microcosms; on the 7th day, the highest values were measured (6.13 and 6.44 for wfBSG and gfBSG); finally, on the 10th day, the pH value remained stable for wfBSG, while it decreased to 6.22 for gfBSG. During the incubation, the total proteins and laccase activity were also evaluated; as shown in Table 4, the values were similar for wfBSG and gfBSG but always higher (about 25%) in microcosms with gfBSG. The number of total proteins increased until the 10th day to 0.023 g/gDW for wfBSG and to 0.032 g/gDW for gfBSG. The laccase activity reached its maximum on the 7th day (1.21 and 1.35 UI/L for wfBSG and gfBSG), in correspondence to the highest CO2 production rate (see Figure 4).
During test 1, as shown in Figure 5, TPs were recovered from the control wBSG and gBSG and from wfBSG and gfBSG after 4, 7, and 10 days from the beginning of the incubation. Considering wfBSG, in the first 7 days of incubation, there was not a significative improvement in the TPC in comparison with the control wBSG (3.5 and 3.6 mg GAE/gDW on the 4th and 7th days compared with 3.4 mg GAE/gDW, p = 0.22 and p = 0.26, respectively), while on the 10th day, an improvement of 24% was measured (p = 0.0047). In the presence of gfBSG, the TPC value was always higher than that of wfBSG. In the first 4 days of incubation, the TPC (4.2 mg GAE/gDW) was almost similar to that of control gBSG (4 mg GAE/gDW, p = 0.089), and after that, an improvement was registered (4.4 and 5 mg GAE/gDW, p = 0.081 and p = 0.0051, respectively). On the 10th day, an enhancement corresponding to 20% was the highest obtained, thanks to the SSF application.

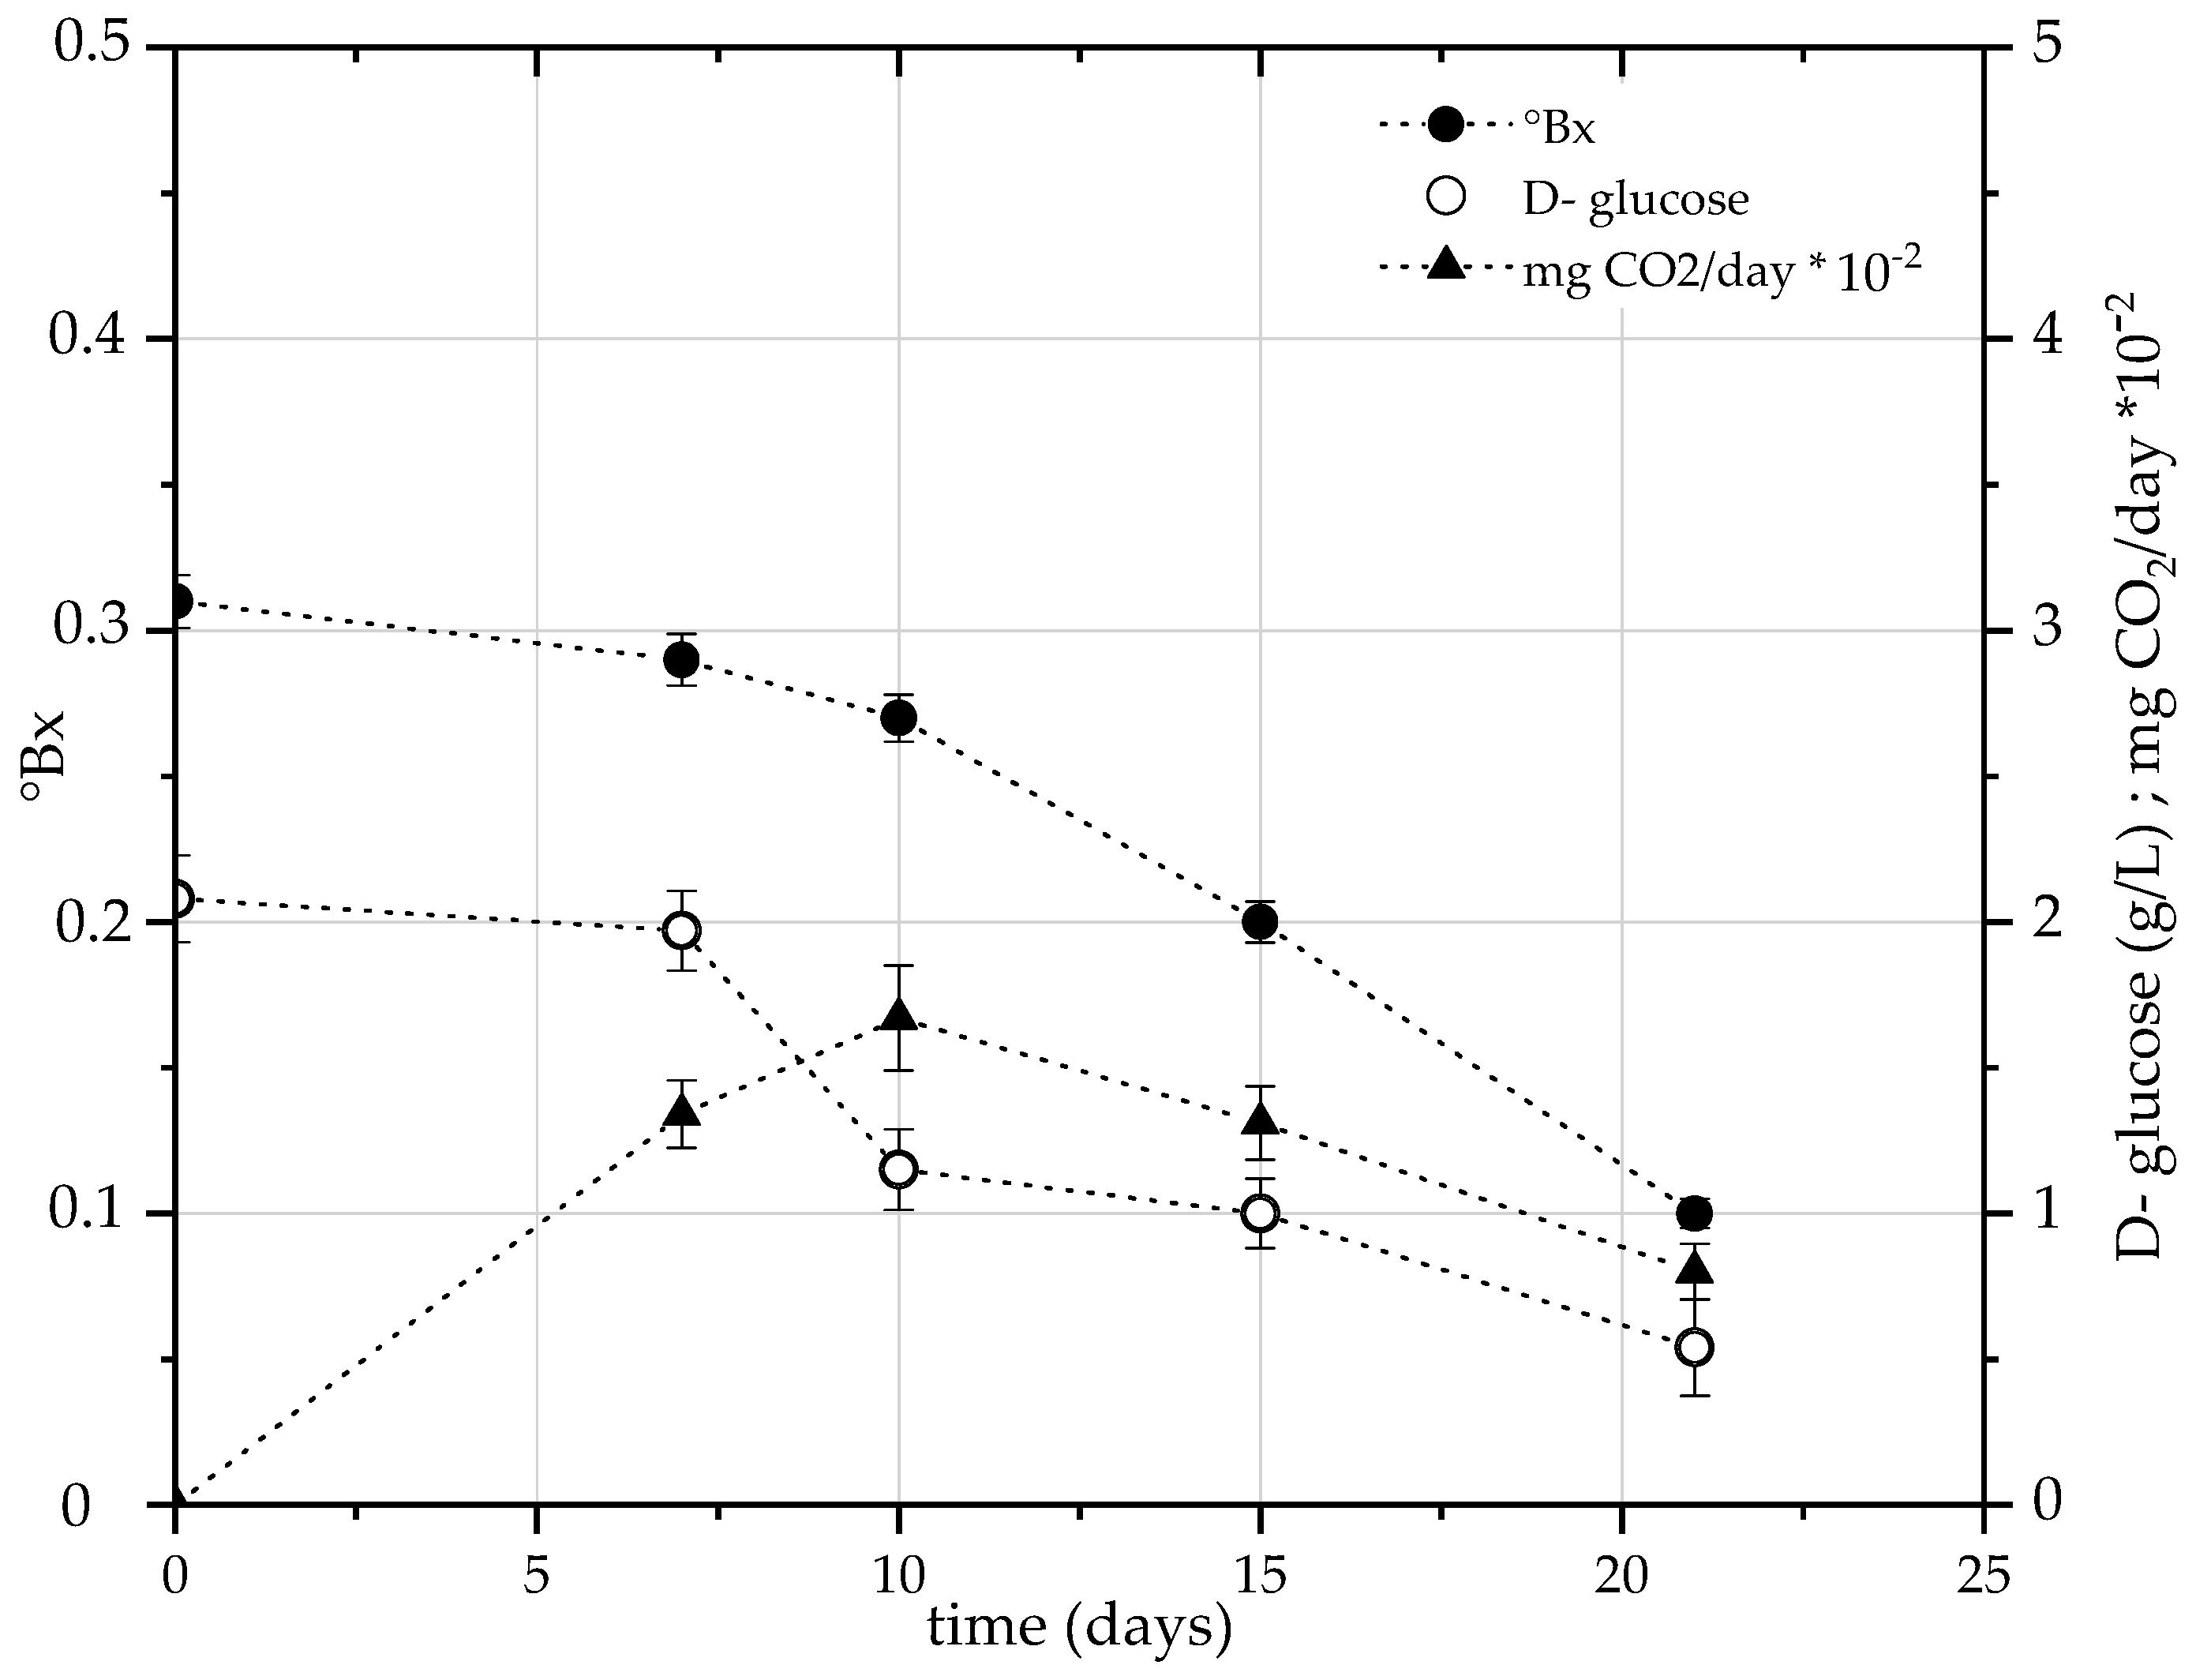
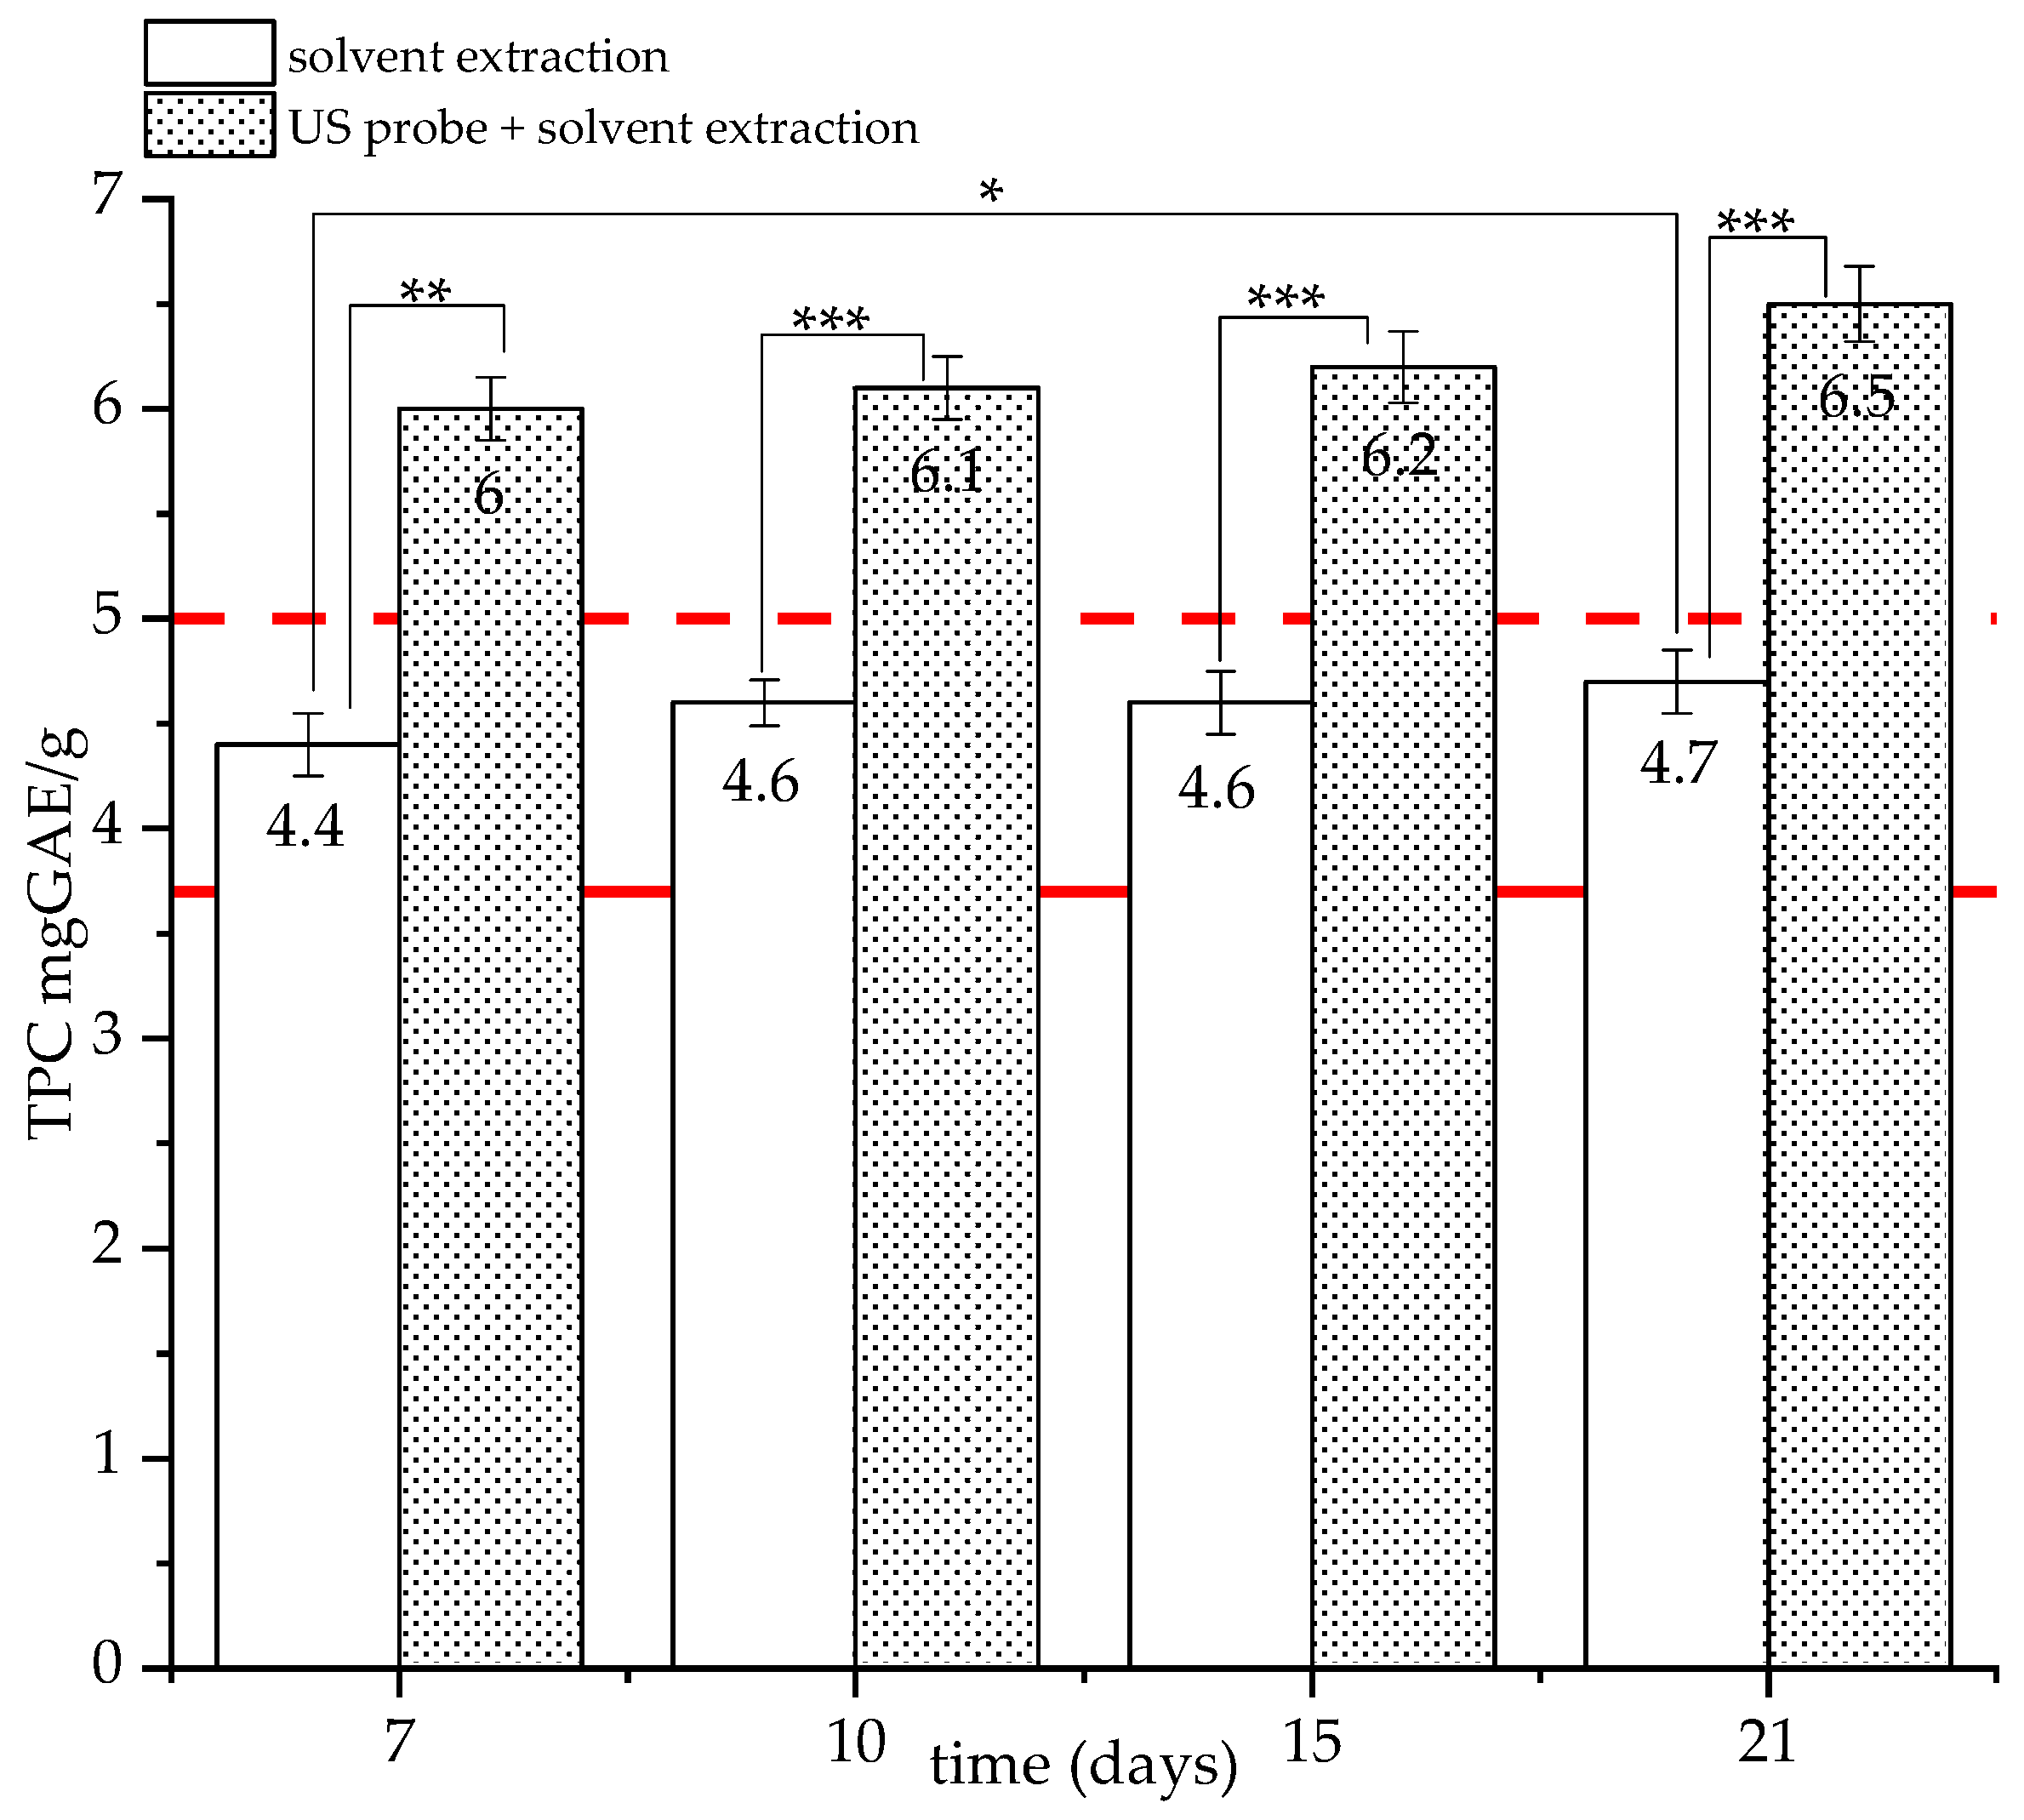
3.3.2. Effect of US Probe Pre-Treatment on TPC of gfBSG: SSF Test 2

The second SSF with P. chrysosporium was set-up with gBSG and monitored for 21 days, maintaining the microcosms at 30 °C from the beginning of the incubation. The same parameters evaluated in test 1 were measured; in addition, the D-glucose content of the BSG water extract was evaluated (see Section 2.6). In regard to TP recovery, the control gBSG and gfBSG, sampled from microcosms, were subjected to solvent extraction, preceded or not by the US probe pre-treatment.
The CO2 production rate, °Bx, and D-glucose trends in biotic samples are shown in Figure 6. The CO2 production rate reached the highest value on the 10th day, equal to 167 mg/day; then it decreased progressively until the 21st day, when it was equal to 80 mg/day. Regarding the °Bx values, they decreased during the incubation from 0.31 to 0.1. Measuring the D-glucose, it was possible to observe a similar trend: the initial amount, 2.08 g/L, was halved in 10 days to 1.15 g/L, and then it continued to decrease till it reached 0.54 g/L on the 21st day.
Considering the control gBSG, the moisture% remained stable during the whole incubation period (71.4%), and the pH (5.6), the °Bx (0.3), and the total protein content (0.012 g/gDW) behaved similarly. The same parameters, together with the laccase activity, of the biotic microcosms (gfBSG) are summarized in Table 5. As already reported for SSF test 1, during the incubation, the moisture% grew progressively from 71.4 to 81.2%. Considering the pH values, a decrease was registered till the 15th day, from 5.7 to 4.7, and then the pH grew again to 5.8 (21st day). The total protein content increased progressively up to the 15th day, when the highest value was reached (0.033 g/gDW), and then it remained almost stable; the laccase activity reached the maximum (1.32 UI/L) on the 10th day; then a decrease to 0.85 UI/L was measured on the 21st day.
The TPC values, obtained at different fermentation times, from gfBSG are shown in Figure 7. Considering the TPC obtained without pre-treatment, the improvement due to fermentation was around 20% and almost stable during the entire incubation; the TPC values were between 4.4 and 4.7 mg GAE/gDW from 7 and 21 days of incubation, with a statistical significance equal to p = 0.033. When the US probe was applied, the TPC values were always higher, about 26%, with respect to those obtained without the pre-treatment (with a statistical significance represented by p-values between 0.0014 and 0.00078). Comparing the highest TPC value, 6.5 mg GAE/gDW, measured in the second test with that of the untreated and unfermented BSG (3.7 mg GAE/gDW), an improvement of about 43% was obtained (p = 0.000086).

4. Discussion

4.1. BSG Characterization

The applied BSG was characterized by a malt composition typical of a Pilsen beer, and it has been chosen because, as reported in [27], pale malts typically contain more phenolic compounds than those treated at high temperatures. Prior to be utilized for SSF and for the optimization of TP recovery, the BSG was characterized in terms its of moisture%, pH, total proteins, °Bx, and D-glucose content. In general, the main measured values are in the range of those found in the literature, and their variability could be attributed to the barley variety and the presence of different grains [28]. When gBSG was compared to wBSG, its moisture%, as expected, was 12% higher, while the other parameters were almost similar, in the range of statistical variability.

TPCs of wBSG and gBSG

TPs were recovered from BSG oven-dried at 80 °C; this step was carried out to increase the extraction yield, as reported in [5]. This temperature is below the critical value of 100 °C, under which phenolic compounds are stable without significative degradation [29]. The solid–liquid extraction was performed using ethanol/water (50:50, v/v), a low viscous solvent that allowed us to enhance the mass transfer and to promote the recovery of phenolics [30,31]. In this way, the obtained TPC was equal to 3.4 mg GAE/gDW for wBSG. Then, manually grinding the wet wBSG, a further improvement of 15% was obtained, corresponding to 4 mg GAE/gDW, a value in the range of that reported in [32] for a Pilsen beer (about 3 mg GAE/gDW).

4.2. BSG Physical Pre-Treatments for TPC Improvement

To investigate the possibility to increase the TPC, wBSG and gBSG were pre-treated using different physical techniques; with this purpose, before the solvent extraction, MWs and US, using a bath or probe, were applied to facilitate the release of TP bound to the cell wall components [8].
Independently of the applied pre-treatment, the TPC values of gBSG were always higher than those of wBSG, with an improvement in the range 8–17%.
MWs and US bath pre-treatments, which gave the lowest enhancement, were not investigated further. In this regard, even though the MW pre-treatment had the advantage of a reduced extraction time (1 min) and the lowest consumed energy (maximum of 48 kJ), it caused the heating of the BSG till 100 °C, with the temperature registered at the end of the treatment. Concerning this aspect, although the literature references about a temperature effect on polyphenol extraction are full of discrepancies, these compounds are generally reported as heat labile, and their thermal degradation is commonly described [33,34]. In regard to the US-assisted extraction, great differences were observed between that carried out in a bath or with a probe, which gave the highest TPC values. This can be explained by the fact that a US probe allows for direct contact between the sound waves and extraction solvent and enhances the extraction efficiency [7]. Furthermore, the US probe pre-treatment gave very similar results when maintained for 15 or 30 min (5.8 and 5.9 mg GAE/gDW): for this reason, considering the power consumption associated with the treatment (225 and 450 kJ for 15 and 30 min), the shorter time was chosen for all the subsequent experiments. In view of a scale-up of the obtained results, additional data related to the energy and chemical consumption of the whole extraction process are necessary, which is also discussed in [35].

4.3. TPC of wfBSG and gfBSG: Test 1

wBSG and gBSG have been applied as substrates for SSF in the presence of P. chrysosporium, in closed microcosms. The fungal ability to degrade the lignocellulosic matrix and, consequently, to improve TP release were evaluated [36]. As demonstrated through CO2 production, the ligninolytic fungus was able to grow on the substrate as is, whole or ground. In fact, as reported in [37], the water activity and moisture content of BSG are particularly suitable for the growth of filamentous fungi, which can penetrate with their hyphae between the particle spaces, see Figure 4b. During the time course of the incubation, the total protein content increased progressively, and in only 7 days of incubation, the highest laccase activity was measured in correspondence to the highest CO2 production rate.
During SSF, the synthesis of laccase promotes the degradation of the BSG structure and, consequently, facilitates the release of trapped TP [20]. As expected, from the results obtained applying by grinding on unfermented BSG, the TPC values of gfBSG were always higher than those of wfBSG: as reported in [3], the breakdown obtained during manual grinding of BSG improves the fungal exploitation of the ligninolytic substrate, facilitating TP detachment from vegetable cells and their recovery. In particular, the highest TPC, equal to 5 mg GAE/gDW, was obtained in only 10 days of incubation with gfBSG; this value is similar to that reported in [14] for A. oryzae (from 6 to 10 mg GAE/gDW, depending on the BSG composition) after 7 days of incubation.

4.4. Effect of US Probe Pre-Treatment on TPC of gfBSG: SSF Test 2

In test 2, SSF with P. chrysosporium was carried out at 30 °C, a temperature reported as optimal for the production of laccase [38]. The incubation was monitored for 21 days to explore a possible enhancement in TP release due to a prolonged fungal growth on BSG [39]; in fact, as reported in [40], lignin’s poor solubility limits the availability of phenols, while delignification due to the action of white-rot fungi aids in the liberation of these antioxidant molecules. Moreover, considering the improvement in TP extraction obtained with the US probe (see Section 2.5.2), the same pre-treatment was applied on gfBSG.
In test 2, both the maximum CO2 production rate and laccase activity were postponed and reached on the 10th day, 3 days later than in the test 1. In spite of this delay, comparable laccase activity values were measured (1.35 UI/L in test 1 and 1.32 in test 2).
On the 10th day, TPC (4.6 mg GAE/gDW), obtained in test 2 without the pre-treatment, was similar to that reached in test 1 (5 mg GAE/gDW), while when applying the US probe, an improvement of about 25% (6.1 mg GAE/gDW) was reached. In both cases, similar TPC values (6.5 mg GAE/gDW and 4.7 mg GAE/gDW, with and without the US probe pre-treatment, respectively) were maintained till the 21st day.
Comparing the main results obtained with grinding, fermentation, and the physical pre-treatment of BSG, it is possible to define the contribution of each single step in TP recovery. In particular, grinding and the US probe pre-treatment allowed us to obtain a total increase of 41% in the TPC (5.8 mg GAE/gDW). Moreover, coupling the solvent extraction with the US probe step with the fermentation of ground BSG, the enhancement in the TPC was equal to 51% in comparison with the TP extracted from BSG as is.

5. Conclusions

In the presented work, thawed BSG from a frozen stock was used as is or blade ground. Polyphenols were recovered by means of a solvent extraction applied after physical or biological pre-treatments. The best results were obtained in the presence of ground BSG. In particular, increasing values of extracted TPs were achieved with a US bath, MWs, SSF, and US probe. Finally, the US probe-assisted extraction, applied to the fermented–ground BSG, allowed us to achieve further improvement in TP recovery, maintaining the antioxidant properties.
Moving from lab-scale to industrial-scale application, further investigations are needed by integrating scientific data with energy and economic data. Moreover, in order to define the application field, a detailed analysis of the polyphenol composition will be necessary.

Author Contributions

Conceptualization, F.B.; methodology, C.M.; investigation, C.M.; data curation, F.B. and C.M.; writing—original draft preparation, F.B. and C.M.; writing—review and editing, F.B. and C.M.; supervision, F.B.; funding acquisition, F.B. All authors have read and agreed to the published version of the manuscript.

Funding

This study was funded by the European Union-Next Generation EU, Mission 4 Component 1.5-ECS00000036-CUP [E13B22000020001].

Data Availability Statement

All main data are available in the main text. Complementary information upon data used in the analysis are available on reasonable request to corresponding author.

Acknowledgments

Authors thank Ing. Davide Forna for providing the BSG applied in the research.

Conflicts of Interest

The authors declare no conflicts of interest.

Abbreviations

The following abbreviations are used in this manuscript:
°BxDegrees Brix
BSGBrewer’s spent grain
gBSGGround BSG
gfBSGGround fermented BSG
MEAMalt extract agar
MWMicrowave
OD600Optical density at 600 nm
SSFSolid-state fermentation
USUltrasound
wBSGWhole BSG
wfBSGWhole fermented BSG

References

  1. Xie, Z.; Dan, M.; Zhao, G.; Wang, D. Recent advances in microbial high-value utilization of brewer’s spent grain. Biores. Technol. 2024, 408, 131197. [Google Scholar] [CrossRef] [PubMed]
  2. Oyedeji, A.B.; Wu, J. Food-based uses of brewers spent grains: Current applications and future possibilities. Food Biosci. 2023, 54, 102774. [Google Scholar] [CrossRef]
  3. Aliyu, S.; Bala, M. Brewer’s spent grain: A review of its potentials and applications. Afric. J. Biotechnol. 2011, 10, 324–331. [Google Scholar]
  4. McCarthy, A.L.; O’Callaghan, Y.C.; Connolly, A.; Piggott, C.O.; FitzGerald, R.J.; O’Brien, N.M. Phenolic extracts of brewers’ spent grain (BSG) as functional ingredients—Assessment of their DNA protective effect against oxidant-induced DNA single strand breaks in U937 cells. Food Chem. 2012, 134, 641–646. [Google Scholar] [CrossRef]
  5. Guido, L.F.; Moreira, M.M. Techniques for Extraction of Brewer’s Spent Grain Polyphenols: A Review. Food Bioproc. Technol. 2017, 10, 1192–1209. [Google Scholar] [CrossRef]
  6. Moirangthem, K.; Koirala, P.; Maina, H.N.; Rai, D.K.; Coda, R. Impact of pre-treatments and bioprocessing on the carbohydrate and polyphenol profile of brewers’ spent grain. Food Bioprod. Process. 2024, 148, 62–71. [Google Scholar] [CrossRef]
  7. Dzah, C.S.; Duan, Y.; Zhang, H.; Wen, C.; Zhang, J.; Chen, G.; Ma, H. The effects of ultrasound assisted extraction on yield, antioxidant, anticancer and antimicrobial activity of polyphenol extracts: A review. Food Biosci. 2020, 35, 100547. [Google Scholar] [CrossRef]
  8. Birsan, R.I.; Wilde, P.; Waldron, K.W.; Rai, D.K. Recovery of Polyphenols from Brewer’s Spent Grains. Antioxidants 2019, 8, 380. [Google Scholar] [CrossRef] [PubMed]
  9. Moreira, M.M.; Morais, S.; Barros, A.A.; Delerue-Matos, C.; Guido, L.F. A novel application of microwave-assisted extraction of polyphenols from brewer’s spent grain with HPLC-DAD-MS analysis. Anal. Bioanal. Chem. 2012, 403, 1019–1029. [Google Scholar] [CrossRef] [PubMed]
  10. Carciochi, R.A.; Sologubik, C.A.; Fernández, M.B.; Manrique, G.D.; D’Alessandro, L.G. Extraction of Antioxidant Phenolic Compounds from Brewer’s Spent Grain: Optimization and Kinetics Modeling. Antioxidants 2018, 7, 45. [Google Scholar] [CrossRef] [PubMed]
  11. Iadecola, R.; Ciccoritti, R.; Ceccantoni, B.; Bellincontro, A.; Amoriello, T. Optimization of Phenolic Compound Extraction from Brewers’ Spent Grain Using Ultrasound Technologies Coupled with Response Surface Methodology. Sustainability 2022, 14, 3309. [Google Scholar] [CrossRef]
  12. Alonso-Riaño, P.; Ramos, C.; Trigueros, E.; Beltrán, S.; Sanz, M.T. Study of subcritical water scale-up from laboratory to pilot system for brewer’s spent grain valorization. Ind. Crops Prod. 2023, 191, 115927. [Google Scholar] [CrossRef]
  13. Lock, T.J.; Mah, S.H.; Lai, Z.W. Versatile Applications of Brewer’s Spent Grain: Solid-State Fermentation and Nutritional Added Value. Appl. Biochem. Biotechnol. 2024, 196, 5508–5532. [Google Scholar] [CrossRef] [PubMed]
  14. da Costa Maia, I.; Thomaz dos Santos D’Almeida, C.; Guimarães Freire, D.M.; d’Avila Costa Cavalcanti, E.; Cameron, L.C.; Furtado Dias, J.; Larraz Ferreira, M.S. Effect of solid-state fermentation over the release of phenolic compounds from brewer’s spent grain revealed by UPLC-MSE. LWT 2020, 133, 110136. [Google Scholar] [CrossRef]
  15. Lonsane, B.K.; Ghildyal, N.P.; Budiatman, S.; Ramakrishna, S.V. Engineering aspects of solid state fermentation. Enzym. Microb. Technol. 1985, 7, 258–265. [Google Scholar] [CrossRef]
  16. Mussatto, S.I.; Dragone, G.; Roberto, I.C. Brewers’ spent grain: Generation, characteristics and potential applications. J. Cereal Sci. 2006, 43, 1–14. [Google Scholar] [CrossRef]
  17. Cebrián, M.; Ibarruri, J. Filamentous fungi processing by solid-state fermentation. In Current Developments in Biotechnology and Bioengineering; Taherzadeh, M.J., Ferreira, J.A., Pandey, A., Eds.; Elsevier: Amsterdam, The Netherlands, 2023; pp. 251–292. [Google Scholar] [CrossRef]
  18. Dávila, J.A.; Rosenberg, M.; Cardona, A. A biorefinery approach for the production of xylitol, ethanol and polyhydroxybutyrate from brewer’s spent grain. AIMS Agric. Food 2016, 1, 52–66. [Google Scholar] [CrossRef]
  19. Leite, P.; Cátia Silva, C.; Salgado, J.M.; Belo, I. Simultaneous production of lignocellulolytic enzymes and extraction of antioxidant compounds by solid-state fermentation of agro-industrial wastes. Ind. Crops Prod. 2019, 137, 315–322. [Google Scholar] [CrossRef]
  20. Zeko-Pivač, A.; Bošnjaković, A.; Planinić, M.; Parlov Vuković, J.; Novak, P.; Jednačak, T.; Tišma, M. Improvement of the Nutraceutical Profile of Brewer’s Spent Grain after Treatment with Trametes versicolor. Microorganisms 2022, 10, 2295. [Google Scholar] [CrossRef]
  21. Tišma, M.; Žnidaršič-Plazl, P.; Šelo, G.; Tolj, I.; Šperanda, M.; Bucić-Kojić, A.; Planinić, M. Trametes versicolor in lignocellulose-based bioeconomy: State of the art, challenges and opportunities. Biores. Technol. 2021, 330, 124997. [Google Scholar] [CrossRef] [PubMed]
  22. Cervantes-Ramirez, J.G.; Vasquez-Lara, F.; Sanchez-Estrada, A.; Troncoso-Rojas, R.; Heredia-Olea, E.; Islas-Rubio, A.R. Arabinoxylans Release from Brewers’ Spent Grain Using Extrusion and Solid-State Fermentation with Fusarium oxysporum and the Antioxidant Capacity of the Extracts. Foods 2022, 11, 1415. [Google Scholar] [CrossRef]
  23. Mollea, C.; Bosco, F. Natural rubber biodegradation by Alternaria alternata and Penicillium chrysogenum isolates. Biorem. J. 2020, 24, 112–128. [Google Scholar] [CrossRef]
  24. Bucić-Kojić, A.; Šelo, G.; Zelić, B.; Planinić, M.; Tišma, M. Recovery of Phenolic Acid and Enzyme Production from Corn Silage Biologically Treated by Trametes versicolor. Appl. Biochem. Biotechnol. 2017, 181, 948–960. [Google Scholar] [CrossRef]
  25. Ravindran, R.; Jaiswal, S.; Abu-Ghannam, N.; Jaiswal, A.K. A comparative analysis of pretreatment strategies on the properties and hydrolysis of brewers’ spent grain. Biores. Technol. 2018, 248, 272–279. [Google Scholar] [CrossRef]
  26. Nagai, M.; Kawata, M.; Watanabe, H.; Ogawa, M.; Saito, K.; Takesawa, T.; Kanda, K.; Sato, T. Important role of fungal intracellular laccase for melanin synthesis: Purification and characterization of an intracellular laccase from Lentinula edodes fruit bodies. Microbiology 2003, 149 Pt 9, 2455–2462. [Google Scholar] [CrossRef] [PubMed]
  27. Samaras, T.S.; Camburn, P.A.; Chandra, S.X.; Gordon, M.H.; Ames, J.M. Antioxidant properties of kilned and roasted malts. J. Agric. Food Chem. 2005, 53, 8068–8074. [Google Scholar] [CrossRef] [PubMed]
  28. Jin, Z.; Lan, Y.; Ohm, J.B.; Gillespie, J.; Schwarz, P.; Chen, B. Physicochemical composition, fermentable sugars, free amino acids, phenolics, and minerals in brewers’ spent grains obtained from craft brewing operations. J. Cereal Sci. 2022, 104, 103413. [Google Scholar] [CrossRef]
  29. Liziad, A.; Palma, M.; Brigui, J.; Barroso, C.G. Investigation on phenolic compounds stability during microwave-assisted extraction. J. Chromat. 2007, 1140, 29–34. [Google Scholar] [CrossRef] [PubMed]
  30. Mojzer, B.E.; Knez Hrnčič, M.; Škerget, M.; Knez, Ž.; Bren, U. Polyphenols: Extraction Methods, Antioxidative Action, Bioavailability and Anticarcinogenic Effects. Molecules 2016, 21, 901. [Google Scholar] [CrossRef] [PubMed]
  31. Ajila, C.M.; Brar, S.K.; Verma, M.; Tyagi, R.D.; Godbout, S.; Valéro, J.R. Extraction and Analysis of Polyphenols: Recent trends. Crit. Rev. Biotechnol. 2010, 31, 227–249. [Google Scholar] [CrossRef]
  32. Santi Stefanello, F.; Obem dos Santos, C.; Bochi, V.C.; Burin Fruet, A.P.; Bromenberg Soquetta, M.; Dörr, A.C.; Nörnberg, J.L. Analysis of polyphenols in brewer’s spent grain and its comparison with corn silage and cereal brans commonly used for animal nutrition. Food Chem. 2018, 239, 385–401. [Google Scholar] [CrossRef] [PubMed]
  33. Antony, A.; Farid, M. Effect of Temperatures on Polyphenols during Extraction. Appl. Sci. 2022, 12, 2107. [Google Scholar] [CrossRef]
  34. Ince, A.E.; Sahin, S.; Sumnu, G. Comparison of microwave and ultrasound-assisted extraction techniques for leaching of phenolic compounds from nettle. J. Food Sci. Technol. 2014, 51, 2776–2782. [Google Scholar] [CrossRef] [PubMed]
  35. Zalazar-García, D.; Torres, E.; Rodriguez-Ortiz, L.; Deng, Y.; Soria, J.; Bucalá, V.; Rodriguez, R.; Mazza, G. Cleaner and sustainable processes for extracting phenolic compounds from bio-waste. J. Environ. Manag. 2020, 273, 111154. [Google Scholar] [CrossRef] [PubMed]
  36. Marcus, A.; Fox, G. Fungal Biovalorization of a Brewing Industry Byproduct, Brewer’s Spent Grain: A Review. Foods 2021, 10, 2159. [Google Scholar] [CrossRef] [PubMed]
  37. Muller dos Santos, M.; Souza da Rosa, A.; Dal’Boit, S.; Mitchell, D.A.; Krieger, N. Thermal denaturation: Is solid-state fermentation really a good technology for the production of enzymes? Biores. Technol. 2004, 93, 261–268. [Google Scholar] [CrossRef] [PubMed]
  38. Suryadi, H.; Judono, J.J.; Putri, M.R.; Eclessia, A.D.; Ulhaq, J.M.; Agustina, D.N.; Sumiati, T. Biodelignification of lignocellulose using ligninolytic enzymes from white-rot fungi. Heliyon 2022, 8, e08865. [Google Scholar] [CrossRef] [PubMed]
  39. Dey, T.B.; Chakraborty, S.; Jain, K.K.; Sharma, A.; Kuhad, R.C. Antioxidant phenolics and their microbial production by submerged and solid state fermentation process: A review. Trends Food Sci. Technol. 2016, 53, 60–74. [Google Scholar] [CrossRef]
  40. Bilal, M.; Asgher, M.; Iqbal, H.M.N.; Hu, H.; Zhang, X. Biotransformation of lignocellulosic materials into value-added products—A review. Int. J. Biol. Macromol. 2017, 98, 447–458. [Google Scholar] [CrossRef]
Figure 1. SSF set-up in closed microcosm with gBSG.
Separations 12 00058 g001
Figure 2. Flow chart of the experimental procedures to recover TPs: continuous lines for whole BSG and dashed lines for grinded BSG. Blue lines without biological and physical pre-treatments, green lines with biological pre-treatment and red lines with physical pre-tretaments.
Separations 12 00058 g002
Figure 3. TPCs of pre-treated wBSG (white bars) and gBSG (black bars). Red lines indicate TPCs obtained without pre-treatment (continuous = wBSG, 3.4 mg GAE/gDW; dashed = gBSG, 4 mg GAE/gDW). “**” for p < 0.01, “***” for p < 0.001.
Separations 12 00058 g003
Figure 4. CO2 production rate and °Bx for wfBSG and gfBSG (a). The growth of P. chrysosporium onto gfBSG on the 7th day of incubation is shown in picture (b). At each incubation time, the statistical significance between wfBSG and gfBSG for °Bx and the CO2 rate is reported (“ns, “*”, “**”, and “****”).
Separations 12 00058 g004
Figure 5. TPCs of wfBSG and gfBSG. Red lines indicate the TPC of the control wBSG, 3.4 mg GAE/gDW (continuous), and the control gBSG, 4 mg GAE/gDW (dotted).
Separations 12 00058 g005
Figure 6. CO2 production rate, °Bx, and D-glucose of gfBSG.
Separations 12 00058 g006
Figure 7. TPC of gfBSG, pre-treated or not with the US probe applied at 250 W for 30 min. Red continuous line indicates TPC of control gBSG extracted without pre-treatments = 3.7 mg GAE/gDW; dotted red line indicates TPC of control gBSG extracted with the US probe pre-treatment = 4.9 mg GAE/gDW. “*” for p < 0.05, “**” for p < 0.01, “***” for p < 0.001.
Separations 12 00058 g007
Table 1. Microcosm set-up in SSF test 1 (A) and test 2 (B).
(A)
SSF Test 1
Abiotic ControlsBiotic Samples
BSG Type (40 g)Control wBSGControl gBSGwfBSGgfBSG
Inoculumwater
(3 mL)
standardized inoculum
(3 mL)
Temperature39 °C (till the 2nd day), shift to 30 °C (till the 10th day)
Duration10 days
(B)
SSF Test 2
Abiotic ControlsBiotic Samples
BSG type (40 g)Control gBSGgfBSG
Inoculumwater
(3 mL)
standardized inoculum (3 mL)
Water added to gBSG2 mL2 mL
Temperature30 °C
Duration21 days
Table 2. Main parameters of wBSG, gBSG, and BSG extracts (* values referred to the water extract; ** values referred to TP solvent extraction).
ParameterswBSGgBSG
Moisture%62 ± 2% 74.3 ± 3%
pH *5.4 ± 0.35.8 ± 0.2
Total proteins *, g/gDW0.009 ± 0.001 0.01 ± 0.001
°Bx *0.26 ± 0.20.30 ± 0.1
D-glucose *, g/L2.052.08
TPC **, mg GAE/gDW3.4 ± 0.24 ± 0.2
Table 3. TPCs (mg GAE/gDW) of wBSG and gBSG submitted to pre-treatments compared to controls.
wBSGgBSG
Without Pre-Treatment3.4 ± 0.414.0 ± 0.52
Pre-TreatmentPower (W)Time (Min)
MW40013.7 ± 0.454.0 ± 0.56
8004.0 ± 0.514.8 ± 0.61
US bath550203.6 ± 0.424.0 ± 0.49
403.5 ± 0.414.1 ± 0.50
US probe250154.8 ± 0.505.8 ± 0.70
305.0 ± 0.605.9 ± 0.66
Table 4. (A) Moisture%, pH, (B) total proteins, and laccase activity of wfBSG and gfBSG.
(A)Moisture%pH
DaywfBSGgfBSGwfBSGgfBSG
062.3 ± 377.3 ± 46.01 ± 0.276.12 ± 0.29
475.1 ± 3.678.3 ± 4.56.07 ± 0.306.14 ± 0.29
777.2 ± 478.2 ± 4.76.13 ± 0.286.44 ± 0.36
1077.3 ± 479.0 ± 46.12 ± 0.296.22 ± 0.31
(B)Total Proteins (g/gDW)Laccase (UI/L)
DaywfBSGgfBSGwfBSGgfBSG
00.01 ± 0.00160.01 ± 0.001900
40.014 ± 0.00220.020 ± 0.00320.025 ± 0.00790.036 ± 0.0057
70.021 ± 0.00340.027 ± 0.00431.21 ± 0.00851.35 ± 0.0099
100.023 ± 0.00400.032 ± 0.00510.90 ± 0.00661.12 ± 0.0019
Table 5. Moisture%, pH, total protein, and laccase activity values obtained during 21 days of SSF with gfBSG.
Moisture%pHTotal Proteins (g/gDW)Laccase
(UI/L)
Day
071.4 ± 3.85.6 ±0.270.012 ± 0.00190
776.9 ± 2.84.6 ± 0.340.019 ± 0.00271.09 ± 0.0050
1077.4 ± 2.94.9 ± 0.330.025 ± 0.00321.32 ± 0.0039
1578.7 ± 3.74.7 ± 0.290.033 ± 0.00291.07 ± 0.0061
2181.2 ± 2.55.8 ± 0.310.032 ± 0.00410.85 ± 0.0044
Disclaimer/Publisher’s Note: The statements, opinions and data contained in all publications are solely those of the individual author(s) and contributor(s) and not of MDPI and/or the editor(s). MDPI and/or the editor(s) disclaim responsibility for any injury to people or property resulting from any ideas, methods, instructions or products referred to in the content.

