Article

Critical Insights into Untargeted GC-HRMS Analysis: Exploring Volatile Organic Compounds in Italian Ambient Air

1
Institute of Atmospheric Pollution Research (CNR-IIA), National Research Council of Italy, Via Salaria Km 29.3, Monterotondo, P.O. Box 10, 00015 Rome, Italy
2
Norwegian Institute for Air Research (NILU), Fram Centre, Hjalmar Johansens Gate 14, 9007 Tromsø, Norway
*
Author to whom correspondence should be addressed.
Separations 2025, 12(2), 35; https://doi.org/10.3390/separations12020035
Submission received: 30 December 2024 / Revised: 24 January 2025 / Accepted: 30 January 2025 / Published: 2 February 2025

Abstract

:
This study critically examines the workflow for untargeted analysis of volatile organic compounds (VOCs) in ambient air, from sampling strategies to data interpretation by using GC-HRMS. While untargeted approaches are well-established in liquid chromatography (LC) due to advanced-deconvolution tools and extensive metabolomic libraries, their application in gas chromatography (GC) remains less developed, particularly for VOCs. The high structural isomerism of VOCs and the relative novelty of GC-based untargeted methodologies present unique challenges, including limited software tools and reference libraries. Air samples from suburban and rural sites in central Italy were analyzed to explore chemical diversity and address methodological gaps. This study evaluates critical decisions, such as sampling strategies, extraction techniques, and data-processing workflows, highlighting the limitations of automated deconvolution tools and the need for manual validation. Results revealed distinct source contributions, with suburban areas showing higher levels of anthropogenic compounds and rural areas dominated by biogenic emissions. This work underscores the potential of GC-HRMS untargeted analysis to advance environmental chemistry, while addressing key pitfalls and providing practical recommendations for reliable application. By bridging methodological gaps, it offers a roadmap for future studies aiming to integrate untargeted and targeted approaches in air quality research.

1. Introduction

The analysis of environmental samples has traditionally relied on targeted detection methods, focusing on the identification and quantification of a predefined list of compounds based on their known chemical structures (e.g., organohalogen compounds, phenols, hydrocarbons, polycyclic aromatic hydrocarbons) [1,2]. While effective for monitoring specific substances of concern to protect human health and the environment [3,4,5], these methods are inherently limited, as they exclude compounds not included in the targeted list.
Targeted analyses are typically employed for monitoring regulated pollutant levels or evaluating compliance with environmental standards. This approach was designed to ensure reliable identification and precise quantification of substances that pose known risks.
Advancements in analytical techniques, particularly in High-Resolution Mass Spectrometry (LC or GC-HRMS), have facilitated the adoption of untargeted analysis, which offers a comprehensive exploration of a sample’s chemical profile without predefined constraints. While LC-based untargeted analysis is well-established and supported by advanced-deconvolution software and extensive metabolomics libraries, GC-based untargeted analysis remains comparatively younger, with less-developed software tools and reference libraries. New software and updated libraries enable faster deconvolution of chromatograms, a process that previously had to be performed manually. This innovative approach allows for the detection and identification of a wide range of substances, including previously uncharacterized compounds, making it a powerful tool in environmental, chemical, and biological research. Recent works emphasize the significance of untargeted approaches in urban and remote air quality GC studies [6]. Moreover, in the realm of compounds analyzable via GC, volatile organic compounds (VOCs) have been rarely studied using untargeted approaches. This is due to the high structural isomerism characterizing VOCs, which introduces significant analytical challenges. Isomers often share similar mass spectra, making their differentiation and identification particularly complex. This inherent complexity, coupled with the relative novelty of untargeted GC methodologies, has limited the widespread application of this approach to VOCs in the existing literature, highlighting a potential gap in research.
Untargeted analysis is particularly relevant for understanding complex chemical systems, including emerging pollutants and reaction products in the context of climate change and atmospheric processes. Unlike previous studies that primarily relied on single-target methodologies, untargeted approaches integrate advanced GC-HRMS software, deconvolution strategies, and bibliographic cross-validation, specifically tailored to complex environmental matrices.
Despite its potential, untargeted analysis presents challenges, particularly in achieving accurate compound identification. Automated deconvolution tools, such as TraceFinder, often report high identification rates, but these can be skewed by false positives and redundancies [7]. Strategies like retention time indexing using alkane injections have proven effective in reducing errors, yet persistent limitations highlight the need for additional validation protocols to ensure reliability. The analysis of untargeted methodologies reveals several key challenges. The reliance on automated tools often leads to inconsistencies, as seen in studies using GC-MS for geographical discrimination of food products like shrimp paste [8]. Integration of multivariate statistics, such as PCA and OPLS-DA, has been shown to enhance differentiation but still requires significant manual intervention. Similarly, metabolomic studies on Vanilla planifolia demonstrated the importance of combining complementary platforms (LC-MS and GC-MS) to achieve comprehensive metabolite characterization, but highlighted limitations in data standardization across platforms [9].
Research on Flos Trollii and postmortem metabolomics [10,11] further illustrates variability in data interpretation. The integration of chemometric methods, while enhancing model reliability, necessitates careful standardization of sample preparation and processing pipelines. Disparities in analytical workflows across studies suggest the need for unified guidelines to mitigate biases inherent in untargeted approaches.
In this study, we developed and critically evaluated a stepwise methodology for untargeted analysis of complex environmental matrices. Our approach combines advanced GC-HRMS capabilities with optimized deconvolution and substance-specific verification techniques to overcome the limitations of automated workflows. The objectives of this work include: (i) designing a rigorous experimental framework for the sampling campaign, (ii) refining analytical and deconvolution parameters, (iii) ensuring reliable structural identification through bibliographic cross-validation, and (iv) characterizing the chemical diversity of the analyzed samples. By addressing these aspects, this study establishes a comprehensive framework for untargeted analysis, bridging the gap between traditional and innovative methodologies while highlighting its potential for environmental and atmospheric research. A real case study was used as a pilot to demonstrate how the approach for untargeted VOC analysis was addressed. No statistical tools were applied, as the focus of this work is not on data reprocessing but rather on obtaining the data, to which statistical tools may eventually be applied.

2. Materials and Methods

2.1. Standard Solutions and Solvents

The pentane, acetone, and methanol used for the elution of the cartridges were supplied by Romil and were of ultrapure grade. The internal standards used included 1,3-Diisopropylbenzene-D18 (C12D18) solution in methanol at 0.501 ng/µL (99 atom % D, min 98% Chemical Purity by CDN isotope). Two VOC standard solutions were employed for the evaluation of Retention Indices (RI), specifically the 54 Component Volatile Organic Combination Mix supplied by High-Purity Standards and the VOC ACCU 502 provided by AccuStandard (Table S3 and S4). The C8-C40 alkane solution used for comparison with retention times from a library is the Alkanes Mix C8-C40 (0.5 mg/mL in hexane) provided by AccuStandard.

2.2. Sampling

Three ambient air samplings were carried out during the summer 2021 in Italy. Two samplings were carried out at the European Monitoring and Evaluation Program, EMEP station of the National Research Council of Italy (CNR) in Montelibretti (sampling codes: 1E and 2E), located 42.1057162° N; 12.6401324° E and 49 m above sea level (a.s.l.), a site classified as a background area. The third sample was collected in a mountain area of the Umbrian Apennines (PG) at 42.9969673° N; 12.8293152° E; and 795 m a.s.l. (sampling code: U). This site was specifically chosen for its remote and uninhabited characteristics, featuring low levels of pollution. Twelve cartridges, each containing 0.25 g of inert modified styrene-divinylbenzene copolymer (EVOLUTE® EXPRESS ABN) were used, as described in Warner et al., 2020 [12]. Sampling was conducted by using two Silent Fai samplers (A and B) operating in parallel at a flow rate of 0.5 m3/h for 72 h. To evaluate the completeness of sorption of a priori unknown analytes, one sampler served for enrichment and the other as a control. Each sampling used four cartridges: one cartridge for sampler A, which was unchanged throughout the 72 h sampling period (1E72, 2E72 and U72); two cartridges for sampler B, with one used for the first 48 h (1E48, 2E48, U48) and another for the subsequent 24 h (1E24, 2E24 and U24); and one cartridge as a field blank. Details of the samplings are reported in Table S1. The sampled cartridges were stored at −20 °C until analysis [12].

2.3. Extraction and Clean-Up

The extraction solvents were selected based on their polarity, with volumes three times the dead volume of each sampling cartridge.
Samples were extracted via solvent elution using a standard protocol developed at NILU for air sample screening [12]. All operations were conducted in a cleanroom with personnel wearing protective pre-cleaned overalls and avoiding personal care products to minimize contamination. Cartridges were eluted in three sequential fractions of 4 mL each:
(i) Pentane, non-polar fraction. (ii) Acetone, medium polar fraction. (iii) Methanol, polar fraction.
After elution, the internal standards were added as follows: pentane fraction, 20 µL of the C12D18 solution.
The pilot study will examine only the first fraction as an example. The same approach will be applied to the other two.
From the pentane fraction, 200 µL were directly transferred to an injection vial, while the remaining solution for targeted analysis was concentrated under a gentle nitrogen stream on a hot-plate at 28 °C.

2.4. Instrumental Analysis

The study focused on the composition of the pentane fraction, analyzed using GC-HRMS (Q-Exactive Orbitrap, GC Trace1310, ThermoFisher, Waltham, MA, USA). A non-polar column, the TG-5SilMS (30 m, ID 0.25 mm, film thickness 0.25 µm, ThermoFisher, Waltham, MA, USA), was used with a helium flow rate of 1.2 mL/min. The SSL injector was set at 250 °C, and the GC program included a ramp from 40 °C (10 °C/min) to 210 °C, followed by a second gradient from 30 °C/min to 300 °C, held for 8.5 min. The resolution was set to 120 k, and the Automatic Gain Control (AGC) was set at 106, acquiring full-scan profile mode data within a 50–750 m/z range. The solution of alkanes was injected using the same instrumental method applied to the samples, and the retention time (RT) values obtained, which will be used for indexing, are reported in Table S2.
A VOC standard solution, specifically the High-Purity Standards—54 Component Volatile Organic Combination Mix (Table S3), was analyzed in the laboratories of the Institute of Atmospheric Pollution Research (CNR-IIA) in Montelibretti using an Rxi-624Sil MS semi-polar column (30 m, ID 0.25 mm, film thickness 1.40 µm, Restek Corporation, Bellefonte, PA, USA). The instrument employed was a thermal-desorption system coupled with gas chromatography-mass spectrometry (TD/GC/MS), utilizing liquid nitrogen for analyte cryofocusing and GC oven cooling.

2.5. Deconvolution and Library Search

Chromatograms obtained from the instrumental analysis, including three blanks per site and nine collected samples, were grouped into a single batch for software processing. The batch was deconvoluted using the Deconvolution Plugin in TraceFinder 4.1 (ThermoFisher, Waltham, MA, USA, 2016). Data processing was performed using TraceFinder version 4.1 equipped with the Deconvolution plugin version 1.7 (Thermo Fisher Scientific, Waltham, MA, USA, 2021). Subsequently, retention time (RT) alignment of the peaks identified in each sample was performed. The batch was then processed with the Unknown function in TraceFinder.

2.5.1. Deconvolution Plugin—Settings

The following parameters have been set. An accurate mass tolerance of 5 ppm, the m/z signal-to-noise threshold of 40, the TIC intensity threshold of 100 and an ion overlap of 99% were used. The RT alignment was performed using the “all ions” setting with an RT window of 10 s. A search index (SI) threshold of 500 was applied for fragment annotation. The libraries used for this analysis included: GC Orbitrap Contaminants library, GC Orbitrap environmental library, GC Orbitrap Pesticides library, GC Orbitrap PCBs library, Mainlib, NIST_ri, and Replib.

2.5.2. Unknown Screening—Settings

For the unknown screening, the peak detection parameters were configured to include a signal-intensity threshold ranging between 103 and 1011, and a peak width between 0.5 and 1.0 min, with no retention time (RT) shift applied. The library search settings employed a retention time window of 30 s and a mass tolerance of 2 ppm, with alignment and gap filling applied to all detected peaks. A threshold of 250 was set for both the search index (SI) and the reverse search index (RSI), with a probability threshold of 10 to ensure accuracy in compound identification. Classical search parameters targeted the m/z value, using a precursor tolerance of 0.5 m/z and a fragment tolerance of 5.00 m/z, alongside a score threshold of 80 to validate identifications. The same libraries used for deconvolution were employed for this process. Peak detection was performed using the Avalon algorithm, which applied the “nearest retention time” method to enhance alignment precision.

2.6. Selection of Major Components for Identification and Quantification

The deconvoluted batch underwent retention-time alignment, and compounds with the highest areas present in all samples collected from the same area (Umbria samples or EMEP samples) and absent in the blanks were selected. The final list for the identification study included the first 40 peaks from the ’Unknown’ function that met these criteria. These peaks were then compared with the identifications obtained from the ’Deconvolution’ list.

2.7. Semi-Quantitative Analysis

A semi-quantitative analysis was performed to assess the efficiency of the sampling. Chromatograms from all samples were processed, and the peaks corresponding to compounds identified with high confidence (as detailed in the Section 3) were integrated using the m/z signals assigned during deconvolution in TraceFinder.
The semi-quantitative comparison was conducted by normalizing the peak areas to the area of the C12D18 internal standard, according to Equation (1):
AX × 100/AC12D18 × V
where AX represents the area of compound x, AC12D18 is the area of the internal standard, and V denotes the volume of air sampled. For parallel samples collected over 48 h and 24 h, the total air volume was calculated as the sum of the volumes sampled during these periods.
For each site, the results obtained from the 72 h continuous sampling performed with sampler A were compared with those from the parallel sampler B, which combined data from the two cartridges collected over the 48 h and 24 h intervals.

3. Results

The method for GC-untargeted analysis must account for different aspects and cannot be considered merely as an accessory to targeted analysis. From sampling location, adsorbent choice, sampling flow and duration, to laboratory processing, extraction methods (solvents and/or procedures), and instrumental setup (including column type, injection type, oven temperature ramps), every step directs the analysis. It is thus impossible to approach untargeted analysis without a preliminary idea, albeit general, of the chemical class or properties of the compounds of interest, chosen based on the sampling site [13]. Presumed contamination levels and potential site-specific pollutants must guide the choice of sampling approach—active or passive—the selection of adsorbent, flow rates, sampling duration, and the season for conducting the sampling. Careful consideration must also be given to blanks and potential analyte loss. The instrumental technique available and the level of enrichment required to ensure analyte detection further influence the methodology. Laboratory extraction and processing must involve the least manipulation possible to avoid the loss of crucial information. Often in untargeted analysis, the approach is hypothetical, and refining the method requires the use of isotopically labeled standards for recovery evaluation and repeated sampling and extraction. The instrumental method, as mentioned, will be tailored to the chosen untargeted class or group. Once chromatograms are acquired, a frequently underestimated step involves the setup of deconvolution and library searches. The construction of the batch to be deconvoluted must be weighted and homogeneous, containing duplicates to verify results, and blanks to exclude artifacts. The batch design determines the scope of the untargeted analysis, e.g., site characterization or profiling of a pollutant class. Subsequently, parameters for deconvolution—such as library type, reference parameters (e.g., alkane injections for retention index calibration), and limits—must be carefully evaluated in the absence of harmonized protocols [14].
After generating a compound list, a strategy to discriminate false positives and eliminate non-identified compounds must be adopted. This requires examining compound structure, mass fragments, potential isomers, compound properties (e.g., retention time), literature research, and comparison with previous studies. Quantitative or semi-quantitative evaluation and contextualization in terms of the sampling site, laboratory processing, and instrumental method are essential to assess the compound’s plausibility and presence. Furthermore, the compound’s impact and relevance must be evaluated concerning regulatory and scientific contexts.
The following sections focus on the key aspects of the untargeted analysis of VOC compounds via GC-HRMS, explained through a critical approach to a real sampling design specifically tailored for this purpose.

3.1. Major Components Identified

After deconvoluting the entire batch and performing time alignment, a total of 4146 compounds were detected. The first 40 peaks from the ‘Unknown screening’ function were compared with the identifications obtained from the ‘Deconvolution’ list. The comparison led to the exclusion of some of the 40 chosen compounds for a final list to be studied comprising a total of 35 peaks, (which includes all identifications found in each sample for the same retention time (RT) and mass-to-charge ratio (m/z)). Two additional peaks (N°. 3 and 4), not identified by the software but manually added, were included, bringing the total to 37 peaks as reported in Table 1.

3.2. Semi-Quantitative Analysis

As included in the methods section, this step was explicitly designed to evaluate the sampling approach and allowed for a comparative analysis of the samples. The results from two sampling sites, EMEP (1E and 2E) and Umbria (U), which exhibited different concentrations and compound distributions, were analyzed and compared.
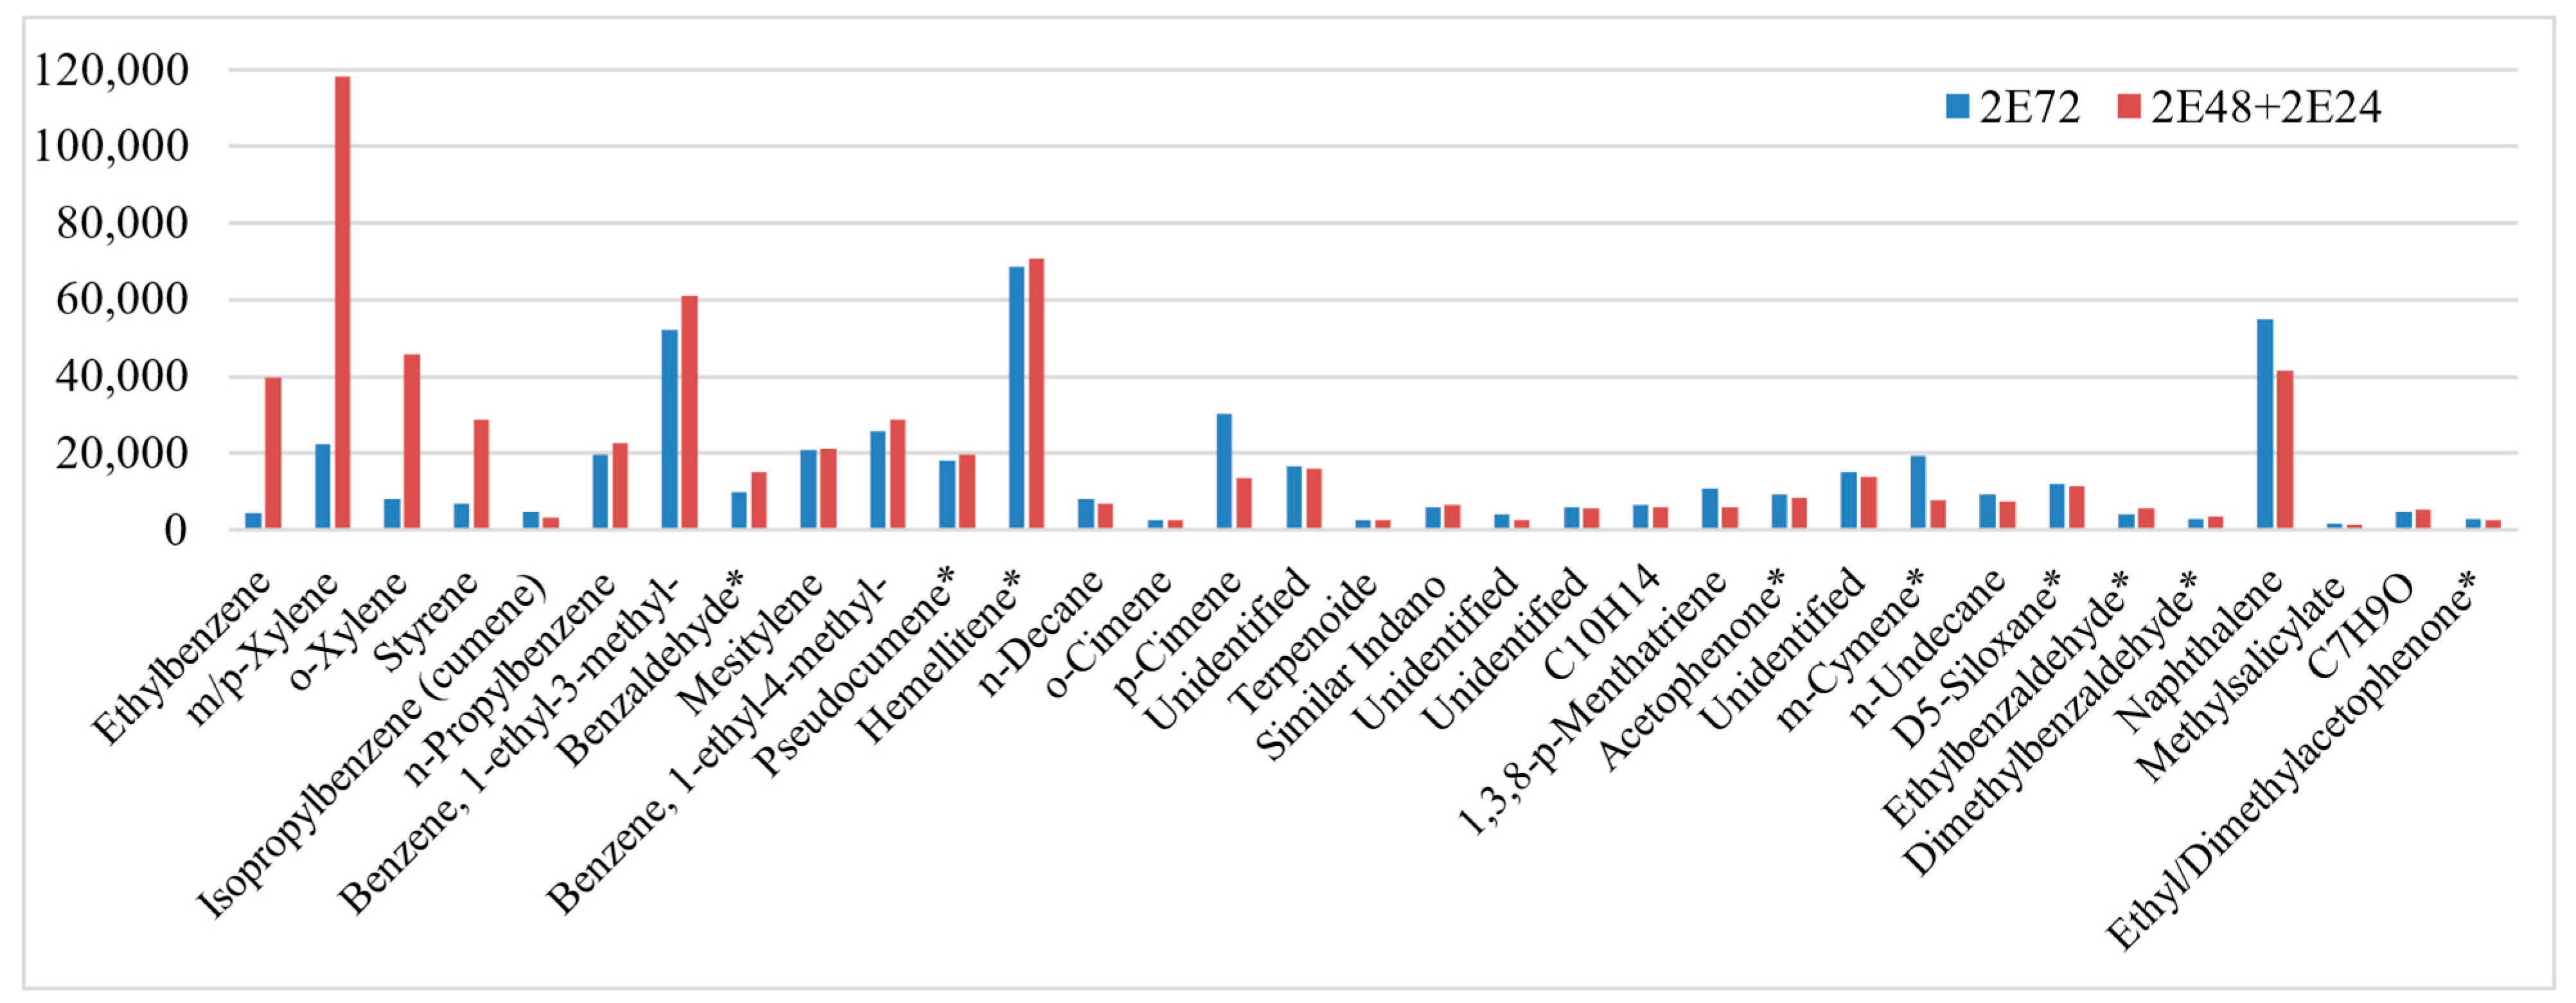
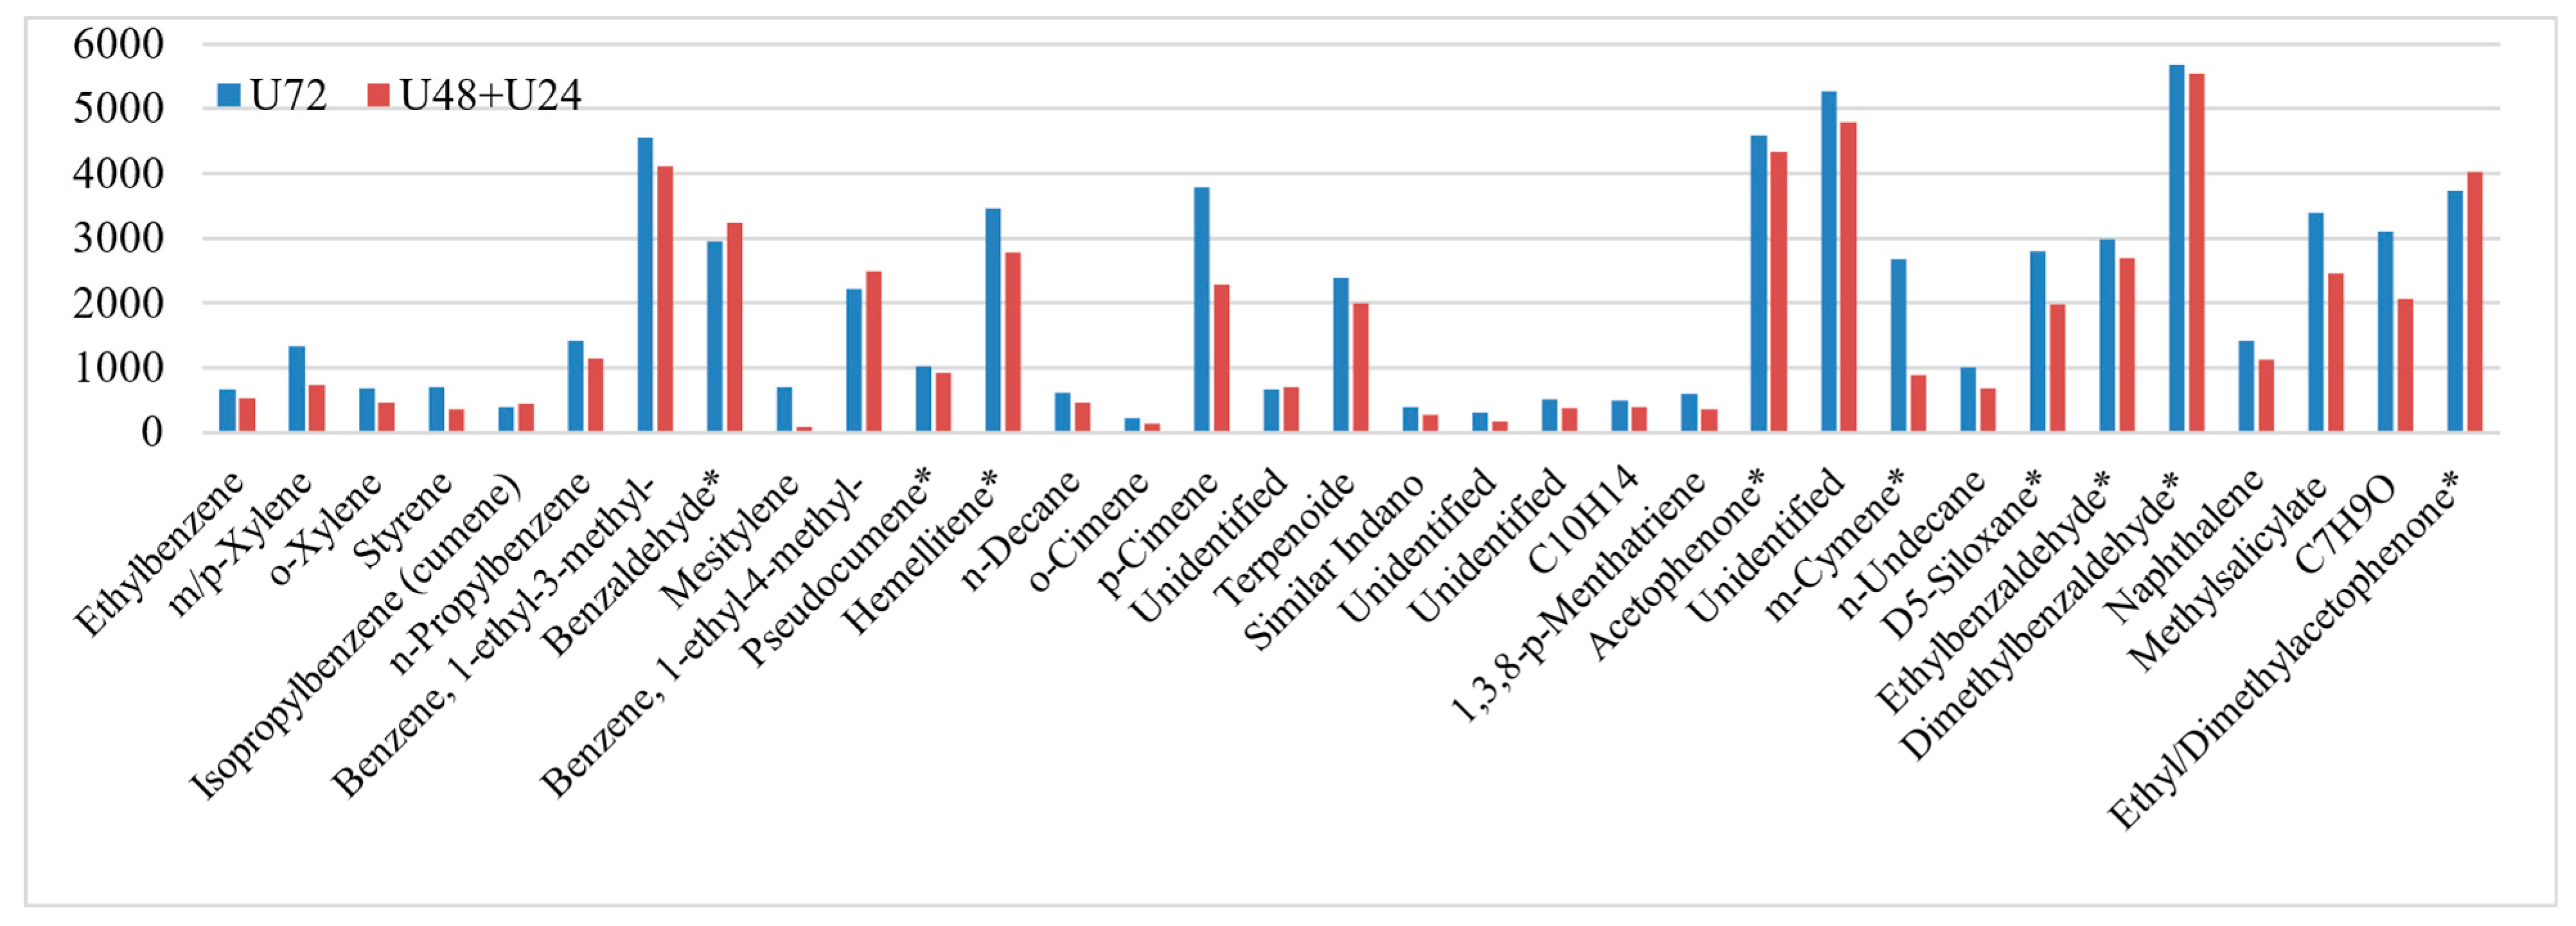
Below are the semi-quantitative analyses (expressed as reported in Equation (1)). The histograms below refer to the three sampling campaigns (1E, 2E, and U). For each compound, the normalized concentration relative to the standard in the 3-day samples is compared with that in the 48 h + 24 h parallel samples (Figure 1, Figure 2 and Figure 3).
Of the 37 most intense peaks identified by the software and reported in Table 1, 33 peaks are presented. The following were excluded: artifacts (N° 8 and 10), peak N° 13, (which was challenging to quantify due to its proximity in retention time (RT) to peak N° 11), and peak N°. 35 (which requires further verification in the literature and matches peak N° 37, which was retained).
In Figure 4, the distribution of pollutants among the identified compounds is shown. Of the 33 compounds reported in Figure 1, Figure 2 and Figure 3, the unidentified ones (N° 19, 22, 23, and 27) were excluded, resulting in a total of 29 compounds.
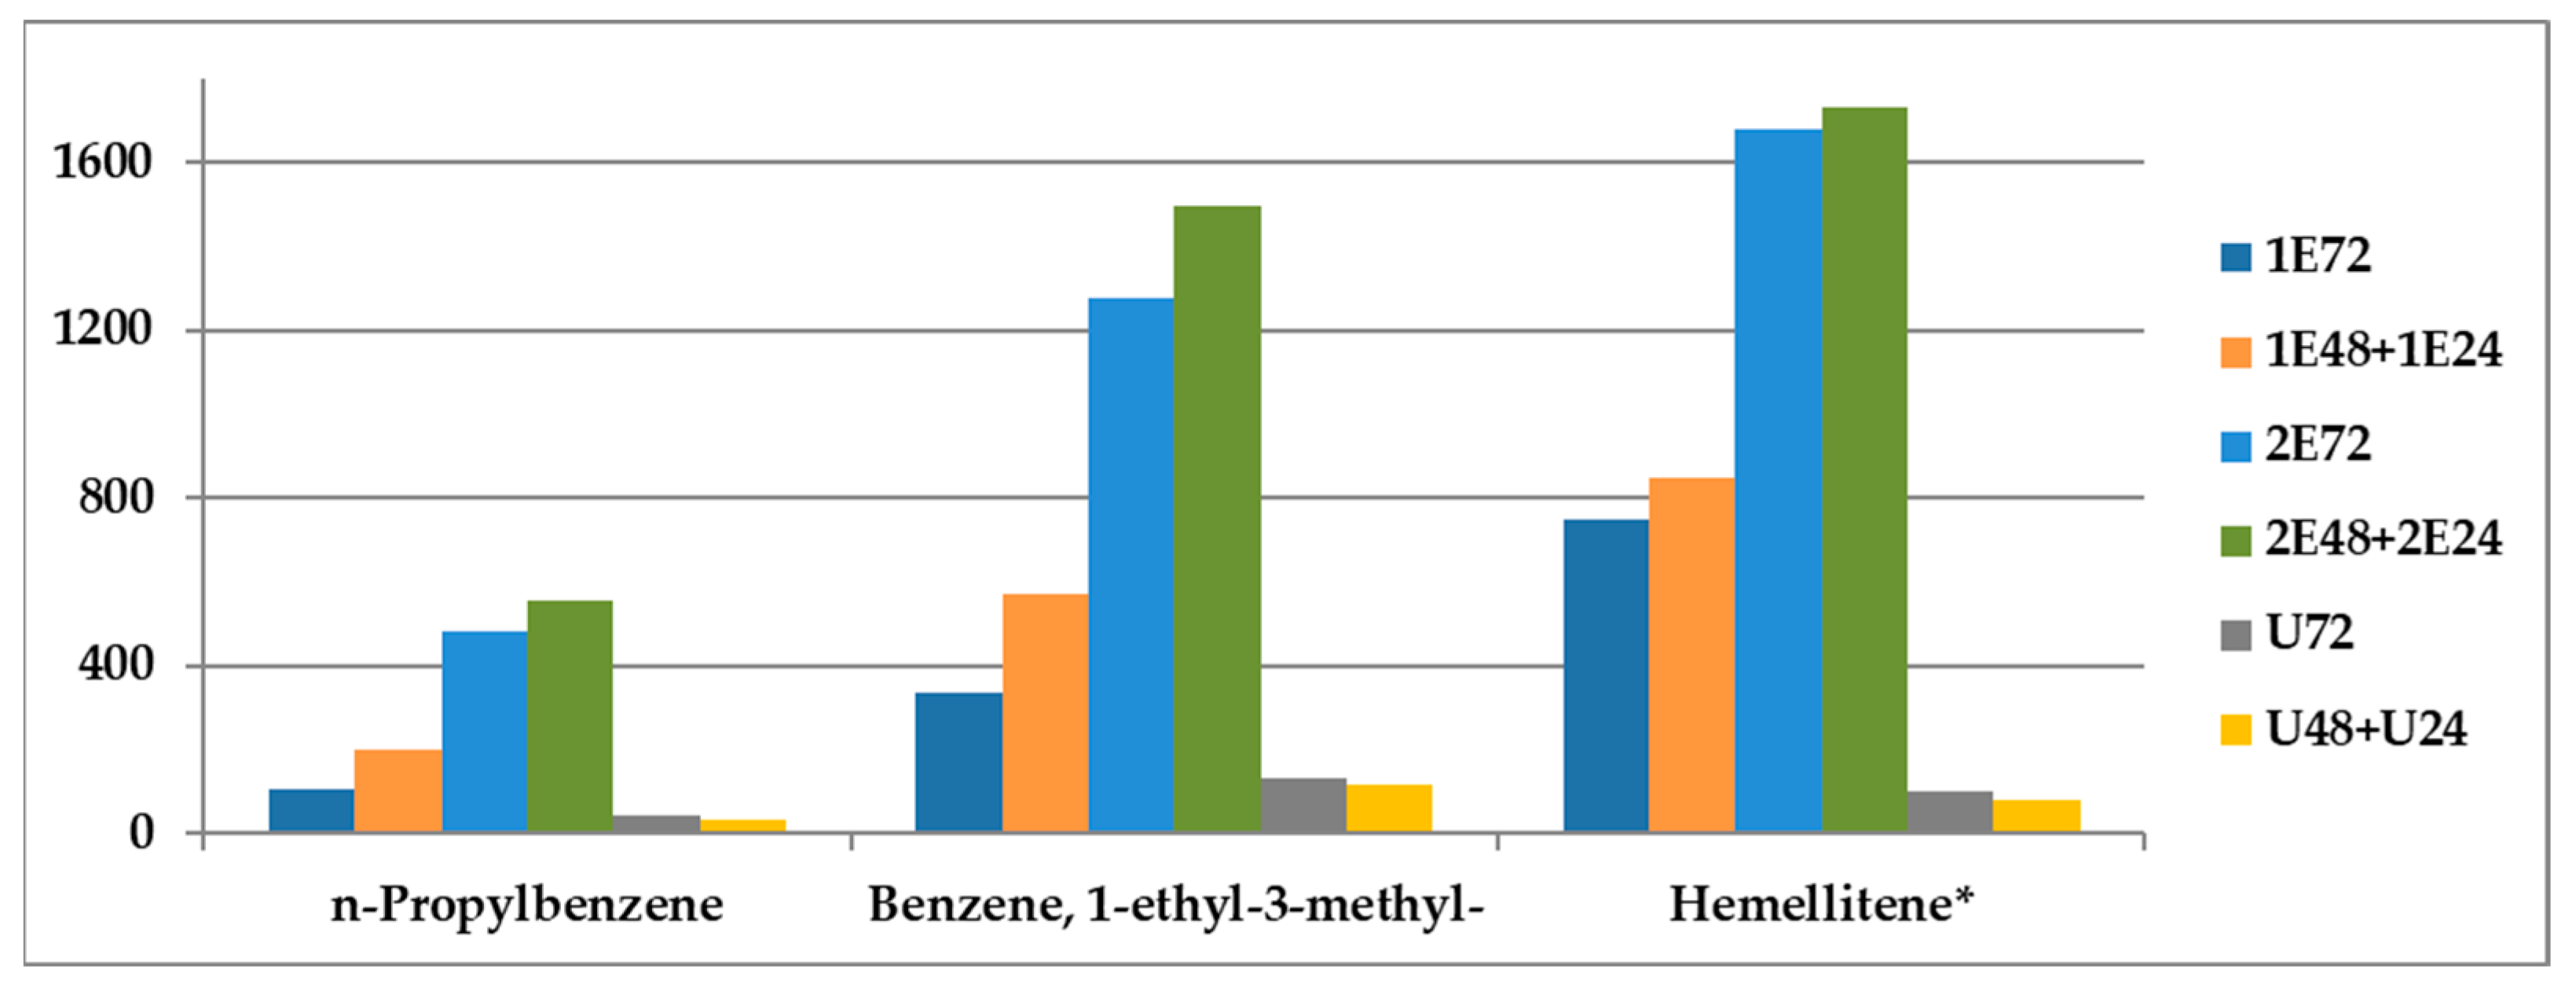
Comparisons of 3-day samples with their respective 48 h + 24 h parallel samples, normalized to 100, are reported. Figure 5 provides a focus on some key compounds and compares parallel samples (3 days vs. 48 h + 24 h).

4. Discussion

4.1. Selection of Sampling Sites, Sampler and Sampling

The sampling locations were chosen based on the presumed moderate to high level of pollution to avoid sample clean-up and retain sample integrity for non-target analysis.
The air samplings were carried out using the procedure already tested by NILU in the context of other projects in the arctic areas [12]. The cartridges adopted had a stationary phase as generic as possible, ABN or Acidic Basic Neutral, covering all types of compounds. Concerning the sampling, the cartridge of sampler A was maintained throughout the sampling. The replacement of the cartridge in the parallel sampler B was carried out to check for any loss of analytes from the adsorbent during sampling (breakthrough phenomenon). If the amount of compound X detected on the cartridge of sampler A is comparable to total amount of the same compound on the two cartridges of sampler B, it means that compound X has not undergone a breakthrough or degradation. The sampled cartridges were stored at a temperature of −20 °C, considering the volatility and reactivity of the compound classes addressed in the paper. According to the recommendations for VOC standard mixtures, storage temperatures are generally around −5 °C [15]. Additionally, EPA TO-17, dedicated to thermal-desorption analysis, suggests maintaining samples from 0 °C to 6 °C to preserve the integrity of labile and reactive compounds [16]. Similarly, EPA 16000-5, which outlines sampling strategies for VOCs in indoor environments, emphasizes the importance of controlled conditions to prevent chemical alterations in the samples [17].
Based on the synthesis of these guidelines and internal laboratory practices, −20 °C was selected as the optimal storage temperature to ensure the stability of the most volatile and reactive compounds.

4.2. Feasibility, Prospects and Limitations of Analysis of Full-Scan High-Resolution Electron Ionization Accurate Mass Chromatograms

Typically, the study of untargeted compounds involves two distinct stages: the first is the screening process, as described in this work, and the second is focused on identified compounds, where a targeted analytical method is developed and optimized. Sample collection plays a critical role in compound quantification, taking into account climatic factors such as temperature, humidity, and matrix effects, all of which can influence adsorbents, sampling duration, compound degradation, atmospheric reactions, breakthrough, volatility, and the physical and chemical properties of the compounds. Consequently, after collecting samples using generic cartridges, it becomes necessary to identify and, if applicable, validate suitable methods.
In this study, the cleanup process was deliberately limited to avoid compound degradation, although interferences posed challenges for compound identification. Similar to sampling, the cleanup process must be tailored to the compound class and designed to minimize interference. One particularly delicate step is solvent evaporation, which might be necessary to concentrate compounds of low abundance but adversely affects more volatile compounds.

4.3. Optimization of Deconvolution Methods

Deconvolution and screening processes require the construction of batches tailored to the research objective (e.g., compound class). Constructing large batches with many samples does not simplify the process; rather, it makes identifying compounds more challenging. Specifically, to characterize the geographical footprint of a site, the batch should include only samples from that area. Conversely, to study the migration, persistence, or impact of compound classes originating from one area on surrounding regions, the batch may include samples from multiple geographical zones. It is also crucial to include both field and laboratory blanks in the deconvolution study. To ensure the applicability of the threshold parameters used in TraceFinder, the chromatograms of all samples within the batch were carefully evaluated. The batch was constructed to include samples with comparable baseline levels and concentration ranges, as significant differences in sample intensity would affect the accuracy of the applied thresholds.
The total ion chromatogram (TIC) intensity threshold was set at 100 to filter out low-intensity signals that were recognized as artifacts or noise. This value was determined based on the smallest peak identified in the TICs of the samples, ensuring that relevant peaks were retained while excluding random fluctuations or background interferences. The signal-to-noise ratio (S/N) threshold of 40 was chosen after evaluating three signal-free regions across the chromatograms. The lowest S/N value observed in these regions was 40. This threshold was then checked across all samples in the batch to ensure its validity and applied uniformly to reduce false positives while ensuring that trace-level peaks were still detectable. The mass tolerance of 5 ppm reflects standard practice for high-resolution instruments such as the GC Orbitrap used in this study. This setting provides a good compromise between accuracy in identifying molecular ions and tolerance to minor instrumental drifts.
The search index (SI) threshold of 500 was selected to ensure reliable fragment annotation by the software, reducing the likelihood of misidentifications caused by partial matching of spectral fragments. In the unknown screening process, the retention time (RT) window was set at 30 s to account for potential matrix effects in the real, unpurified samples analyzed. This adjustment was made to compensate for slight shifts in retention times caused by the sample matrix. A wide window was chosen as a conservative measure to ensure that all relevant peaks were included in the identification process, minimizing the risk of missing compounds due to retention time variability.
In summary, all parameters were optimized through iterative testing based on the evaluation of the chromatograms within the batch, ensuring their applicability across all samples. This approach guaranteed robust and reproducible peak detection while minimizing the inclusion of noise or artifacts.
The study focused on the diluted (non-evaporated) fractions of the samples, to prevent the loss of non-specific analytes, with higher volatility, while the concentrated fractions, characterized by stronger signals were used for compound-specific structural assignments. The batches for deconvolution consist solely of diluted samples, which is why the parameters for deconvolution and unknown screening were optimized using their chromatograms. This allowed for the determination and refinement of appropriate threshold parameters for the analysis. The optimization of deconvolution parameters is critical for minimizing false positives and must be tailored to the specific batch under examination [7].

4.4. Selection of Major Components for Identification and Quantification

Following an initial analysis of the results and based on the work of Jacob et al. (2021) [7], it was realized that pursuing a compound list screening based solely on the identification rates provided by TraceFinder was not scientifically sound. This is because high identification rates can be misleading due to the presence of false positives and repetitive identifications, especially when dealing with untargeted compounds. Although the retention-time index function was utilized through the injection of alkanes—which significantly reduced false positives—numerous repetitions and errors persisted in the identification of the untargeted compounds.
This section outlines the critical steps and considerations involved in identifying 40 major peaks among 4146 initial compounds, using advanced deconvolution and compound-specific verification to ensure reliability.
For this reason, it was decided to reprocess the batch using the “Unknown” function of the TraceFinder program. Indeed, while the Deconvolution function processes each individual sample separately, the Unknown function cross-references the data across the entire batch. Cross-referencing results from the ‘Unknown’ and ’Deconvolution’ functions reduced misidentifications, aligning with methodologies described by [6]. This function processes the batch after time alignment by comparing the total ion chromatograms (TICs) based on mass fragments common to each peak, allowing for more consistent and reliable identification of compounds present across multiple samples.
The top 40 peaks with the highest intensity were selected because they were presumably present at higher concentrations in that environment. This comparison led to the exclusion of five peaks, as they appeared to result from co-eluted peaks or chromatographic artifacts, despite high probability scores from automatic recognition.

4.5. Structure Elucidation of Selected Major Components—One by One

Each entry in the list was investigated individually to establish its identity. Retention indices and mass-spectra were the primary characteristics considered. For several substances the retention indices and spectra used for comparisons were obtained with the same GC-MS setup, for several others it was using similar instruments and conditions, for other the information was from the literature.
The method developed to verify the identification of the thirty-five selected compounds carried out by the software, along with two manually identified compounds, involved the analysis of the signal in the chromatograms of all the samples, the analysis of the m/z fragments and the retention indices (RI). The check of the compound’s identifications, on the basis of the retention index, were carried out by comparing the correspondence of the RI calculated for the non-polar type GC column at NILU (where samples were injected) with those of the NIST library and those evaluated at the CNR using all the available standards. All Results are reported in Table 1.
The identification results provided by the software often produce long lists of thousands of compounds, many of which are artifacts or false positives. The software may also identify the same compound at different RTs based on identical m/z values. Therefore, the recognition percentage cannot be considered a definitive parameter for compound identification. To obtain consistent results, it is recommended to update libraries either by purchasing them from the manufacturer or by constructing new ones through standard acquisitions. This necessitates developing a GC-MS method generic to the compound classes under investigation. Some uncertain identifications in this study were attributed to isomers, which were differentiated using retention indices (RI) and should be confirmed with standard solutions.
The compounds listed in the Table with an asterisk represent tentative identifications that require further verification using analytical standards. The identification work also included a bibliographic research step to resolve doubts and confirm or refute some recognitions reported in Table 1 (wording “LITERATURE”). The literature research included scientific articles, databases such as EPA.gov, comptox.epa, ECHA, JECFA, LOTUS, DrugBank, UN Globally Harmonized System of Classification and Labelling of Chemicals (GHS), PubChem, and ChemSpider.
  • Isomers of C8H10.
Ethylbenzene. The automatic peak attribution of the TraceFinder to RT 5.86 min has been confirmed as correct. The signals 91.054 and 106.078 m/z were recognized in the mass spectrum, due, respectively, to C7H7 and C8H10 fragments. Furthermore, the calculated RI 853.1 corresponds to that of the one obtained with a standard solution containing the compound, equal to 854.25 on the CNR column, and it is comparable with those of NIST. The NIST library indicates an SI of 637 and an RSI of 866.
Benzene, 1,3-dimethyl-. The two meta and para-Xylene isomers have been associated with two different peaks which are unresolved at RT 6.03. The identification was performed through the mass spectrum where the characteristic mass attributable to the C8H10 fragment of 91.05 m/z was recognized through the calculated IR of 863.6 which was comparable with those identified on the CNR column of 862.7 for the meta- and of 863.4 for the para-xylene.
  • Isomers of C9H12.
This group includes more isomers and alternative identifications with the fragment 105.97 m/z at different RTs, and rarely in the different samples for the same peak are found unique TraceFinder identifications. An RI of 921.8 was calculated at RT 6.97 min, which excludes two of the three automatic identifications (Cyclopentane, 1,1,3,4-tetramethyl-trans- and Cyclonona-1,2,6-triene). The peak was identified as iso-propylbenzene (cumene), thanks also to the correspondence with the RT of the compound present in the ACCU 502 standard solution and thanks to the RI of the compound injected on the semi-polar column of the CNR.
The n-propylbenzene identified with the fragment 91.05 m/z is confirmed between the two indicated by the Tracefinder at 7.45 min for which the calculated RI coincides perfectly with the theoretical ones indicated by the libraries.
The peak at RT 7.59 min automatically identified as Benzene, 1-ethyl-2-methyl-, instead was identified as the isomer—Benzene, 1-ethyl-3-methyl- whose RI is 960.
Benzene, 1-ethyl-2-methyl- was instead associated with the peak that comes out at 7.75, which was instead erroneously identified by the TraceFinder at Mesitylene.
The study performed identified Benzene, 1-ethyl-4-methyl- at 7.64 and Mesitylene at RT of 7.74 with RI of 963 and 970, respectively, both misidentified by the TraceFinder as Benzene, 1,2,3-trimethyl. Given the proximity of the peaks (7.74 and 7.75 RT) and the fact that the same mass fragment (105.7 m/z) was used for identification, Benzene, 1-ethyl-2-methyl- and Mesitylene require further studies, despite the identification of both compounds.
There are two other compounds hypothesized at RT 7.89 min as pseudocumene and at RT 8.17 min as hemellitene that require further study and analysis via standard solutions, as none of the automatic identifications had correspondences with the theoretical and real fragments or RI.
  • Artifact.
At RT 7.60 min, two distinct peaks are identified according to fragments 77.04 and 79.05 m/z which both represent an artifact. All automatic attributions reported in Table 1 are excluded by the chemical structures, as they should be eluted later.
  • Isomers of C10H14.
The certain attribution of the C10H14, assuming one benzene ring in the structure, counts 22 possible isomers. For this reason, further studies are necessary to confirm the attributions of the compounds shown in Table 1 (Supplementary Material Figure S16).
o-Cymene and p-Cymene were identified at 8.58 and 8.67 min, respectively, both recognized by the automatic search as o-Cymene. The compounds were distinguished on the basis of the intensity of the fragments 91.05, 119.08, and 134.10 m/z and the correspondences between the calculated and theoretical RI of the libraries. At an RT of 9.65 min, the compound initially identified as o-Cymene is hypothesized to be m-Cymene, however, no confirmation is available.
As for the identifications at 8.63, 9.09, 9.18, 9.34, and 9.65 they were all evaluated as incorrect on the basis of the mass spectra and of the calculated RT elution. Between 9.18 and 9.21 min coelute a mix of peaks in which it is possible to distinguish only at RT 9.19 min a prevalence of 105.06 m/z and in the tail the fragment 119.09 m/z which allowed to identify 1,3,8-p-Menthatriene.
  • The alkanes n-Decane at RT 8.21 min (C10H22) and n-Undecane at RT 9.85 (C11H24) have been uniquely identified, although the software recognition suggested other compounds.
  • Two peaks not recognized by the TraceFinder and identified manually as styrene and o-xylene were also included in Table 1 (peak N°2 and 3).
At RT 6.42 min it elutes the o-xylene, isomer of the m/p-xylene previously identified, the attribution is confirmed in the distribution of the m/z fragments characterizing the compound and in the RI whose distance with the previous homologues reflects the libraries.
At RT 8.86 the Indane compound was automatically identified, the spectra and retention time did not allow to choose between different isomers with a C9H10 formula.
Naphthalene. It is one of the most volatile and well-known aromatic hydrocarbons, with its unmistakable 128.0 and 127.0 m/z fragments, and the feedback through NIST libraries and the comparison with the standard solution made it possible to confirm the automatic attribution of the TraceFinder.
For the signal at RT 11.37 identified as methylsalicylate in Table 1 there was an uncertainty with methylparaben based on the m/z ratio. Methylsalicylate is a household cleaning and care product, flavoring agent, perfume, medical/dental compound, a natural compound of many plant species, especially winter greens [18,19]. Methylparaben is a food additive and a fungicide, used in inks and present in children’s games, as well as in personal care products [20,21]. Given the geographical locations where the samplings were performed, the forest presence includes trees and species that secrete wintergreens oil, for this reason in the table it has been identified as “Methyl salicylate”. This identification is further reinforced by the detection of eucalyptol, another fragrance originating from the surrounding vegetation, for which the term “terpenoid” will be used due to uncertainty and the need for verification [22].
  • The C5H7O-X structure at RT = 12.52 represents a true unknown and further studies are needed to reveal its structure.
Another characteristic ion signal attributable to C7H9O has also been identified for this unknown, but there are no references in the literature to help in its identification.
Additionally, other identified compounds are reported but will not be discussed due to space constraints. In general, some major groups have been identified as follows:
-
C10 alkyl aromatic hydrocarbons
-
Terpenoids
-
Substituted benzenes (for example the C8 group)
-
Oxygenated compounds.

4.6. Semi-Quantitative Analysis

Quantitative analysis using GC-MS was performed with standard solutions to determine the response factors of the compounds. For untargeted studies (unless the focus is on a specific class of compounds with preparatory work planned in advance), it is often the case that not all standard compounds are available in the laboratory. Consequently, the primary evaluation that can be conducted involves comparing the relative abundance of compounds between samples by normalizing the signals with respect to an internal standard that is added (semi-quantitative analysis, see Equation (1)).
In this approach, integrating peaks on the total ion chromatogram (TIC) provides realistic responses for compounds even in the absence of standards. While dividing the peak area by molecular weight could theoretically yield quantification, most untargeted compounds identified in this study, particularly through deconvolution with TraceFinder, were derived from co-eluted peaks. Integration was therefore feasible only by isolating the m/z values used for compound recognition. Due to the varying fragmentation patterns of molecules, direct comparisons are only meaningful for the same compound across different samples. To address this limitation, defining response factors for compound classes and integrating consistently based on a shared m/z value may offer a potential solution.
The relative concentrations of all identified compounds were higher in the EMEP area compared to Umbria. Notably, the sample collected in October (2E72, 2E48 + 2E24) showed almost twice the concentration of the September sample (1E72, 1E48 + 1E24). Despite variations in absolute concentrations, the trends observed for EMEP samples were comparable (Figure 4). At the EMEP site, consistent patterns across samples suggest stability in the emissions, while the higher concentrations highlight the influence of anthropogenic sources. Conversely, the Umbria site displayed higher levels of biogenic compounds, aligning with its rural and vegetation-rich environment. The samples collected in Umbria exhibited a distinct pattern, characterized primarily by the dominance of aldehydes, terpenoids, and oxidized compounds (Figure 4). In particular, the TIC-based integration approach reinforced these findings, highlighting differences in the relative abundance of compounds linked to biogenic versus anthropogenic sources. These observations underscore the importance of site-specific approaches in untargeted analyses. This suggests that vegetation is the predominant emission source in this area, a finding reinforced by its relative distance from major roadways. Similar signals were detected in the two EMEP samples (also located in a rural area), but these signals were masked by the influence of anthropogenic sources (e.g., roads, residential areas). The EMEP station is situated in the Tiber River valley, where pollution from surrounding suburban areas converges. The most abundant compounds identified across the two sampling areas included benzene, 1-ethyl-3-methylbenzene, hemellitene, p-cymene, and naphthalene (Figure 5).
A significant finding regarding untargeted analysis emerged from Figure 5, which compares parallel samples (3 days vs. 48 h + 24 h). Theoretically, the sum of the compounds quantified in the two short-term cartridges (2 + 1) should align with the concentrations found in the 3-day cartridge, assuming that the breakthrough volume limit has not been exceeded. The trends highlight significant differences in compound retention and sampling efficiency between EMEP and Umbria sites. For the Umbria site, the 72 h cartridge showed concentrations 21%, 12%, and 22% higher than the combined 2 + 1 cartridges for n-propylbenzene, benzene, and 1-ethyl-3-methyl-benzene, respectively. In contrast, for EMEP, the concentrations in the 72 h cartridges were consistently lower than those in the 48 h + 24 h parallels: 96%, 70%, and 13% lower for 1E72 vs. 1E48 + 1E24, and 15%, 17%, and 3% lower for 2E72 vs. 2E48 + 2E24 (n-propylbenzene, benzene, and 1-ethyl-3-methyl-benzene, respectively).
These discrepancies may be attributed to several factors, including degradation of sampled compounds (e.g., ozone-related degradation) in the 72 h cartridges, saturation of the adsorbent, or variable concentrations in the ambient air. Given the absence of a linear relationship between concentrations and percentage differences in the 3 day vs. 2 + 1 samples at EMEP (1E and 2E), it can be concluded that the chosen sampling method may not be suitable for quantitative sampling of these compounds for extended (72 h) period at temperatures exceeding 17 °C.
The sampling medium is not suitable for all the compounds identified and depends on the properties of the individual classes. Figure 1, Figure 2 and Figure 3 illustrate which compounds reach breakthrough under this sampling setup and which do not. For example, the method is not suitable for o-xylene, m/p-xylene, and styrene in the samples collected at the EMEP site, whereas it is valid for those collected in Umbria.

4.7. Chemical Nature, Variety, Contribution and Significance of Major Components of Ambient Air in Italy

This study highlights the complexity of ambient air composition by integrating untargeted analysis to uncover both anthropogenic and biogenic contributions. The EMEP site, influenced by suburban activity, showed a higher prevalence of aromatic hydrocarbons, such as 1-ethyl-3-methylbenzene and hemellitene, which are markers of vehicular emissions and solvent use [23]. Conversely, the remote Umbria site revealed a dominance of terpenoids like p-cymene, reflecting biogenic sources from vegetation [24,25]. Naphthalene, a persistent pollutant with industrial and combustion origins, was consistently detected across both sites, underscoring its ubiquity and environmental significance [10].
These findings demonstrate how site-specific characteristics shape air composition, offering insight into the interplay between local sources and atmospheric transport [26]. Furthermore, the identified compounds highlight potential environmental and health risks, including aquatic toxicity and carcinogenicity, reinforcing the importance of comprehensive air quality monitoring [27,28]. The untargeted approach used here not only enables the detection of unexpected compounds but also provides a robust foundation for developing targeted analyses, ensuring a deeper understanding of pollution dynamics and supporting informed mitigation strategies [29].

4.8. Chemical Nature, Variety, Contribution, and Significance of Major Components in Ambient Air in Italy

The study of untargeted compounds requires comprehensive literature analysis to understand the abundance, chemical characteristics, and potential hazards of the identified substances. The most abundant compounds in the three samples examined reflect the characteristics of the selected sites:
  • Benzene, 1-ethyl-3-methyl- (CAS no. 620-14-4): A key component of aromatic chemical classes and surrogate kerosene fuels [30]. According to the classification provided by companies to the European Chemicals Agency [31], it is potentially fatal if swallowed and enters airways, toxic to aquatic life with long-lasting effects, flammable, and capable of causing drowsiness or dizziness.
  • p-Cymene (CAS no. 99-87-6): Widely found in nature, particularly in the essential oils of various aromatic plant species [32]. It is used in products such as biocides, cleaning agents, polishes, waxes, perfumes, and personal care items [33]. According to the harmonised classification and labelling set by the EU, the substance is classified as potentially fatal if swallowed and enters airways, toxic if inhaled, toxic to aquatic life with long-lasting effects, and is a flammable liquid and vapour (EU Regulation 2021/849). Furthermore, according to the classification provided by companies to the ECHA, this substance is suspected of impairing fertility or harming unborn children, it causes eye and skin irritation, and it can potentially cause respiratory irritation [33].
  • Naphthalene (CAS no. 91-20-3): A polycyclic aromatic hydrocarbon and common air pollutant originating from industries, biomass burning, and fuel combustion [34]. According to the harmonised classification and labelling set by the EU, the substance is very toxic to aquatic life with long lasting effects, harmful if swallowed, and a suspected carcinogen (EU Regulation 2018/669) [35].
  • Hemellitene (CAS no. 526-73-8): An aromatic VOC emitted from motor vehicle exhaust and solvent evaporation [36]. According to the classification provided by companies to ECHA this substance is flammable, causes skin and eye irritation and may be fatal if it enters airways. It is included in the EU list of ozone precursor substances (Directive 2008/50/EC and Directive UE 2024/2881 on ambient air quality) [37].

5. Conclusions

This study provides a comprehensive overview of the essential steps required for untargeted compound analysis, encompassing sampling, clean-up, instrumental analysis, compound identification, and bibliographic research. Each phase has been meticulously detailed, highlighting critical challenges such as breakthrough phenomena during sampling, matrix effects during clean-up, and the need for accurate library references and retention indices for identification. These insights not only underscore the complexity of untargeted analyses but also offer practical solutions for improving methodological robustness.
A total of thirty-five major peaks were identified from the air samples in Italy by the software from an initial set of 4146 compounds, to which two additional peaks were manually identified, resulting in a final list of 37 compounds. Key compounds, such as 1-ethyl-3-methyl-benzene, naphthalene, and p-cymene, were identified with high confidence, supported by retention index calibration and comparison with validated standards. For compounds like hemellitene and pseudocumene, additional studies were proposed due to their tentative identification. The identified compounds were further contextualized by their chemical nature, sources, and potential environmental impact.
Figure 1, Figure 2 and Figure 3 illustrate how the sampling methodology influenced compound retention, with a significant breakthrough observed for o-xylene, m/p-xylene, and styrene at the EMEP site, highlighting its limitations for certain VOCs under extended sampling periods (72 h). Conversely, these compounds were successfully retained in the Umbria samples, reflecting the importance of site-specific optimization of sampling parameters.
Semi-quantitative analysis revealed distinct patterns in compound distributions across the two sites. Anthropogenic emissions were more pronounced at the EMEP site, with alkylaromatic hydrocarbons dominating the profile. In contrast, biogenic compounds, such as terpenoids, were predominant in the rural Umbria samples, reinforcing the influence of local vegetation on air composition. Notably, n-propylbenzene, 1-ethyl-3-methylbenzene, and hemellitene showed variability in retention across different sampling durations, further demonstrating the sensitivity of the method to environmental and operational conditions.
The methodological advancements outlined in this study provide a foundation for enhanced air quality monitoring systems, with potential applications in regulatory frameworks, climate research, and the identification of emerging pollutants.
The integration of deconvolution and unknown screening functions offers a robust basis for improving reliability in untargeted analyses, contributing to the development of more accurate monitoring protocols.
Future work should focus on extending this approach to include real-time monitoring of VOCs and validating tentative identifications. The results demonstrate the necessity of integrating both targeted and untargeted approaches to achieve a holistic understanding of complex samples. The findings further emphasize the importance of rigorous planning, careful optimization of analytical parameters, and cross-referencing of results across multiple samples to enhance reliability and reproducibility. This work contributes to advancing untargeted methodologies, providing a solid foundation for future studies aimed at the identification of bioactive compounds, pollutant profiling, or the characterization of intricate environmental matrices. By addressing key limitations and proposing methodological improvements, this study paves the way for more accurate and reliable untargeted analyses, reinforcing their applicability in environmental, chemical, and biological research domains.

Supplementary Materials

The following supporting information can be downloaded at: https://www.mdpi.com/article/10.3390/separations12020035/s1, Figure S1: 3 days sampling Umbria 24-27/08/2021. Sampler A. Deconvoluted chromatogram. Zoom 4.4–13.50 min; Figure S2: 2 days sampling Umbria 24-26/08/2021. Sampler B. Deconvoluted chromatogram. Zoom 5.5–13.95 min; Figure S3: 1 day sampling Umbria 27/08/2021. Sampler B. Deconvoluted chromatogram. Zoom 4.4–13.65 min; Figure S4–S15: GC-HRMS chromatogram and mass spectra of 2E72 sample; Figure S16: C10H14 Isomers Mass Spectra; Table S1: Data of the sampling carried out in Italy; Table S2: Retention times of n-alkanes used in the Deconvolution processing as references; Table S3–S4: VOC standard lists.

Author Contributions

Conceptualization, M.C. and V.N.; methodology, M.C. and V.N.; Data curation, M.C. and M.P.; resources, V.N. and C.B.; writing—original draft preparation, M.C., C.B., B.G.M., S.S. and V.N.; funding acquisition, C.B. All authors have read and agreed to the published version of the manuscript.

Funding

The completion of this work was made possible by the funding provided by the Short Mobility Call 2020 of the National Research Council of Italy (CNR), which supported the MC research stay at NILU.

Data Availability Statement

Data are contained within the article or Supplementary Materials.

Acknowledgments

Special thanks to the NILU staff for their invaluable guidance and assistance during the research activities in Tromsø.

Conflicts of Interest

The authors declare no conflicts of interest.

References

  1. Aretaki, M.A.; Desmet, J.; Viana, M.; van Drooge, B.L. Comprehensive methodology for semi-volatile organic compound determination in ambient air with emphasis on polycyclic aromatic hydrocarbons analysis by GC–MS/MS. J. Chromatogr. A 2024, 1730, 465086. [Google Scholar] [CrossRef] [PubMed]
  2. Vallecillos, L.; Riu, J.; Marcé, R.M.; Borrull, F. Air monitoring with passive samplers for volatile organic compounds in atmospheres close to petrochemical industrial areas. The case study of Tarragona (2019–2021). Atmos. Pollut. Res. 2024, 15, 101986. [Google Scholar] [CrossRef]
  3. Ambade, B.; Kumar, A.; Sahu, L.K. Characterization and health risk assessment of particulate bound polycyclic aromatic hydrocarbons (PAHs) in indoor and outdoor atmosphere of Central East India. Environ. Sci. Pollut. Res. 2021, 28, 56269–56280. [Google Scholar] [CrossRef] [PubMed]
  4. Iakovides, M.; Apostolaki, M.; Stephanou, E.G. PAHs, PCBs and organochlorine pesticides in the atmosphere of Eastern Mediterranean: Investigation of their occurrence, sources and gas-particle partitioning in relation to air mass transport pathways. Atmos. Environ. 2021, 244, 117931. [Google Scholar] [CrossRef]
  5. Nagar, N.; Bartrons, M.; Brucet, S.; Davidson, T.A.; Jeppesen, E.; Grimalt, J.O. Seabird-mediated transport of organohalogen compounds to remote sites (North West Greenland polynya). Sci. Total Environ. 2022, 827, 154219. [Google Scholar] [CrossRef]
  6. Smith, A.P.; Lindeque, J.Z.; van der Walt, M.M. Untargeted Metabolomics Reveals the Potential Antidepressant Activity of a Novel Adenosine Receptor Antagonist. Molecules 2022, 27, 2094. [Google Scholar] [CrossRef] [PubMed]
  7. Jacob, P.; Wang, R.; Ching, C.; Helbling, D.E. Evaluation, optimization, and application of three independent suspect screening workflows for the characterization of PFASs in water. Environ. Sci. Process. Impacts 2021, 23, 1554–1565. [Google Scholar] [CrossRef] [PubMed]
  8. Ji, X.; Ji, W.; Ding, L. Untargeted GC-MS metabolomics combined with multivariate statistical analysis as an effective method for discriminating the geographical origin of shrimp paste. Food Anal. Methods 2023, 17, 200–206. [Google Scholar] [CrossRef]
  9. Beer, F.; Weinert, C.H.; Wellmann, J.; Hillebrand, S.; Ley, J.P.; Soukup, S.T.; Kulling, S.E. Comprehensive metabolome characterization of leaves, internodes, and aerial roots of Vanilla planifolia by untargeted LC–MS and GC × GC–MS. Phytochem. Anal. 2024, 36, 30–51. [Google Scholar] [CrossRef] [PubMed]
  10. Du, Q.Y.; He, M.; Gao, X.; Yu, X.; Zhang, J.N.; Shi, J.; Zhang, F.; Lu, Y.Y.; Wang, H.Q.; Yu, Y.J.; et al. Geographical discrimination of Flos Trollii by GC-MS and UHPLC-HRMS-based untargeted metabolomics combined with chemometrics. J. Pharm. Biomed. Anal. 2023, 234, 115550. [Google Scholar] [CrossRef]
  11. Fu, Y.; Wu, Z.; Wei, Y.; Wang, X.; Zou, J.; Xiao, L.; Fan, W.; Yang, H.; Liao, L. Untargeted and targeted metabolomics analysis of CO poisoning and mechanical asphyxia postmortem interval biomarkers in rat and human plasma by GC[sbnd]MS. J. Pharm. Biomed. Anal. 2024, 251, 116443. [Google Scholar] [CrossRef]
  12. Warner, N.A.; Nikiforov, V.; Krogseth, I.S.; Bjørneby, S.M.; Kierkegaard, A.; Bohlin-Nizzetto, P. Reducing sampling artifacts in active air sampling methodology for remote monitoring and atmospheric fate assessment of cyclic volatile methylsiloxanes. Chemosphere 2020, 255, 126967. [Google Scholar] [CrossRef]
  13. Khodadadi, M.; Pourfarzam, M. A Review of Strategies for Untargeted Urinary Metabolomic Analysis Using Gas Chromatography–Mass Spectrometry. Metabolomics 2020, 16, 66. [Google Scholar] [CrossRef]
  14. Hollender, J.; van Bavel, B.; Dulio, V.; Farmen, E.; Furtmann, K.; Koschorreck, J.; Kunkel, U.; Krauss, M.; Munthe, J.; Schlabach, M.; et al. High Resolution Mass Spectrometry-Based Non-Target Screening Can Support Regulatory Environmental Monitoring and Chemicals Management. Environ. Sci. Eur. 2019, 31, 42. [Google Scholar] [CrossRef]
  15. AccuStandards Method 502.2—Volatile Organic Compounds. Available online: https://www.accustandard.com/prod0006217.html (accessed on 19 January 2025).
  16. U.S. Environmental Protection Agency. EPA TO-17: Determination of Volatile Organic Compounds in Ambient Air Using Active Sampling onto Sorbent Tubes; Center for Environmental Research Information, Office of Research and Development: Cincinnati, OH, USA, 1999. [Google Scholar]
  17. Italian National Standardization Body (UNI). UNI EN ISO 16000-5:2007; Indoor Air—Part 5: Sampling Strategy for Volatile Organic Compounds (VOC); UNI: Milan, Italy, 2007. [Google Scholar]
  18. U.S. EPA Methyl Salicylate. Available online: https://ordspub.epa.gov/ords/pesticides/f?p=CHEMICALSEARCH:3::::1,3,31,7,12,25:P3_XCHEMICAL_ID:3165 (accessed on 27 May 2022).
  19. PubChem Methyl Salicylate. Available online: https://pubchem.ncbi.nlm.nih.gov/compound/Methyl-salicylate#section=Uses (accessed on 19 January 2025).
  20. U.S. EPA Methylparaben. Available online: https://comptox.epa.gov/dashboard/chemical/details/DTXSID4022529 (accessed on 27 May 2022).
  21. PubChem Methylparaben. Available online: https://pubchem.ncbi.nlm.nih.gov/compound/Methylparaben#section=Uses (accessed on 27 May 2022).
  22. PubChem Eucalyptol. Available online: https://pubchem.ncbi.nlm.nih.gov/compound/2758#section=Drug-and-Medication-Information (accessed on 29 May 2022).
  23. Wagrowski, D.M.; Hites, R.A. Polycyclic Aromatic Hydrocarbon Accumulation in Urban, Suburban, and Rural Vegetation. Environ. Sci. Technol. 1997, 31, 279–282. [Google Scholar] [CrossRef]
  24. Llusia, J.; Peñuelas, J.; Seco, R.; Filella, I. Seasonal Changes in the Daily Emission Rates of Terpenes by Quercus Ilex and the Atmospheric Concentrations of Terpenes in the Natural Park of Montseny, NE Spain. J. Atmos. Chem. 2012, 69, 215–230. [Google Scholar] [CrossRef]
  25. Petr, P.; Soukupová, A. Terpenes in forest Air—Health benefit and healing potential. Acta Salus Vitae 2016, 4, 61–69. [Google Scholar]
  26. Aktypis, A.; Sippial, D.J.; Vasilakopoulou, C.N.; Matrali, A.; Kaltsonoudis, C.; Simonati, A.; Paglione, M.; Rinaldi, M.; Decesari, S.; Pandis, S.N. Formation and Chemical Evolution of Secondary Organic Aerosol in Two Different Environments: A Dual-Chamber Study. Atmos. Chem. Phys. 2024, 24, 13769–13791. [Google Scholar] [CrossRef]
  27. Langat, F.K.; Kibet, J.K.; Okanga, F.I.; Adongo, J.O. Organic Contaminants in the Groundwater of the Kerio Valley Water Basin, Baringo County, Kenya. Eur. J. Chem. 2023, 14, 337–347. [Google Scholar] [CrossRef]
  28. Zhao, H.; Wang, S.; Sun, J.; Zhang, Y.; Tang, Y. OH-Initiated Degradation of 1,2,3-Trimethylbenzene in the Atmosphere and Wastewater: Mechanisms, Kinetics, and Ecotoxicity. Sci. Total Environ. 2023, 857, 159534. [Google Scholar] [CrossRef] [PubMed]
  29. Cairoli, M.; van den Doel, A.; Postma, B.; Offermans, T.; Zemmelink, H.; Stroomberg, G.; Buydens, L.; van Kollenburg, G.; Jansen, J. Monitoring Pollution Pathways in River Water by Predictive Path Modelling Using Untargeted GC-MS Measurements. NPJ Clean. Water. 2023, 6, 48. [Google Scholar] [CrossRef]
  30. Wang, Q.; Yang, M.; Wang, J.; Yang, J.; Zhao, L.; Li, W.; Wang, C.; Lu, T.; Li, Y. Towards a predictive kinetic model of 3-ethyltoluene: Evidence concerning fuel-specific intermediates in the flow reactor pyrolysis with insights into model implications. Proc. Combust. Inst. 2023, 39, 179–188. [Google Scholar] [CrossRef]
  31. ECHA 3-Ethyltoluene. Available online: https://echa.europa.eu/it/substance-information/-/substanceinfo/100.009.662 (accessed on 23 December 2024).
  32. Balahbib, A.; El Omari, N.; Hachlafi, N.E.; Lakhdar, F.; El Menyiy, N.; Salhi, N.; Mrabti, H.N.; Bakrim, S.; Zengin, G.; Bouyahya, A. Health beneficial and pharmacological properties of p-cymene. Food Chem. Toxicol. 2021, 153, 112259. [Google Scholar] [CrossRef] [PubMed]
  33. ECHA p-Cymene. Available online: https://echa.europa.eu/it/substance-information/-/substanceinfo/100.002.542 (accessed on 23 December 2024).
  34. Jia, C.; Batterman, S. A Critical Review of Naphthalene Sources and Exposures Relevant to Indoor and Outdoor Air. Int. J. Environ. Res. Public Health 2010, 7, 2903–2939. [Google Scholar] [CrossRef] [PubMed]
  35. ECHA Naphthalene. Available online: https://echa.europa.eu/it/substance-information/-/substanceinfo/100.009.662 (accessed on 23 December 2024).
  36. Luo, H.; Jia, L.; Wan, Q.; An, T.; Wang, Y. Role of liquid water in the formation of O3 and SOA particles from 1,2,3-trimethylbenzene. Atmos. Environ. 2019, 217, 116955. [Google Scholar] [CrossRef]
  37. ECHA 1,2,3-Trimethylbenzene. Available online: https://echa.europa.eu/it/substance-information/-/substanceinfo/100.007.633 (accessed on 23 December 2024).
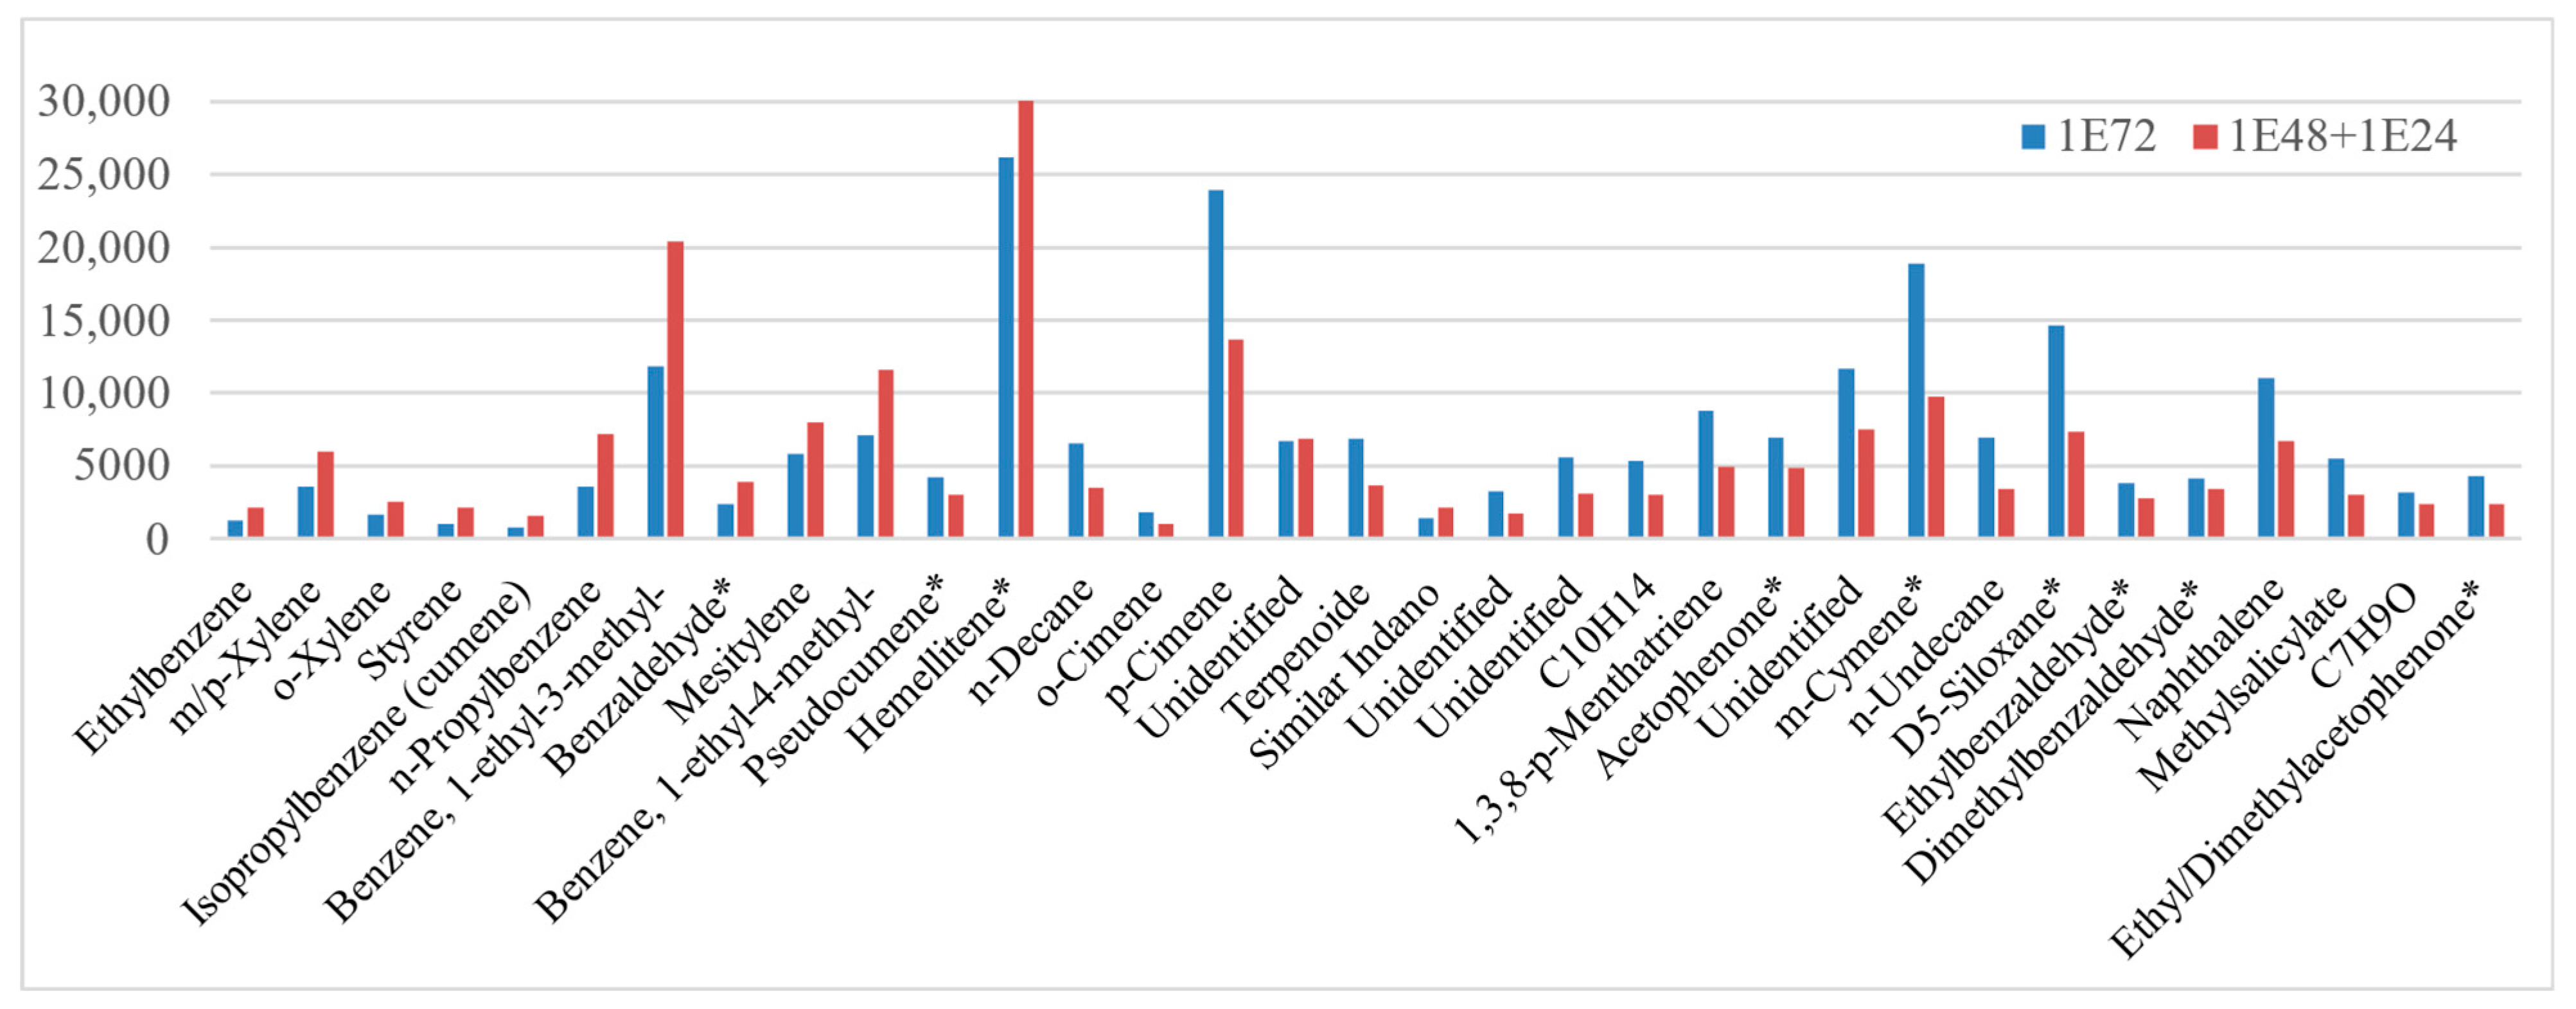
Figure 1. Relative concentrations of 33 compounds normalized to C12D18. EMEP (1E). Comparison of 72 h samples with 48 h + 24 h samples. The C10H14 peak corresponds to the mix of peaks listed in Table N° 24. The compounds marked with “*” require further verification.
Separations 12 00035 g001
Figure 2. Relative concentrations of 33 compounds normalized to C12D18. EMEP (2E). Comparison of 72 h samples with 48 h + 24 h samples. The C10H14 peak corresponds to the mix of peaks listed in Table 1 (N° 24). The compounds marked with “*” asterisk require further verification.
Separations 12 00035 g002
Figure 3. Relative concentrations of 33 compounds normalized to C12D18. Umbria (U). Comparison of 72 h samples with 48 h + 24 h samples. The C10H14 peak corresponds to the mix of peaks listed in Table No. 24. The compounds marked with “*” require further verification.
Separations 12 00035 g003
Figure 4. Comparison of 3-day samples with their respective 48 h + 24 h parallel samples, normalized to 100. Total of 29 compounds excluding peaks N° 8, 10, 13, 19, 22, 23, 27 and 35. EMEP September: 1E72 and 1E48 + 1E24; EMEP October: 2E72 and 2E48 + 2E24; Umbria: U72 and U48 + U24. The compounds marked with “*” require further verification.
Separations 12 00035 g004
Figure 5. Relative concentrations of key compounds (n-propylbenzene N°6, 1-ethyl-3-methylbenzene N°7, and Hemellitene* N°15) normalized to C12D18. EMEP (1E and 2E) and Umbria (U). Comparison of 72 h samples with 48 h + 24 h samples. The compounds marked with “*” require further verification.
Separations 12 00035 g005
Table 1. Final list with specific attributions and comments. N°: peak number. Best Software match: compounds identified by the software TraceFinder Deconvolution. RT (min) m/z: retention times and m/z ions attributed by the software to the compound listed in the first column. Final assignment: CNR-NILU identifications; confirmed or substituted compounds, with comments based on the application of the study method for untargeted analysis. Formula: definitive formula attribution. RI calculated: retention index calculated for each compound listed under “CNR-NILU Identification”.
Best Software MatchRT (min)
m/z
Final AssignmentFormulaRI Calculated
1Ethylbenzene5.86
91.05
EthylbenzeneC8H10854
2Benzene, 1,3-dimethyl-6.03
91.05
m/p-XyleneC8H10865
3NOT found6.42o-Xylene
manually identified
C8H10889
4NOT found 6.41Styrene
Manually identified
C8H8888
5Cyclopentane, 1,1,3,4-tetramethyl-, trans-; Cyclonone-1,2,6-triene; Benzene, (1-methylethyl)-6.93
105.07
iso-Propylbenzene (cumene)C9H12920
6Benzene, 3-pentenyl-; Benzene, propyl-7.45
91.05
n-PropylbenzeneC9H12952
7Benzene, 1-ethyl-2-methyl-7.59
105.07
Benzene, 1-ethyl-3-methyl-C9H12960
81,5-Hexadiene, 3,3,4,4-tetrafluoro-; 1-Triazene, 3,3-dimethyl-1-phenyl-7.60
77.04
ARTIFACTARTIFACT961
93-Buten-1-one, 2,2-dimethyl-1-phenyl-; Ethanol, 1-methoxy-, benzoate; Idratropic acid, nonyl ester; (3-Methylphenyl) methanol, 1-methylpropyl ether7.61
105.03
Benzaldehyde *C7H5O-X962
10 @peak7.60
79.05
ARTIFACTARTIFACT961
11Benzene, 1,2,3-trimethyl-7.74
105.07
MesityleneC9H12970
12Benzene, 1,2,3-trimethyl-7.64
105.07
Benzene, 1-ethyl-4-methyl-C9H12963
13Mesitylene7.75
105.07
Benzene, 1-ethyl-2-methyl-C9H12970
14Benzene, 1-ethyl-2-methyl-; 7-octene-1,2-diol; 2-Pentene, 4,4′-oxybis-7.89
105.07
Pseudocumene *C9H12979
15Pentane, 2,3,4-trimethyl-; Mesitylene; 2,4-Dodecadienal, (E, E) -8.17
105.07
Hemellitene *C9H12996
16Carbonic acid, dodecyl vinyl ester; Oxalic acid, 2-ethylhexyl hexyl ester8.21
57.07
n-DecaneC10H22998
17o-Cimene8.58
119.09
o-Cymene C10H141021
18o-Cimene8.67
119.09
p-Cymene C10H141027
19Benzene, (1-methylethyl) -; 1-Pentene, 3-ethyl-3-methyl-8.63
105.07
UnidentifiedC10H141024
20Eucalyptol8.80
93.07
TerpenoidC10H18O1035
21Indano8.86
117.07
Similar IndanoC9H101039
22Benzene, 1,3-dimethyl-; Benzene, 1-methyl-2-propyl-; 1-Methyl-3-butenyl 3-methyl-3-hydroxybutyl ether; Sulphurous acid, 2-ethylhexyl isohexyl ester9.09
105.07
UnidentifiedC10H141053
23Propanetrione, diphenyl-; Acetohydrazide, 2-cyano-N2- [4- (4-methylbenzyloxy) benzylideno] -; 1-hexene, 3-methyl-6-phenyl-4- (1-phenylethoxy) -9.18
105.07
UnidentifiedC10H141058
24Fenetilamine, N-benzil-α-metil-; p-Menta-1,5,8-triene; 4,6-Decadiine; 2-Pirrolidineacetic acido9.18
91.05
n-Butylbenzene *
Peak mix
C10H141058
25N, N-Diethyl-2-aminoethanol, O-acetyl; 1,2-Benzenediol, o- (2,2,3,3,4,4,4-heptafluorobutyryl) -o ‘- (4-methylbenzoyl) -; Benzene, 1- (1,5-dimethylhexyl) -4-methyl-9.20
119.09
1,3,8-p-MenthatrieneC10H141060
26Ethanone, 2-(acetyloxy)-1-phenyl-; Benzeneacetic acid, α-oxo-, methyl ester9.35
105.03
Acetophenone *C7H5O-X 1069
27Benzene, 1-methyl-4-propyl-9.34
105.07
UnidentifiedC10H141068
28o-Cimene9.65
119.09
m-Cymene *C10H141088
29Carbonic acid, nonyl vinyl ester9.85
57.07
n-UndecaneC11H241100
30Octopamine, 3TMS derivative10.31
73.05
D5-Siloxane *C10H30O5Si51130
31 @peak10.91
105.07
Ethylbenzaldehyde *C9H10O1169
32Benzaldehyde, 4-ethyl-11.18
133.06
Dimethylbenzaldehyde *C9H10O1186
33Naphthalene11.33
128.06
NaphthaleneC10H81196
34Benzoic acid, 2- (1-methylpropyl) oxi-, methyl ester11.37
120.02
Methylsalicylate
LITERATURE
C8H8O21199
351,2-Benzenediol, O-(4-ethylbenzoyl)-O’-methoxycarbonyl-12.36
133.06
Ethyl/Dimethylacetophenone *
LITERATURE
C10H12O1267
36(1R,2R,3S,5R)-(-)-2,3-Pinanediol12.52
83.05
C7H9O ion
LITERATURE
C5H7O-X1278
374-Ethylbenzoic acid, 2-methylphenyl ester12.68
133.06
Ethyl/Dimethylacetophenone *C10H12O1289
* assignment is provisional.
Disclaimer/Publisher’s Note: The statements, opinions and data contained in all publications are solely those of the individual author(s) and contributor(s) and not of MDPI and/or the editor(s). MDPI and/or the editor(s) disclaim responsibility for any injury to people or property resulting from any ideas, methods, instructions or products referred to in the content.