Technical Note

Techno-Economic and Feasibility Assessment of Membrane-Based Wastewater Treatment and Reuse in the Automotive Industry

LAQV/REQUIMTE, Department of Chemistry, NOVA School of Science and Technology, NOVA FCT, Universidade NOVA de Lisboa, 2829-516 Caparica, Portugal
*
Author to whom correspondence should be addressed.
Separations 2025, 12(2), 30; https://doi.org/10.3390/separations12020030
Submission received: 9 December 2024 / Revised: 22 January 2025 / Accepted: 24 January 2025 / Published: 26 January 2025
(This article belongs to the Special Issue Membranes Used in Water Purification)

Abstract

:
The gradual increase in water scarcity due to depletion and/or inadequate use of water resources has affected the automotive sector. In this context, possibilities for water reuse in the pre-treatment tunnel in an automotive painting process were studied and compared with the primary goal of finding the most appropriate and economically viable water recovery solutions, considering a circular economy metric approach. To this end, an experimental campaign of aqueous effluent characterization, with determinations of most relevant chemical and physical parameters, was conducted in a company in the automotive industry sector. To reduce alkalinity and remove surfactants from the effluent of the washing phase, a cation exchange on a weak-acid-based resin was proposed along with a microfiltration membrane system with a recovery efficiency of 88%. The inclusion of subsequent ultrafiltration and reverse osmosis steps proved to be the most suitable for removing salts and biocides from the water of the cooling towers, treating approximately 68% of the water. The techno-economic feasibility was comprehensively evaluated according to the type of treatment used. A cost of EUR 245 thousand was estimated for the treatment of water from the degreasing washing phase (EUR 1.06 per manufactured car), and a cost of EUR 582 thousand was estimated for the treatment of the cooling towers’ water (EUR 2.52 per car). The estimated water income after the treatment systems’ implementation was estimated to be equal to EUR 0.07 per car for the washing stage and EUR 0.13 per car for the cooling towers. Ultimately, this study clearly demonstrated the beneficial contribution of using membrane treatment in the automotive sector’s environmental policy, leading to water reuse and much lower effluent discharge according to the principles of the circular economy.

Graphical Abstract

1. Introduction

Around 97% of the water on the planet is salt water, and the remaining 3% is the percentage of fresh water available. The disparity of availability of the two types of water and the constant deterioration of the freshwater composition due to pollution combine to make fresh water a limited resource. Bearing this in mind, there is less water available for usage, and poor water quality also puts the lives of many living organisms at stake [1]. Moreover, the demand for water, which accompanies socioeconomic development in each region, is increasing, which leads to situations of severe scarcity, with 40% of the world’s population living in these conditions [2].
For that reason, there was an urgent need to implement a water protection law referred to as the Water Framework Directive, which ensures groundwater and surface water quality by applying water management practices that will guarantee that water bodies comply with the required quality standards [3]. This European directive is aimed at promoting water use efficiency and diminishing wastewater discharge [4].
Alongside that, as the European ecological agreement targets a neutral climate, the concept of the circular economy was first introduced in 2020 as a regenerative system [5,6] that would allow optimization and constant reuse of resources and production of sustainable products [7,8,9].
Wastewater treatment plays a very important role in the circular economy as it is considered an essential resource whose reuse lessens natural resource exploitation [8]; moreover this treatment meets some sustainable goals established by the United Nations, such as SDG 6, which ensures clean water and sanitation, as well as SDG 9 which relies on promoting sustainable industrialization, innovation and enduring infrastructure, and SDG 12, which aims for a responsible consumption [10].
Gradual industrialization has led to a rise in wastewater production. The direct discharge of industrial effluents into water bodies can result in environmental contamination. Accordingly, methods of water recovery should be implemented in every sector of industry that generates wastewater in order to ensure the removal of contaminants, guaranteeing that the purified water is suitable for discharge and possible industrial reuse [11].
Among different industries, the automotive industry is known for relying heavily on water for various processes such as surface preparation, cleaning, painting, cooling and rinsing, resulting in significant wastewater generation. Therefore, many companies are currently facing more restrictive water use regulations as new goals are set, such as reducing water usage to as little as 1 m3 per produced car [12]. As a result of that, companies are urged to develop water-saving strategies and mitigate their water usage to comply with circular economy metrics.
Instead of discharging wastewater into wastewater treatment plants, one potential way to encourage water reuse is to install water recovery premises where wastewater is treated and redirected to the manufacturing process.
Over the years, the automotive industry has made significant progress [13,14,15] in wastewater treatment technologies, with great improvements in efficiency, water reuse potential and sustainability, achieving efficient removal of the so-called emerging pollutants (EPs) [13] that have recently been recognized as dangerous to the environment [16,17,18] and have proved to pose difficulties in waste removal [13,14,15,16,17,18]. Most of these water treatment processes must include a pre-treatment step to remove suspended substances, followed by primary and secondary treatment to remove chemical pollutants and, if necessary, a tertiary treatment to remove remaining pollutants. It is important to verify whether, in the case of discharge, this treatment alone can meet the legislative requirements [13,14].
Among these types of treatment, some are considered conventional methods, such as coagulation, flocculation, dissolved air flotation, activated carbon filtration and chemical processes that are commonly used to reduce the load of solids and organic contaminants, oils and heavy metals, while other processes involving membrane technology and ionic changes are considered advanced processes [19].
Recently, membrane-based technologies have revolutionized wastewater treatment in the automotive sector by enabling higher levels of purification and water recovery. Technologies such as microfiltration (MF) and ultrafiltration (UF) are used to remove suspended solids, oils and microorganisms, and reverse osmosis (RO) can remove dissolved salts, organic contaminants and heavy metals, recovering high-purity water for reuse. Recent innovations in membrane systems have reduced energy consumption and operational costs by creating more efficient designs and applying different membrane materials such as ceramic, carbon nanotubes and graphene oxide with improved fouling resistance coming from new maintenance-reducing coatings and self-cleaning capabilities, enhancing the performance of the treatment systems [19,20].
We have reviewed the existing purification methods according to the typical variability of effluents’ characteristics when these methods are applied to automotive painting processes, while identifying the advantages and disadvantages of each treatment process to suggest those that would increase water recirculation into the process. A detailed techno-economic assessment study was performed to estimate the costs associated with the selected treatment processes, namely the fixed cost per car and the income from water savings per car. Alongside that, such an approach applied by a company in the automotive sector can be considered an asset to a company’s reputation and recognition due to its commitment to the implementation of greener and more sustainable technologies.

2. Materials and Methods

2.1. Materials and Analytical Methods

The characterization of the aqueous effluents from the painting process and cooling towers was performed by the following methods:
The chemical oxygen demand (COD) was determined through a cuvette method, for which pre-dosed cuvettes containing sulfuric acid and potassium dichromate solutions in the presence of silver sulfate, kit LCK514 100–2000 mg/L O2 (Hach Lange, Düsseldorf, Germany), were added to a 2 mL water sample and placed in an HT 200 S reactor (Hach Lange, Düsseldorf, Germany) at 170 °C for 15 min before being put in a spectrophotometer DR2800 (Hach Company, Colorado, United States) [21].
The biochemical oxygen demand (BOD5) was measured by a respirometry method [14], with the use of an OxiTop® IS 12 system (Fisher Scientific, MA, USA) to study carbon dioxide absorption. To achieve that, the water had to be in contact with different buffer solutions of phosphate, magnesium sulfate heptahydrate, calcium and iron chloride and solid sodium hydroxide. As continuous agitation was applied for 5 days, the value given by the system should be multiplied by the dilution factor previously known.
Nitrate (NO3) and nitrite (NO2) concentrations in the water sample were determined using a spectrophotometric method. Both needed a sulfanilamide solution as a reagent and NED (N-(1-naphthyl) ethylenediamine) solution as a color dye to read the water’s absorbance in an E-1000V spectrophotometer (Peak Instruments, Buxton, Derbyshire, UK). The only difference between these substances’ measurement methods was that, in the test for NO3, pre-filtration with zinc was performed [22,23].
An inductively coupled plasma atomic emission spectroscopy (ICP-AES) method [24] was used to determine elements in a sequential ICP Horiba Jobin Yvon ULTIMA with Horiba Jobin YVon ICP Analyst 5.4 software, along with a monochromator, a Czery Turner spectrometer (Horiba Scientific, Kyoto, Japan) and argon gas.
Total alkalinity and hardness were determined using a titration method with 0.1 N sulfuric acid solution and bromocresol green as color dye in a 10 mL sample to measure alkalinity, as well as 0.01 M EDTA, ammonia buffer solution and Eriochrome black T as color dye in a 25 mL sample to measure hardness.
Other parameters such as pH, conductivity and turbidity were obtained through digital measurements with a 914 instrument (Metrohm, Herisau, Switzerland) and a turbidimeter (98703) from Hanna Instruments, Rhode Island, USA [25].
Lastly, the total dissolved solids were determined using a gravimetric method with a stove (Selecta, Barcelona, Spain) and a desiccator [25].
Most samples were stored in a refrigerator, except for those in which COD was measured; those samples needed be analyzed on the collection day to avoid the addition of acids.
Economic viability was evaluated through calculations that involved equipment and utility prices, with an investment and exploitation plan in mind to simulate the possible payback of each process using Aspen Plus V11+.

2.2. Case Study

The study was conducted in an automobile company plant in Portugal. The effluents that were, later, subjected to a treatment assessment were produced during the process of painting the metallic surface of a car [26].
The overall painting process begins with a pre-treatment of the car’s metallic surface.
As shown in the simplified scheme in Figure 1, the car goes through a degreasing stage, which consists of an aqueous alkaline solution with surfactants.
In the activation stage, a film of crystallization nuclei is formed on the surface of the car in an aqueous solution of titanium salts.
The most important stage is phosphating, when a layer of phosphate crystals is formed in an aqueous solution of zinc, manganese and phosphoric acid, which improves the surface’s ability to resist corrosion.
The passivation step consists of applying an aqueous acid solution that seals all pores of the coating layer.
In between these stages, there are some washing stages divided into soaking and aspersion phases, performed with fresh water that is cascaded from one phase to another, to remove particles, forming three final effluents: those from the degreasing washing stage, the phosphating washing stage and the passivation washing stage.
The effluents that end up in the sewer go to a wastewater treatment plant, while the others are returned to the process.
Alongside this painting process, there are other processes in the plant, such as the cooling processes needed in the manufacturing process that occur in cooling towers, which cool down water through evaporation. In the cooling towers, to prevent incrustations, there are periodic washes known as blowdowns; these washes result in so-called blowdown effluent, which is also sent to the wastewater treatment plant.
The effluents that were the object of the present study came from the degreasing washing stage and the cooling towers, as these were identified as the largest consumers of water in the production plant.

3. Results and Discussion

3.1. Characterization of Effluents

In total, 220 effluent samples were collected over 7 weeks, between one and three times per week, on Mondays, Wednesdays and Fridays, to analyze the variability of the parameters.
Regarding the measured COD, as can be seen in Figure 2, most of the values showed little variability, as the COD values of the cooling towers samples remained within the range of 30 to 40 mg/dm3 O2, whereas most of the COD values of the degreasing washing stage samples remained at 1400 to 1500 mg/L O2, with the exception of one point value reaching 2000 mg/dm3 O2. That point was considered a sporadic event that may be related to the fact that the sample could have been collected from a point with a greater accumulation of residues or the possibility that, on that day, there was an excess of degreasers in the water [27].
It is important to measure COD levels, as high levels indicate that there is a significant organic load in the water, which may require further treatment, and if there is a reduction in COD after treatment, it means that organic pollutants have been removed.
The biochemical oxygen demand, BOD5, was only measured on one day of the week, as all that was needed was an indicative value. On that day, 10 July 2023, the collected cooling tower sample showed a result of 24 mg/dm3 O2, while the degreasing washing stage showed a result of 1100 mg/dm3 O2. The margin of error was ±3–5%.
As expected, the COD values were higher than the BOD5 values, and the ratio between these parameters was high, which means that the water samples had a significant presence of non-biodegradable compounds that were used in the degreasing process; therefore, chemical and physical treatment are the most recommended forms of treatment.
It is also important to measure nitrate and nitrite levels, as high levels of these anions may lead to encrustations on the metal surface of the car as it goes through the painting process. Figure 3 and Figure 4, which present the values obtained, show that both concentrations were very low and not problematic for the treatment process.
Table 1 shows the concentrations obtained for calcium (Ca), iron (Fe), potassium (K), magnesium (Mg), manganese (Mn), nickel (Ni), phosphorus (P), sulfur (S), silica (Si) and zinc (Zn). The table presents the average values obtained for each substance among the wastewater samples, as these values did not differ much (the margin of error was within 0.1–1%).
As there was a null value of manganese concentration in the cooling tower, it can be said that this concentration was below its limit of detection, or LOD, as shown in Table A1 (Appendix A).
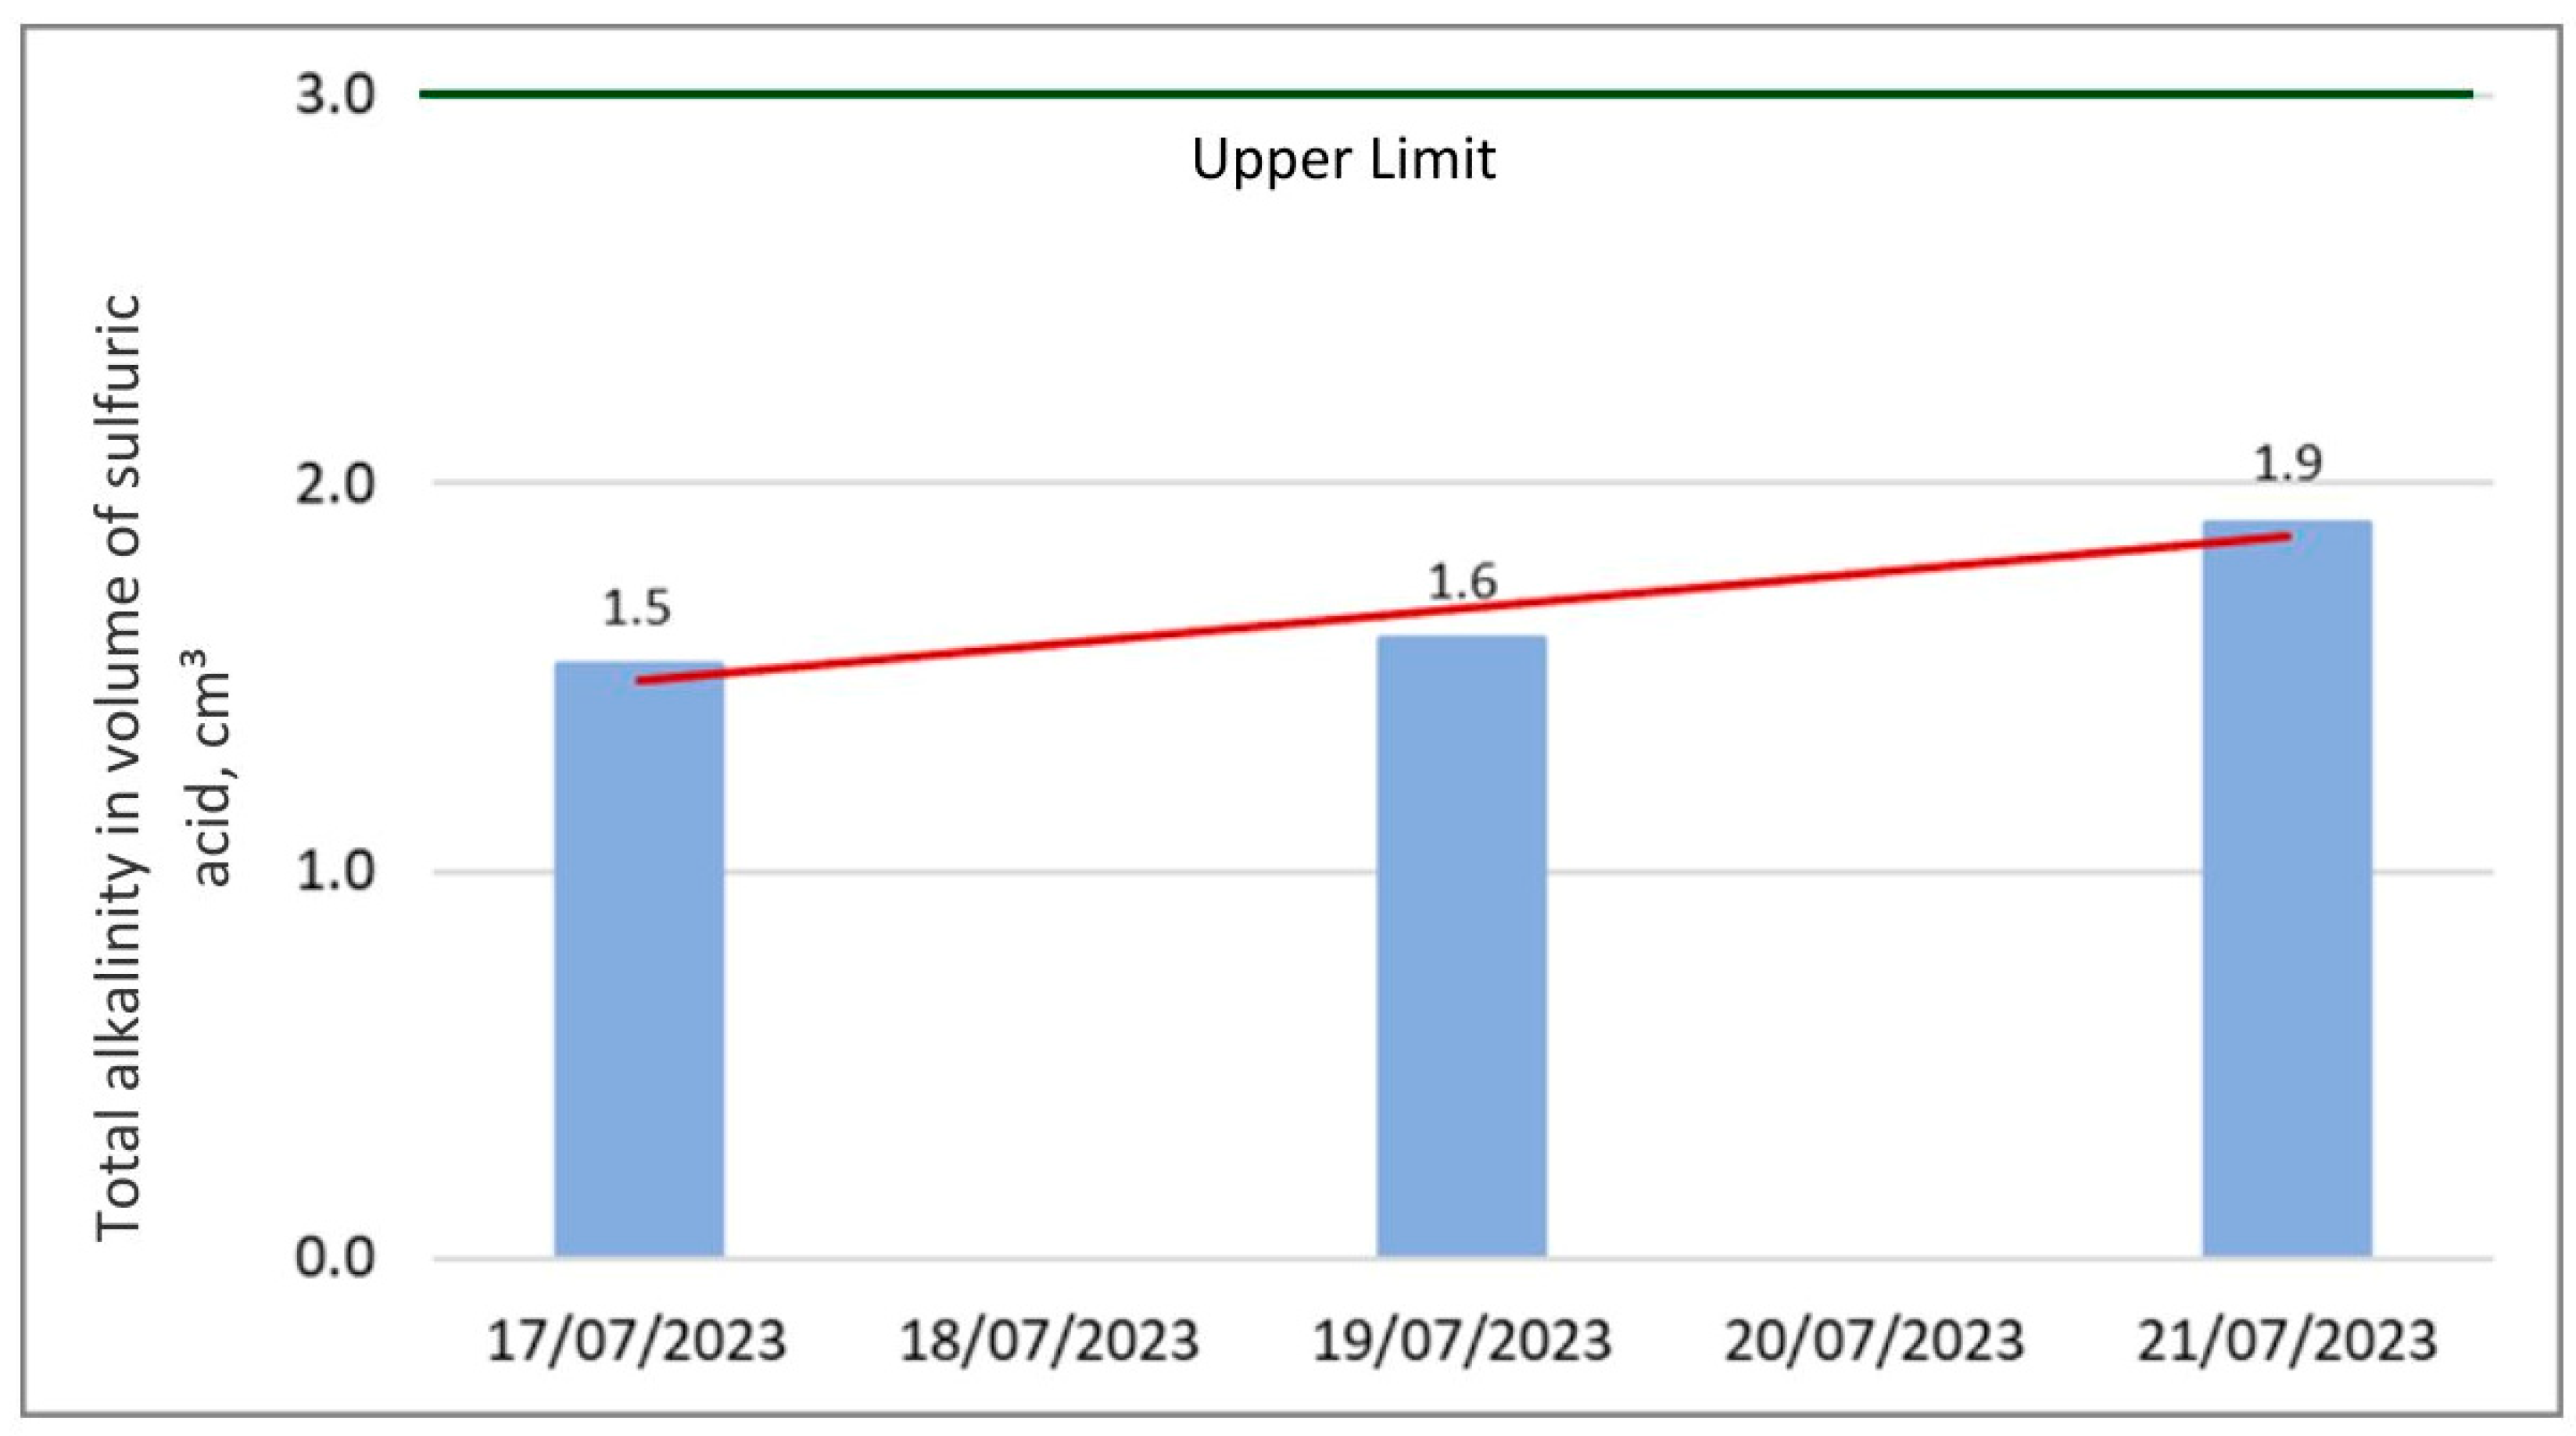
The measurement of total alkalinity for the degreasing washing stage is very important, as the control of alkalinity is essential for the painting process. During the painting process, there are steps that consist of alkaline baths that remove grease; in that case, if there are no limits on total alkalinity, there might be contaminants or residues left on the surface, which can affect paint adhesion. Low total alkalinity also reduces the risk of corrosion on the metal surface of the car body. Therefore, a proprietary method was developed in the company based on the volume of acid added, which corresponds to so-called “alkalinity” “points” that are defined by the company. As the expected value could not be more than three points, Figure 5 shows that the alkalinity values were below the established maximum limit.
The pH of each effluent indicated that there was very little data variability, as shown in Figure 6. The washing stage’s pH was within the stipulated range between 8 and 10. While the cooling water does not have a specified range, the pH is controlled. As expected, the washing stage’s pH was higher than the cooling tower’s pH due to the required alkaline treatment.
The conductivity values (presented in Figure 7) of the degreasing washing stage was measured on-site using a conductivity meter, while the cooling tower’s conductivity was managed at a set point, where water was added in the case that conductivity exceeded a certain value, preventing incrustations on the tower. These incrustations can be a result of deposition of solid materials and the precipitation of salts, such as calcium carbonate, that are present in the cooling tower’s water.
To evaluate the hardness of the samples (Figure 8), titration was performed with EDTA. According to the data obtained, it was concluded that the water samples presented relatively high values of hardness, as the calculated concentration of calcium carbonate, CaCO3, exceeded 300 mg/dm3. These hardness values do not represent a major risk concerning microfiltration and ultrafiltration treatment and are not expected to cause scaling. However, upon reaching the reverse osmosis system, the water’s hardness should be below 0.1 mg/dm3 CaCO3.
Figure 9 presents turbidity values for the samples taken from the cooling tower, which did not vary significantly, in contrast to the washing stage turbidity values. This can be explained by the fact that the washing stage’s water contains degreasers, which give it a grayish appearance compared to the colorless water of the cooling tower. As the values show a repetitive trend, it is possible to say that this happens in weekly cycles, as the first and the last value of the plot were both registered on Fridays. Throughout the week, the value is then expected to increase. As the value decreases from Friday to Monday this is related to the maintenance, which takes place during the weekend when the baths are discharged and renewed.
In order to use microfiltration and ultrafiltration as treatment, the turbidity levels of the wastewater should be no higher than 10–20 NTU; if the levels are higher, the water should be subjected to pre-treatment [28]. On the other hand, reverse osmosis membranes have enhanced performance when turbidity values are below 0.1 NTU [28].
Finally, the analysis of total dissolved solids (Figure 10) showed that the washing stage was the one with higher amounts of total dissolved solids, which may be related to the fact that it involves the steps of cleaning and deposition of particles on the car. The cooling towers’ total dissolved solid concentration was lower but still above zero, since the water contains salts and biocides.
As microfiltration and ultrafiltration mostly target suspended solids, dissolved solids do not represent a concern for the RO membrane’s performance.

3.2. Proposed Treatment Methods

3.2.1. Alkaline Waters with Surfactants

As one of the effluents being studied stems from the first washing stage of the process, this residual water is alkaline and contains surfactants.
Considering the alkaline composition of the wastewater, several purification methods were reviewed, such as weak acid dealkalization (WAC), strong acid dealkalization (SAC) and pH control with carbon dioxide. These options rely upon a degasser and use chemicals, with the exception that SAC is only regenerated with sulfuric acid and may require an extra pre-treatment step [29,30]. pH control using carbon dioxide is more sustainable, but the cost may fluctuate with the price of carbon dioxide and the costs of its transport and storage, and it is more efficient at higher flow rates [31,32,33]. Accordingly, WAC is the most appropriate treatment step [34,35].
As for the surfactants’ removal, their extraction can be achieved through powdered activated carbon (PAC) adsorption pre-treatment followed by microfiltration, since the PAC removes most organic matter and increases the susceptibility of the membrane to remove compounds with higher molecular weight [36,37,38]. This treatment option is more suitable than chemical electrocoagulation, since the latter is an intensive process requiring a great deal of maintenance [39,40].
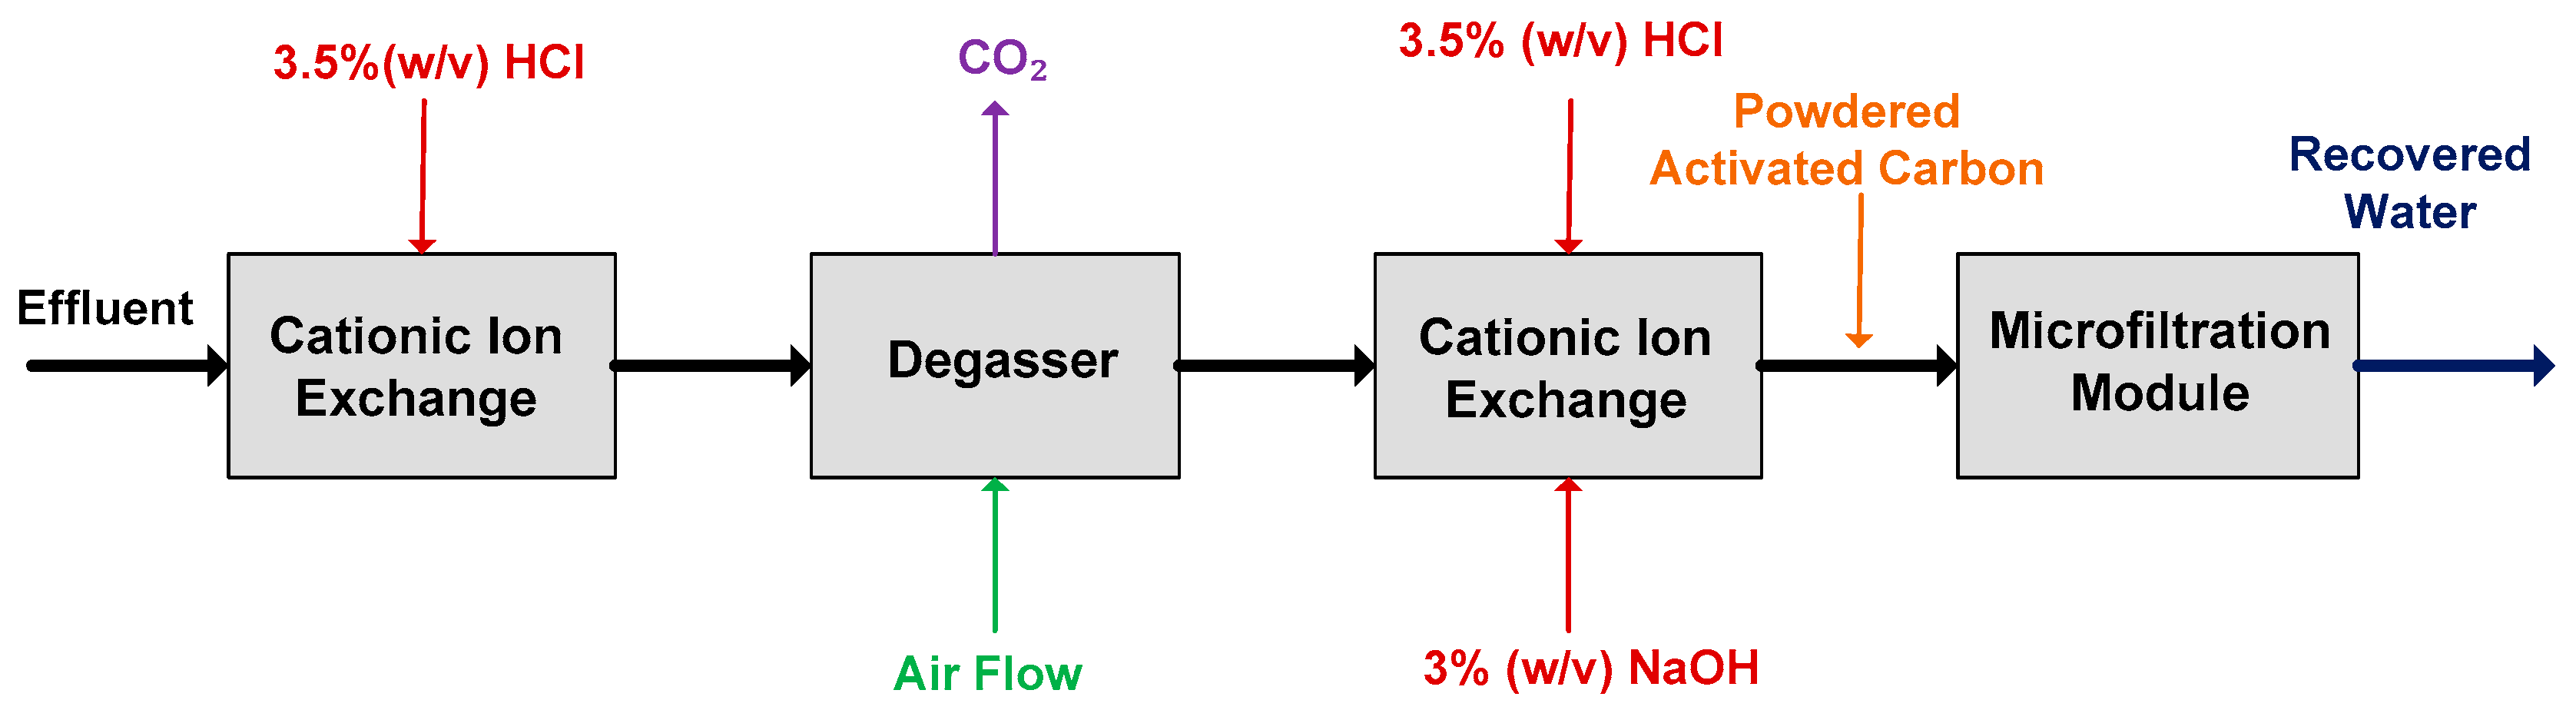
Figure 11 presents a schematic of the treatment process for alkaline wastewater with surfactants. The selected treatment to reduce the water’s alkalinity was based on a study by Wiegert R.E [35]. WAC was chosen because it is more advantageous in terms of reduced system complexity, easier handling of the reagents involved in the process and lower associated costs.
The effluent of the washing stage leaves the process at a temperature of roughly 30 to 35 °C at a pressure of 1 bar. Wastewater enters the first weak acid cation exchange column in hydrogen form, where the carbonate and bicarbonate are converted into carbonic acid, which undergoes hydrolysis in an aeration pass through decarbonization unit, where air travels across the column in a countercurrent flow mode, transporting CO2 to the top to be vented out.
Since the effluent may still contain residual acidity, it enters a second ion exchange column in a sodium form to replace hydrogen ions with sodium ions. The carboxylic resins in both columns can be fully regenerated by hydrochloric acid. The resin in the second column is converted into sodium form by sodium hydroxide.
To carry on the material balance of the process, some simplifying considerations were made, such as the compositions of the effluent, in which 85% is water, 10% consists of electrolytes and 5% consists of surfactants. The initial flow rate was 100 dm3/h.
According to available research, the efficiency of water recovery in the ion-exchange stage is 90% [41]. Thus, in order to estimate the electrolyte removal efficiency, elementary substance analysis was needed to obtain the concentrations of the main chemical elements in the effluent, before defining the most common ions in which they are present in the effluent considering the pH dependence [42,43,44,45,46,47]. The electrolyte removal efficiency was found to be 91.7%, and the water’s hardness decreased by 75%.
As for the surfactants, the most commonly present in the automotive industry water-based paints is ethoxylated nonyl phenol; this compound was assumed to be the one present in the water, as the exact one was not revealed by the company due to an agreement with its supplier. The fact that this surfactant is non-ionic means that it is not retained in the ion exchange system and moves on to the next stage of the process [48].
With the aim of removing the surfactants from the water as well as other materials, Song Y. et al. suggested a microfiltration system with pre-treatment by powdered activated carbon addition [37]. As a result, the water from the ion exchange system was deposited in a tank where powdered activated carbon was added and mixed in; this substance removed organic matter from the water. Based on the proportion applied in [37], a value of 90 g/dm3 of powder was selected in the present study.
Afterwards, the water passes through a microfiltration membrane, which prevents any powdered activated carbon particles from passing through and retains the organic matter already absorbed by the same compound.
The microfiltration system is made up of a polyvinylidene fluoride (PVDF) hollow fiber membrane; it can be illustrated by Synder Filtration’s VO.1 membrane; which operates under the same conditions of the process, at 1 bar, and has the recommended nominal pore size of 0.1 µm [49].
This system also includes a tank for the final effluent and other tanks for the cleaning solutions containing oxalic acid and sodium hypochlorite, respectively.
The impurity removal efficiency was 98%, the chemical oxygen demand decreased by 64% and the turbidity decreased by 97% [50,51]. The total water recovery of the microfiltration step was considered 88%.

3.2.2. Cooling Tower’s Water with Salt and Biocides

Reverse osmosis has been applied to purify cooling tower water containing high mineral content and biocides; it is preceded by other methods, such as powdered activated carbon (PAC) adsorption and ultrafiltration, since they have shown better results than a coupled coagulation, sand filtration and ultrafiltration, with permeate reduction of 50% [52,53,54,55].
Figure 12 below shows a simplified version of this treatment process.
Given the intricacy of both ultrafiltration and reverse osmosis systems, it was necessary to simulate both methods using a dedicated software (https://membranes.com/solutions/software/) created by the Hydranautics Nitto Group Company, which provides membrane design.
The effluent’s initial flow is on the order of magnitude of 10 m3/day, and it leaves the process at a temperature of around 30 to 35 °C, at 5 bar. The HYDRAcap MAX40 membrane (Hydranautics Nitto, Oceanside, CA, USA) was selected, which is a polyvinylidene fluoride (PVDF) hollow-fiber membrane that works with volumetric flows between 1.7 and 5.5 m3/h, thus ensuring that the effluent’s initial flow is within the required limits; its operating temperature cannot exceed 40 °C, and the maximum feed pressure is 5 bar [56]. Data such as temperature and turbidity were provided by the painting company. The values of the parameters used in the ultrafiltration simulation are presented in Table 2.
The software simulation recommended the use of one membrane module per six racks of specified dimensions and postulated that three pumps, three vents and one chemical dispenser would be needed. It also showed that the process should be running 24 h a day, with an ultrafiltration time of 40 min and approximately 30 complete cycles of 50 min each. Thus, 77% of water was recovered and fed to the reverse osmosis system also designed using the same software tool.
In the simulation input of the reverse osmosis system, pH, turbidity, pressure, temperature and known concentration values of ions obtained from the ICP analysis data (Table 1) were introduced as inputs (Table 3). In order to satisfy the charge balance, the software adjusted the concentrations of ions such as HCO3 and PO43− which speciation is pH-dependent.
The most appropriate option to treat the permeate volumetric flow recovered by the ultrafiltration module was identified to be the SWC4-LD membrane, which is made of spiral-wound polyamide composites, operates at a room temperature and maximum pressure of 5.5 MPa. The software recommended a reverse osmosis module with two membranes in a single vessel. In this way, the overall water recovery efficiency of the reverse osmosis process was 68%.

3.3. Techno-Economic Analysis

In order to estimate the costs associated with each process, first it was necessary to perform sizing of each component of equipment listed in Appendix B. One of the most important equipment are the storage tanks, that are used in various industries, most of them designed according to the API-350 specification from the American Petroleum Institute [57].
The specification indicates that liquids can be stored within a certain range of temperatures and pressures in vertical cylindrical tanks. In this way, the effluents were stored in fixed flat roof tank while reagents were stored in fixed roof tanks with dome shape.
For each tank, parameters such as volume, diameter, height were obtained, which range of values are in the table below. The choice of material of the effluent tanks was based on what is commercially available, while the others depended on the corrosiveness of the compounds. The chosen residence time relies on the operation time and the downtime in case of regeneration or maintenance, with some excess for contingencies (Table 4).
The sizing of the ion exchange columns was carried out using the design proposed by Windsor B., Purolite International [58] and Clifford [59] (Table 5).
The chosen resin was the Amberlite IRC-76, a carboxylic acid cationic resin manufactured by Lenntech for weak acid cation exchange [60]. This resin is efficient in regeneration, has high cation exchange capability and operational stability [61].
For the estimation of the base equipment costs on Table 6 and Table 7, sources such as manufacturers or sellers web pages were consulted through which a given equipment cost was provided and then updated to the most recent available year using the Chemical Engineering Plant Cost Index, CEPCI [61,62]. Microfiltration, ultrafiltration and reverse osmosis costs were assessed using the software.
To estimate the “fixed” investment of each project, the factor method was used, a most accurate and detailed one, that considers percentages over the base equipment for a preliminary estimation of the total cost [63].
Thus, the parameters included all those related to direct costs, that is, the base equipment and its installation, piping, control instrumentation and pumps, electrical installation and new facilities that may need to be acquired, as well the operational costs meaning the utilities and services.
Apart from the parameters above, there were others associated with indirect cost, which include the cost of the project and its supervision based on the base equipment as well as a contingency provision based on the sum of direct and indirect costs.
Table 8 shows a summary of the values of the investment and operational costs mentioned previously normalized per car produced, considering an average total number of 231 thousand cars manufactured in a year.
In this way, the total fixed cost for the treatment of the degreasing washing stage would be EUR 245,000, from which each car treatment would cost around be EUR 1.06, whereas the total fixed cost for the cooling tower’s system would be EUR 582,000, corresponding to EUR 2.52 per car.
The next phase was to establish an investment plan for the implementation of each treatment system. For both projects, the data were obtained considering that they would be implemented within a year, since the facilities, acquisition of equipment and reagents, supervision, testing and staff training need to be properly evaluated.
Following the investment year, an operating period was considered, during which the only ongoing investment would be utilities and services, following the approach used in [64]. To estimate the income from the water treatment processes, the volume of water recovered in each process was considered, as well as the following water price, EUR 4.36/m3 provided by the painting company.
This was used to infer how much could be saved through recovery, as this water would be reused in other stages or areas of the company.
The expected income was obtained considering that the plant operates 330 days a year, 24 h a day. Further calculations show that EUR 15,000 worth of water can be recovered by treating the degreasing washing stage in total of cars corresponding to EUR 0.07 worth of water per car. In the case of the cooling tower’s treatment, about a total of EUR 31,000 can be recovered in water (i.e., EUR 0.13 worth of water per car).
The Net Present Value (NPV) was calculated based on the present value of expected revenues minus the investment and operating costs. The NPV was calculated for each process using the total annual fixed costs of each system, for the years to follow project’s advances (Table 9 and Table 10), considering the present Portugal’s interest rate of 5% for the costs update over the years [65].
As can be seen, the NPV becomes increasingly negative, i.e., the project is losing value over time. This can be explained by the fact that the NPV depends on future estimates which are uncertain, as it assumes that the interest rate remains constant rather than changing from year to year and does not consider an exact time horizon of the project [64,65,66,67]. The possibility of encountering adverse economic conditions in the future and changes in chemicals and water costs that depend on their suppliers are factors that also contribute to a continuously negative NPV [68,69].
Apart from that, a sensitivity analysis was performed for both treatment systems in regards of the fixed investment and the net present value, with the following range of variation of −20% to 80%.
Through this analysis, it was possible to conclude that a variation of 10% of the fixed investment value of the degreasing treatment system resulted in an 8% variation of the net present value. While the same variation of 10% of the cooling tower’s system’s fixed investment resulted in a 9% variation of its net present value.
There was a linear relation between the two parameters: fixed investment and net present value, meaning that they increase simultaneously.

4. Conclusions

The present study carried out in an automotive company had the goal of evaluating the feasibility of implementing membrane-based water treatment options in the car painting process. The purpose of the study was to recover water and reuse it in the process making it more economically feasible thus also contributing to the company’s sustainability and image objectives.
The assessment of chemical and physical parameters including chemical and biochemical oxygen demand, nitrites, nitrates, elemental substances, acidity, total alkalinity, pH, conductivity, hardness, turbidity and total dissolved solids, provided a comprehensive characterization of the wastewater effluents. The physicochemical analysis showed that the water from all stages is generally hard. Notably, the washing stage displayed a greater demand for oxygen to facilitate de-pollution, with elevated BOD5 values. Washing stage effluent was found to contain nitrite and nitrate and was visually more turbid. Elemental analysis identified the composition of specific ionic compounds present in the effluents.
Since alkaline and hard wastewater effluent containing surfactants is released from the washing stage, a treatment sequence involving ion exchange with weak acid cationic resins, followed by PAC adsorption and microfiltration. For water from the cooling tower containing salts and biocides, PAC adsorption as the initial step, followed by ultrafiltration and reverse osmosis treatment was considered and evaluated.
Volumetric balances for each treatment system demonstrated that recovery rates reached 88% for the washing stage effluent and 68% for the cooling towers effluent.
The economic viability analysis revealed that the total fixed investment is EUR 245,000 for the washing stage treatment system and EUR 582,000 for the cooling tower system, which, normalized to the total number of treated cars, corresponds to EUR 1.06 per car for the washing step and EUR 2.52 per car for the cooling tower’s wastewater treatment. The proposed investment and operating plans for each method indicated returns of a total of EUR 15,000 (EUR 0.07 per car) for the washing stage and a total of EUR 31,000 (EUR 0.13 per car) for the cooling tower.

Author Contributions

Conceptualization, M.E. and S.V.; methodology, M.E. and S.V.; software, M.E. and S.C.; validation, M.E. and S.C.; formal analysis, M.E. and S.C.; investigation, S.C.; data curation, M.E. and S.C.; writing—original draft preparation, S.C.; writing—review and editing, M.E. and S.V.; visualization, M.E.; supervision, M.E. and S.V.; project administration, M.E. All authors have read and agreed to the published version of the manuscript.

Funding

This work received support and help from FCT/MCTES (LA/P/0008/2020 DOI 10.54499/LA/P/0008/2020, UIDP/50006/2020 DOI 10.54499/UIDP/50006/2020 and UIDB/50006/2020 DOI 10.54499/UIDB/50006/2020) through Portuguese national funds.

Acknowledgments

This work received support and help from FCT/MCTES (LA/P/0008/2020 DOI 10.54499/LA/P/0008/2020, UIDP/50006/2020 DOI 10.54499/UIDP/50006/2020 and UIDB/50006/2020 DOI 10.54499/UIDB/50006/2020) through Portuguese national funds.

Conflicts of Interest

The authors declare no conflicts of interest.

Appendix A

Table A1 shows the standard detection limit for each element measured by ICP-AES.
Table A1. Standard detection limits of substances in the ICP-AES analysis.
Concentration (mg/dm3)LOD
Ca0.0008
Fe0.0006
K0.0328
Mg0.0003
Mn0.0001
Ni0.0016
P0.0150
S0.0054
Si0.0035
Zn0.0005

Appendix B

To study the economic viability of each treatment process, there was a need to perform equipment sizing.
Firstly, we determined the liquid volume of each tank, which is directly related to the liquid volumetric flow rate and its residence time given by the following equation.
V s t o r e d = Q v × t r  
where
  • V s t o r e d : stored liquid volume, m3;
  • Q v : volumetric flow rate, m3/h;
  • t r   :   residence time, h
To determine the tanks’ total volume, it was necessary to calculate the volume matching the cylindrical section and dome section according to each type of tank, as some of them, for example, the effluent tanks, only contained a cylindrical portion, while others, such as the reagent tanks, had both cylindrical and dome portions to consider.
As the tanks do not operate at full capacity, a safety factor of 10% was applied when calculating the cylindrical portion of the tank.
V c y l i n d r i c a l = V s t o r e d 0.9  
where
  • V c y l i n d r i c a l : volume of cylindrical portion, m3;
  • V s t o r e d : stored liquid volume, m3.
The tank’s diameter is calculated from the cylindrical volume of the tank and the height-to-diameter ratio of 0.7 for vertical cylinders.
D t = 4 × V c y l i n d r i c a l π × H D 1 3
where
  • D t :   tank’s diameter, m;
  • V c y l i n d r i c a l : volume of cylindrical portion, m3;
  • H D : height-to-diameter ratio.
Once the tank’s diameter is known, it is possible to calculate the volume of the dome portion.
V d o m e = π × D t 2 × H D × D t 12
where
  • V d o m e : volume of dome portion, m3;
  • D t :   tank’s diameter, m;
  • H D : height-to-diameter ratio.
The cylinder’s height was calculated with the following equation:
H c y l i n d e r = H D × D t
where
  • H c y l i n d e r : cylinder’s height, m;
  • D t :   tank’s diameter, m;
  • H D : height-to-diameter ratio;
The liquid’s height is given by
h = V s t o r e d π × R t 2
where
  • h :   liquid’s height, m;
  • V s t o r e d : stored liquid volume, m3;
  • R t :   tank’s radius, m.
As liquids exert pressure, the hydrostatic pressure was calculated:
P h = ρ × g × h
where
  • P h : hydrostatic pressure, atm;
  • ρ : density, kg/m3;
  • g : gravitational acceleration, m2/s (9.8 m2/s);
  • h : liquid’s height, m.
Therefore, the total pressure of the tanks was obtained by adding the storage pressure to the hydrostatic pressure.
The volume of resin in each ion exchange column was calculated with the following equation. It is important to note that the volume was then rounded off by adding 25 L in excess as a contingency allowance.
V r e s i n = A v e s s e l × D e p t h b e d
where,
  • V r e s i n : volume of resin per ion exchange unit, m3;
  • A v e s s e l : vessel area, m2;
  • D e p t h b e d : bed depth, m.
The ion exchange column’s diameter was calculated from the volume of resin and the bed depth, which corresponds to the column’s height:
D c = 4 × V r e s i n π × h
where
  • D c : column’s diameter;
  • V r e s i n : volume of resin, m3;
  • h : column’s height, m.
Regarding the regeneration stage, a 24 h cycle was considered, which allowed the calculation of the production capacity of the resin.
Q = Q V × t
where
  • Q : production capacity, m3;
  • Q V : effluent’s volumetric flow rate, m3;
  • t : regeneration cycle time, h.
In terms of the degasser unit, it was important to verify whether Stokes’ law was valid, meaning Re < 2. After this, the terminal velocity of bubbles and Reynolds’ number were calculated:
V t = 5.45 × 10 10 × D p 2 μ L × ρ L ρ G
where
  • V t : terminal velocity of bubbles, m/s;
  • D p : bubble diameter, μm;
  • μ L : liquid viscosity, cP;
  • ρ L : liquid density, kg/m3;
  • ρ G : gas density, kg/m3.
R e = V t × D p × ρ L μ L × 1000
where
  • R e : Reynolds’ number, dimensionless;
  • V t : terminal velocity of bubbles, m/s;
  • D p : bubble diameter, μm;
  • μ L : liquid viscosity, cP;
  • ρ L : liquid density, kg/m3.
The degasser’s diameter is given by
D = H H D
where
  • D : degasser’s diameter, m;
  • H : degasser’s height, m;
  • H D : height-to-diameter ratio.
To update equipment prices, the Chemical Engineering Plant Cost Index values from different years were used in the following equation:
  Equipment   Cos t   C u r r e n t   Y e a r Equipment   Cos t     P r e v i o u s   Y e a r   = C E P C I   C u r r e n t   Y e a r C E P C I   P r e v i o u s   Y e a r
The updating rates for each year of exploitation were calculated from the current interest rate in Portugal.
  Update   Rate = 1 ( 1 + t ) n
where
  • t : interest rate, %;
  • n : year.

References

  1. Kiliç, Z. The importance of water and conscious use of water. Int. J. Hydrol. 2020, 4, 239–241. [Google Scholar] [CrossRef]
  2. Lee, A.; Elam, J.W.; Darling, S.B. Membrane materials for water purification: Design, development, and application. Environ. Sci. Water Res. Technol. 2016, 2, 17–42. [Google Scholar] [CrossRef]
  3. Water Framework Directive, European Commission. Available online: https://environment.ec.europa.eu/topics/water/water-framework-directive_en (accessed on 7 November 2024).
  4. Implementing Water Economics in the EU Water Framework Directive, OCDE. Available online: https://www.oecd.org/en/publications/implementing-water-economics-in-the-eu-water-framework-directive_d6abda81-en/full-report.html (accessed on 7 November 2024).
  5. European Federation of Pharmaceutical Industries and Associations. White Paper on Circular Economy. Available online: https://www.efpia.eu/media/htreo44j/white-paper-on-circular-economy.pdf (accessed on 7 November 2024).
  6. How the EU Wants to Achieve a Circular Economy by 2050? Available online: https://www.europarl.europa.eu/topics/en/article/20210128STO96607/how-the-eu-wants-to-achieve-a-circular-economy-by-2050 (accessed on 7 November 2024).
  7. Eisenreich, A.; Füller, J.; Stuchtey, M.; Gimenez-Jimenez, D. Toward a circular value chain: Impact of the circular economy on a company’s value chain processes. J. Clean. Prod. 2022, 378, 134375. [Google Scholar] [CrossRef]
  8. Morseletto, P.; Mooren, C.E.; Munaretto, S. Circular Economy of Water: Definition, Strategies and Challenges. Circ. Econ. Sustain. 2022, 2, 1463–1477. [Google Scholar] [CrossRef]
  9. Smol, M.; Duda, J.; Nowak, M. Business opportunities in water and wastewater sector. In Proceedings of the MonGOS International Conference: Water and Sewage in the Circular Economy Model, Cracow, Poland, 30 June–1 July 2022; 1 July 2022. [Google Scholar]
  10. Sustainable Development Goals. Available online: https://www.unglobalcompact.nl/sustainable-development-goals (accessed on 7 November 2024).
  11. Silva, J.A. Wastewater Treatment and Reuse for Sustainable Water Resources Management: A Systematic Literature Review. Sustainability 2023, 15, 10940. [Google Scholar] [CrossRef]
  12. Water Sustainability for The Automotive Industry. Available online: https://www.dupont.com/knowledge/water-efficiency-in-the-automotive-industry.html (accessed on 7 November 2024).
  13. Grégorio, C.; Lichtfouse, E. Green Adsorbents for Pollutant Removal, 1st ed.; Springer: Cham, Switzerland, 2018; pp. 1–21. [Google Scholar]
  14. Llopis, A.J. Advanced Technologies Applied to Wastewater Treatment Plant Effluents. Ph.D. Thesis, University of Barcelona, Barcelona, Spain, 2015. [Google Scholar]
  15. Jain, R.; Camarillo, M.K.; Stringfellow, W.T. Drinking Water Security for Engineers, Planners, and Managers, 1st ed.; Elsevier: London, UK, 2014; pp. 45–67. [Google Scholar]
  16. Gaviria, M.I.; Arango, J.P.; Barrientos, K.; Jaramillo, M. Encyclopedia of Sensors and Biosensors, 4th ed.; Elsevier: Amsterdam, The Netherlands, 2023; pp. 528–548. [Google Scholar]
  17. Krishnakumar, S.; Singh, D.; Godson, P.S.; Thanga, S.G. Environmental Science and Pollution Research; Springer: Berlin/Heidelberg, Germany, 2022; Volume 22, pp. 72309–72311. [Google Scholar]
  18. Ullah, M.; Innocenzi, V.; Ayedi, K.; Vegliò, F.; Ippolito, N.M. Automotive Wastewater Treatment Processes and Technologies: A Review; ACS Publications: Washington, WA, USA, 2024; Volume 4. [Google Scholar]
  19. Shon, H.K.; Vigneswaran, S.; Snyder, S.A. Effluent Organic Matter (EfOM) in Wastewater: Constituents, Effects, and Treatment. Crit. Rev. Environ. Sci. Technol. 2007, 36, 327–374. [Google Scholar] [CrossRef]
  20. Ultrafiltration Membranes Drive Innovation in Automotive Water Treatment Systems. Available online: https://www.marketresearchintellect.com/blog/ltrafiltration-membranes-drive-innovation-in-automotive-water-treatment-systems/?utm_source=chatgpt.com (accessed on 11 January 2025).
  21. Chemical Oxygen Demand (COD). Available online: https://fr.hach.com/asset-get.download.jsa?id=25593618016 (accessed on 7 November 2024).
  22. ISO 6777:1984; Water quality—Determination of nitrite—Molecular absorption spectrometric method. International Organization for Standardization: Geneva, Switzerland, 1984.
  23. Jenkins, P.; Southern, T.; Truesdale, V.; Jeary, A. Essential Environmental Science, Methods & Techniques; Routledge: London, UK, 1996; pp. 305–350. [Google Scholar]
  24. Mermet, J.M. Inductively Coupled Plasma Spectrometry and its Applications, 2nd ed.; Wiley: Hoboken, NJ, USA, 2006; pp. 27–60. [Google Scholar]
  25. Rice, E.W.; Baird, R.B.; Eaton, A.D. Standard Methods for the Examination of Water and Wastewater, 23rd ed.; American Water Works Association: Washington, WA, USA, 2017. [Google Scholar]
  26. Srivastava, N.T. Automotive Paints and Coatings, 1st ed.; Wiley: Hoboken, NJ, USA, 2009. [Google Scholar]
  27. ISO 6060; Water Quality—Determination of the Chemical Oxygen Demand. International Organization for Standardization: Geneva, Switzerland, 1980.
  28. How to Keep Your System in Peak Condition (TSB)? Available online: https://membranes.com/knowledge-center/technical-service-bulletin-tsb/ (accessed on 7 November 2024).
  29. Is Dealkalization by Ion Exchange Right for You? Available online: https://www.waterworld.com/residential-commercial/article/14308465/is-dealkalization-by-ion-exchange-right-for-you (accessed on 7 November 2024).
  30. Teller, R. Monitoring, Operation and Control of Ion Exchange Plant. Available online: https://www.soci.org/~/media/Files/Conference%20Downloads/2012/IEX%20Advanced%20Water%20course%20Sept%202012/Rob_Terrell_monitoring.ashx (accessed on 7 November 2024).
  31. Carbon Dioxide for pH Control. Available online: https://www.astisensor.com/Carbon_Dioxide_Versus_Mineral_Acids.pdf (accessed on 7 November 2024).
  32. pH Control Utilizing CO2. Available online: https://uk.airliquide.com/solutions/water-treatment/ph-control-utilising-co2 (accessed on 7 November 2024).
  33. Carbon Dioxide for pH Control, PWTAG Technical Notes. Available online: https://www.pwtag.org/carbon-dioxide-for-ph-control-august-2011/ (accessed on 7 November 2024).
  34. Water Handbook—Ion Exchange & Water Demineralization. Available online: https://www.watertechnologies.com/handbook/chapter-08-ion-exchange#CLASSIFICATIONS%20OF%20ION%20EXCHANGE%20RESINS (accessed on 7 November 2024).
  35. Wiegert, R.E. Process for Removing Alkalinity and Hardness from Waters. EP0015098A1, 3 September 1980. [Google Scholar]
  36. Menya, E.; Olupot, P.W.; Storz, H.; Lubwama, M.; Kiros, Y. Production and performance of activated carbon from rice husks for removal of natural organic matter from water: A review. Chemcial Eng. Res. Des. 2018, 129, 271–296. [Google Scholar] [CrossRef]
  37. Song, Y.; Dong, B.; Gao, N.; Ma, X. Powder Activated Carbon Pretreatment of a Microfiltration Membrane for the Treatment of Surface Water. Int. J. Environ. Res. Public Health 2015, 12, 11269–11277. [Google Scholar] [CrossRef] [PubMed]
  38. Membrane Filtration: Microfiltration. Available online: https://fctwater.com/membrane-filtration-microfiltration/ (accessed on 7 November 2024).
  39. Winoto, H.; Gunawan, D.; Indarto, A. Efficient Phosphate Recovery from Fertilizer Wastewater Stream Through Simultaneous Ca and F Ions Removal; Elsevier: Amsterdam, The Netherlands, 2020; pp. 369–400. [Google Scholar]
  40. Advantages and Disadvantages of Electrocoagulation Water Treatment. Available online: https://chemtech-us.com/advantages-and-disadvantages-of-electrocoagulation-water-treatment/ (accessed on 7 November 2024).
  41. Ramzan, N.; Feroze, N.; Kazmi, M.; Ashraf, M.; Hasan, S. Performance analysis of cation and anion exchangers in water treatment plant: An industrial case study. Pol. J. Chem. Technol. 2012, 14, 35–41. [Google Scholar] [CrossRef]
  42. Dahmani, K.; Kherroub, D.E.; Boucherdoud, A.; Bestani, B. Removal of Ca(II) and Mg(II) hardness by ion exchange resins and soda ash for seawater pretreatment to reduce scale formation in evaporators multi-stage flash desalination. Desalination Water Treat. 2021, 221, 23–30. [Google Scholar] [CrossRef]
  43. Płotka, M.; Glamowski, P.; Żukowski, W.; Bajda, T. An assessment of an ion exchange resin system for the removal and recovery of Ni, Hg, and Cr from wet flue gas desulphurization wastewater—A pilot study. RSC Adv. 2022, 12, 5145–5156. [Google Scholar]
  44. Yang, B.; Li, C.; Wang, J.; Wei, W.; Hao, B.; Yang, L.; Tang, J.; Zhang, C. Removal of nickel ions from automobile industry wastewater using ion exchange resin: Characterization and parameter. IOP Conf. Ser. Earth Environ. Sci. 2020, 467, 012182. [Google Scholar] [CrossRef]
  45. Bektaş, T.E.; Uğurluoğlu, B.K.; Tan, B. Phosphate removal by Ion exchange in batch mode. Water Pract. Technol. 2021, 16, 1343–1354. [Google Scholar] [CrossRef]
  46. Zakaria, K.K.; Farag, H.A.; El-Gayar, D.A. Removal of Cu2+, Fe2+ and SO42− ions from industrial wastewater by ion exchange resins contained in a rotating perforated cylindrical basket of different heights. Sci. Rep. 2023, 13, 3248. [Google Scholar] [CrossRef] [PubMed]
  47. De, C.; Li, R.; Bian, R.; Li, L. Contribution of Soluble Minerals in Biochar to Pb2+ Adsorption in Aqueous Solutions. BioResources 2017, 12, 1662. [Google Scholar]
  48. Surfactants. Available online: https://www.zonadepinturas.com/en/2021010412444/articles/paints-and-coatings-1/surfactants.html (accessed on 7 November 2024).
  49. V0.1 (PVDF 0.1μm) Industrial MF Membrane. Available online: https://synderfiltration.com/2014/wp-content/uploads/2019/01/V0.1-PVDF-0.1um-Industrial-Specsheet.pdf (accessed on 7 November 2024).
  50. Zioui, D.; Martins, P.M.; Aoudjit, L.; Salazar, H.; Lanceros-Méndez, S. Wastewater Treatment of Real Effluents by Microfiltration Using Poly (vinylidene fluoride–hexafluoropropylene). Membr. Polym. 2023, 15, 1143. [Google Scholar] [CrossRef] [PubMed]
  51. Sillanpaa, M.; Park, Y. Natural Organic Matter in Water, 2nd ed.; Elsevier: Amsterdam, The Netherlands, 2023. [Google Scholar]
  52. Moazzem, S.; Wills, J.; Fan, L.; Roddick, F.A. Performance of ceramic ultrafiltration and reverse osmosis membranes in treating car wash wastewater for reuse. Environ. Sci. Pollut. Res. 2018, 25, 8654–8668. [Google Scholar] [CrossRef]
  53. Soliman, M.; Eljack, F.; Kazi, M.K.; Almomani, F.; Ahmed, E.; Jack, Z.E. Treatment Technologies for Cooling Water Blowdown: A Critical Review. Sustainability 2022, 14, 376. [Google Scholar] [CrossRef]
  54. Ahmed, J.; Jamal, Y.; Shujaatullah, M. Recovery of cooling tower blowdown water through reverse osmosis (RO): Review of water parameters affecting membrane fouling and pretreatment schemes. Desalination Water Treat. 2020, 189, 9–17. [Google Scholar] [CrossRef]
  55. Li, X.; Jiang, L.; Li, H. Application of Ultrafiltration Technology in Water Treatment. IOP Conf. Ser. Earth Environ. Sci. 2018, 186, 012009. [Google Scholar] [CrossRef]
  56. Capillary Ultrafiltration Module. Available online: https://membranes.com/wp-content/uploads/Documents/Element-Specification-Sheets/UF-MF/HYDRAcap-MAX/HYDRAcap-MAX-40.pdf (accessed on 7 November 2024).
  57. American Petroleum Institute, API 650: Welded Steel Tanks for Oil Storage. Available online: https://law.resource.org/pub/us/cfr/ibr/002/api.650.2007.pdf (accessed on 7 November 2024).
  58. Resin Types and Production. Available online: https://www.soci.org/-/media/files/conference-downloads/2012/iex-intro-water-sept-2012/brian_windsor_resin.ashx (accessed on 7 November 2024).
  59. Clifford, D.A. Water Quality and Treatment: A Handbook of Community Water Supplies, 5th ed.; American Water Works Association: Houston, TX, USA, 2017; Volume 9. [Google Scholar]
  60. Ion-Exchange-Resin-Comparison-Chart. Available online: https://www.lenntech.com/Data-sheets/Ion-Exchange-Resin-Comparison-Chart.pdf (accessed on 7 November 2024).
  61. Chemical Engineering Plant Cost Index (Averaged Over Year). Available online: https://magnehi.folk.ntnu.no/cepci_2011_py.pdf (accessed on 7 November 2024).
  62. Cost Indices. Available online: https://toweringskills.com/financial-analysis/cost-indices/ (accessed on 7 November 2024).
  63. Coulson, J.M.; Richardson, J.F.; Sinnott, R.K. Chemical Engineering: An Introduction to Chemical Engineering Design, 1st ed.; Elsevier: Amsterdam, The Netherlands, 1983; Volume 6. [Google Scholar]
  64. Cotter, E. Net Present Value and Payback Period: An Analysis. Honors Thesis, Western Michigan University, Kalamazoo, MI, USA, 2023. [Google Scholar]
  65. Portugal Interest Rates. Available online: https://www.ceicdata.com/pt/indicator/portugal/policy-rate (accessed on 7 November 2024).
  66. Pros and Cons of Using Net Present Value (NPV). Available online: https://forisk.com/blog/2020/05/31/pros-and-cons-of-using-net-present-value-npv/ (accessed on 7 November 2024).
  67. Net Present Value Method. Available online: https://www.studysmarter.co.uk/explanations/business-studies/managerial-economics/net-present-value-method/ (accessed on 7 November 2024).
  68. Disadvantages of Net Present Value (NPV) for Investments. Available online: https://www.investopedia.com/ask/answers/06/npvdisadvantages.asp (accessed on 7 November 2024).
  69. 4 Reasons Why Managers Can Accept Negative NPV Projects. Available online: https://financestu.com/negative-npv-project-accepted/ (accessed on 7 November 2024).
Figure 1. Pre-treatment steps of an automobile painting process.
Separations 12 00030 g001
Figure 2. COD measurements.
Separations 12 00030 g002
Figure 3. Nitrite concentrations.
Separations 12 00030 g003
Figure 4. Nitrate concentrations.
Separations 12 00030 g004
Figure 5. Total alkalinity values.
Separations 12 00030 g005
Figure 6. Effluent’s pH values.
Separations 12 00030 g006
Figure 7. Conductivity values.
Separations 12 00030 g007
Figure 8. Hardness values.
Separations 12 00030 g008
Figure 9. Turbidity values.
Separations 12 00030 g009
Figure 10. Total dissolved solids.
Separations 12 00030 g010
Figure 11. The treatment process for alkaline wastewater with surfactants.
Separations 12 00030 g011
Figure 12. Treatment process for cooling tower wastewater with salts and biocides.
Separations 12 00030 g012
Table 1. Elemental ICP analysis results.
Concentration, mg/dm3Cooling TowerWashing Stage
Ca41.351.13
Fe0.060.19
K22.50498.97
Mg12.770.14
Mn<LOD *0.07
Ni0.030.02
P0.6685.02
S25.744.51
Si184.984.66
Zn0.016.59
* LOD: limit of detection.
Table 2. Input of the ultrafiltration simulation.
InputUltrafiltration
SourceBrackish water
Minimal temperature (°C)32
Turbidity (NTU)3.45
Total Dissolved Solids (ppm)900
COD (mg/dm3 of O2 consumed)36.8
BOD5 (mg/dm3 of O2 consumed)23
pH6.73
Fe (mg/dm3)0.06
Ca mg/dm3 (as CaCO3)103.26
Table 3. Input of the reverse osmosis simulation.
InputReverse Osmosis
pH6.73
Turbidity (NTU)3.5
Ca2+ (mg/dm3)41.35
Mg2+ (mg/dm3)12.77
K+ (mg/dm3)22.5
HCO3 (mg/dm3)0.5
SO42− (mg/dm3)175.77
NO3 (mg/dm3)0.35
Phosphates (as PO43− (mg/dm3)0.66
SiO2 (mg/dm3)147.98
Table 4. Storage tanks’ characteristics.
Tank CharacteristicWashing StageCooling Tower
Number of tanks63
Residence time2–3 h24 h
Total pressure0.5–1.2 atm5.4 atm
Volume0.06–1.7 m324–35 m3
Diameter0.5–1.5 m3.5–4 m
Height0.3–1 m2.5–2.8 m
Table 5. Ion exchange and degasser unit characterization.
CharacterizationIon Exchange
Specific velocity17 m/h
Bed depth0.7 m
Resin volume per unit837 dm3
Empty Bed Contact Time1.3 min
Column Diameter1.2 m
Production Capacity12 m3
Regeneration Cycle24 h
Specific velocity17 m/h
Bed depth0.7 m
Empty Bed Contact Time1.3 min
Degasser Unit
Ratio Height/Diameter3
Height1.5 m
Diameter0.5 m
Table 6. Equipment for washing stage effluent treatment.
EquipmentWashing Stage, Price (EUR 1000)
Storage tanks20
Ion exchange column1
Degasser unit7
Resin15
Microfiltration system2
Total44
Table 7. Equipment for cooling tower effluent treatment.
EquipmentCooling Tower, Price (EUR 1000)
Storage tanks91
Ultrafiltration system13
Reverse Osmosis system21
Total126
Table 8. Investment and operational costs per car painted.
CostsWashing Stage (EUR/car)Cooling Tower (EUR/car)
Base Equipment0.190.55
Direct Costs0.491.39
Indirect Costs0.120.32
Utilities and Services0.320.48
Total1.062.52
Table 9. Investment plan, exploitation and VAL of washing stage treatment process.
YearYearInvestmentUtilitiesIncomeVAL
20250−244.57−70.0014.47−244.57
-
206035-−12.092.5−1115.69
-
208055-−4.560.94−1235.17
Table 10. Investment plan, exploitation and VAL of cooling tower treatment process.
YearYearInvestmentUtilitiesIncomeVAL
20250−581.85−105.0029.60−581.85
-
206035-−18.135.11−1764.71
-
208055-−6.831.93−1926.95
Disclaimer/Publisher’s Note: The statements, opinions and data contained in all publications are solely those of the individual author(s) and contributor(s) and not of MDPI and/or the editor(s). MDPI and/or the editor(s) disclaim responsibility for any injury to people or property resulting from any ideas, methods, instructions or products referred to in the content.

