Article

Ultrasound Impact on Extraction Yield and Properties of Starch and Polyphenols from Canna indica L. Rhizomes

1
Qualisud, University Montpellier, CIRAD, Institut Agro, Avignon Université, Univ de La Réunion, 34093 Montpellier, France
2
Department of Food Science and Nutrition, Periyar University, Salem 636011, Tamil Nadu, India
3
Laboratoire de Chimie et Biotechnologies des Produits Naturels (ChemBioPro), Université de La Réunion, 97744 La Réunion, France
*
Author to whom correspondence should be addressed.
These authors contributed equally to this work.
Separations 2025, 12(11), 307; https://doi.org/10.3390/separations12110307
Submission received: 15 October 2025 / Revised: 29 October 2025 / Accepted: 2 November 2025 / Published: 6 November 2025
(This article belongs to the Special Issue Isolation and Identification of Biologically Active Natural Compounds)

Abstract

In this present study, the efficiency of ultrasound-assisted extraction (UAE) in increasing the yields of extraction of starch and polyphenols from Canna indica L. (Canna) rhizomes were analyzed, along with its influence on the physiochemical properties of the extracted compounds. Extraction parameters (temperature, time, and solid-to-liquid ratio) were optimized through Box–Behnken response surface design (BBD). The physiochemical and functional properties of starch and polyphenols were investigated through scanning electron microscopy (SEM), the swelling and solubility index, oil and water absorption index, total polyphenol yield, and antioxidant activity assays (DPPH and ORAC). The starch yield obtained from Canna at the optimum extraction conditions (temperature 40 °C, time 10 min, and solid-to-liquid ratio 1:30 g/mL) was 19.81%. The obtained starch yield was found to be significantly higher than the yield attained through the conventional extraction method without adverse changes in the physicochemical and functional properties. The total polyphenol extraction yield from the Canna rhizome, through UAE, was significantly higher (1061.72 mg GAE/100 g) than that of the conventional method. The antioxidant activity of bioactive compounds was proportional to the attained polyphenol yield. Our results suggest that UAE optimized conditions efficiently and improved Canna starch and polyphenol extraction yields while preserving their functional properties.

1. Introduction

Canna indica L., commonly known as Canna, belongs to the Cannaceae family and is a perennial herb native to the Andean region of South America. It is extensively cultivated for its edible rhizome in subtropical and tropical regions worldwide, particularly in Taiwan, Thailand, Vietnam, China, Myanmar, Sri Lanka, and India [1,2]. Canna is considered a potential source of starch as its content reaches 75–80% [3]. The starch from Canna is qualitatively and quantitatively different from that extracted from corn and wheat [4,5]. It is also regarded as a source of phenolic compounds [6]. Canna starch has been documented to possess interesting characteristics, such as large granule sizes ranging from 60 to 145 µm [3]. It also exhibits high amylose content, high viscosity, clear paste formation, strong resistance to α-amylase hydrolysis, and high levels of retrogradation [4,7]. Due to these properties, it is utilized by the food industry as a food additive (e.g., in soups, sauces, and noodle production) and by the pharmaceutical industry as an excipient (e.g., in tablets, capsules, bulk granules, and medicated powders) [8,9,10].
In tuber crops, starch granules are encapsulated within cellulosic fibers [11]. The isolation of starch from this matrix involves grating to disrupt the cellular structure and release the starch, followed by filtration through sieves. The starch slurry is then concentrated by decantation or centrifugation [12]. Although the standard extraction method is simple and safe, the complete disintegration of cellulosic fibers is unattainable, resulting in the loss of starch present in the fibrous residue as high residual starch. To increase starch extraction yield, efficient disintegration of the cellular matrix is essential. Some researchers have achieved this using enzymatic methods [13]. However, these methods are highly time-consuming, energy-intensive, and expensive. These drawbacks encourage the use of sustainable green extraction techniques such as ultrasound. This technique offers advantages in terms of yield improvement, enhanced quality, efficient processing time, minimized chemical hazards, and environmental preservation [14].
Ultrasound waves, with frequencies ranging from 20 kHz to 10 MHz, generate longitudinal particle displacement as they pass through a liquid medium, resulting in cycles of compression and rarefaction. These cycles produce cavitation bubbles in the medium, which grow during the process. When these bubbles reach a critical size, they collapse, releasing high pressures and temperatures, which in turn generate microjets. These microjets create shear forces that break long-chain polymers with minimal effects on smaller molecules [14,15]. This mechanical action of sonication has been employed not only to improve the efficiency of the separation process by disrupting cell walls, but also to enhance the properties of native starch [16]. Ultrasound-assisted extraction (UAE) has been employed to increase the yield of starch extraction from maize and rice [17,18,19] as well as the extraction of polysaccharides from mulberry leaves [20]. It has also been reported to reduce the time required for the extraction of vitamin C and phenolic compounds from acerola fruit [21] as well as water-soluble hemicelluloses from wheat bran [22]. In addition, the UAE method enhances the extraction of bioactive compounds from various plant matrices [17,23,24]. The potential of UAE in isolating starch from Canna edulis rhizomes has not yet been reported. This study aims to evaluate the effects of UAE on the yield, granular morphology, and functional properties of starch and polyphenols extracted from Canna.
In this study, starch and polyphenols from Canna indica L. rhizomes were successfully isolated using UAE. The Box–Behnken design was used to optimize the extraction conditions (temperature, time, and solid-to-liquid ratio) for maximum starch yield. The physicochemical and functional properties of the extracted starch granules and polyphenols were investigated using scanning electron microscopy, swelling and solubility indices, oil and water absorption properties, total polyphenol content, DPPH, and ORAC assays.

2. Materials and Methods

2.1. Raw Material and Sample Preparation

Fresh Canna edulis (Edible Canna) rhizomes were collected in August from the local farmers of La Reunion Island “Le pied à l’étrier” (Saint Lieu, La Reunion Island, France). The rhizomes were cleaned, trimmed, washed, and stored at room temperature for starch analysis and at −80 °C for polyphenol analysis.

2.2. Extraction Methods

2.2.1. Conventional Extraction (CE) of Starch

Fifty grams of cubed rhizomes were mixed with an equal proportion of water and then ground in a high-speed laboratory blender (Philips HR 2084, Philips, Paris, France). The resulting slurry was filtered through a 150 µm sieve. The filtrate was allowed to sediment for 3 h at room temperature. The starch sediments were washed with distilled water and dried at 40 °C in a hot-air oven for 24 h. The dried starch was ground and sieved with a 150 µm sieve and then stored in an air-tight pouch at room temperature (25 °C) for further analysis.

2.2.2. Ultrasound-Assisted Extraction (UAE) of Starch

Starch extraction was performed using the method described by Sit et al. [25] with slight modifications. A bath ultrasound (AL04-12-230, Advantageous Lab, Fischer-Scientific, Vienna, Austria) operating at a frequency of 38 kHz and a heating power of 800 W, including time and temperature controllers, was used. Briefly, 100 g of cubed rhizomes were ground with an appropriate proportion of water in a high-speed laboratory blender (Philips HR 2084, Philips, Paris, France) and sonicated under varying extraction conditions based on a preliminary analysis and literature review (Table 1). The sonicated slurry was filtered using a 150 µm sieve. The filtrate was allowed to sediment for 3 h. The sedimented starch was washed with distilled water and dried at 40 °C in a hot-air oven for 24 h, followed by grinding and sieving (150 µm). The samples were then stored in an air-tight pouch for further analysis.

2.3. Physicochemical Property Evaluation of Starch

2.3.1. Chemical Characterization

The moisture content of the starch was determined as described by AOAC 1990 [26]. The method stated by Holm et al. [27] was used to calculate the starch quantity in the isolated starch. The starch yield was measured using Equation (1) [28].
Y S % = W b W a × 100  

2.3.2. Swelling and Solubility

The swelling and solubility indices of Canna starch were measured by the method stated by Yu et al. [29] with slight modifications. Starch samples (0.5 g, dry basis) were mixed with 20 mL of distilled water in centrifuge tubes and heated at various temperatures (55, 65, 75, 85, and 95 °C) for 30 min in a shaking water bath. The tubes were then cooled to room temperature and centrifuged at 2600× g for 15 min. The supernatant was transferred to a pre-weighed glass dish and evaporated in a boiling water bath, followed by drying at 105 °C to a constant weight (W). The sediment attached to the centrifuge tube was weighed (Wt) for swelling power (SP) calculation. Swelling power (SP) and solubility (S) were measured using the following Equation (2).
S o l u b i l i t y S = W t W × 100 %

2.3.3. Oil and Water Absorption

The method applied for oil and water absorption was proposed by Sujka and Jamroz [30]. Starch samples (0.5 g, dry basis) were mixed with 5 mL of oil or distilled water in centrifuge tubes. The tubes were homogenized and centrifuged at 1000 rpm for 1 min. The samples were then stored for 5 min, homogenized again, and centrifuged for 15 min at 1500 rpm. The unabsorbed water or oil was discarded, the centrifuge tubes were weighed, and the water absorption (WA) and oil absorption (OA) indices were calculated using the following Equation (3).
O A   o r   W A = a b W × 100  
where “a” denotes the weight of the centrifuge tube with the precipitate (g); “b” represents the weight of the empty centrifuge tube (g); and “W” represents the initial weight of the sample (g).

2.4. Scanning Electron Microscopy

The samples were dehydrated in an alcohol–acetone series, critical point-dried (BAL-TEC CPD030, BAL-TEC AG, Balzers, Liechtenstein), and mounted on sheet metal and coated with gold in a Balzer Gold Sputter FL9496 Balzers (BAL-TEC AG, Balzers, Liechtenstein). Sample micrographs were observed and photographed using the EVO MA10 (Zeiss, Zeiss Group, Munchen, Germany) tungsten filament.

2.5. Response Surface Methodology (RSM) for Optimization

Response surface methodology (RSM) is a mathematical tool used for optimizing process conditions based on multiple linear regression. Regression analysis considers the main, quadratic, and interactive effects of process variables [18]. The Box–Behnken design (BBD) [19] is an independent, rotatable or partially rotatable, three-level fractional factorial design with a second-order polynomial model. A three-factor (temperature, time, and solid-to-liquid ratio), three-level BBD was applied to study the individual and interactive impacts of these factors on the response and to optimize the process conditions (Table 1). Factors and conditions were screened through single-factor analysis. The levels of the factors are coded as “−1”, “0”, and “1”, according to the following Equation (4) [31] (Table 1).
x i = X i X z X i   i = 1,2 , 3 k  
where xi denotes the dimensionless value of the variables, Xi is the actual value of the independent variable, Xz is the actual value of the independent variable at the center point, and ΔXi is the distance between the actual value of center point and the actual value of the superior or the inferior level of the variable.
The design consists of 17 experiments with 5 center points. Center points are used to estimate the pure error. The number of experiments is calculated using the following Equation (5).
N = 2 k k 1 + C p    
where k is the number of independent variables and Cp is the number of center point replicates [32].
The experimental design is presented in Table 2. Unexplained deviations in the response due to external factors were minimized by randomizing the experimental runs. The correlation between the response and independent factors was studied using an empirical model developed with a second-order polynomial equation. The general form of the second-order polynomial Equation (6) is given below.
Y = β 0 + j = 1 k β j X j + j = 1 k β j j X j 2 + i < j = 2 k β i j X i X j + e i  
where Y denotes the response, Xi and Xj are variables and its levels (i and j) to k, β0 is the intercept coefficient of the model, βj, βjj, and βij represents the intercept coefficients of linear, quadratic, and the second-order terms, k is the number of independent variables (k = 3), and e i represents the error [33].

2.6. Statistics

Multiple regression analysis and Pareto analysis of variance (ANOVA) were used to analyze the experimental data and to test the significance of the selected mathematical model using the Design Expert software (Version 8.0.7.1, Stat-Ease Inc., Minneapolis, MN, USA).

2.7. Extraction of Polyphenols

2.7.1. Conventional Extraction

The procedure proposed by Septembre-Malaterre et al. [34] was used for phenol extraction. Thirty milliliters of aqueous acetone (70% v/v) were mixed with 6 g of crushed rhizomes and incubated at 4 °C for 90 min. The mixture was then centrifuged at 3500 rpm for 20 min at 4 °C. The supernatants were collected and incubated at −80 °C for further analysis.

2.7.2. Ultrasound-Assisted Extraction of Polyphenols

Two grams of crushed rhizomes (fresh and frozen) were mixed with 20 mL of aqueous ethanol (70% v/v) and subjected to sonication in an ultrasound bath (AL04-12-230, Advantageous Lab, Fischer-Scientific, Vienna, Austria) at 800 W power and 38 kHz frequency for 15 min. The samples were filtered using Whatman No.1 filter paper and stored in the dark to prevent oxidation of the polyphenols. The filter residue was mixed again with 20 mL of aqueous ethanol (70% v/v), subjected to sonication, and filtered. The filtrate residue was discarded, and the collected liquid phase was evaporated with a rotary evaporator at 40 °C. The evaporated sample was dissolved in methanol and transferred to a 10 mL amber volumetric flask, with the volume made up with methanol. It was then filtered with a 45 µm syringe filter into sample vials and stored at −80 °C for further analysis.

2.8. Evaluation of Polyphenol Content

The polyphenol content of the extracted phenolic samples were measured using the Folin–Ciocalteu assay proposed by Folin and Denis [35]. In a 96-well microplate, 25 µL of extract, 125 µL of Folin–Ciocalteu’s phenol reagent (Sigma-Aldrich, Saint-Quentin-Fallavier, France), and 100 µL of sodium carbonate were added. The mixture was incubated at 54 °C for 5 min, followed by incubation at 4 °C for 5 min. The absorbance was measured at 765 nm using an Infinite M200PRO (Tecan Group, Mannedorf, Switzerland). A calibration curve was drawn using gallic acid as the standard, and the phenol content was measured as mg gallic acid equivalent (GAE) per 100 g of fresh weight.

2.9. Antioxidant Activity Assay

The antioxidant activities of polyphenol-rich extracts from Canna were evaluated using the 2,2′-diphenyl-1-picrylhydrazyl radical (DPPH) and oxygen radical absorbance capacity (ORAC) assays. The efficiency of the free radical-scavenging activity of Canna rhizome extracts on DPPH was determined using the method described by Hatia et al. [36]. Diluted extracts were incubated with 0.25 mM methanol-diluted DPPH for 25 min at 25 °C, and the optical density (OD) was measured at 517 nm. The free radical-scavenging activity was expressed as a percentage of inhibition, as shown in Equation (7).
A n t i o x i d a n t   c a p a c i t y   ( % ) = O D   c o n t r o l O D   s a m p l e O D   c o n t r o l × 100
The ORAC assay employed by Hatia et al. [36] was adopted to assess the free radical-scavenging activity of the Canna rhizome. 2,2′-azobis [2-methyl-propionamidin] dihydrochloride (AAPH) (Sigma-Aldrich, Saint-Quentin-Fallavier, France) was used to generate peroxyl radicals, and fluorescein (Sigma-Aldrich, Saint-Quentin-Fallavier, France) was used as the substrate. A 25 µL sample was diluted 40 times in phosphate-buffered saline (PBS, pH 7.4). The diluted sample and 150 µL of 8.4 × 10⁻⁵ mM fluorescein were added to a 96-well black plate and incubated for 15 min at 37 °C. Then, 25 µL of 153 mM AAPH radical were added, and fluorescence was measured for 100 min at an excitation wavelength of 485 nm and an emission wavelength of 530 nm (Infinite 200, Tecan Group, Mannedorf, Switzerland). Values were calculated based on the net area under the curve (AUC), which was measured by subtracting the AUC of the blank from that of the samples and comparing the result to a Trolox standard curve.

3. Results and Discussion

3.1. Starch Extraction Process

Starch was extracted from Canna using both CE and UAE methods. The starch yield obtained through the UAE method was significantly higher than that obtained through the CE method (Figure 1).
This finding agrees with other researchers such as Benmoussa and Hamaker [37], Park et al. [38], and Wang and Wang [39] that reported higher starch yields from sorghum and rice through the UAE method. The increase in starch yield through UAE is attributed to the efficient disintegration of cellulosic material via the cavitation effect. The mechanism behind this process involves the formation and disruption of cavities during the refraction and rarefaction cycles of ultrasonic waves, resulting in the release of violent shock waves and microjets [37]. These changes in the medium lead to the disintegration of the cellulosic matrix, resulting in a higher starch yield.

3.2. Optimization of the Starch UAE Process

3.2.1. Analysis of Experimental Data

Experimental data were fitted to linear, 2FI (interactive), quadratic, and cubic models (Table 3). Statistical metrics (R2, adjusted R2, predicted R2, and p-value) were used to assess the significance of the fitted models. Among these, the quadratic model exhibited higher values of R2, adjusted R2, and predicted R2, along with a lower p-value, indicating its significance in analyzing the influence of process variables on the response.

3.2.2. Model Fitting

Multiple regression analysis was employed to evaluate the experimental data. A second-order polynomial equation was derived to depict the relationship between factors and response. The significance of factors (both linear and interaction terms) was assessed using Student’s F-test for their coefficients. The final Equation (8), after excluding the insignificant factors, is provided below in its coded form.
S t a r c h   Y i e l d   % = 15.47 + 0.35 X i + 0.33 X j + 4.93 X k + 1.28 X i j 1.21 X i 2 2.97 X j 2 0.57 X k 2

3.2.3. Statistical Analysis

ANOVA was applied to validate the adequacy and fitness of the selected model, as well as the second-order polynomial equation, by evaluating the relationship between factors (linear, interactive, and quadratic interactions) and response (Table 4). Fisher’s value (F-value) provided by ANOVA was assessed to determine the adequacy of the selected model. An ideal model has a high F-value with a corresponding low p-value (p < 0.0001). The ANOVA results for the quadratic model showed an F-value of approximately 210.55 with a p-value < 0.0001, indicating the adequacy of the selected model. The lack of fit values provided by ANOVA determines the fitness of the selected model with the experimental data. A high lack of fit (insignificant) for the quadratic model further validates the adequate fit of the model and experimental data [38]. The adequate precision of the model was computed using the signal-to-noise ratio. For a model to be considered significant, the signal-to-noise ratio should preferably be greater than 4 [40]. For the selected quadratic model, the signal-to-noise ratio was found to be 44.14, indicating the model’s significance in navigating the design space.
Statistical analyses, including the correlation coefficient (R), determination coefficient (R2), adjusted determination coefficient (Adj-R2), and coefficient of variance (CV), were employed to validate the goodness of the fit of the quadratic model [41]. The correlation between experimental and predicted data was assessed using the correlation coefficient (R). The R-value of the quadratic model was 0.9981, indicating a significant correlation between the experimental and predicted values. The determination coefficient (R2) describes the percentage of unexplained deviation in the model. In this model, the R2 value is 0.9963, meaning that only 0.0037% of the deviations were unexplained. The closer the adjusted R2 (Adj-R2) is to the R2, the more reliable the correlation between variables. The Adj-R2 value (0.9916) of this model is close to the R2 value (0.9963), indicating a significant correlation between the predicted and experimental values. The coefficient of variance (CV) describes the deviation between the experimental and predicted values. The CV value of this experiment is 2.75%, indicating significant reliability and a high degree of precision in the performed experiments.

3.2.4. Effect of Process Variables on Starch Yield

In this study, a three-factor, three-level Box–Behnken design (BBD) model was implemented to investigate the influence of independent variables (temperature, time, and solid-to-liquid ratio) on the response (starch yield). Response surface and contour plots were created to illustrate both the individual and interactive effects of the factors on the response. These graphs were plotted in a three-dimensional manner by keeping two of the three factors constant while varying the third. This approach helps in generating a better understanding of the interaction between the factors and the response (Figure 2).

3.2.5. Effect of Temperature

The effect of temperature on starch yield was studied and is depicted in Figure 2a,c. The results indicate that as the temperature increases from 30 °C to 40 °C, the starch yield also increases. This is because higher temperatures raise the cavitation threshold of the medium, leading to increased nucleation of cavities [42]. The mass transfer rate between the Canna matrix and the solvent was enhanced by the disruption of the Canna matrix. This disruption was achieved through the cavitation effect. The principle behind cavitation involves the eruption of cavities with great force, resulting in the rupture of the cavitation nucleus and the release of microjets. This process disrupts the Canna matrix and enhances the mass transfer rate [43]. When the temperature reaches 50 °C, the extracted starch begins to gelatinize, and the density and viscosity of the solvent decrease, resulting in a reduced starch extraction yield.

3.2.6. Effect of Time

Figure 2b,c illustrate the individual and interactive effects of extraction time on starch yield. A significant increase in starch yield was observed between 5 and 10 min, followed by a decline. During the initial minutes, the rate of cavitation was high, promoting the enhanced swelling and hydration of the Canna matrix. The eruption of micro-bubbles near the swollen matrix, along with the release of microjets, facilitated the disruption of the plant matrix and the diffusion of solvent into it. This phenomenon aided in the efficient transfer of starch from the plant matrix to the solvent, resulting in higher starch yield during the initial phase [44,45,46]. However, prolonged exposure to the cavitation effect disrupts the structure of the extracted starch granules, resulting in a decreased extraction yield after 10 min [20].

3.2.7. Effect of Solid-to-Liquid Ratio

The solid-to-liquid ratio influences the extraction process by enhancing the mass transfer rate. A high solid-to-liquid ratio results in lower solvent viscosity, which aids in the production of cavitation bubbles by ultrasonic waves. These bubbles grow during the refraction and rarefaction cycles of the ultrasonic waves until they reach a critical size, at which point they erupt, releasing a significant amount of energy. This released energy either enlarges the pores in the cell or completely disrupts the cell wall [47]. This facilitates the efficient penetration of the solvent into the matrix, resulting in a significant mass transfer rate. The starch yield increases with the solid-to-liquid ratio, reaching an optimum yield at 1:30 g/mL.

3.2.8. Optimization and Validation

Starch extraction conditions were optimized using Derringer’s desirability function methodology to achieve maximum starch yield. Under the optimized conditions (temperature of 40 °C, time of 10 min, and solid-to-liquid ratio of 1:30 g/mL), the model predicted a starch yield of 19.74% with a desirability value of 1 (Table 5). The experimental starch yield of 19.871% closely matched the predicted value, indicating the model’s efficiency under these optimized conditions.

3.3. Physicochemical Properties of Extracted Starch

3.3.1. Micrographs of Sonicated Samples

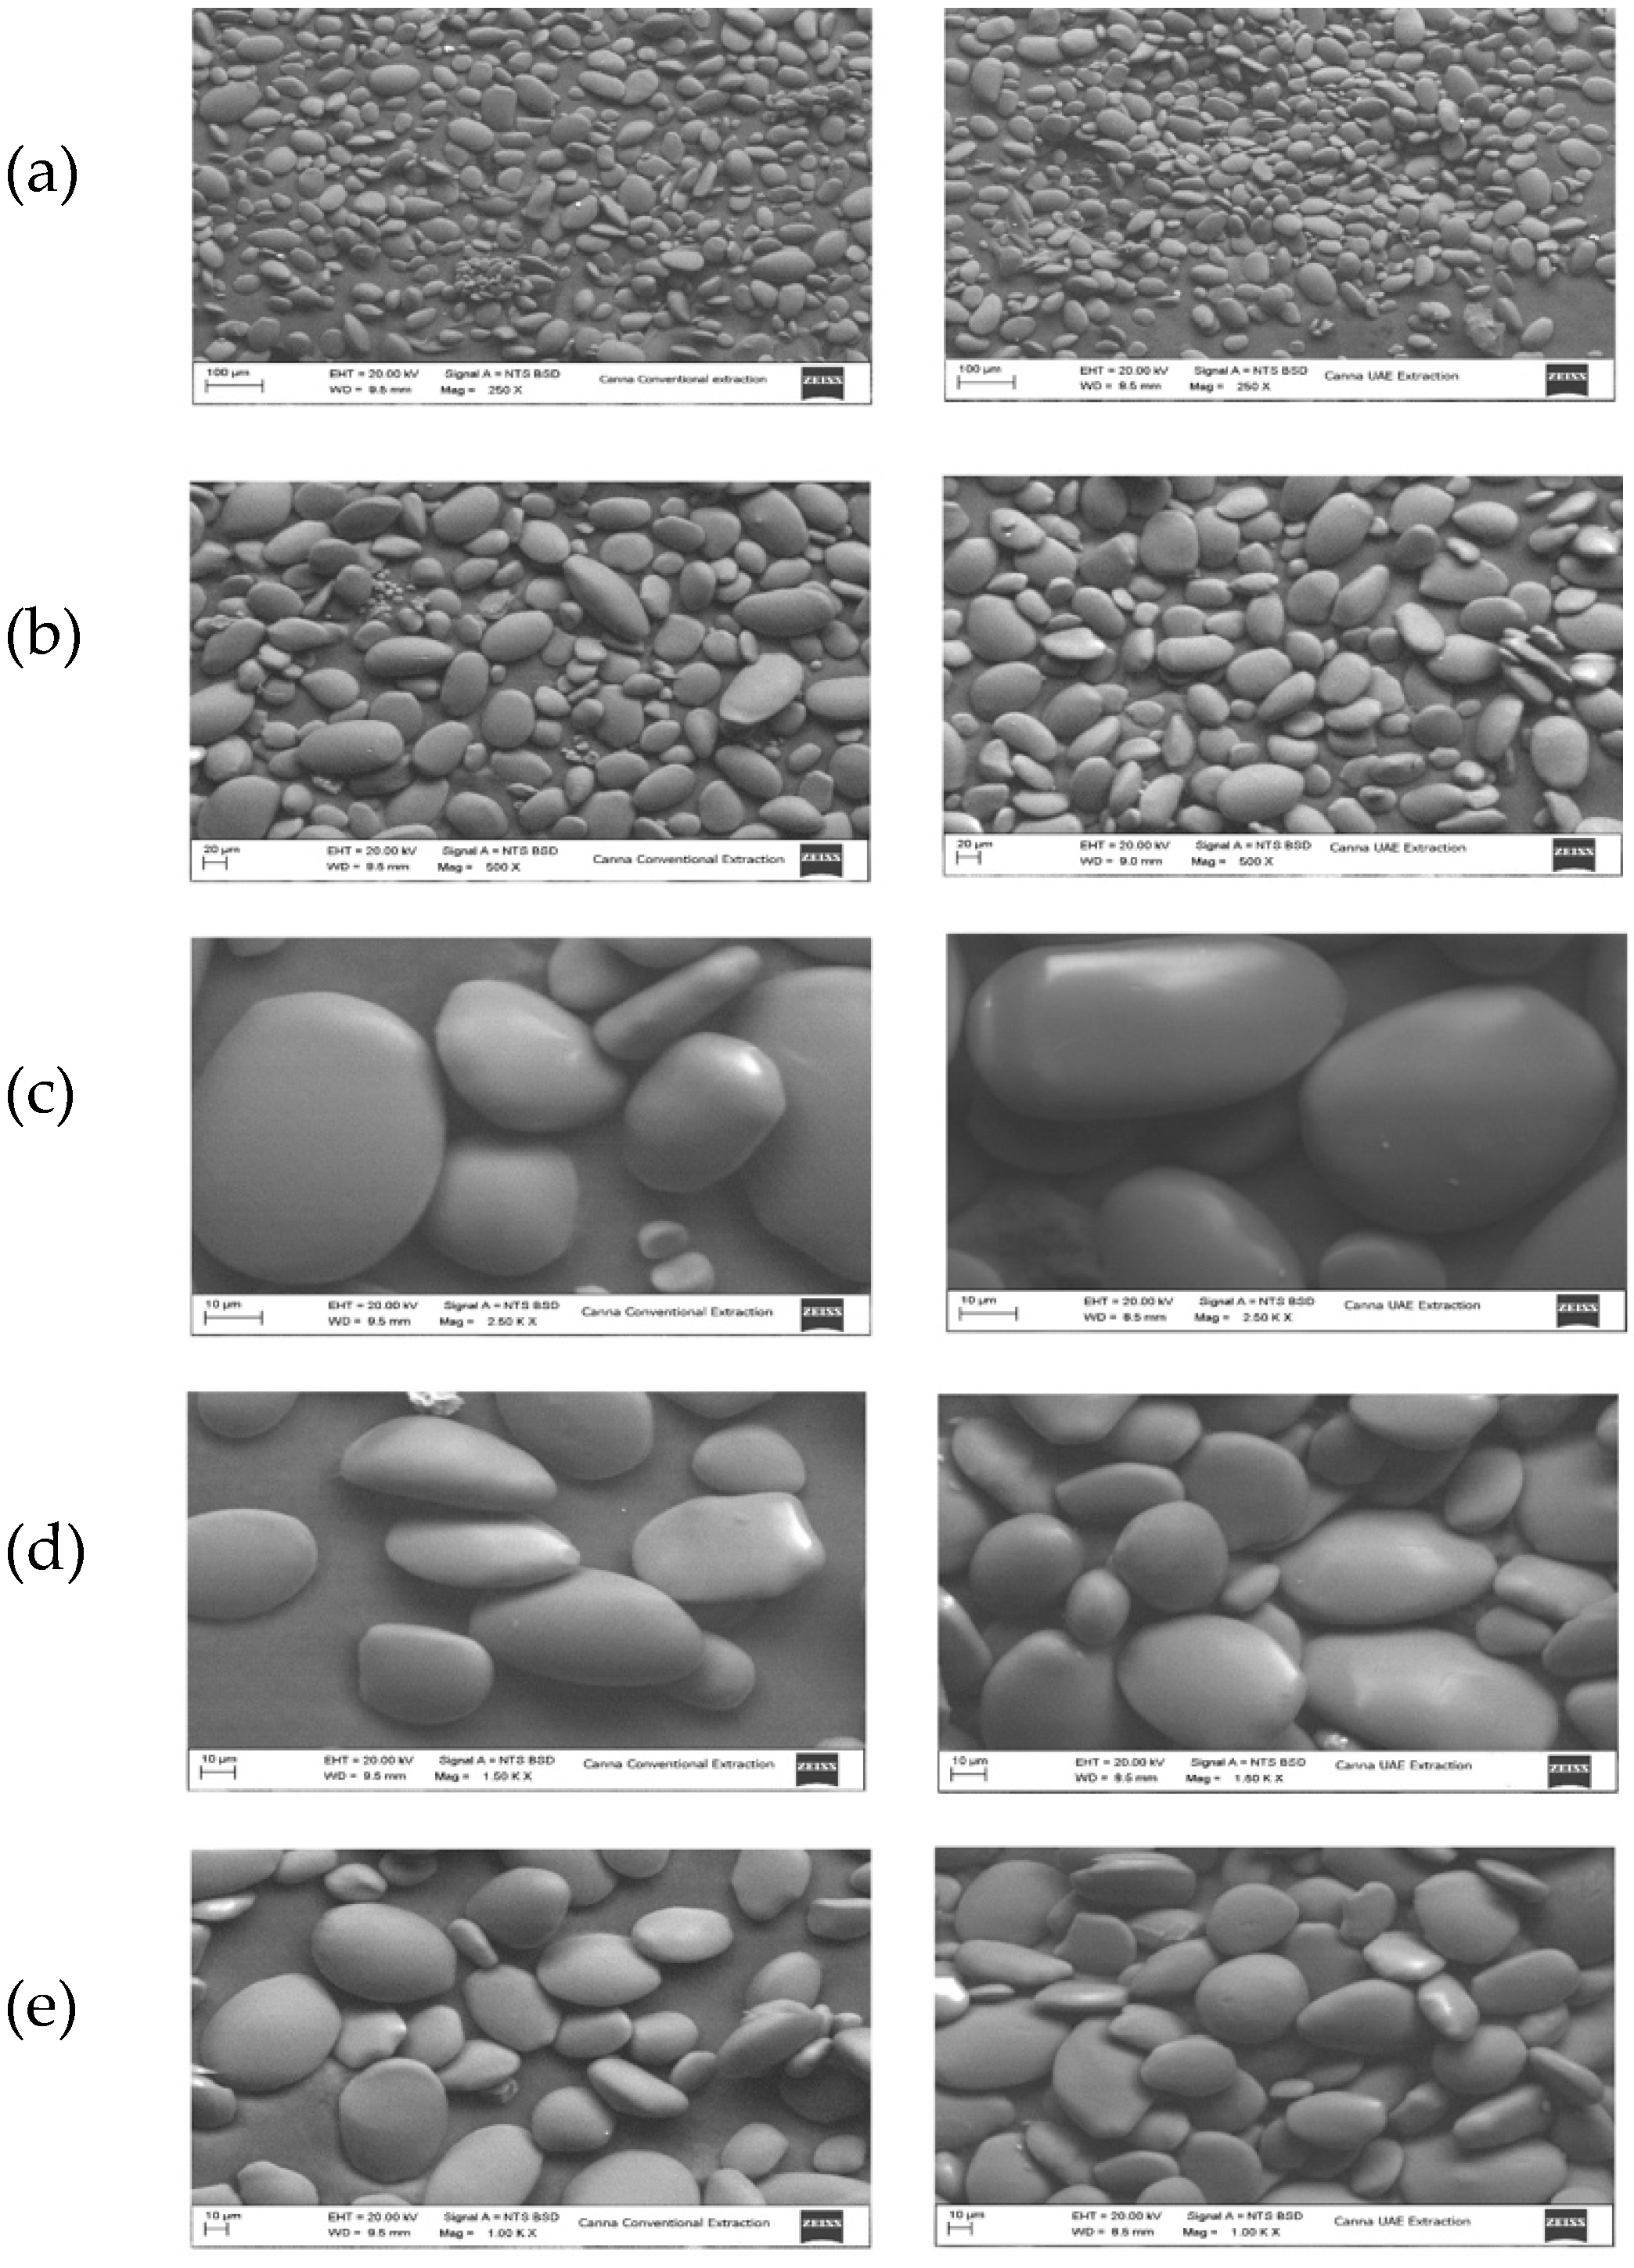
The morphological characteristics of the starch granules were studied using SEM images (Figure 3). The granules of Canna starch were elliptical or disk-shaped with smooth surfaces, showing no alterations, which is consistent with findings from other research studies [48]. In general, starch granules treated with UAE were found to have an increased number of pores and fissures due to the cavitation effect [16,49,50]. Sonication conditions are critical in controlling cavitation, as higher extraction settings result in a more intense cavitation effect. Our results indicate that the sonication conditions were mild enough to significantly isolate the starch granules from the Canna matrix without disturbing their structure. The UAE method does not affect the structure of the starch granules and, like the conventional method, should not alter their functional properties.

3.3.2. Swelling and Solubility

Structural alterations and the molecular arrangement of Canna starch granules were studied through their swelling power and solubility. As the disruption of the starch structure intensifies, both swelling and solubility increase. The breakdown of the molecular arrangement of starch granules exposes hydrophilic groups to the solvent, thereby enhancing water absorption and retention [37,47]. The optimized extraction conditions for ultrasonic-assisted extraction (UAE) were determined to be a temperature of 40 °C, an extraction time of 10 min, and a solid-to-liquid ratio of 1:30 g/mL. These conditions are sufficiently intense to disrupt the Canna cell wall matrix while leaving the starch granules intact. Consequently, the swelling power and solubility of the starch extracted via UAE were comparable to those of conventionally extracted (native) starch (Table 6).

3.3.3. Oil and Water Absorption

The water absorption index is attributed to the interaction of starch polymers within the starch granule [51]. The water absorption index is influenced by the disintegration of starch granules. Greater disintegration and subsequent leaching facilitate the entrapment of water within the starch matrix, resulting in an increased water absorption index [52]. In this study, the water absorption index of both conventionally extracted starch and UAE starch was similar (Table 6). This suggests that the UAE treatment conditions did not alter the interaction of starch polymers.
Oil absorption involves the physical entrapment of oil molecules within the starch matrix [53]. Oil absorption is highly influenced by the size and shape of the starch granule. Generally, sonication affects the oil absorption properties by altering the pore size, increasing the surface area of exposure, and cleaving the branched chains on the starch surface [54,55]. Our sonication conditions were mild enough to isolate starch from the Canna matrix without disturbing the starch granule structure. Consequently, the oil absorption properties of both CE and UAE starch were similar (Table 6).

3.4. Effect of Ultrasound-Assisted Extraction on Total Polyphenol Content from Canna Rhizomes

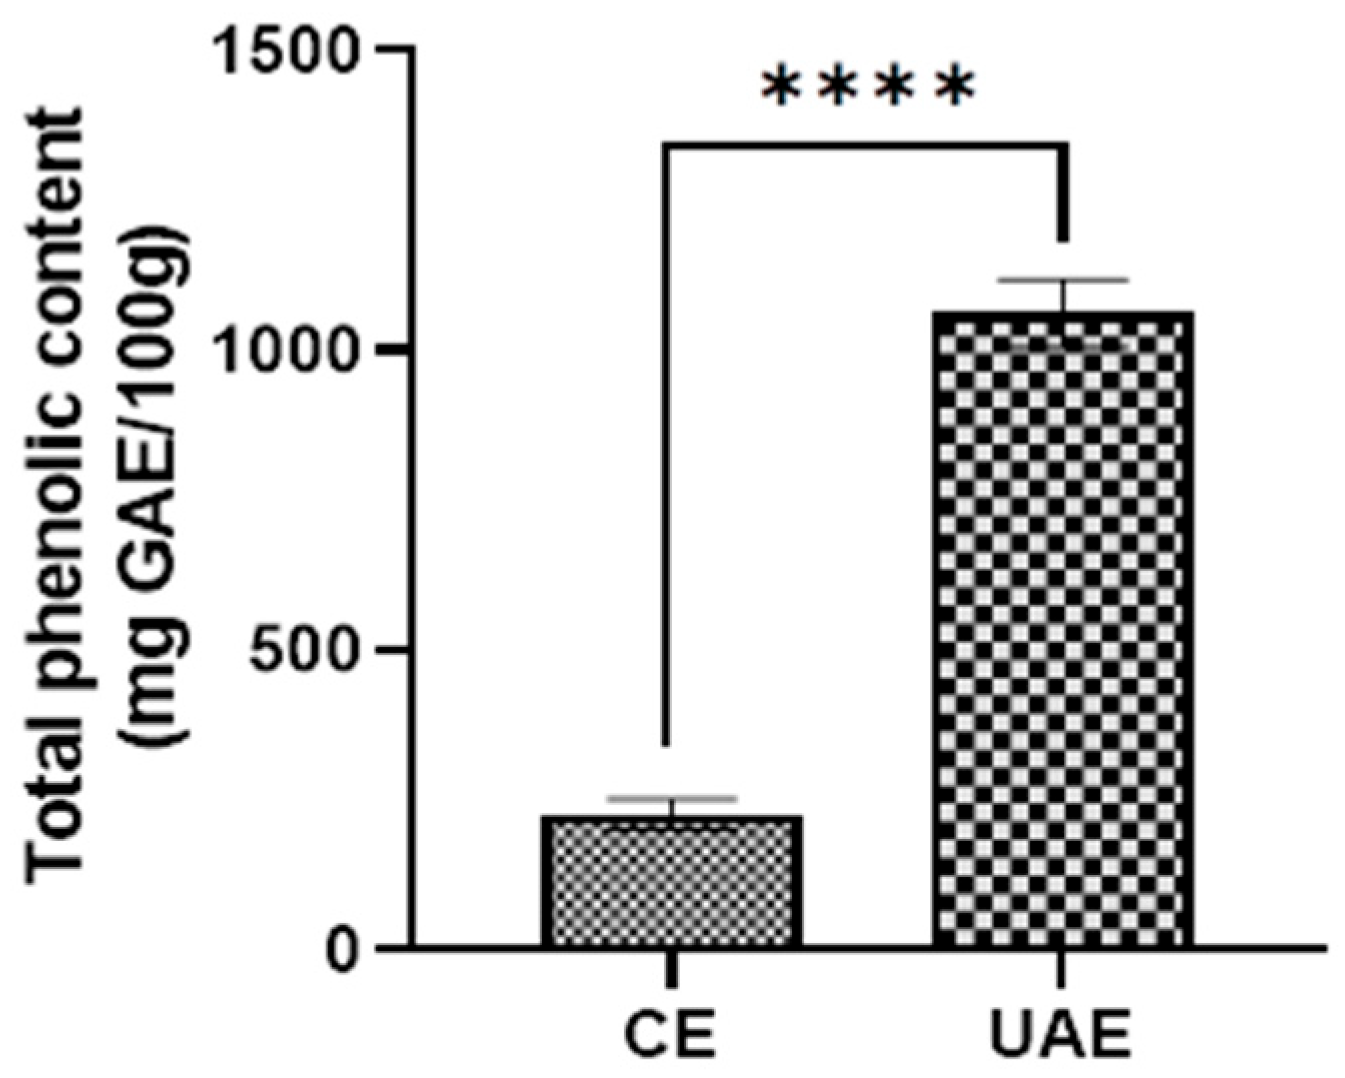
UAE yielded a higher polyphenol content (1061.7 mg AGAE/100 g) compared to the conventional extraction method (225.97 mg AGAE/100 g) (Figure 4).
The significant, nearly five-fold increase in polyphenol yield achieved through the UAE method can be attributed to the effects of ultrasonic cavitation. As ultrasonic waves pass through the medium, cavities form and grow until they reach a critical size and erupt, releasing violent shock waves. This process increases the medium’s temperature and results in the formation of microjets [44,56,57]. This phenomenon leads to the efficient disruption of rhizome cell walls, an increased penetration rate of the solvent into the rhizome matrix, and an enhanced mass transfer rate, resulting in a higher yield of extracted polyphenols [58].

3.5. Effect of Extraction Methods on the Antioxidant Activity

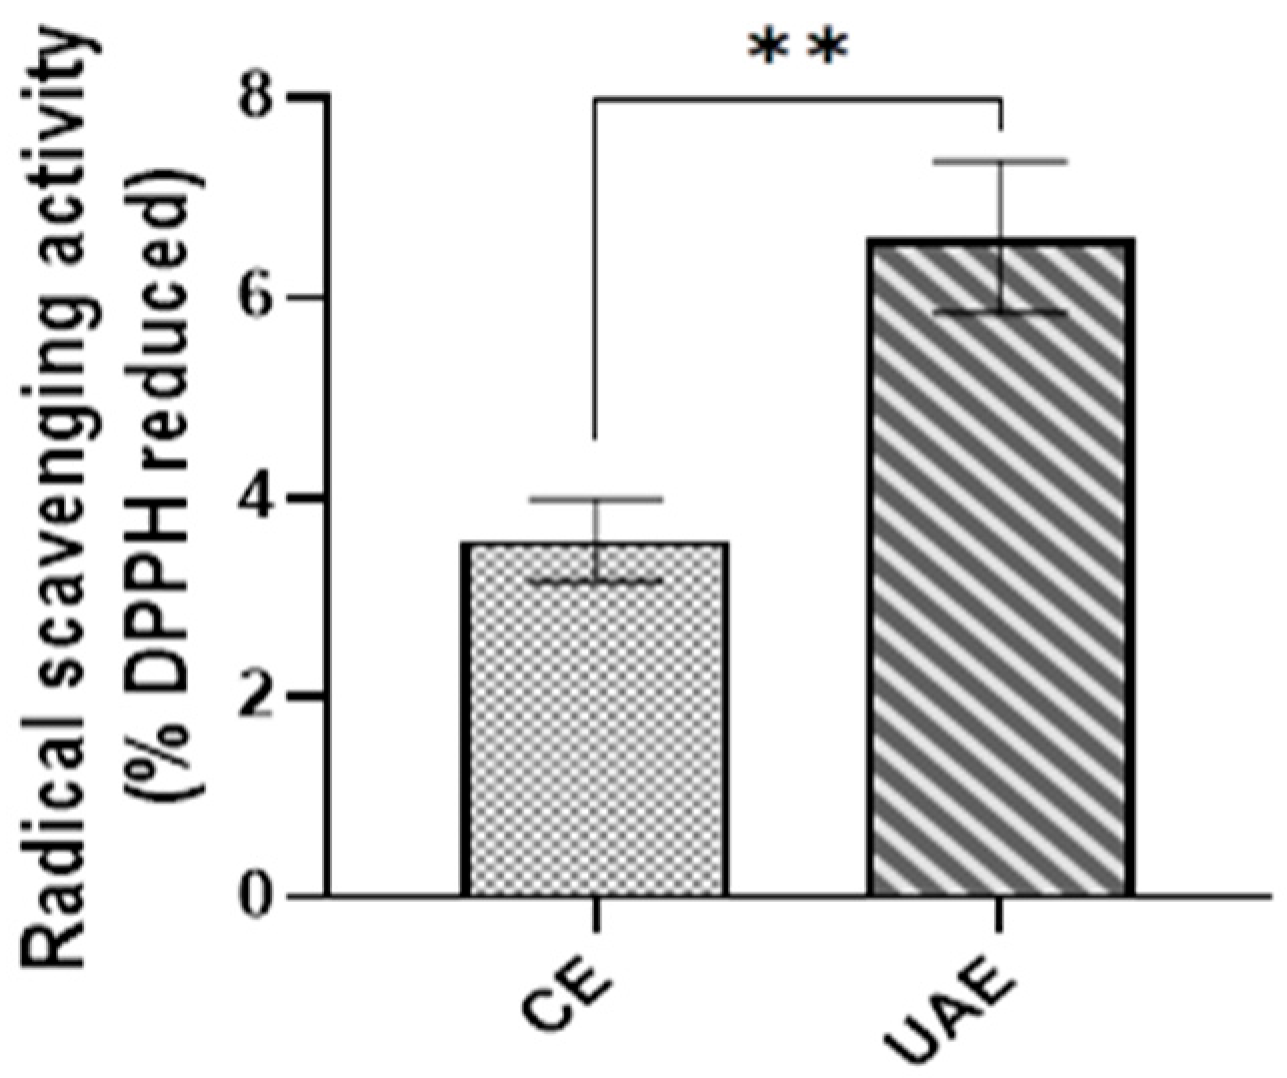
Canna rhizome extracts were analyzed to determine their radical-scavenging potency. The antioxidant activity of the extracts was found to increase with the concentration of bioactive compounds [6,59]. UAE exhibits significantly higher antioxidant activity compared to the conventional method (Figure 5).
The UAE extracts exhibited approximately 59% higher radical-scavenging activity compared to the CE method. This result confirms that UAE extracts a higher proportion of total phenolic content [6]. The cavitation phenomena induced by sonication appears to enhance the extraction of bioactive compounds, which in turn increases the radical-scavenging activity of the extract [60]. The sonication conditions used in this study (frequency 38 kHz, power 800 W, and duration 15 min) were sufficient to extract polyphenols without disrupting their chemical structure (hydrogen-donating potency). Our results align with various studies on the efficiency of UAE in enhancing polyphenol yield and antioxidant activities across diverse matrices [23,56,60,61].
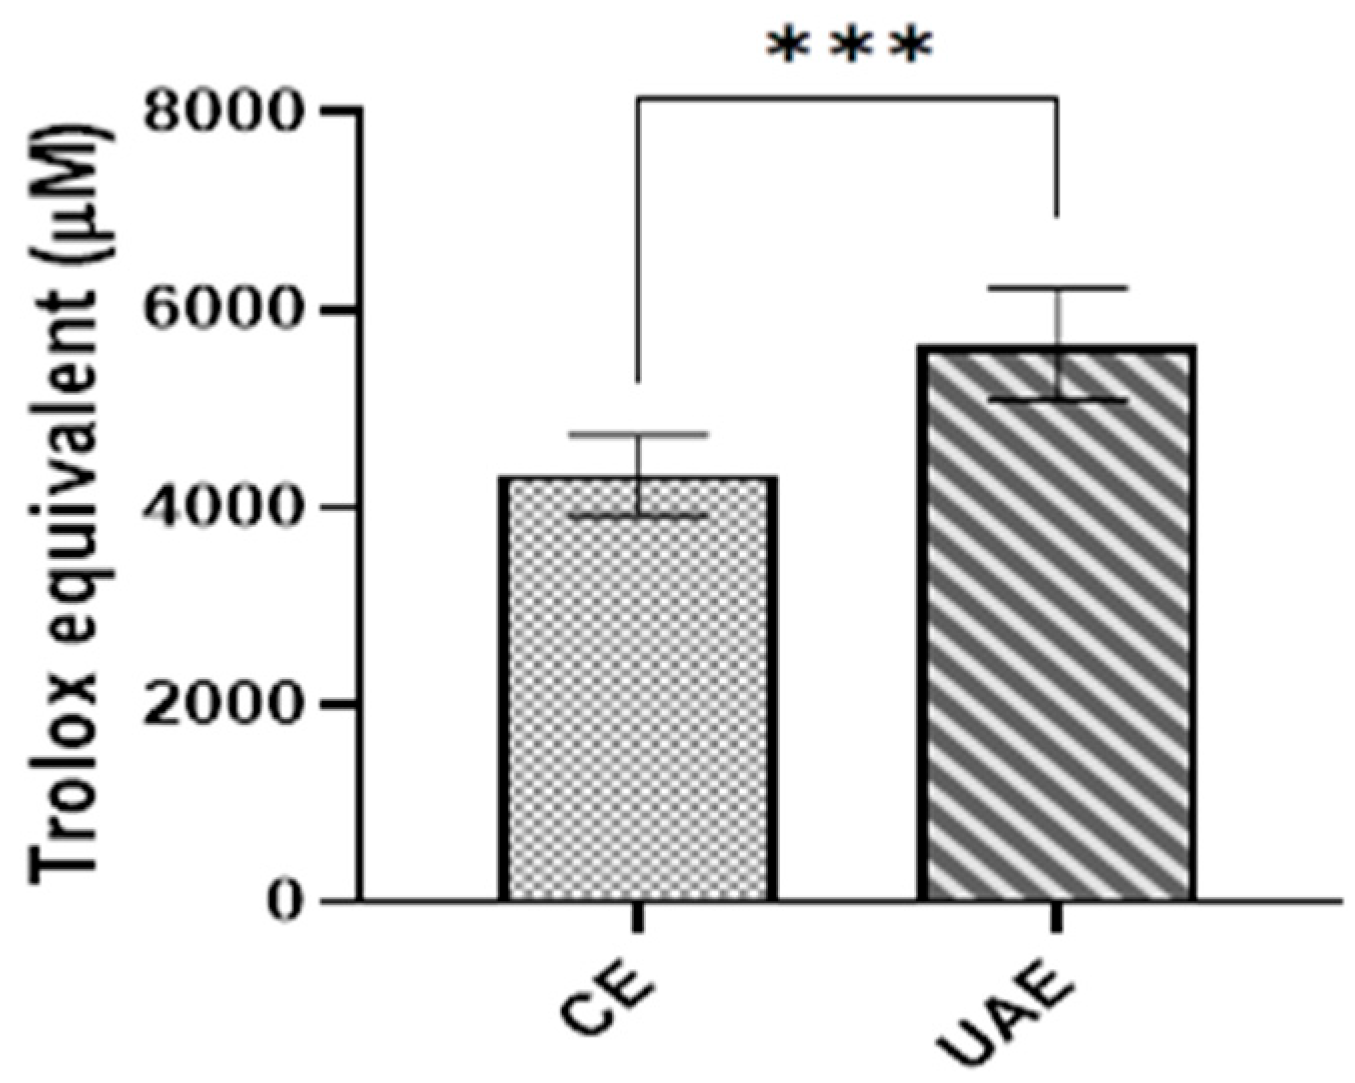
The total antioxidant capacity of an extract cannot be fully validated through a single assay. To efficiently assess the antioxidant capacity, both the radical-quenching and radical-reduction abilities of the antioxidants must be measured. In this study, the radical-reduction ability was determined using the DPPH assay, while the radical-quenching (hydrogen atom transfer) capability was assessed using the ORAC test. Among all the hydrogen atom transfer (HAT) assays, ORAC is the most sensitive for determining the chain-breaking antioxidant capacity of Canna rhizome extracts [62]. The UAE extracts reacted more efficiently with peroxyl radicals compared to conventional extracts, exhibiting higher antioxidant activity (5649.93 µM Trolox equivalent vs. 4100 µM Trolox equivalent), as illustrated in Figure 6. The higher concentration of bioactive compounds in the UAE extracts led to an increase in antioxidant activity [63]. These results support the efficiency of UAE in enhancing polyphenol yield and antioxidant properties [63,64,65].
UAE resulted in a 129% increase in TPC compared to CE. The radical-scavenging activity, measured by the DPPH assay, increased by less than 60%, while the ORAC value showed a 179% increase. The ORAC assay correlated more strongly with the increase in TPC than the DPPH assay. Interestingly, the ORAC assay indicated a higher antioxidant activity than TPC concentration alone, potentially due to the presence of radical-quenching (hydrogen atom transfer) antioxidant compounds not detected by TPC analysis [66].

4. Conclusions

The optimal extraction conditions were determined to be a temperature of 40 °C, an extraction time of 10 min, and a solid-to-liquid ratio of 1:30 g/mL. Under these conditions, the maximum starch yield was 19.81%, compared to 2.53% with the conventional extraction method. The functional properties and structural morphology of the starch extracted by both the conventional extraction (CE) and UAE methods were similar. Under the same optimized conditions, the total polyphenol yield from Canna rhizomes was 1061.72 mg GAE/100 g, nearly five times higher than that obtained with the conventional method. The antioxidant activity of the extracted polyphenols was correlated with the polyphenol yield.
Further investigations are needed to characterize the qualitative and quantitative profile of Canna polyphenol compounds. In conclusion, UAE significantly enhances the extraction yield of both macromolecules like starch and micromolecules such as polyphenols without adversely affecting their functional properties.

Author Contributions

Conceptualization, V.N.C., H.K., T.P., F.B. and P.P.; methodology, V.N.C., P.M.J., K.P., K.S. and G.V.; software, V.N.C., J.A. and P.M.J.; validation, P.M.J., K.S., H.K., F.B. and P.P.; formal analysis, V.N.C., C.S., J.A., P.M.J. and K.S.; investigation, V.N.C., C.S., J.A., P.M.J., K.P., G.V. and K.S.; resources, H.K., T.P. and P.P.; data curation, V.N.C., C.S., J.A., P.M.J., K.P., G.V., K.S., F.B. and P.P.; writing—original draft preparation, V.N.C., C.S., J.A., P.M.J., F.B. and P.P.; writing—review and editing, V.N.C., C.S., J.A., P.M.J., H.K., T.P., F.B. and P.P.; visualization, V.N.C., C.S., J.A., P.M.J., H.K., T.P., F.B. and P.P.; supervision, P.M.J., H.K., T.P. and P.P.; project administration, H.K. and P.P.; funding acquisition, H.K. and P.P. All authors have read and agreed to the published version of the manuscript.

Funding

The authors would like to thank the regional authorities of La Reunion as well as the European Union for supporting our research by the FEDER grant: Feder European Project RAFALE D2016009986-AAP-RDI 2015-1a-Action 1.09-Synergie Number: RE0002581.

Data Availability Statement

The original contributions presented in this study are included in the article. Further inquiries can be directed to the corresponding author.

Acknowledgments

We would like to sincerely acknowledge Abel Hiol for his support in making the project possible.

Conflicts of Interest

The authors declare no conflicts of interest.

References

  1. Soni, P.L.; Sharma, H.; Srivastava, H.C.; Gharia, M.M. Physicochemical Properties of Canna Edulis Starch—Comparison with Maize Starch. Starch-Stärke 1990, 42, 460–464. [Google Scholar] [CrossRef]
  2. Piyachomkwan, K.; Chotineeranat, S.; Kijkhunasatian, C.; Tonwitowat, R.; Prammanee, S.; Oates, C.G.; Sriroth, K. Edible canna (Canna edulis) as a complementary starch source to cassava for the starch industry. Ind. Crops Prod. 2002, 16, 11–21. [Google Scholar] [CrossRef]
  3. Gallant, D.J.; Bewa, H.; Buy, Q.H.; Bouchet, B.; Szylit, O.; Sealy, L. On Ultrastructural and Nutritional Aspects of Some Tropical Tuber Starches. Starch-Stärke 1982, 34, 255–262. [Google Scholar] [CrossRef]
  4. Cisneros, F.H.; Zevillanos, R.; Cisneros-Zevallos, L. Characterization of Starch from Two Ecotypes of Andean Achira Roots (Canna Edulis). J. Agric. Food Chem. 2009, 57, 7363–7368. [Google Scholar] [CrossRef] [PubMed]
  5. Aprianita, A.; Vasiljevic, T.; Bannikova, A.; Kasapis, S. Physicochemical Properties of Wheat-Canna and Wheat-Konjac Composite Flours. J. Food Sci. Technol. 2014, 51, 1784–1794. [Google Scholar] [CrossRef] [PubMed]
  6. Mishra, T.; Goyal, A.K.; Middha, S.K.; Sen, A. Antioxidative properties of Canna edulis Ker-Gawl. Indian. J. Nat. Prod. Resour. 2011, 2, 315–321. [Google Scholar]
  7. Hung, P.; Morita, N. Physicochemical Properties and Enzymatic Digestibility of Starch from Edible Canna (Canna Edulis) Grown in Vietnam. Carbohydr. Polym. 2005, 61, 314–321. [Google Scholar] [CrossRef]
  8. Builders, P.F.; Arhewoh, M.I. Pharmaceutical Applications of Native Starch in Conventional Drug Delivery. Starch-Stärke 2016, 68, 864–873. [Google Scholar] [CrossRef]
  9. Andrade-Mahecha, M.M.; Tapia-Blácido, D.R.; Menegalli, F.C. Physical-Chemical, Thermal, and Functional Properties of Achira (Canna indica L.) Flour and Starch from Different Geographical Origin. Starch-Stärke 2012, 64, 348–358. [Google Scholar] [CrossRef]
  10. Falade, K.O.; Okafor, C.A. Physicochemical Properties of Five Cocoyam (Colocasia Esculenta and Xanthosoma Sagittifolium) Starches. Food Hydrocoll. 2013, 30, 173–181. [Google Scholar] [CrossRef]
  11. Rahman, S.M.M.; Rakshit, S.K. Effect of Endogenous and Commercial Enzyme on Improving Extraction of Sweet Potato Starch. In Proceedings of the 2004 ASAE Annual Meeting, Ottawa, ON, Canada, 1–4 August 2004. [Google Scholar]
  12. Daiuto, É.; Cereda, M.; Sarmento, S.; Vilpoux, O. Effects of Extraction Methods on Yam (Dioscorea Alata) Starch Characteristics. Starch-Stärke 2005, 57, 153–160. [Google Scholar] [CrossRef]
  13. Padmanabhan, S.; Ramakrishna, M.; Lonsane, B.K.; Krishnaiah, M.M. Enzymic Treatment of Cassava Flour Slurry for Enhanced Recovery of Starch. Food Biotechnol. 1993, 7, 1–10. [Google Scholar] [CrossRef]
  14. Chemat, F.; Zill-E-Huma; Khan, M.K. Applications of Ultrasound in Food Technology: Processing, Preservation and Extraction. Ultrason. Sonochem. 2011, 18, 813–835. [Google Scholar] [CrossRef]
  15. Chan, H.-T.T.; Bhat, R.; Karim, A.A. Effects of Sodium Dodecyl Sulphate and Sonication Treatment on Physicochemical Properties of Starch. Food Chem. 2010, 120, 703–709. [Google Scholar] [CrossRef]
  16. Zhu, J.; Li, L.; Chen, L.; Li, X. Study on Supramolecular Structural Changes of Ultrasonic Treated Potato Starch Granules. Food Hydrocoll. 2012, 29, 116–122. [Google Scholar] [CrossRef]
  17. Wang, J.; Sun, B.; Cao, Y.; Tian, Y.; Li, X. Optimisation of Ultrasound-Assisted Extraction of Phenolic Compounds from Wheat Bran. Food Chem. 2008, 106, 804–810. [Google Scholar] [CrossRef]
  18. Shen, N. Optimization of Succinic Acid Production from Cane Molasses by Actinobacillus Succinogenes GXAS137 Using Response Surface Methodology (RSM). Food Sci. Biotechnol. 2014, 23, 1911–1919. [Google Scholar] [CrossRef]
  19. Box, G.E.P.; Behnken, D.W. Some New Three Level Designs for the Study of Quantitative Variables. Technometrics 1960, 2, 455–475. [Google Scholar] [CrossRef]
  20. Ying, Z.; Han, X.; Li, J. Ultrasound-Assisted Extraction of Polysaccharides from Mulberry Leaves. Food Chem. 2011, 127, 1273–1279. [Google Scholar] [CrossRef] [PubMed]
  21. Le, H.; Le, V.V.M. Comparison of Enzyme-Assisted and Ultrasound-Assisted Extraction of Vitamin C and Phenolic Compounds from Acerola (Malpighia Emarginata DC.) Fruit. Int. J. Food Sci. Technol. 2012, 47, 1206–1214. [Google Scholar] [CrossRef]
  22. Hromádková, Z.; Ebringerová, A.; Valachovič, P. Comparison of Classical and Ultrasound-Assisted Extraction of Polysaccharides from Salvia Officinalis L. Ultrason. Sonochem. 1999, 5, 163–168. [Google Scholar] [CrossRef] [PubMed]
  23. Chen, W. Optimization of Ultrasound-Assisted Extraction of Phenolic Compounds from Areca Husk. J. Food Process. Preserv. 2014, 38, 90–96. [Google Scholar] [CrossRef]
  24. Pan, G.; Yu, G.; Zhu, C.; Qiao, J. Optimization of Ultrasound-Assisted Extraction (UAE) of Flavonoids Compounds (FC) from Hawthorn Seed (HS). Ultrason. Sonochem. 2012, 19, 486–490. [Google Scholar] [CrossRef] [PubMed]
  25. Sit, N.; Misra, S.; Deka, S.C. Yield and Functional Properties of Taro Starch as Affected by Ultrasound. Food Bioprocess. Technol. 2014, 7, 1950–1958. [Google Scholar] [CrossRef]
  26. Association of Official Analytical Chemists (AOAC). Official Methods of Analysis of AOAC International. Assoc. Off. Anal. Chem. 1990, 15, 2. [Google Scholar]
  27. Holm, J.; Björck, I.; Drews, A.; Asp, N. A Rapid Method for the Analysis of Starch. Starch-Stärke 1986, 38, 224–226. [Google Scholar] [CrossRef]
  28. Qi, Y. Optimization of Starch Isolation from Red Sorghum Using Response Surface Methodology. LWT-Food Sci. Technol. 2017, 91, 242–248. [Google Scholar] [CrossRef]
  29. Yu, S.; Ma, Y.; Menager, L.; Sun, D.W. Physicochemical Properties of Starch and Flour from Different Rice Cultivars. Food Bioprocess. Technol. 2012, 5, 626–637. [Google Scholar] [CrossRef]
  30. Sujka, M.; Jamroz, J. Ultrasound-Treated Starch: SEM and TEM Imaging, and Functional Behaviour. Food Hydrocoll. 2013, 31, 413–419. [Google Scholar] [CrossRef]
  31. Maran, J.P.; Manikandan, S.; Priya, B.; Gurumoorthi, P. Box-Behnken Design Based Multi-Response Analysis and Optimization of Supercritical Carbon Dioxide Extraction of Bioactive Flavonoid Compounds from Tea (Camellia sinensis L.) Leaves. J. Food Sci. Technol. 2015, 52, 92–104. [Google Scholar] [CrossRef]
  32. Bezerra, M.A.; Santelli, R.E.; Oliveira, E.P.; Villar, L.S.; Escaleira, L.A. Response Surface Methodology (RSM) as a Tool for Optimization in Analytical Chemistry. Talanta 2008, 76, 965–977. [Google Scholar] [CrossRef]
  33. Maran, J.P. Box-Behnken Design Based Statistical Modeling for Ultrasound-Assisted Extraction of Corn Silk Polysaccharide. Carbohydr. Polym. 2013, 92, 604–611. [Google Scholar] [CrossRef]
  34. Septembre-Malaterre, A.; Stanislas, G.; Douraguia, E.; Gonthier, M.P. Evaluation of Nutritional and Antioxidant Properties of the Tropical Fruits Banana, Litchi, Mango, Papaya, Passion Fruit and Pineapple Cultivated in R??Union French Island. Food Chem. 2016, 212, 225–233. [Google Scholar] [CrossRef]
  35. Folin, O.; Denis, W. A Colorimetric Method for the Determination of Phenols (and Phenol Derivatives) in Urine. J. Biol. Chem. 1915, 22, 305–308. [Google Scholar] [CrossRef]
  36. Hatia, S. Evaluation of Antioxidant Properties of Major Dietary Polyphenols and Their Protective Effect on 3T3-L1 Preadipocytes and Red Blood Cells Exposed to Oxidative Stress. Free Radic. Res. 2014, 48, 387–401. [Google Scholar] [CrossRef] [PubMed]
  37. Benmoussa, M.; Hamaker, B.R. Rapid Small-Scale Starch Isolation Using a Combination of Ultrasonic Sonication and Sucrose Density Separation. Starch-Starke 2011, 63, 333–339. [Google Scholar] [CrossRef]
  38. Park, S.H.; Bean, S.R.; Wilson, J.D.; Schober, T.J. Rapid Isolation of Sorghum and Other Cereal Starches Using Sonication. Cereal Chem. 2006, 83, 611–616. [Google Scholar] [CrossRef]
  39. Wang, L.; Wang, Y.J. Rice Starch Isolation by Neutral Protease and High-Intensity Ultrasound. J. Cereal Sci. 2004, 39, 291–296. [Google Scholar] [CrossRef]
  40. Guo, Z.; Zhao, B.; Li, H.; Miao, S.; Zheng, B. Optimization of Ultrasound-Microwave Synergistic Extraction of Prebiotic Oligosaccharides from Sweet Potatoes (Ipomoea batatas L.). Innov. Food Sci. Emerg. Technol. 2019, 54, 51–63. [Google Scholar] [CrossRef]
  41. Maran, J.P.; Manikandan, S. Response Surface Modeling and Optimization of Process Parameters for Aqueous Extraction of Pigments from Prickly Pear (Opuntia Ficus-Indica) Fruit. Dye. Pigment. 2012, 3, 465–472. [Google Scholar] [CrossRef]
  42. Maran, J.P.; Priya, B. Ultrasound-Assisted Extraction of Pectin from Sisal Waste. Carbohydr. Polym. 2015, 115, 732–738. [Google Scholar] [CrossRef] [PubMed]
  43. Toma, M.; Vinatoru, M.; Paniwnyk, L.; Mason, T.J. Investigation of the Effects of Ultrasound on Vegetal Tissues during Solvent Extraction. Ultrason. Sonochem 2001, 2, 137–142. [Google Scholar] [CrossRef]
  44. Wang, X.S.; Wu, Y.F.; Dai, S.L.; Chen, R.; Shao, Y. Ultrasound-Assisted Extraction of Geniposide from Gardenia Jasminoides. Ultrason. Sonochem 2012, 19, 1155–1159. [Google Scholar] [CrossRef] [PubMed]
  45. Vilkhu, K.; Mawson, R.; Simons, L.; Bates, D. Applications and Opportunities for Ultrasound Assisted Extraction in the Food Industry—A Review. Innov. Food Sci. Emerg. Technol. 2008, 9, 161–169. [Google Scholar] [CrossRef]
  46. Sun, R.C.; Tomkinson, J. Comparative Study of Lignins Isolated by Alkali and Ultrasound-Assisted Alkali Extractions from Wheat Straw. Ultrason. Sonochem. 2002, 9, 85–93. [Google Scholar] [CrossRef]
  47. Chen, F. Optimization of Ultrasound-Assisted Extraction of Anthocyanins in Red Raspberries and Identification of Anthocyanins in Extract Using High-Performance Liquid Chromatography-Mass Spectrometry. Ultrason. Sonochem. 2007, 14, 767–778. [Google Scholar] [CrossRef]
  48. Puncha-arnon, S.; Pathipanawat, W.; Puttanlek, C.; Rungsardthong, V.; Uttapap, D. Effects of Relative Granule Size and Gelatinization Temperature on Paste and Gel Properties of Starch Blends. Food Res. Int. 2008, 41, 552–561. [Google Scholar] [CrossRef]
  49. Sandhu, K.S.; Singh, N. Some Properties of Corn Starches II: Physicochemical, Gelatinization, Retrogradation, Pasting and Gel Textural Properties. Food Chem. 2007, 101, 1499–1507. [Google Scholar] [CrossRef]
  50. Jambrak, A.R. Ultrasound Effect on Physical Properties of Corn Starch. Carbohydr. Polym. 2010, 79, 91–100. [Google Scholar] [CrossRef]
  51. Halbrook, W.U.; Kurtzman, R.H., Jr. Water Uptake of Bean and Other Starches at High Temperatures and Pressures. Cereal Chem. 1975, 52, 156–161. [Google Scholar]
  52. Ekanayake, S.; Nair, B.M.; Asp, N.G.; Jansz, E.R. Effect of Processing of Sword Beans (Canavalia Gladiata) on Physicochemical Properties of Starch. Starch-Starke 2006, 58, 215–222. [Google Scholar] [CrossRef]
  53. Tester, R.F.; Morrison, W.R. Swelling and Gelatinization of Cereal Starches. II. Waxy Rice Starches. Cereal Chem. 1990, 67, 558–563. [Google Scholar]
  54. Wu, Y.; Du, X.; Ge, H.; Lv, Z. Preparation of Microporous Starch by Glucoamylase and Ultrasound. Starch-Starke 2011, 63, 217–225. [Google Scholar] [CrossRef]
  55. Majzoobi, M.; Hedayati, S.; Farahnaky, A. Functional Properties of Microporous Wheat Starch Produced by α-Amylase and Sonication. Food Biosci. 2015, 11, 79–84. [Google Scholar] [CrossRef]
  56. Brusotti, G.; Ngueyem, T.A.; Biesuz, R.; Caccialanza, G. Optimum extraction process of polyphenols from Bridelia grandis stem bark using experimental design. J. Sep. Sci. 2010, 33, 1692–1697. [Google Scholar] [CrossRef] [PubMed]
  57. Vinatoru, M. An Overview of the Ultrasonically Assisted Extraction of Bioactive Principles from Herbs. Ultrason. Sonochem. 2001, 8, 303–313. [Google Scholar] [CrossRef]
  58. Rostagno, M.A.; Palma, M.; Barroso, C.G. Ultrasound-Assisted Extraction of Soy Isoflavones. J. Chromatogr. A 2003, 1012, 119–128. [Google Scholar] [CrossRef]
  59. Rice-Evans, C.A.; Miller, N.J.; Paganga, G. Antioxidant Properties of Phenolic Compounds. Trends Plant Sci. 1997, 2, 152–159. [Google Scholar] [CrossRef]
  60. Adjé, F.; Lozano, Y.F.; Lozano, P.; Adima, A.; Chemat, F.; Gaydou, E.M. Optimization of Anthocyanin, Flavonol and Phenolic Acid Extractions from Delonix Regia Tree Flowers Using Ultrasound-Assisted Water Extraction. Ind. Crops Prod. 2010, 32, 439–444. [Google Scholar] [CrossRef]
  61. Chemat, F.; Rombaut, N.; Sicaire, A.; Meullemiestre, A.; Abert-vian, M. Ultrasonics Sonochemistry Ultrasound Assisted Extraction of Food and Natural Products. Mechanisms, Techniques, Combinations, Protocols and Applications. A Review. Ultrason. Sonochem. 2017, 34, 540–560. [Google Scholar] [CrossRef] [PubMed]
  62. Moharram, H.A.; Youssef, M.M. Methods for Determining the Antioxidant Activity: A Review. Alex. J. Food Sci. Technol. 2014, 11, 31–41. [Google Scholar]
  63. Khan, M.K.; Abert-Vian, M.; Fabiano-Tixier, A.S.; Dangles, O.; Chemat, F. Ultrasound-Assisted Extraction of Polyphenols (Flavanone Glycosides) from Orange (Citrus sinensis L.) Peel. Food Chem. 2010, 119, 851–858. [Google Scholar] [CrossRef]
  64. Chen, C. Ultrasound-Assisted Extraction from Defatted Oat (Avena sativa L.) Bran to Simultaneously Enhance Phenolic Compounds and β-Glucan Contents: Compositional and Kinetic Studies. J. Food Eng. 2018, 222, 1–10. [Google Scholar] [CrossRef]
  65. Dzah, C.S. The Effects of Ultrasound Assisted Extraction on Yield, Antioxidant, Anticancer and Antimicrobial Activity of Polyphenol Extracts: A Review. Food Biosci. 2019, 35, 100547. [Google Scholar] [CrossRef]
  66. Roy, M.K.; Koide, M.; Rao, T.P.; Okubo, T.; Ogasawara, Y.; Juneja, L.R. ORAC and DPPH Assay Comparison to Assess Antioxidant Capacity of Tea Infusions: Relationship between Total Polyphenol and Individual Catechin Content. Int. J. Food Sci. Nutr. 2010, 61, 109–124. [Google Scholar] [CrossRef]
Figure 1. Comparison of conventional (CE) and ultrasound-assisted extraction (UAE) method on the yield of starch from Canna rhizomes (**** stands for statistically significant, p < 0.0001).
Separations 12 00307 g001
Figure 2. Response surface plots. (a) Effect of solid-to-liquid ratio and temperature on starch yield; (b) effect of solid-to-liquid ratio and time on starch yield; and (c) effect of time and temperature on starch yield.
Separations 12 00307 g002
Figure 3. SEM images of UAE (on the left) and CE (on the right) Canna starch at magnifications, from top to bottom, of ×250 (a), ×500 (b), ×2500 (c), ×1500 (d), and ×1000 (e).
Separations 12 00307 g003
Figure 4. Total polyphenol yields through CE and UAE (**** stands for statistically significant, p < 0.0001).
Separations 12 00307 g004
Figure 5. Radical-scavenging activity of phenols extracted through conventional extraction (CE) and ultrasound-assisted extraction (UAE) from fresh Canna rhizomes (** stands for statistically significant, p < 0.01).
Separations 12 00307 g005
Figure 6. Antioxidant activity of phenols extracted from fresh canna rhizomes through conventional extraction (CE) and ultrasound-assisted extraction (UAE) (*** stands for statistically significant, p < 0.001).
Separations 12 00307 g006
Table 1. Variables and levels (coded).
VariablesLevel (−1)Level (0)Level (1)
Temperature (°C)304050
Time (min)51015
Solid-to-liquid ratio (g/mL)1:11:21:3
Table 2. Three-factor three-level Box–Behnken design.
Experimental Design with Predicted and Experimental Values
Factors (Coded and Actual Values)Experimental ValuePredicted Value
RunA: Temperature (°C)B: Time (min)C: Solid-to-Liquid (g/mL)Starch Yield (%)Starch Yield (%)
140 (0)15 (1)1:1 (−1)7.28857.07
230 (−1)10 (0)1:3 (1)18.180217.97
340 (0)5 (−1)1:3 (1)16.047916.26
430 (−1)10 (0)1:1 (−1)8.45248.71
550 (1)10 (0)1:1 (−1)8.60858.82
650 (1)5 (−1)1:2 (0)9.9910.03
740 (0)10 (0)1:2 (0)15.510815.47
840 (0)10 (0)1:2 (0)15.373715.47
950 (1)15 (1)1:2 (0)13.262213.26
1050 (1)10 (0)1:3 (1)19.525619.27
1130 (−1)5 (−1)1:2 (0)11.891311.89
1240 (0)10 (0)1:2 (0)15.073715.47
1340 (0)15 (1)1:3 (1)17.213217.47
1440 (0)10 (0)1:2 (0)16.021115.47
1530 (−1)15 (1)1:2 (0)10.02399.98
1640 (0)5 (−1)1:1 (−1)7.20526.95
1740 (0)10 (0)1:2 (0)15.378515.47
Table 3. Model summary statistics.
Model Summary Statistics
SourceSequential Sum of Squares (p-Value)R2Adjusted R2Predicted R2Press
Linear0.00020.77830.72710.633292.3858
2FI0.69230.80710.69130.4134147.7631
Quadratic<0.00010.99630.99160.96867.9030Suggested
Cubic0.40510.99810.9924 Aliased
Table 4. Pareto analysis of variance.
ANOVA
SourceCoefficient EstimateSum of SquaresDFMean SquareF-Valuep-Value
Model15.47250.97927.89210.55<0.0001significant
A-Temperature0.351.0111.017.600.0282
B-Time0.330.8810.886.640.0366
C-Solid-to-Liquid Ratio4.93194.171194.171466.00<0.0001
AB1.286.6016.6049.860.0002
AC0.300.3510.352.670.1463
BC0.270.2910.292.210.1807
A2−1.216.2016.2046.800.0002
B2−2.9737.05137.05279.73<0.0001
C2−0.571.3511.3510.200.0152
Residual 0.9370.13
Lack of Fit 0.4530.151.240.4051not significant
Pure Error 0.4840.12
Cor Total 251.9016
Mean 13.24
Coefficient of
Variance (CV) %
2.75
Determination
Coefficient (R2)
0.9963
Correlation
Coefficient (R)
0.9981
Adjusted Determination
Coefficient (Adj-R2)
0.9916
Predicted Determination
Coefficient (Pred-R2)
0.9686
Table 5. Predicted and experimented starch yield at optimum conditions.
FactorsOptimum ConditionsPredicted Values of
Starch Yield (%)
Experimental Values of
Starch Yield (%)
Temperature40 °C19.741719.871
Time10 min
Solid-to-Liquid Ratio1:30
Table 6. Physicochemical properties of Canna starch.
Canna Starch
Physicochemical PropertiesCEUAE
MeanSDMeanSD
Water Absorption Index (%)168.70002.3774174.94003.06
Oil Absorption Index (%)219.74967.2849217.574614.13
Water Solubility Index (55° C)201.87001.2768212.11861.26
Water Solubility Index (85 °C)1339.100039.23401345.90002.78
Swelling Power (%) (55 °C)2.11530.11742.12820.01
Swelling Power (%) (85 °C)13.09900.286713.28500.09
Disclaimer/Publisher’s Note: The statements, opinions and data contained in all publications are solely those of the individual author(s) and contributor(s) and not of MDPI and/or the editor(s). MDPI and/or the editor(s) disclaim responsibility for any injury to people or property resulting from any ideas, methods, instructions or products referred to in the content.