Article

High-Resolution Analysis of DNA Electrophoretic Separations via Digital Image Processing

1
Faculty of Engineering, Anhui Sanlian University, Hefei 230000, China
2
Engineering Research Center of Optical Instrument and System, Shanghai Environmental Biosafety Instruments and Equipment Engineering Technology Research Center, School of Optoelectronic Information and Computer Engineering, University of Shanghai for Science and Technology, Shanghai 200093, China
3
Division of Natural and Applied Sciences, Duke Kunshan University, Kunshan 215335, China
4
Comprehensive Research Organization, Waseda University, Tokyo 162-0041, Japan
*
Author to whom correspondence should be addressed.
Separations 2025, 12(11), 296; https://doi.org/10.3390/separations12110296
Submission received: 11 October 2025 / Revised: 27 October 2025 / Accepted: 28 October 2025 / Published: 29 October 2025

Abstract

Compared with capillary electrophoresis (CE), gel electrophoresis (GE) is a traditional method for the analysis of nucleic acids because of its low cost, although the operation process is complicated. The electropherogram from CE can offer more information (e.g., DNA size and its concentration) for researchers. Based on the self-built integrated biochip GE system, we proposed a computational method that converts conventional agarose GE images into CE-like fluorescence profiles for enhanced DNA analysis. The gel images were processed using an image-based algorithm involving median filtering to remove background noise and pixel-wise intensity summation along the migration axis to generate one-dimensional records of electrophoretic separations. Each DNA band in the gel was thereby transformed into a distinct fluorescence peak, reflecting its migration distance and relative intensity. To further enhance resolution and peak separation, Gaussian modeling was applied to fit the fluorescence intensity distribution, providing smoother and more distinguishable spectral peaks. To validate the method, three periodontal pathogens—Porphyromonas gingivalis (P.g), Treponema denticola (T.d), and Tannerella forsythia (T.f)—were amplified using PCR and analyzed by gel electrophoresis. The method successfully identified distinct electrophoretic patterns for the three pathogens by using a 50 bp DNA ladder as an internal calibration reference. The results demonstrate that image-based reconstruction of electrophoretic data provides a reliable, quantitative, and visually interpretable representation of DNA migration, comparable to CE output. This approach bridges a gap between traditional GE and modern capillary systems, allowing for the semi-quantitative analysis of DNA fragments without specialized CE instrument. The proposed method offers a valuable analysis method for the separation of DNA, RNA, protein and polypeptides.

1. Introduction

DNA separation and quantitative analysis are fundamental techniques in molecular biology [1], genetics [2], and forensic science [3]. Accurate determination of DNA fragment length and concentration is essential for a wide range of applications, including gene cloning, mutation analysis, PCR product verification, and genetic polymorphism studies. Among the available analytical methods, gel electrophoresis (GE) [4] and capillary electrophoresis (CE) [5] are two of the most widely used approaches. Although both techniques rely on the migration of charged biomolecules under an electric field, they differ substantially in detection principles, data representation, and quantification capability.
Gel electrophoresis has long been favored in biological laboratories because of its low cost and intuitive visual output. During GE, DNA samples are loaded onto an agarose [6] or polyacrylamide gel [7], separated according to molecular size under an applied voltage, and visualized through staining. The resulting image displays a series of DNA bands that reflect fragment distribution. However, the analysis is primarily qualitative—resolution and accuracy are limited by factors such as gel composition, electric field uniformity, and imaging conditions. Furthermore, gel electrophoresis results are presented as two-dimensional grayscale images that lack the quantitative, time-resolved signal form as CE, making it difficult to precisely compare fragment sizes or concentrations. Although there are two open-source software packages for analysis of the gel image: ImageJ and GelGenie. Both of them provide versatile platforms for gel band detection and quantification. Moreover, these tools often depend on manual lane selection, subjective intensity thresholding, and limited automation, which may introduce operator bias and reduce reproducibility, especially when analyzing large sets of electrophoresis images.
By contrast, CE employs narrow capillaries as the separation spaces and couples them with high-sensitivity fluorescence detection systems. This configuration enables rapid, high-resolution DNA separation and produces results in the form of electropherograms, where signal intensity is plotted against migration time. Such peak-based data allow both qualitative differentiation of closely related fragments and quantitative assessment of DNA concentration through peak height and area [8]. However, CE instruments are expensive, require meticulous maintenance, and depend on strict sample preparation and environmental control. Consequently, CE is not always accessible for routine use in resource-limited or educational laboratories. Therefore, we developed a low-cost integrated gel electrophoresis system based on a biochip, which can realize online observing the process of DNA separation [9]. Such a system is easy to assemble and operate.
With the rapid development of image processing technology, the digital and quantitative analysis of traditional experimental images has become increasingly feasible. In recent years, several studies have applied image analysis to GE for automatic band detection, grayscale integration, and semi-quantitative estimation of DNA concentration. However, these methods mainly focus on improving the readability and analysis of GE images themselves [10,11,12]; few attempts have been made to establish a direct correspondence between GE images and CE-like electropherograms. Bridging this gap could enable low-cost, high-efficiency DNA quantification through computational transformation—effectively turning conventional gel electrophoresis results into digital electropherograms without the need for expensive CE instruments.
To address this problem, the present study proposes a novel image-to-signal conversion method that transforms gel electrophoresis images into simulated CE-like profiles. The principle is to extract the one-dimensional intensity distribution from a two-dimensional gel image and reconstruct it as a continuous signal that resembles a CE electropherogram. By applying appropriate mathematical modeling—particularly Gaussian function fitting—each DNA band is represented as an individual peak whose position and area correspond to migration distance and concentration, respectively. This enables the generation of virtual CE-like plots directly from ordinary gel images, facilitating quantitative DNA analysis using only basic imaging and computational tools.

2. Materials and Methods

2.1. Reagents

D2000 DNA ladder was from Takara (Shanghai, China). 10× TBE (Tris–borate–EDTA), 10,000× SYBR Green I and agarose were bought from Solarbio (Beijing, China). SpeedSTAR HS DNA Polymerase and 50 bp DNA ladders were from Takara (Shiga, Japan). 0.5× TBE was prepared by diluting 10× TBE in ultrapure water with a ratio of 1:19. The biochip was fabricated by engraving the acrylic sheet with a Laser Engraving and Cutting Machine (Ketai Laser Instrument corporation, Liaocheng, China).

2.2. The Self-Build Compact Gel Electrophoresis System

All the experiments were performed on a self-built compact GE system, for which detailed information was described in Ref. [9]. In brief, the system consists of a LED array as light source, two optical filters, a CMOS camera, a self-developed miniaturized power supply, and a self-programmed software and a biochip. The channels in the biochip were engraved by a Laser Engraving and Cutting Machine. The width and depth of the chamber was about 2.5 mm and 3 mm, respectively. There were two optical filters below and above the biochip, which were named OFb and OFa, respectively. The transmission rate of them can refer to Figures S1 and S2 in the Supporting Information. Theoretically, the mixture of DNA and fluorescent dyes migrate in the agarose gel under certain electric field strength. The wavelength of the light source was firstly filtered to be 485–510 nm by OFb, which was corresponding to the excitation wavelength of SYBR Green I [13], and then excited the mixture. Then the fluorescence emits from the mixture was captured by the CMOS camera, which can record the migration process of the electrophoresis. The power supply was switched off after all the DNA bands were separated.

2.3. Separation of DNA in the Self-Built Gel Electrophoresis System

An appropriate amount of agarose powder was mixed with 0.5× TBE buffer in a beaker to achieve a final concentration of 1–2%. The beaker was sealed with plastic wrap, in which several holes were punctured to prevent overflow during subsequent heating. The solution was then heated for one minute in a microwave oven. The agarose gel solution was pipetted into the electrophoresis chamber of the chip. After solidification, sample wells were created near the negative electrode using a 3D-printed comb. Alternatively, a pre-cast gel biochip was prepared by simply removing its sealing film. For sample preparation, a 50 bp or 100 bp DNA ladder was mixed with SYBR Green I and a 6× loading buffer in a specified ratio. The prepared sample was then loaded into the wells. Electrophoresis was performed at 180 V for about 6–7 min.

2.4. Amplification of Periodontal Pathogens in the PCR Thermal Cycler

Amplification of the target genes of periodontal pathogens was performed in a commercial thermocycler (T-100 Thermal Cycler, BIO-RAD, Hercules, CA, USA). The primers designed for 16S rRNA was listed in Table S1 (see it in the Supporting Information), and they were synthesized by Sangon Biotech (Shanghai, China). The PCR solution consists of 5 μL 10× Fast Buffer I, 4 μL dNTP mixture (2.5 μm), 0.25 μL Speed STAR HS, 1 μL template, 1 μL forward primers and 1 μL backward primers, and 36.75 μL ultrapure water. Amplification was carried out with an initial preheating step at 95 °C for 2 min, succeeded by 35 cycles of 95 °C for 30 s (denaturation), 55 °C for 10 s (annealing), and 72 °C for 1 min (extension).

2.5. Digital Image Processing for Gel Electrophoresis Image

The proposed method consists of several major steps (Figure 1). First, the gel electrophoresis image is preprocessed to correct uneven illumination, background noise, and contrast variation. Techniques such as grayscale conversion, Gaussian or median filtering, and background subtraction are used to enhance signal clarity. Next, the region of interest (ROI) containing DNA bands is extracted, and the vertical grayscale projection is calculated to obtain the one-dimensional intensity profile across the gel lane. The position of each intensity maximum corresponds to a DNA band, while the integrated grayscale value reflects its relative concentration.
The spatial distance of migration is then mapped to molecular length through a logarithmic calibration curve derived from DNA markers [14,15,16]:
L o g L = a × D + b
where L represents fragment length and D denotes migration distance. Based on this relationship, each detected band is modeled as a Gaussian peak [17,18]:
I x = A e x p ( ( x x 0 ) 2 2 σ 2 )
where A corresponds to band intensity (DNA concentration), x0 is the migration position, and σ defines the peak width, I(x) denotes the fluorescence intensity at a given position x along the electrophoretic migration axis. Summing all fitted peaks yields a continuous signal curve analogous to the fluorescence electropherogram obtained in CE.
This transformation allows a GE image—originally a qualitative, spatially distributed pattern—to be expressed as a quantitative electrophoretic signal, preserving both fragment length and relative abundance information. The resulting CE-like plot not only facilitates data visualization but also enables automatic computation of peak area, height, and resolution, thus providing a robust foundation for DNA quantification and comparative analysis. By implementing this method, conventional GE can be extended from a simple visualization tool to a semi-quantitative analytical platform. Thus, it bridges an analytical gap between GE and CE, offering a cost-effective alternative for DNA analysis in laboratories where advanced instruments are unavailable. Moreover, the methodology demonstrates the potential of integrating digital image processing with electrophoretic modeling, creating new opportunities for computational biology and analytical biotechnology.

3. Results and Discussion

3.1. RGB Channel Analysis of SYBR Green I–Stained Gel Electrophoresis DNA Images

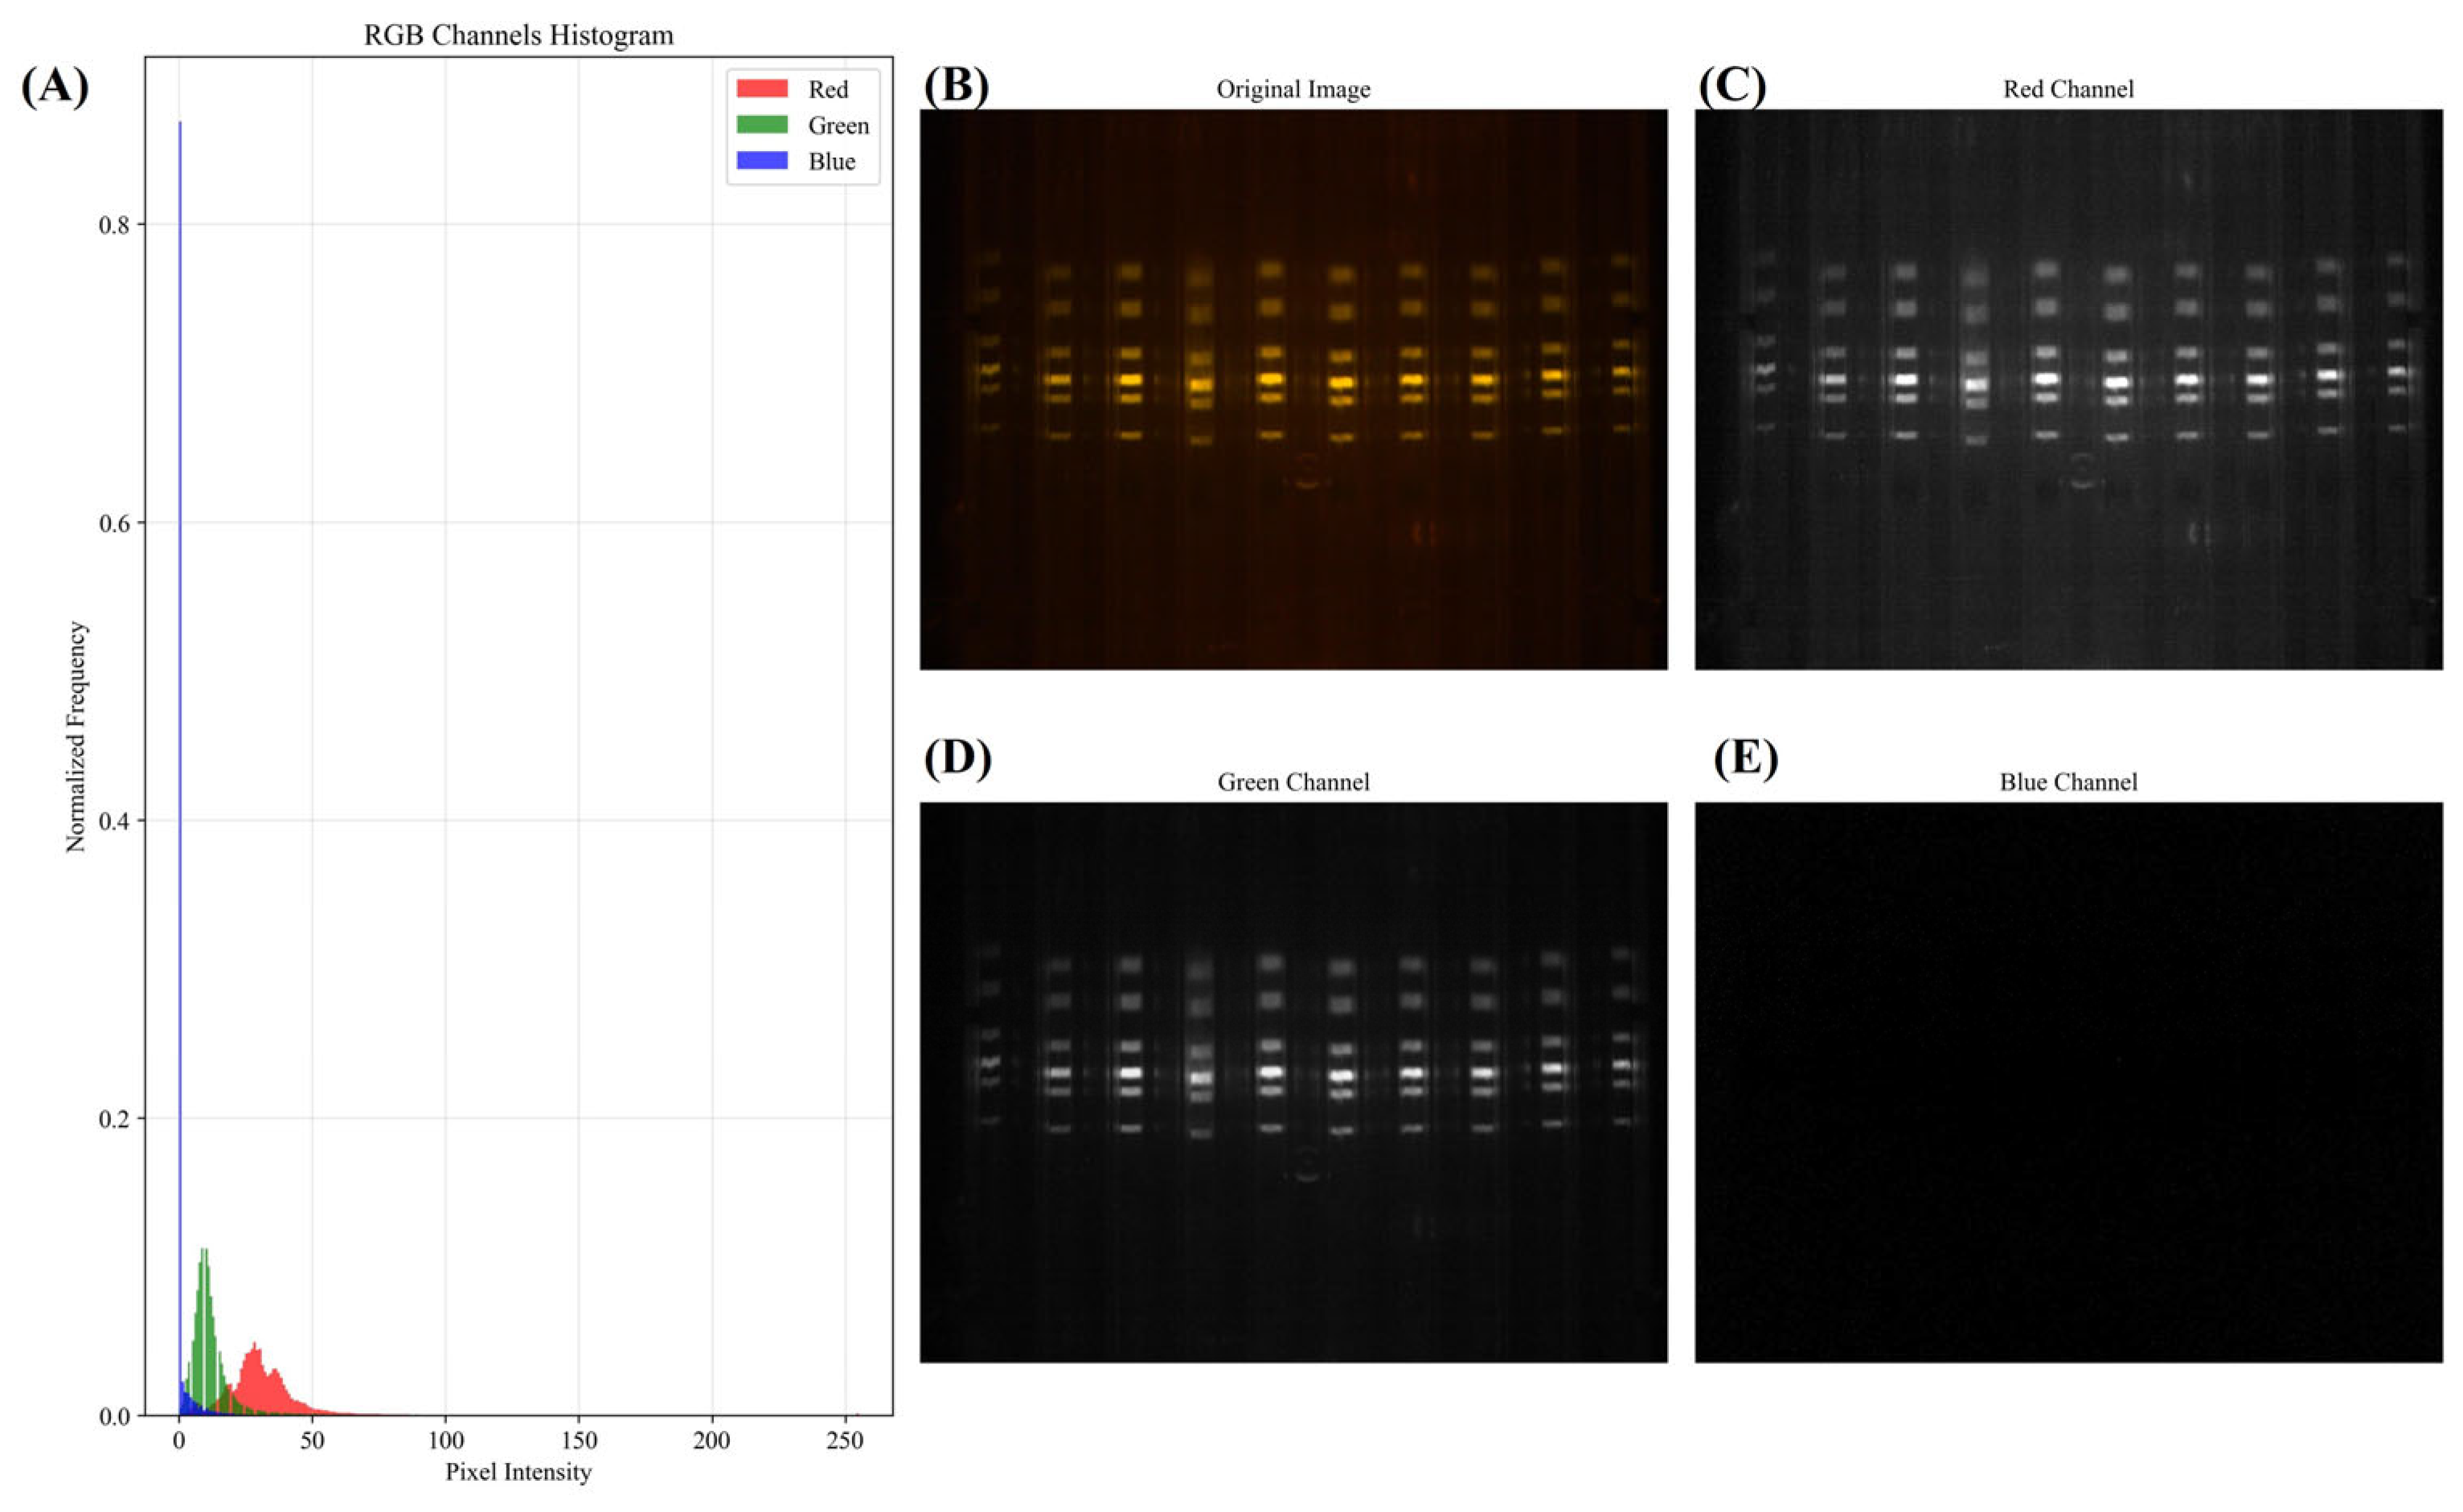
Figure 2 illustrates the channel decomposition and intensity distribution of a D2000 DNA GE image stained with SYBR Green I. The image on the upper left represents the original electrophoresis photograph, while the three grayscale images on the right display the red (R), green (G), and blue (B) channels extracted from the original RGB image. The histogram (Figure 2A) presents the normalized pixel intensity distributions for the three-color channels, providing insight into the spectral characteristics of the fluorescent dye and the digital response of the imaging system. SYBR Green I is a fluorescent nucleic acid stain that binds to double-stranded DNA and emits bright green fluorescence when excited by blue light (typically around 490 nm). Therefore, the strongest emission is expected within the green spectral region (centered near 520–530 nm). This property is clearly reflected in the histogram, where the green channel shows a distinct intensity peak at low-to-mid gray levels, indicating that most of the fluorescence signal is captured through the green detector component. The red channel also exhibits measurable intensity, likely due to spectral overlap and the broad emission tail of SYBR Green I extending into the red region of the visible spectrum. In contrast, the blue channel contributes negligibly to the overall signal, confirming that blue light primarily serves as the excitation source rather than part of the emission profile.
Both the red (Figure 2C) and green channel (Figure 2D) images reveal clear DNA bands aligned horizontally within each electrophoretic lane, corresponding to fragments of different molecular lengths. The green channel provides the highest contrast between the DNA bands and the background, indicating that it contains the dominant fluorescent information. The red channel, although weaker, still reproduces the general electrophoretic pattern and may enhance visualization when combined with the green component. The blue channel, on the other hand, remains almost entirely dark, reaffirming its minimal role in fluorescence emission detection.
The histogram further highlights that most pixel intensities are concentrated in the lower range (below 50 on a scale of 0–255), suggesting that the image is overall dim and background-dominated. This is typical for electrophoresis gels captured under UV or blue-light transillumination, where only the nucleic acid bands emit significant fluorescence. The sharp peaks near zero intensity correspond to dark background regions, while the small tail extending toward higher intensities represents the DNA bands. From an analytical perspective, isolating the RGB channels provides valuable information for optimizing image processing and quantitative analysis. Since the fluorescence signal is concentrated in the green channel, subsequent computational procedures—such as background subtraction, band detection, and intensity integration—should primarily utilize this channel to maximize the signal-to-noise ratio. The red channel can be used to cross-validate the detected bands or to enhance visualization through channel fusion. Meanwhile, excluding the blue channel can reduce computational redundancy and noise propagation. Overall, this analysis confirms the expected optical characteristics of SYBR Green I–stained DNA gels and establishes a clear basis for selecting the optimal image channel for downstream processing. The dominance of the green channel matches well with the dye’s emission properties, and its strong correlation with DNA band intensity supports its use in quantitative image-based analysis of electrophoretic patterns. Therefore, we used the green channel image for analysis in the subsequent part.

3.2. Transformation of Gel Electrophoresis Emage into CE-like Electropherogram

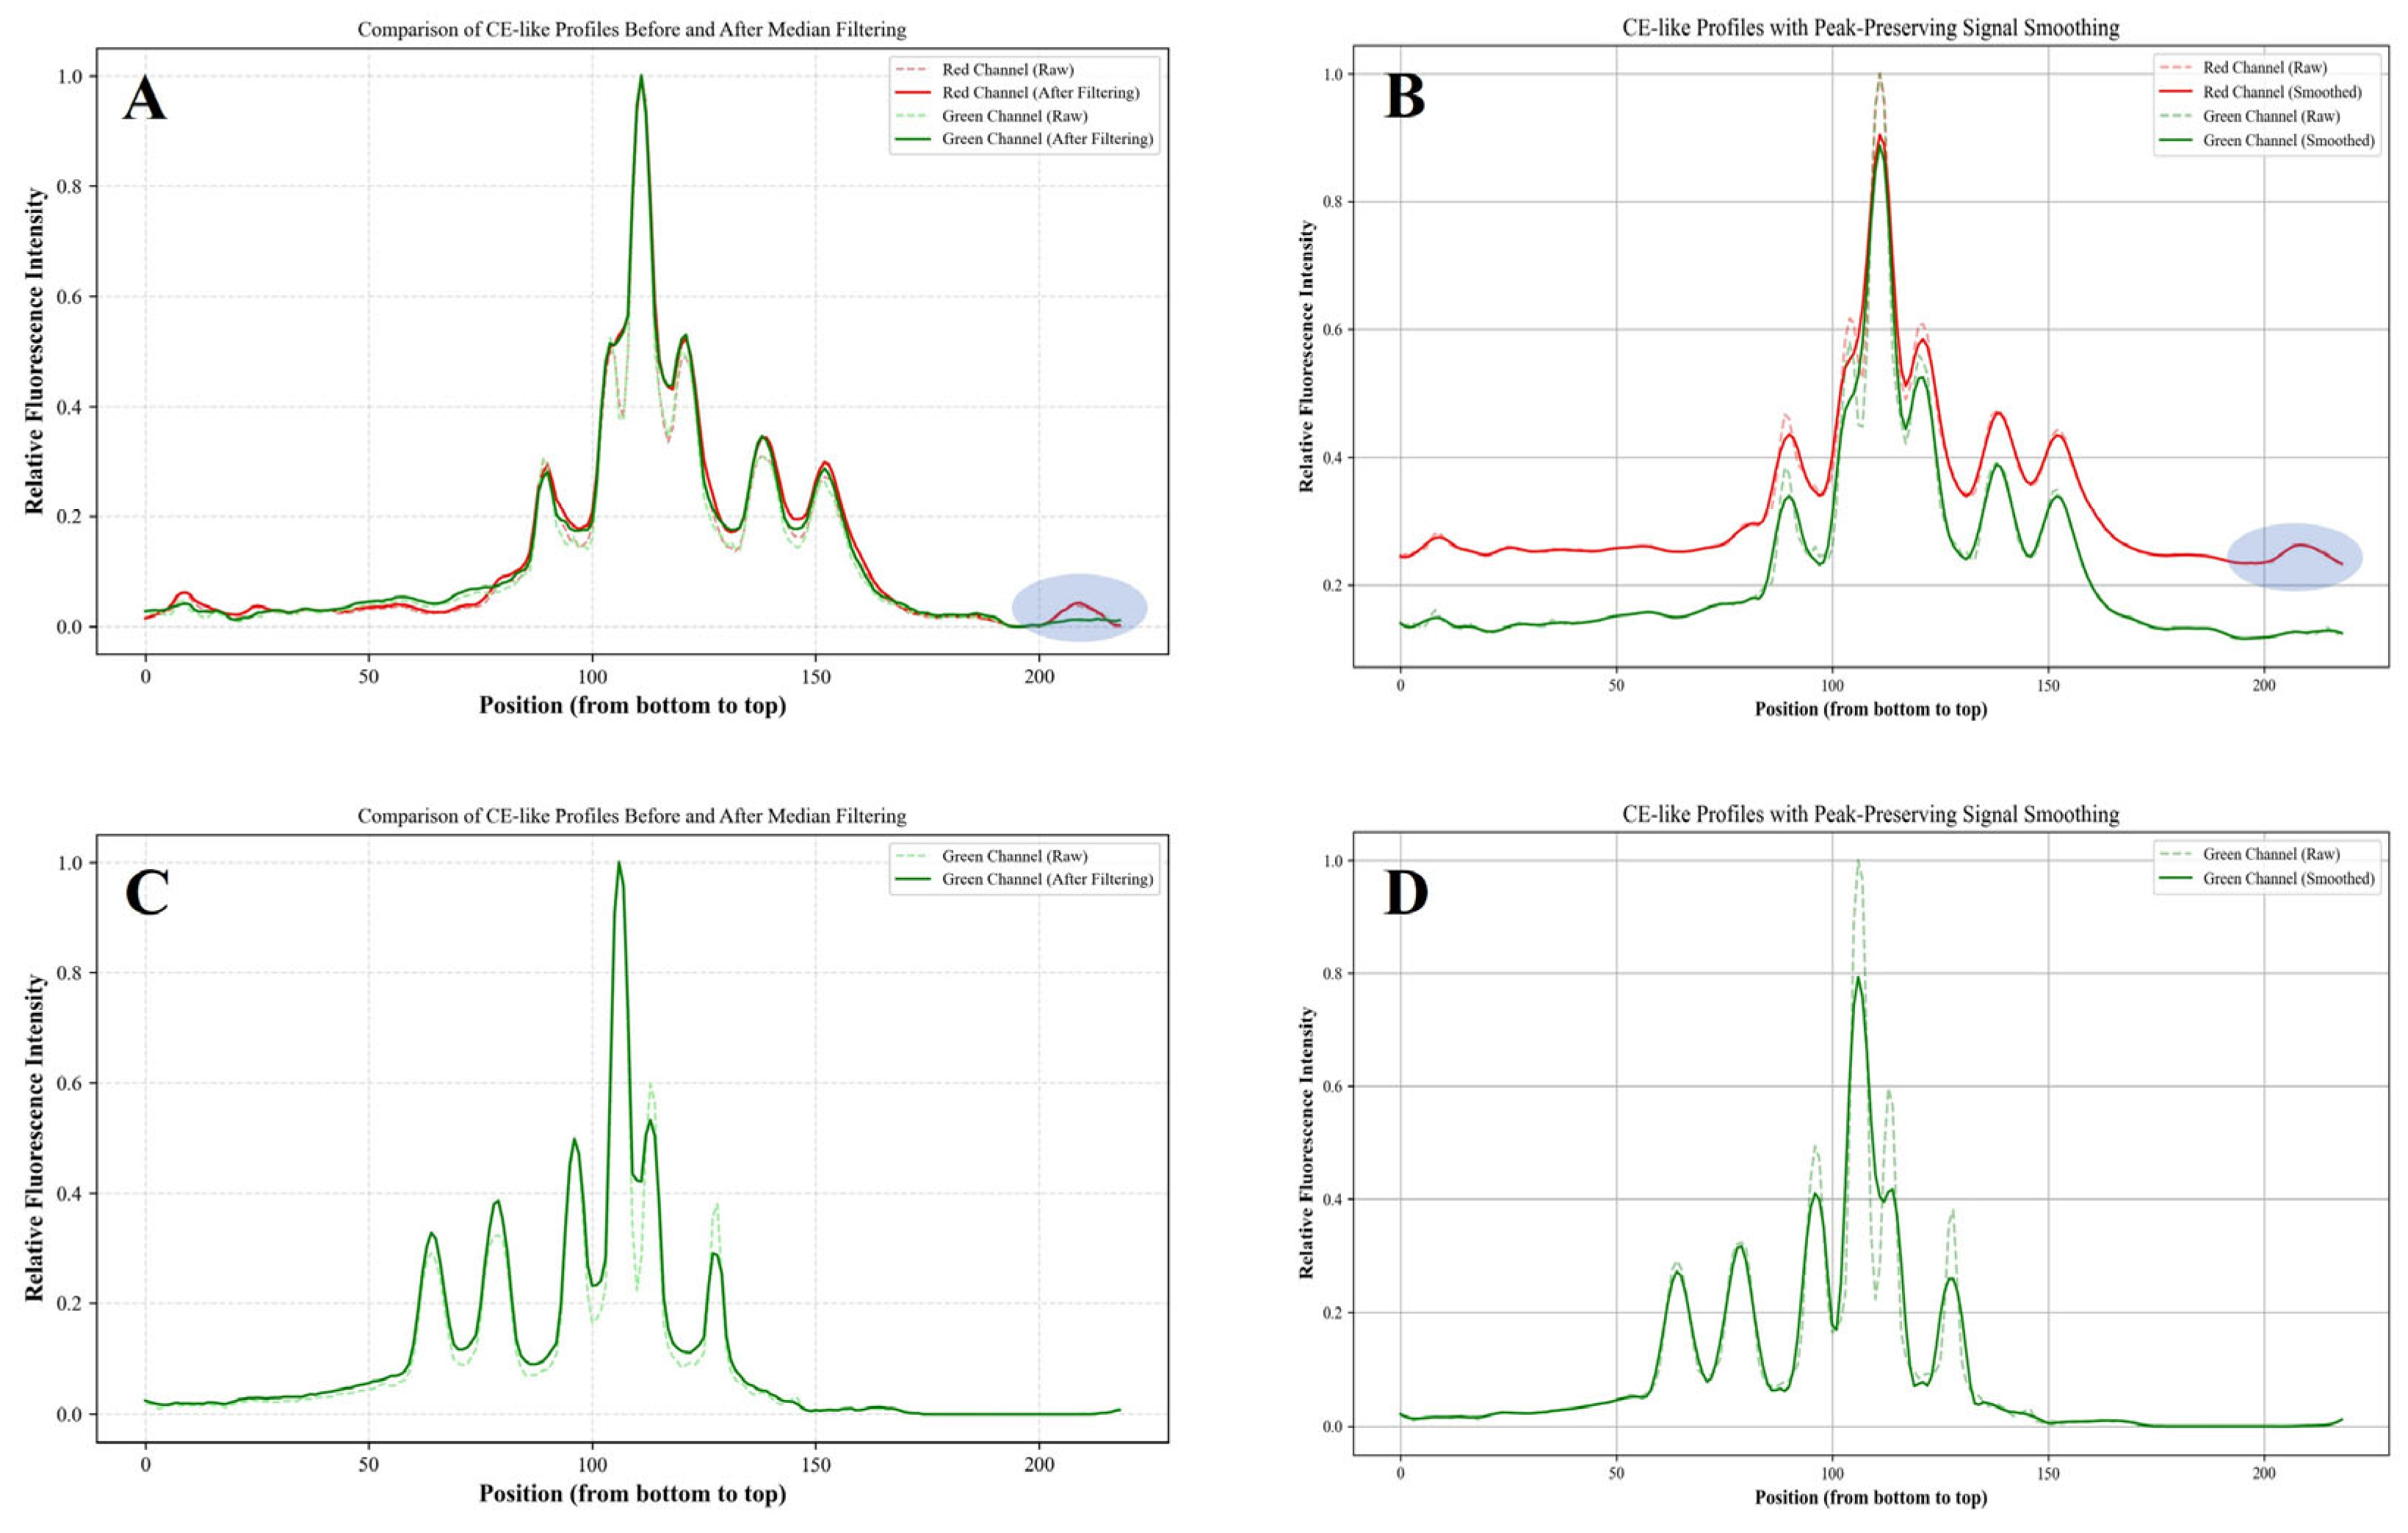
Figure 3 represents a transformation of a GE image into profiles similar to those generated by CE. The conversion was conducted using two key image processing techniques: median filtering and peak-preserving smoothing. These methods are supposed to reduce noise and improve the clarity of the electrophoresis profiles, particularly in the context of fluorescence-based intensity measurements. Data in Figure 3A showed the red and green channel profiles of the electrophoresis data before and after filtering. The red channel, in particular, presents an anomaly. A peak marked with ellipse that is not expected in the GE. This peak could potentially be caused by noise in the image data or artifact due to the imaging system. This unexpected peak is observed in both the raw and filtered profiles, suggesting that the median filtering method did not fully eliminate this artifact. Median filtering, while effective in removing small noise and smoothing the signal, might not be sufficient in eliminating large or sharp anomalies such as this false peak. The filtering process was intended to enhance the general trend of the electrophoresis profiles while retaining major peaks that signify biological or chemical events. However, the results show that this method fails to address the presence of the unknown peak in the red channel effectively. Thus, we selected the green channel for subsequent analysis.
While smoothing techniques like the Savitzky–Golay filter can help reduce smaller-scale noise [19], they may also cause a decline in resolution, particularly at peak boundaries (Figure 3B). The smoothed profiles (solid lines) are less sharp than the raw data (dashed lines), suggesting that smoothing can slightly blur the data, making it harder to discern minor variations or smaller peaks. This trade-off between noise reduction and peak resolution is a known challenge when working with signal smoothing methods. The decision to apply smoothing must therefore be balanced against the need for maintaining the sharpness and resolution of important features in the data.
Figure 3C,D represent the electrophoresis profiles of the green channel after background subtraction. Background subtraction aims to remove any consistent noise present in the image data, which may originate from sources such as the imaging system, ambient light, or other environmental factors. In this experiment, the green channel was selected for this method, as it likely provided a more accurate representation of the actual electrophoresis data, free from the noise affecting the red channel. By subtracting the background noise, the profiles in panels Figure 3C,D show a much cleaner signal with the major peaks clearly visible. Importantly, the unknown peak observed in the red channel is absent in the green channel data after background subtraction. This demonstrates the power of background subtraction in removing non-biological signals and improving the signal-to-noise ratio, especially in fluorescence-based measurements where the background noise can obscure true biological signals.
The contrast between the results shown in Figure 3A–D is striking. In A and B, despite median filtering, the raw signal still contains significant noise and the unwanted peak, affecting the clarity of the electrophoresis profile. On the other hand, C and D show profiles that are much cleaner and more consistent, with only the relevant electrophoretic peaks remaining. Background subtraction, however, does not suffer from this trade-off. By removing noise without altering the sharpness of the peaks, it preserves both the integrity of the signal and the high-resolution features in the electrophoresis profile. Therefore, when analyzing CE-like profiles, background subtraction should be considered a more reliable method for noise reduction and peak preservation, particularly in cases where the signal clarity is paramount.

3.3. Quantitative and Qualitative Insights into DNA Gel Electrophoresis Through Advanced Imaging Techniques

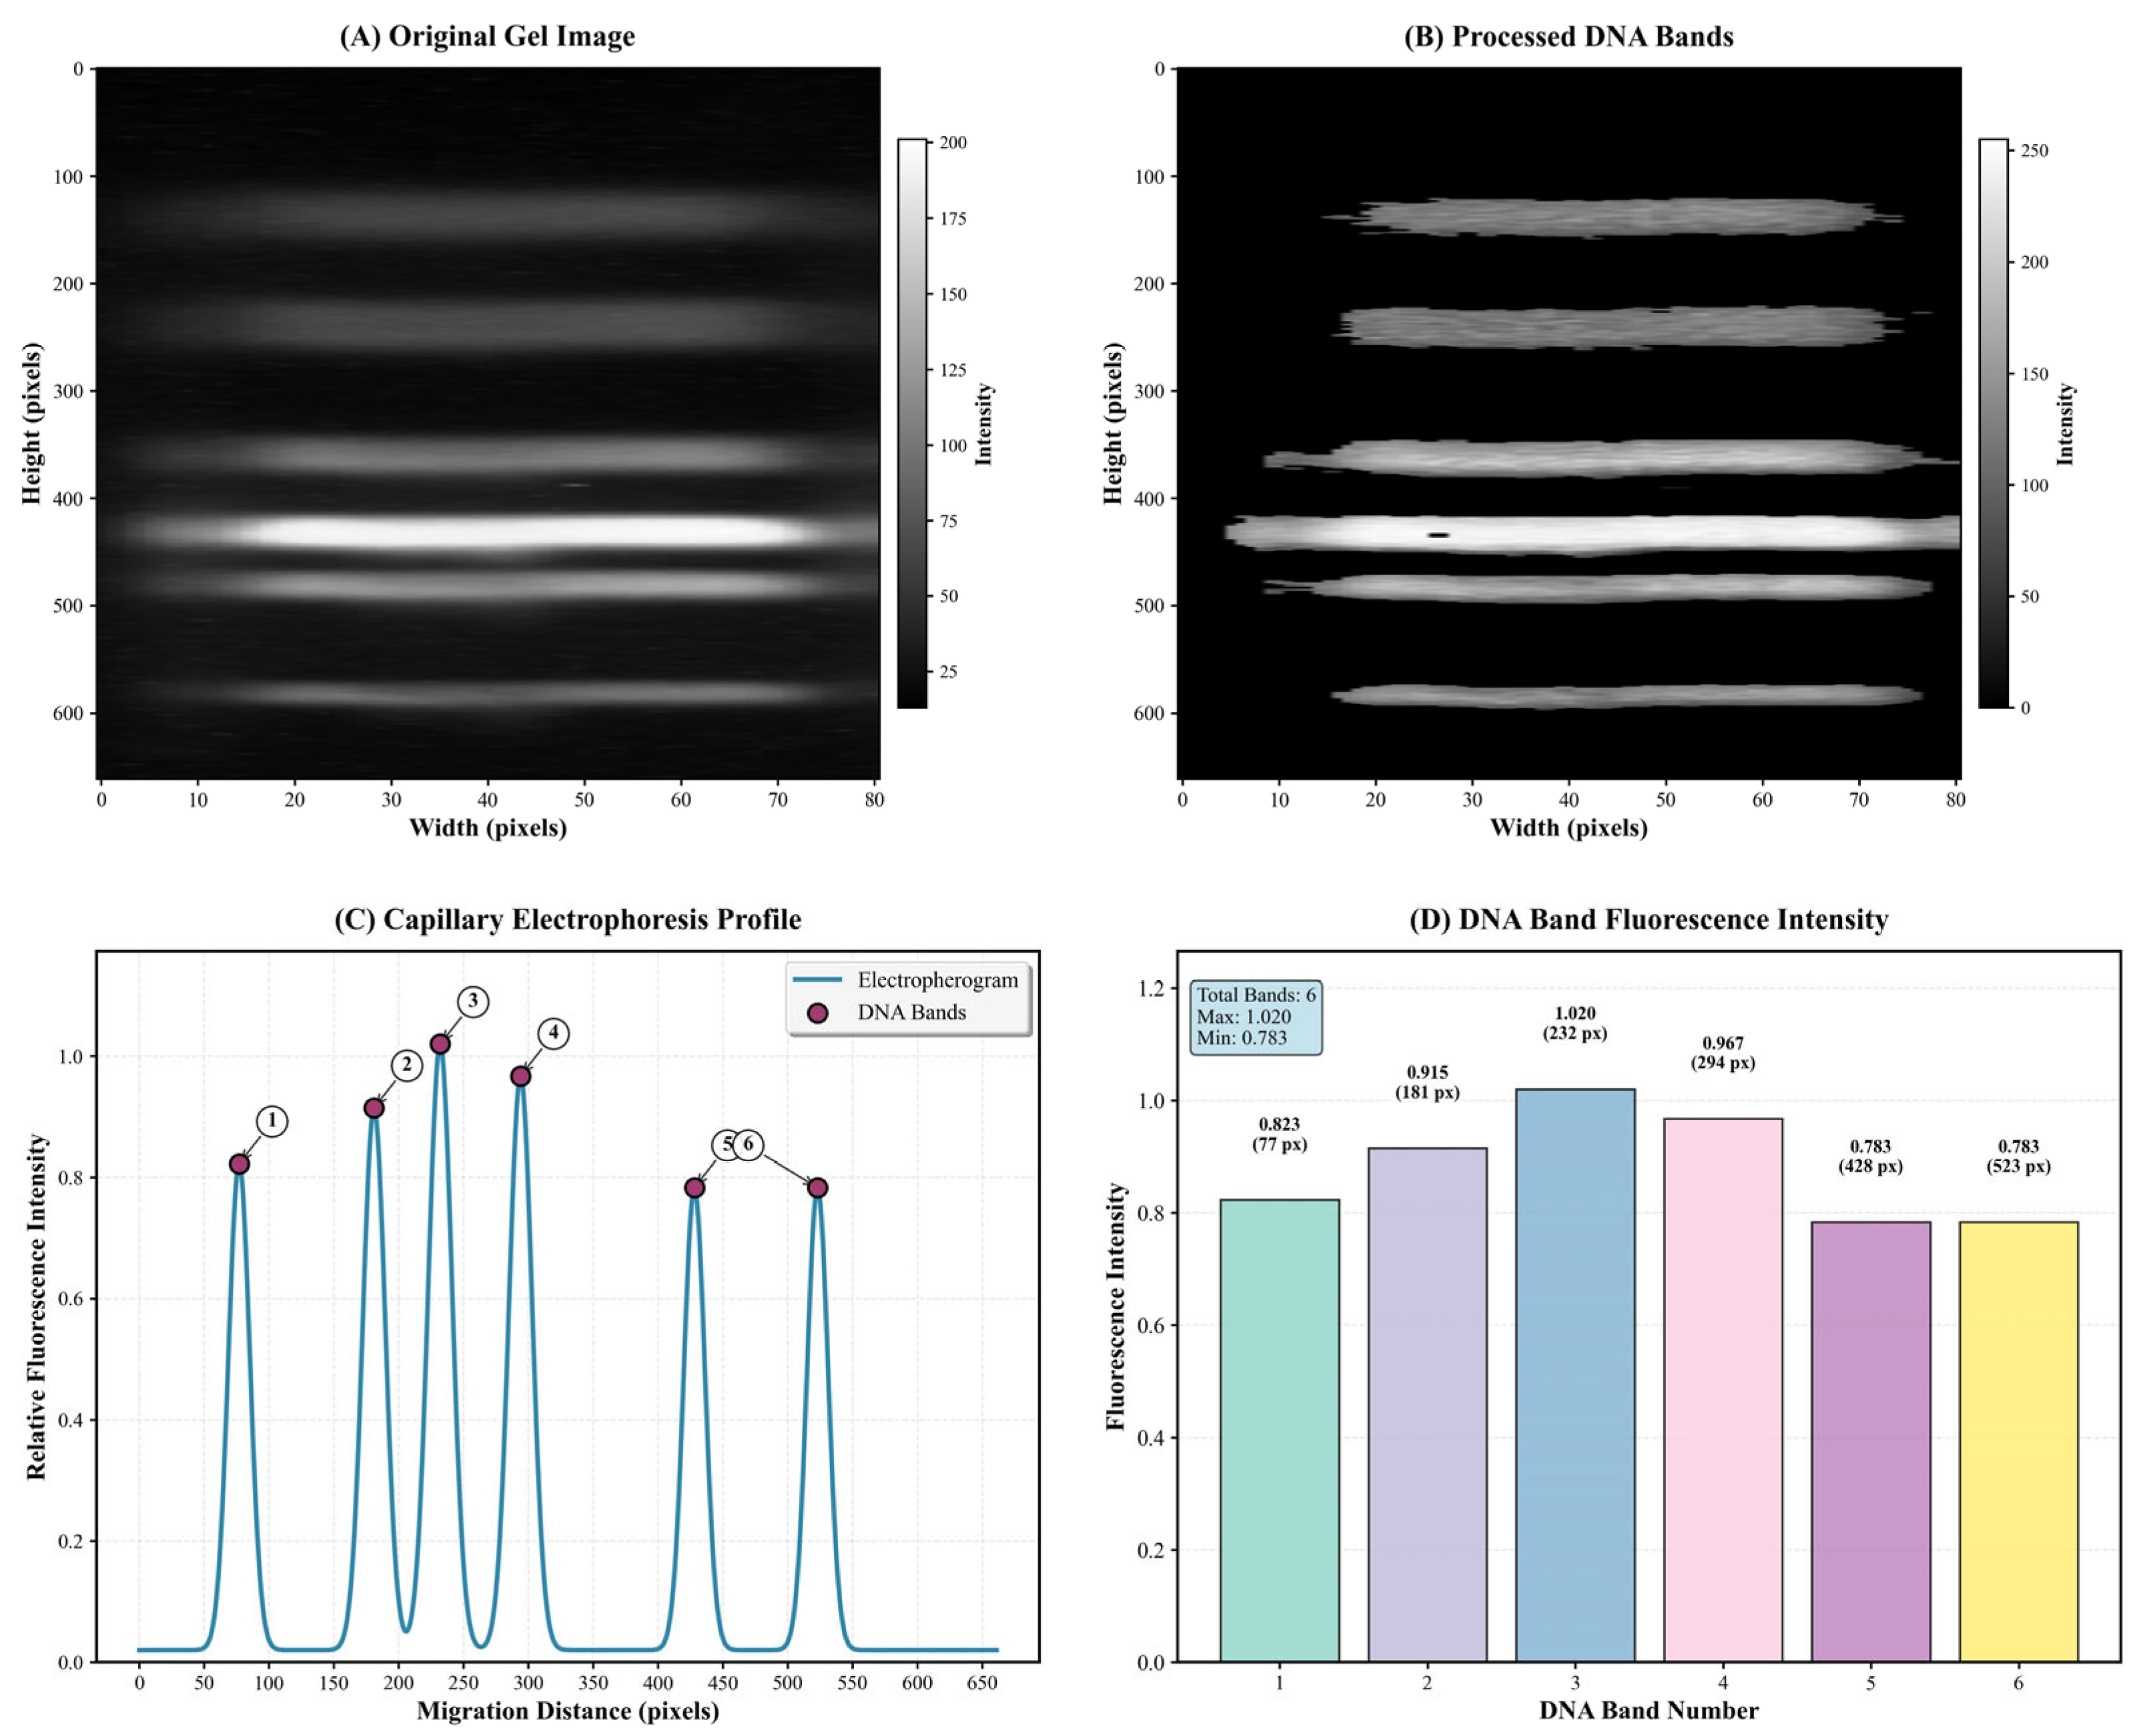
While GE image provides a general overview of the gel, it lacks sufficient contrast and resolution for precise analysis. To extract meaningful quantitative information (e.g., the size distribution and relative abundance of DNA fragments) from the gel images. We employed image enhancement, DNA band isolation, peak detection, and the creation of CE profiles to realize semi-quantitative analysis of DNA by GE. Figure 4A shows the original cropped gel image in grayscale. It serves as the baseline for all subsequent processing. The DNA bands, which appear as dark vertical stripes on the gel, are the primary focus of the analysis. The ability to select a specific ROI is crucial, as it ensures that only the area containing relevant DNA bands is processed. This step minimizes the risk of including extraneous data that could lead to erroneous results. Figure 4B presents the image after a series of image processing steps, which include contrast limited adaptive histogram equalization, sharpening, and Gaussian blur. These steps significantly improve the contrast between the DNA bands and the background, making the bands more distinct and easier to detect. Contrast limited adaptive histogram equalization, in particular, enhances local contrast and ensures that subtle variations in intensity are captured, even in regions with low signal-to-noise ratios. The sharpened image highlights the DNA bands, which are then extracted using a binary mask. Morphological operations—such as opening and closing—help to refine the mask, removing any small noise and ensuring that only the bands of interest remain. This clean, processed image forms the foundation for the subsequent steps of peak detection and intensity profiling. By isolating the DNA bands from the rest of the gel, we avoid including irrelevant background noise in the analysis, ensuring that only the true bands are considered when calculating the intensity profile. Figure 4C presented the CE profile, derived from the intensity profile of the gel. In this profile, the x-axis represents the migration distance (in pixels), while the y-axis represents the relative fluorescence intensity of each position along the gel. The intensity of each pixel is summed along the gel’s width to generate this profile, and the peaks in the profile correspond to the positions of the DNA bands. The CE profile is critical for understanding the migration behavior of DNA fragments. The peaks detected in this profile correspond to the separation of DNA fragments based on size: smaller fragments migrate faster, while larger fragments move slower. The resolution of these peaks is essential for accurate identification of DNA bands, especially when the bands are closely spaced. To detect the peaks, we applied a peak resolution method. It identifies local maxima in the smoothed intensity profile, with adjustable parameters for prominence, distance, and width to fine-tune peak detection. The prominence ratio, which is set at 0.08 in the script, ensures that only prominent peaks—those that represent true DNA bands—are detected, filtering out noise and minimizing false positives. The smoothed intensity profile provides a clearer representation of the DNA separation, and the detected peaks accurately represent the positions and intensities of the bands in the gel.
Figure 4D provides a bar chart displaying the fluorescence intensity of the detected DNA bands. Each bar represents a detected band, with the height of the bar corresponding to the relative intensity of the band. The chart offers a quantitative assessment of the DNA band intensities, which is important for comparing the relative abundance of different DNA fragments. The chart also includes detailed statistical information about the detected bands, such as the total number of bands, the maximum and minimum intensities, and their corresponding positions. The data presented in this bar chart are invaluable for downstream analysis, allowing researchers to assess the relative abundance of DNA fragments in a sample and compare the intensities of different bands. This information can be used to quantify DNA concentration or to compare the results across different experimental conditions where accuracy and precision are paramount.

3.4. Application of the Self-Built Algorithm

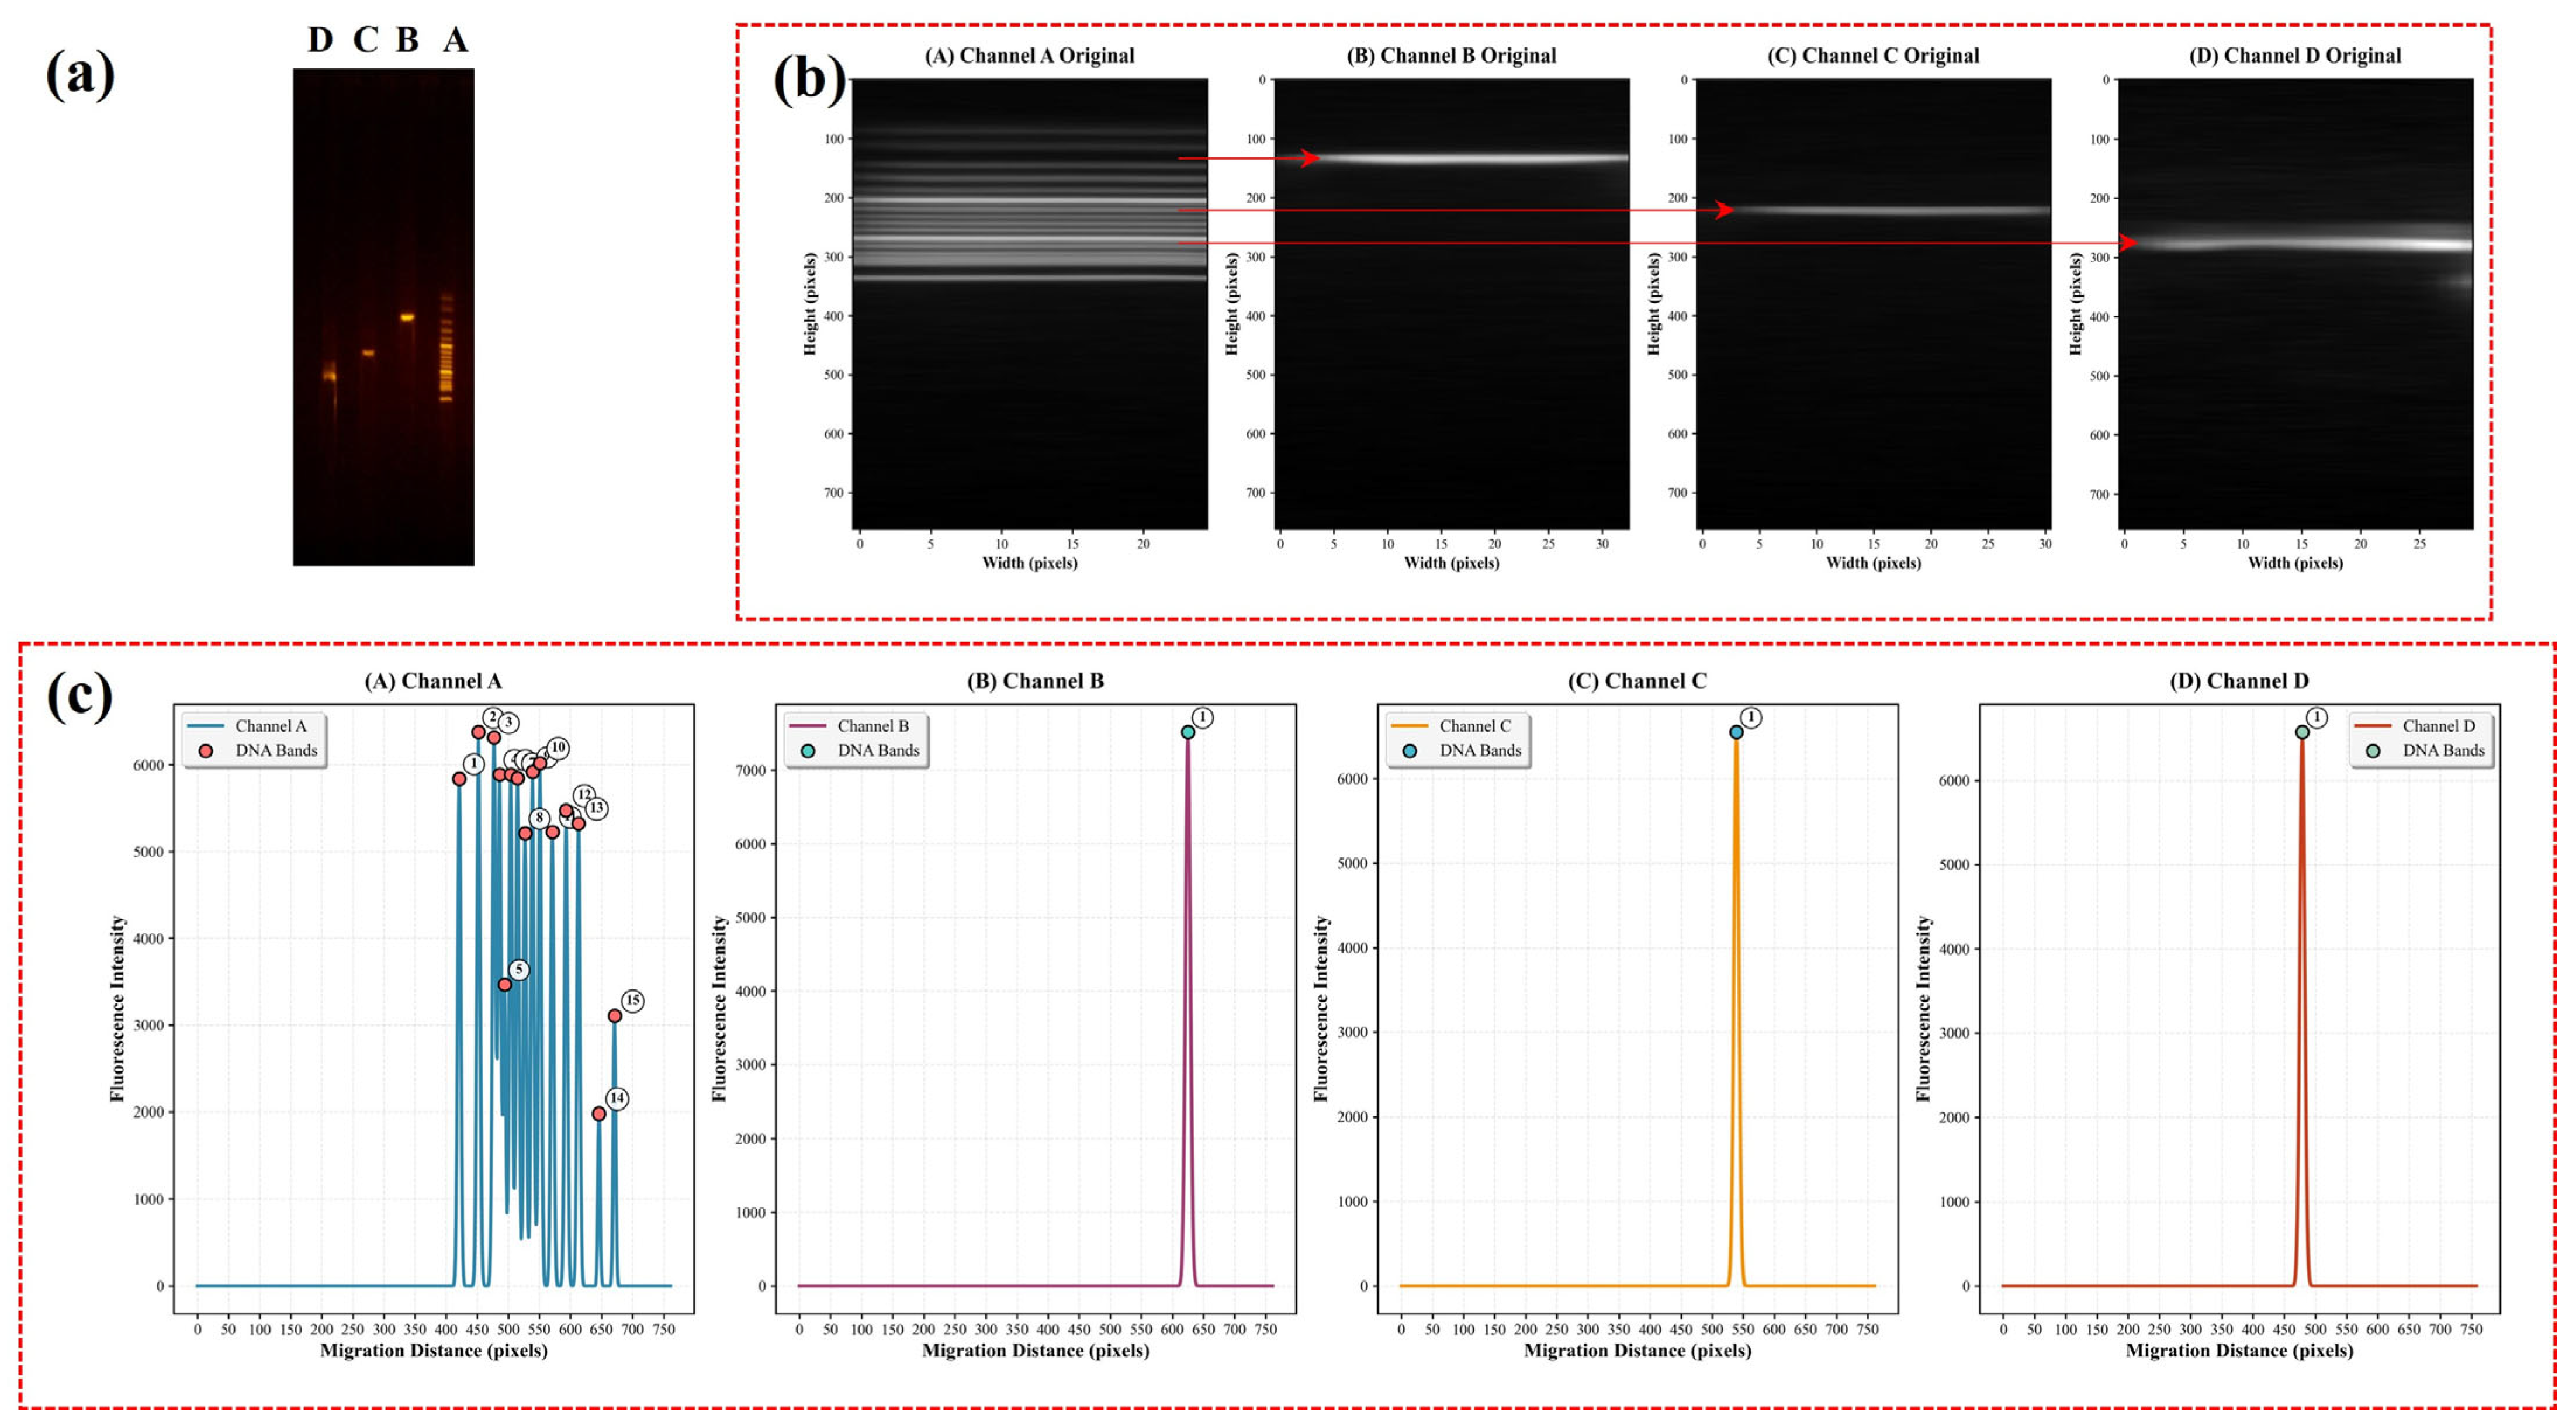
To validate our methods for transformation from a GE image to a CE-like profile, we have carried out the GE of three periodontal pathogens—Porphyromonas gingivalis (P.g), Treponema denticola (T.d), and Tannerella forsythia (T.f)—following PCR amplification. Figure 5a shows the agarose GE image, in which the four channels, from left to right, correspond to T.f, T.d, P.g, and the 50 bp DNA ladder, respectively. The distinct bright bands observed in each lane confirm successful amplification of the target fragments. The band patterns of the three bacteria differ in position and intensity, reflecting differences in amplicon length and fluorescence concentration. Figure 5b illustrates the processed electrophoretic images obtained through image analysis algorithms. The algorithm extracts and enhances the fluorescence intensity distribution of each channel, converting the 2D band image into a 1D grayscale representation. Channels A–D correspond, respectively, to the 50 bp DNA ladder, P.g, T.d, and T.f. Through filtering and normalization, the signal-to-noise ratio of each electrophoretic channel is significantly improved, enabling clearer differentiation of DNA bands. The ladder channel (A) shows a series of regularly spaced horizontal bands, consistent with the expected fragment intervals of 50 bp increments. The other three bacterial channels exhibit single, high-intensity bands, indicating that each PCR reaction yielded a specific and unique amplicon without non-specific amplification or primer-dimer formation.
Figure 5c further converts these processed images into CE-like fluorescence profiles by summing pixel intensity across each row. This transformation enables quantitative analysis of DNA migration and relative fluorescence intensity. Each curve exhibits a single dominant peak, representing the main DNA fragment. The ladder channel shows multiple evenly distributed peaks, corresponding to the DNA marker bands and validating the accuracy of electrophoretic separation and image extraction. The peak positions of P.g, T.d, and T.f occur at different migration distances, reflecting variations in DNA fragment length. These differences are consistent with the expected base-pair lengths determined from PCR design, supporting the specificity of amplification and subsequent separation.
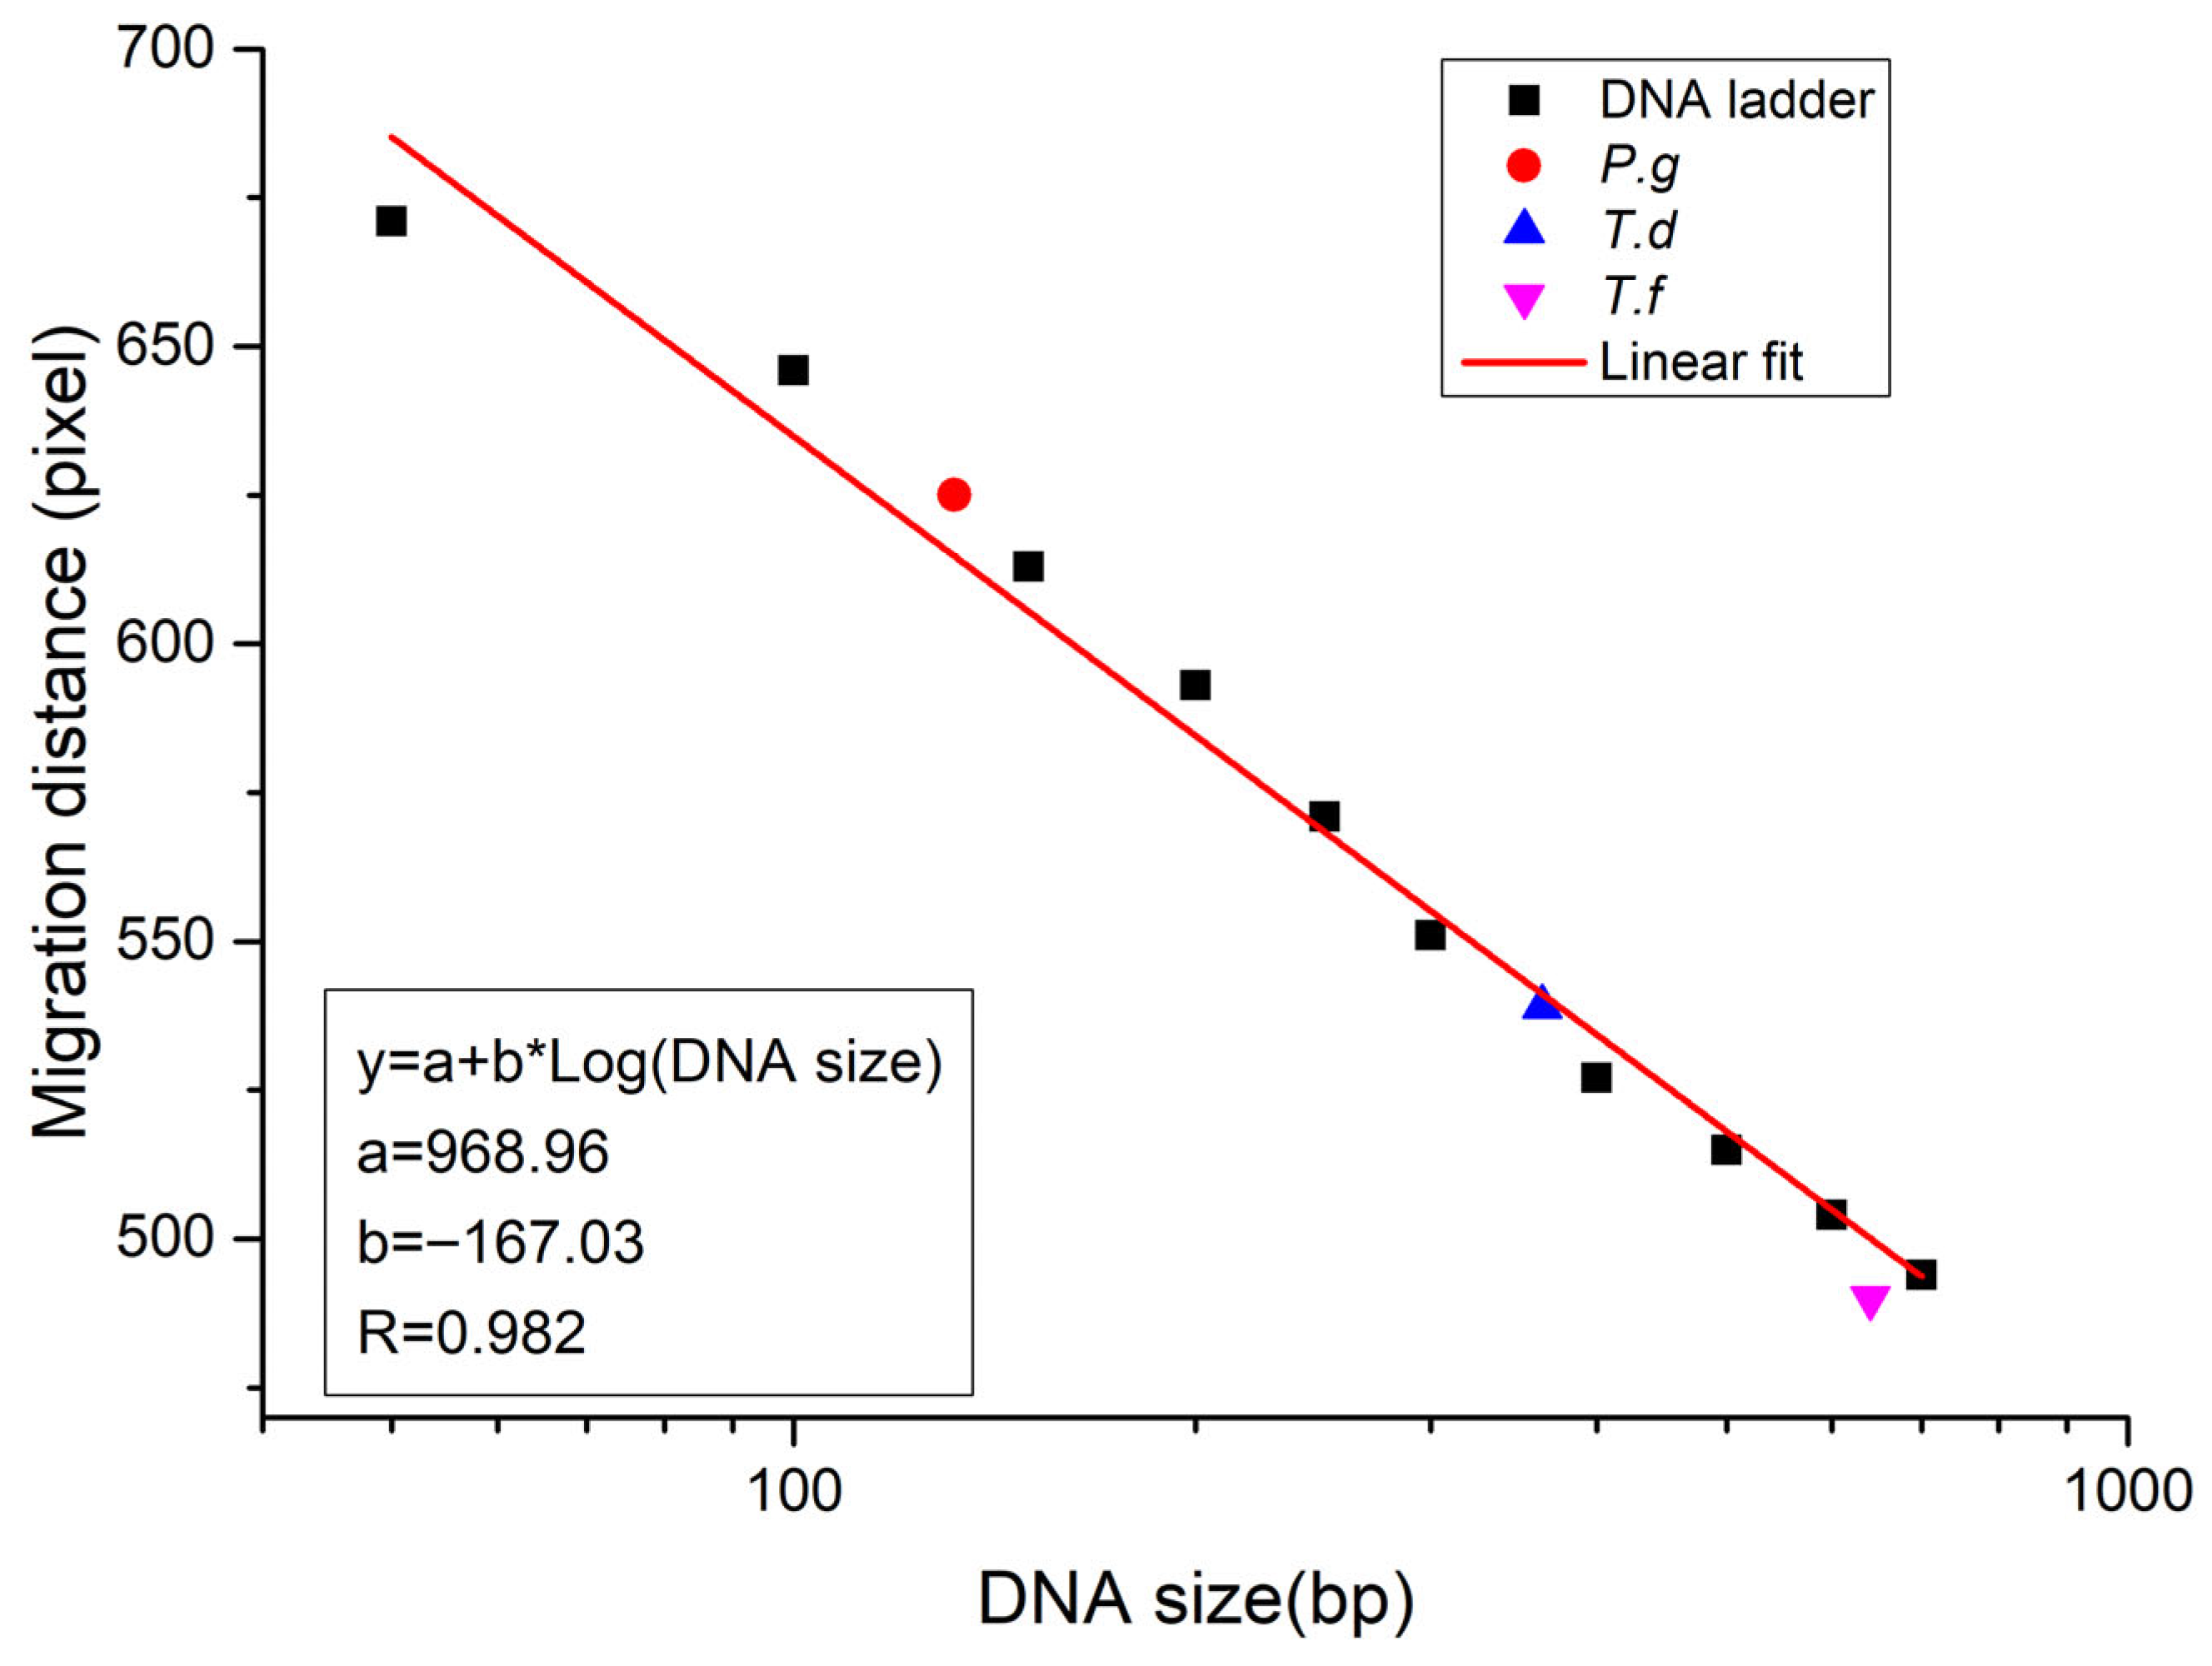
Furthermore, we also employed formula (1) to evaluate the estimated size of the amplicon, and the result is shown in Figure 6. It demonstrated that the migration distance was linearly related with the logarithmic value of DNA size. The correlation coefficient was about 0.982, and the amplicon was around the linear fitting line. The relative fluorescence intensity calculated from Figure 5c(B–D) was about 7517, 6550 and 6572, respectively. They are corresponding to the PCR products of P.g, T.d, and T.f. They can be used to evaluate the concentration by comparing the value with DNA ladders.

4. Conclusions

Compared with CE, GE is a traditional method for the analysis of nucleic acids because of its low cost, although the operation process is complicated. The electropherogram from CE can offer more information for the researchers, thus we proposed a method to transfer the GE image to CE-like profiles. The CE-like profiles generated from image data offer advantages over traditional gel interpretation. By converting the spatial information of electrophoretic bands into intensity plots, the method allows for digital quantification of fluorescence and more accurate comparison of molecular migration distances. Furthermore, the use of Gaussian enhancement functions to model peak profiles effectively improves resolution and differentiates closely migrating DNA fragments. This computational approach bridges the gap between classical slab GE and modern CE, enabling a semi-quantitative evaluation of electrophoretic behavior without specialized CE instrument. In summary, the integrated process of GE imaging, algorithmic extraction, and CE-like spectral reconstruction demonstrates a robust analytical framework for the separation of DNA, RNA, proteins, and polypeptides. The distinct, well-resolved peaks corresponding to P.g, T.d, and T.f confirm the high specificity and clarity of the method. This approach not only provides visual evidence of successful amplification but also quantitatively characterizes fluorescence intensity distributions, making it a valuable tool for molecular diagnostics and comparative microbial analysis. The consistency between the ladder calibration and bacterial peak positions further validates the reliability of the proposed image-based electrophoretic analysis technique.

Supplementary Materials

The following supporting information can be downloaded at: https://www.mdpi.com/article/10.3390/separations12110296/s1, Figure S1: The transmission rate of the optical filter OFb; Figure S2: The transmission rate of the optical filter OFa; Table S1: The primers.

Author Contributions

Conceptualization, Z.L. and Y.Y.; methodology, J.Y. and Z.L.; software, T.Z. and J.L.; validation, B.Y., J.L. and T.Z.; formal analysis, T.Z. and J.L.; investigation, B.Y. and J.L.; resources, Z.L. and J.Y.; data curation, B.Y. and Y.Y.; writing—original draft preparation, J.Y. and Z.L.; writing—review and editing, B.Y., Y.Y. and T.Z.; visualization, J.L.; supervision, J.Y.; project administration, Y.Y.; funding acquisition, J.Y. All authors have read and agreed to the published version of the manuscript.

Funding

This research was funded by the Natural Science Research Project of Anhui Sanlian University, grant number KJZD2025004; the Intelligent Information Processing & Application Innovation Team of Anhui Sanlian University, grant number XJTD2025002; and the Quality Engineering Project of Anhui Provincial Department of Education, grant number 2023jyxm0891.

Data Availability Statement

The raw data supporting the conclusions of this article will be made available by the authors on request.

Conflicts of Interest

The authors declare no conflicts of interest.

References

  1. Kachwala, M.J.; Smith, C.W.; Nandu, N.; Yigit, M.V. Reprogrammable gel electrophoresis detection assay using CRISPR-Cas12a and hybridization chain reaction. Anal. Chem. 2021, 93, 1934–1938. [Google Scholar] [CrossRef] [PubMed]
  2. Al-Shuhaib, M.B.S.; Hashim, H.O. Mastering DNA chromatogram analysis in Sanger sequencing for reliable clinical analysis. J. Genet. Eng. Biotechnol. 2023, 21, 115. [Google Scholar] [CrossRef] [PubMed]
  3. Howarth, A.; Drummond, B.; Wasef, S.; Matheson, C.D. An assessment of DNA extraction methods from blood-stained soil in forensic science. Forensic Sci. Int. 2022, 341, 111502. [Google Scholar] [CrossRef] [PubMed]
  4. Gritti, F.; Sawyer, K.; Vaishnav, J.; Addepali, B.; Lauber, M.; Wyndham, K. Retention and efficiency of a novel slalom chromatography column: An alternative to agarose gel electrophoresis for DNA separation. J. Chromatogr. A 2025, 1761, 466293. [Google Scholar] [CrossRef] [PubMed]
  5. Dangerfield, T.L.; Huang, N.Z.; Johnson, K.A. High throughput quantification of short nucleic acid samples by capillary electrophoresis with automated data processing. Anal. Biochem. 2021, 629, 114239. [Google Scholar] [CrossRef] [PubMed]
  6. Bawane, H.; Kadam, K.; Mahale, V.; Kulkarni, R. Comprehensive assessment of 12 commercial DNA-binding dyes as alternatives to ethidium bromide for agarose gel electrophoresis. Electrophoresis 2024, 45, 442–450. [Google Scholar] [CrossRef] [PubMed]
  7. Halder, S.; Sanchez, A.; Ranjha, L.; Reginato, G.; Ceppi, I.; Acharya, A.; Anand, R.; Cejka, P. Double-stranded DNA binding function of RAD51 in DNA protection and its regulation by BRCA2. Mol. Cell 2022, 82, 3553–3565.e5. [Google Scholar] [CrossRef] [PubMed]
  8. Li, Z.; Chen, S.; Liu, C.; Zhang, D.; Dou, X.; Yamaguchi, Y. Quantification of periodontal pathogens cell counts by capillary electrophoresis. J. Chromatogr. A 2014, 1361, 286–290. [Google Scholar] [CrossRef] [PubMed]
  9. Li, Z.; Huang, J.; Yang, B.; You, Q.; Sekine, S.; Zhang, D.; Yamaguchi, Y. Miniaturized Gel electrophoresis system for fast separation of nucleic acids. Sens. Actuators B Chem. 2018, 254, 153–158. [Google Scholar] [CrossRef]
  10. Wheelock, Å.M.; Buckpitt, A.R. Software-induced variance in two-dimensional gel electrophoresis image analysis. Electrophoresis 2005, 26, 4508–4520. [Google Scholar] [CrossRef] [PubMed]
  11. Khakabimamaghani, S.; Najafi, A.; Ranjbar, R.; Raam, M. GelClust: A software tool for gel electrophoresis images analysis and dendrogram generation. Comput. Methods Programs Biomed. 2013, 111, 512–518. [Google Scholar] [CrossRef] [PubMed]
  12. Intarapanich, A.; Kaewkamnerd, S.; Shaw, P.J.; Ukosakit, K.; Tragoonrung, S.; Tongsima, S. Automatic DNA diagnosis for 1D gel electrophoresis images using bio-image processing technique. BMC Genom. 2015, 16, S15. [Google Scholar] [CrossRef] [PubMed]
  13. Dragan, A.; Pavlovic, R.; McGivney, J.; Casas-Finet, J.; Bishop, E.; Strouse, R.; Schenerman, M.; Geddes, C. SYBR Green I: Fluorescence properties and interaction with DNA. J. Fluoresc. 2012, 22, 1189–1199. [Google Scholar] [CrossRef] [PubMed]
  14. Van Winkle, D.H.; Beheshti, A.; Rill, R.L. DNA electrophoresis in agarose gels: A simple relation describing the length dependence of mobility. Electrophoresis 2002, 23, 15–19. [Google Scholar] [CrossRef]
  15. Maniatis, T.; Jeffrey, A.; Van deSande, H. Chain length determination of small double-and single-stranded DNA molecules by polyacrylamide gel electrophoresis. Biochemistry 1975, 14, 3787–3794. [Google Scholar] [CrossRef] [PubMed]
  16. Sambrook, J.; Russell, D. Molecular Cloning: A Laboratory Manual; Cold Spring Harbor Laboratory Press: Cold Spring Harbor, NY, USA, 2001; Volume 3, pp. A2.2–A2.4. [Google Scholar]
  17. García-Alvarez-Coque, M.C.; Simó-Alfonso, E.F.; Sanchis-Mallols, J.M.; Baeza-Baeza, J.J. A new mathematical function for describing electrophoretic peaks. Electrophoresis 2005, 26, 2076–2085. [Google Scholar] [CrossRef] [PubMed]
  18. Zhou, G.; Xu, Q.; Liu, X.; Wang, K. Quantitative Analysis of Chondroitin Sulfate and Dermatan Sulfate Using Capillary Electrophoresis With Gaussian Distribution-Based Peak Fitting for Improved Peak Resolution. Sep. Sci. Plus 2024, 7, e202300244. [Google Scholar] [CrossRef]
  19. Liu, Y.; Dang, B.; Li, Y.; Lin, H.; Ma, H. Applications of Savitzky-Golay filter for seismic random noise reduction. Acta Geophys. 2016, 64, 101–124. [Google Scholar] [CrossRef]
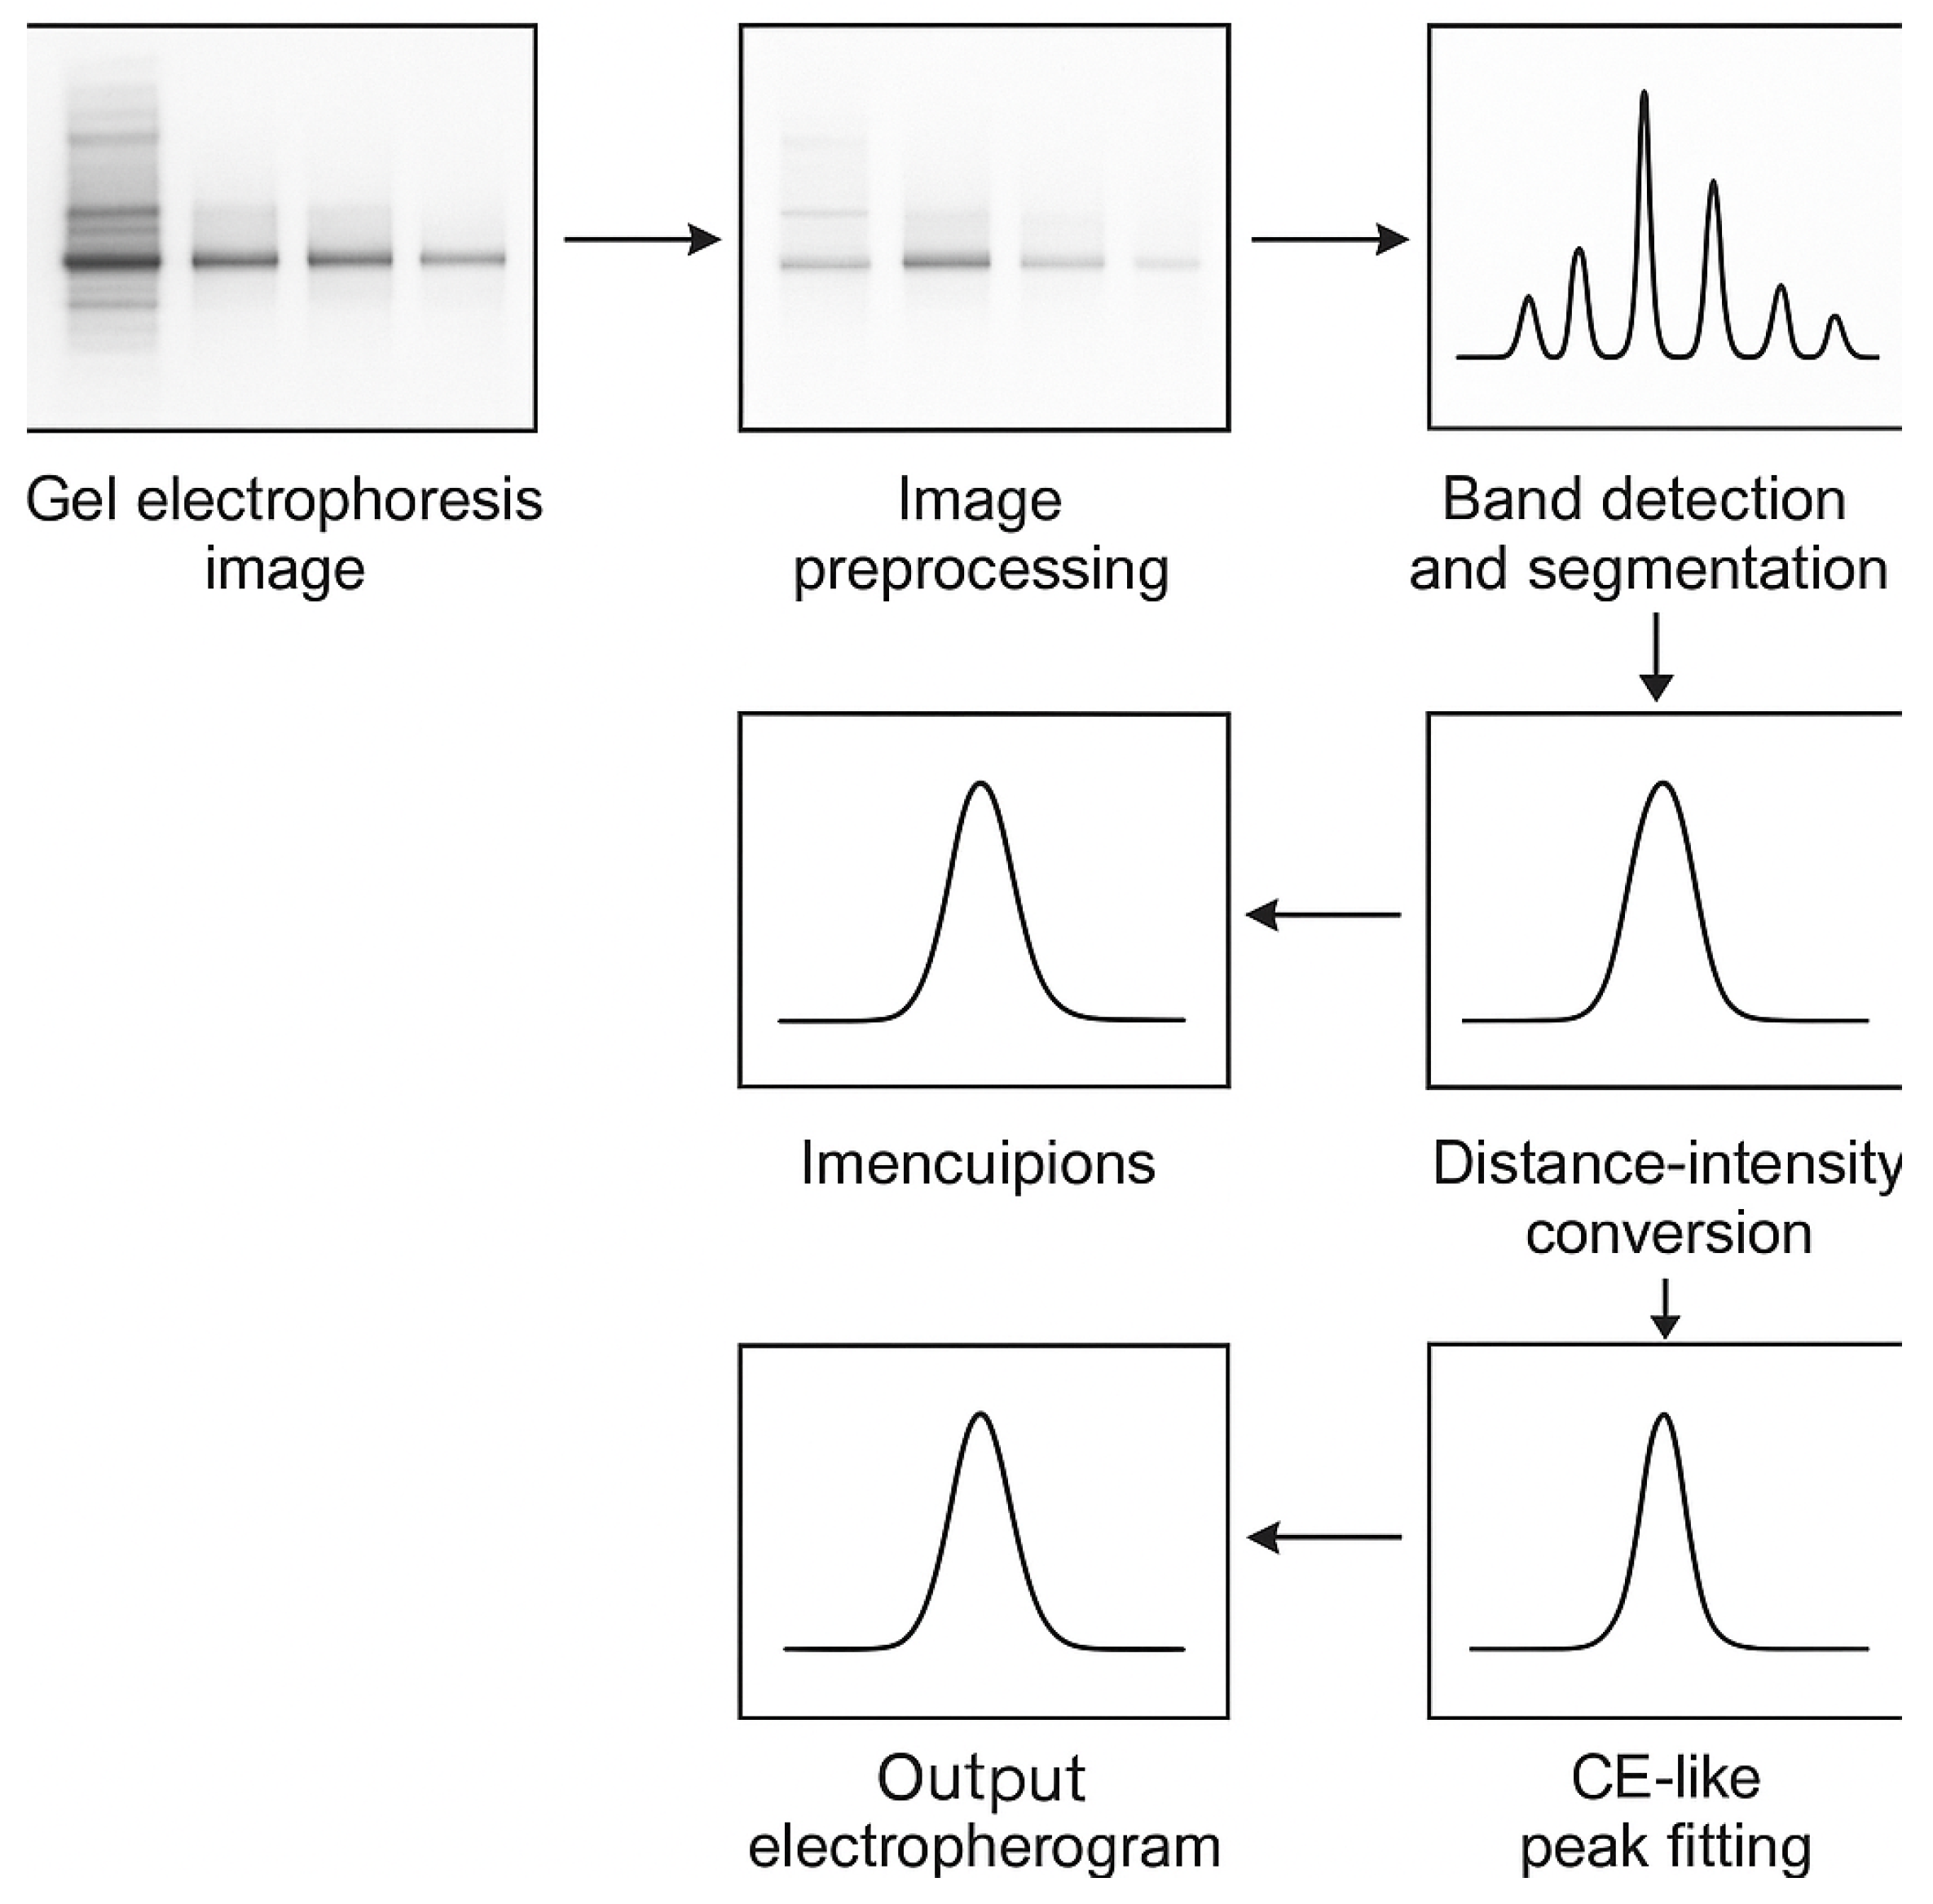
Figure 1. Workflow of gel electrophoresis image processing and conversion to CE-like electropherogram.
Separations 12 00296 g001
Figure 2. RGB channel decomposition and fluorescence intensity distribution of a SYBR Green I–stained DNA electrophoresis gel: (A) The histogram shows normalized pixel intensities across channels, revealing the dominance of green fluorescence consistent with SYBR Green I emission characteristics; (B) the original image was separated into red (C), green (D), and blue (E) channels to analyze fluorescence signal contributions.
Separations 12 00296 g002
Figure 3. A comparison of GE and CE-like profiles. The figure illustrates the comparison between standard GE and simulated CE-like profiles. The CE-like profiles were obtained from the red (A,B) and green (C,D) channels, which were processed by median filtering (A,C) and signal smoothing (B,D). A peak marked with ellipse that is not expected in the GE.
Separations 12 00296 g003
Figure 4. High-resolution electropherogram of DNA separation and quantification: (A) original gel image; (B) processed DNA bands; (C) capillary electrophoresis-like profile; (D) fluorescence intensity of DNA bands. 1–6 in (C) corresponds to the bands in (A) from bottom to top.
Separations 12 00296 g004
Figure 5. Generation of CE-like profiles from GE of amplified periodontal pathogens. (a) Original GE image. (b) Same image after digital processing. (c) Final CE-like electropherogram derived from processed image. 1–15 in (c-A) corresponds to the bands in (a-A) from bottom to top.
Separations 12 00296 g005
Figure 6. Evaluation of DNA size for PCR products through CE-like profile. * means multiplication (×).
Separations 12 00296 g006
Disclaimer/Publisher’s Note: The statements, opinions and data contained in all publications are solely those of the individual author(s) and contributor(s) and not of MDPI and/or the editor(s). MDPI and/or the editor(s) disclaim responsibility for any injury to people or property resulting from any ideas, methods, instructions or products referred to in the content.