Author Contributions
Conceptualization, J.J.E.; methodology, C.R.A.; software, C.R.A.; validation, E.A.O. and J.J.E.; formal analysis, C.R.A.; investigation, C.R.A.; resources, C.R.A.; data curation, C.R.A.; writing—original draft preparation, C.R.A.; writing—review and editing, C.R.A., E.A.O., G.A.B., C.C.B. and J.J.E.; visualization, C.R.A.; supervision, E.A.O., G.A.B., C.C.B. and J.J.E.; All authors have read and agreed to the published version of the manuscript.
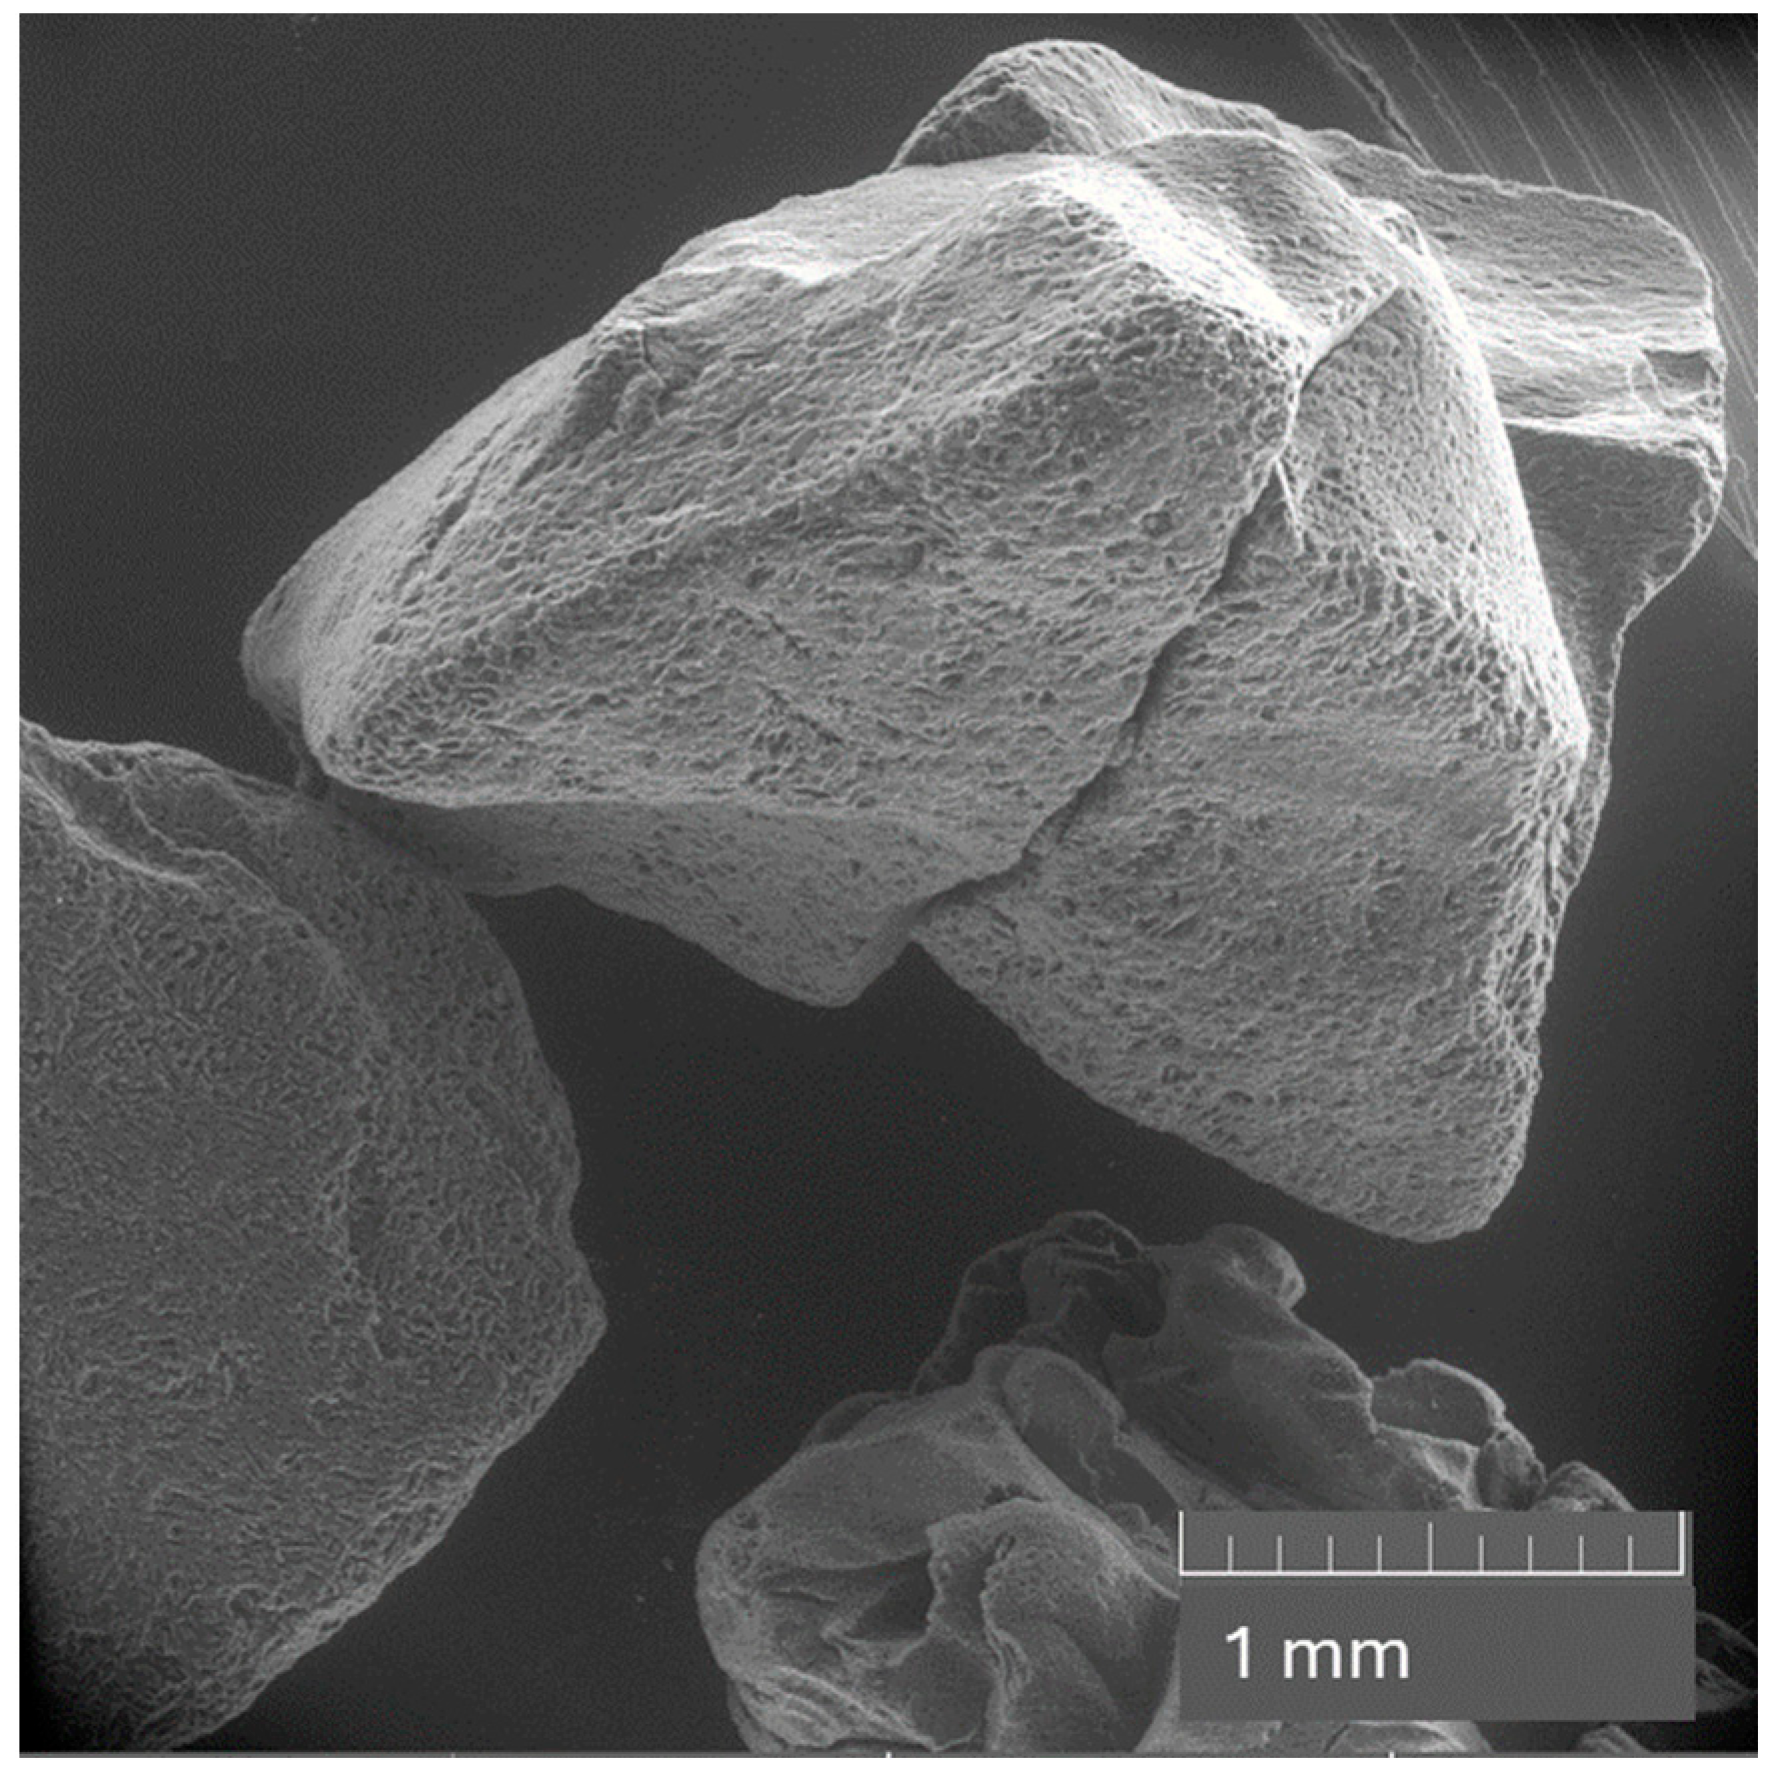
Figure 1.
Scanning Electron Microscope (SEM) picture of the fresh activated carbon (Haycarb YAO 60).
Figure 1.
Scanning Electron Microscope (SEM) picture of the fresh activated carbon (Haycarb YAO 60).
Figure 2.
Scheme showing the quality program QAQC designed to monitor the process and samples reproducibility.
Figure 2.
Scheme showing the quality program QAQC designed to monitor the process and samples reproducibility.
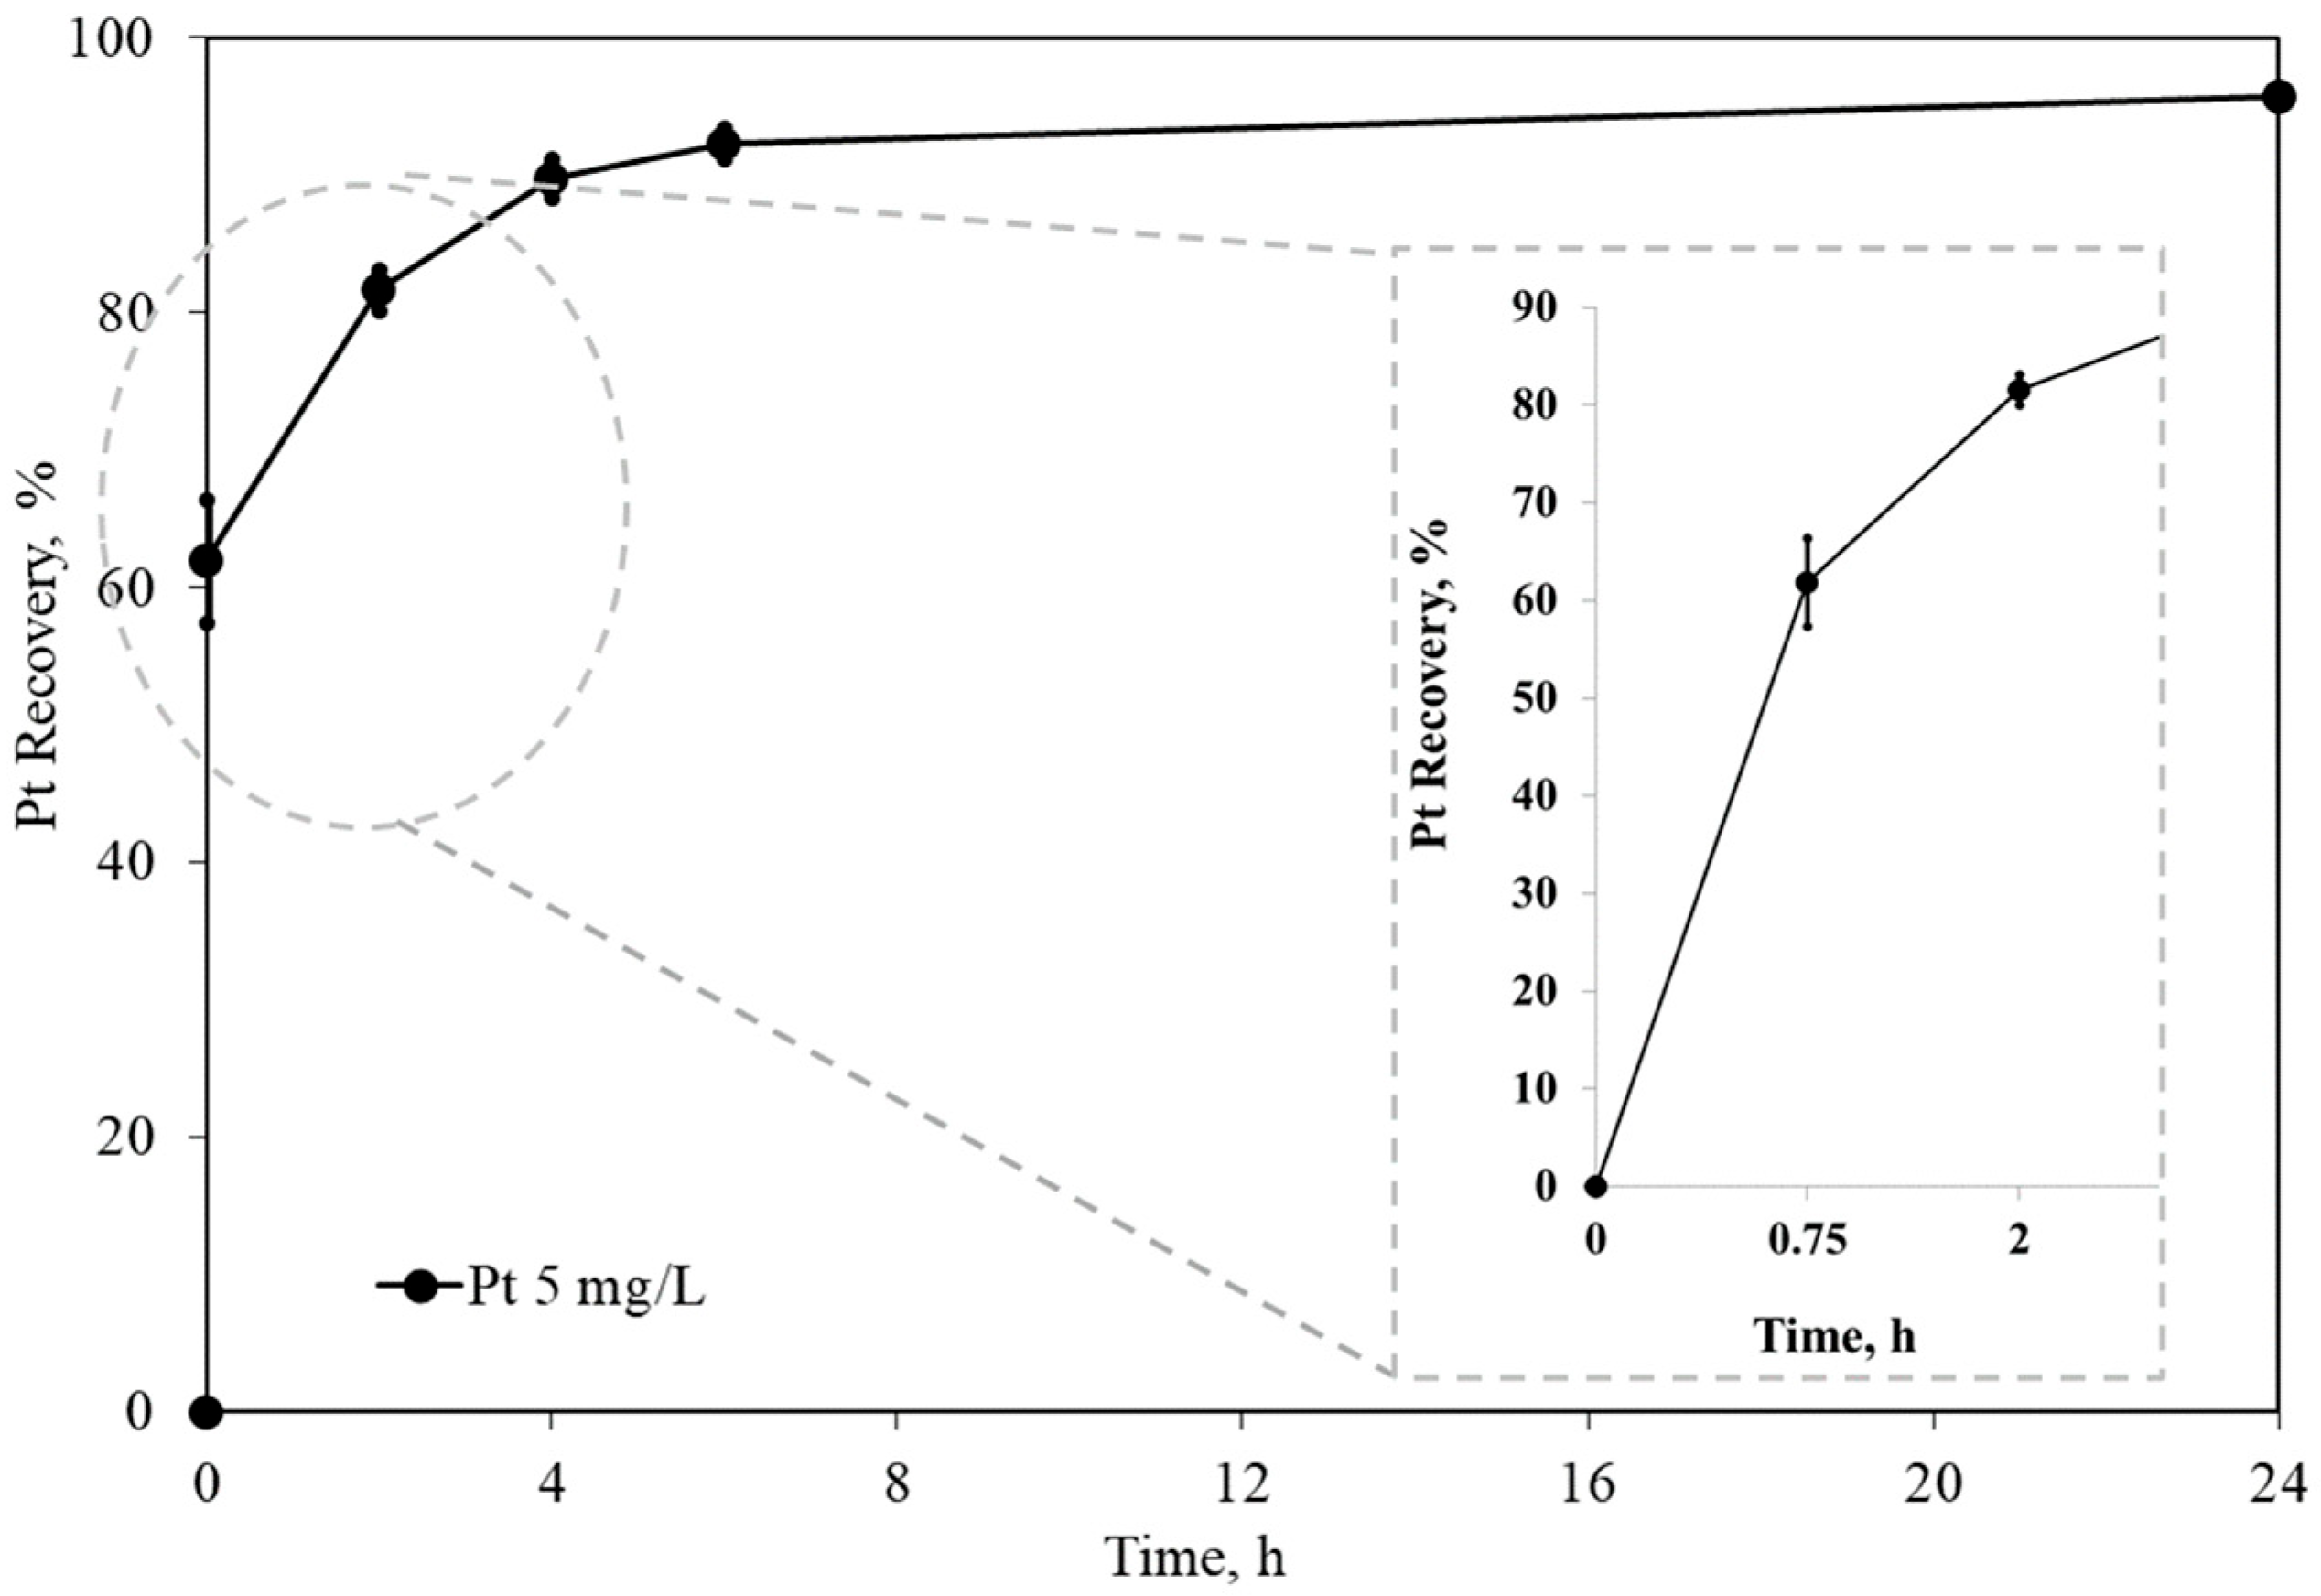
Figure 3.
Platinum adsorption using activated carbon. Standard conditions: Pt = 5 mg/L, [CN] = 300 mg/L, [Gly] = 3000 mg/L, pH = 10.5, carbon dosage = 10 g/L, and ambient temperature (24 °C). Error bars represent 2 standard deviations—95% confidence.
Figure 3.
Platinum adsorption using activated carbon. Standard conditions: Pt = 5 mg/L, [CN] = 300 mg/L, [Gly] = 3000 mg/L, pH = 10.5, carbon dosage = 10 g/L, and ambient temperature (24 °C). Error bars represent 2 standard deviations—95% confidence.
Figure 4.
Effect of varying initial carbon dosages on Pt recovery (Pt-pure solution over carbon). Experimental conditions: Pt = 5 mg/L, [CN] = 300 mg/L, [Gly] = 3000 mg/L, pH = 10.5, carbon dosage = 5–10–20 g/L, and temperature = 24 °C.
Figure 4.
Effect of varying initial carbon dosages on Pt recovery (Pt-pure solution over carbon). Experimental conditions: Pt = 5 mg/L, [CN] = 300 mg/L, [Gly] = 3000 mg/L, pH = 10.5, carbon dosage = 5–10–20 g/L, and temperature = 24 °C.
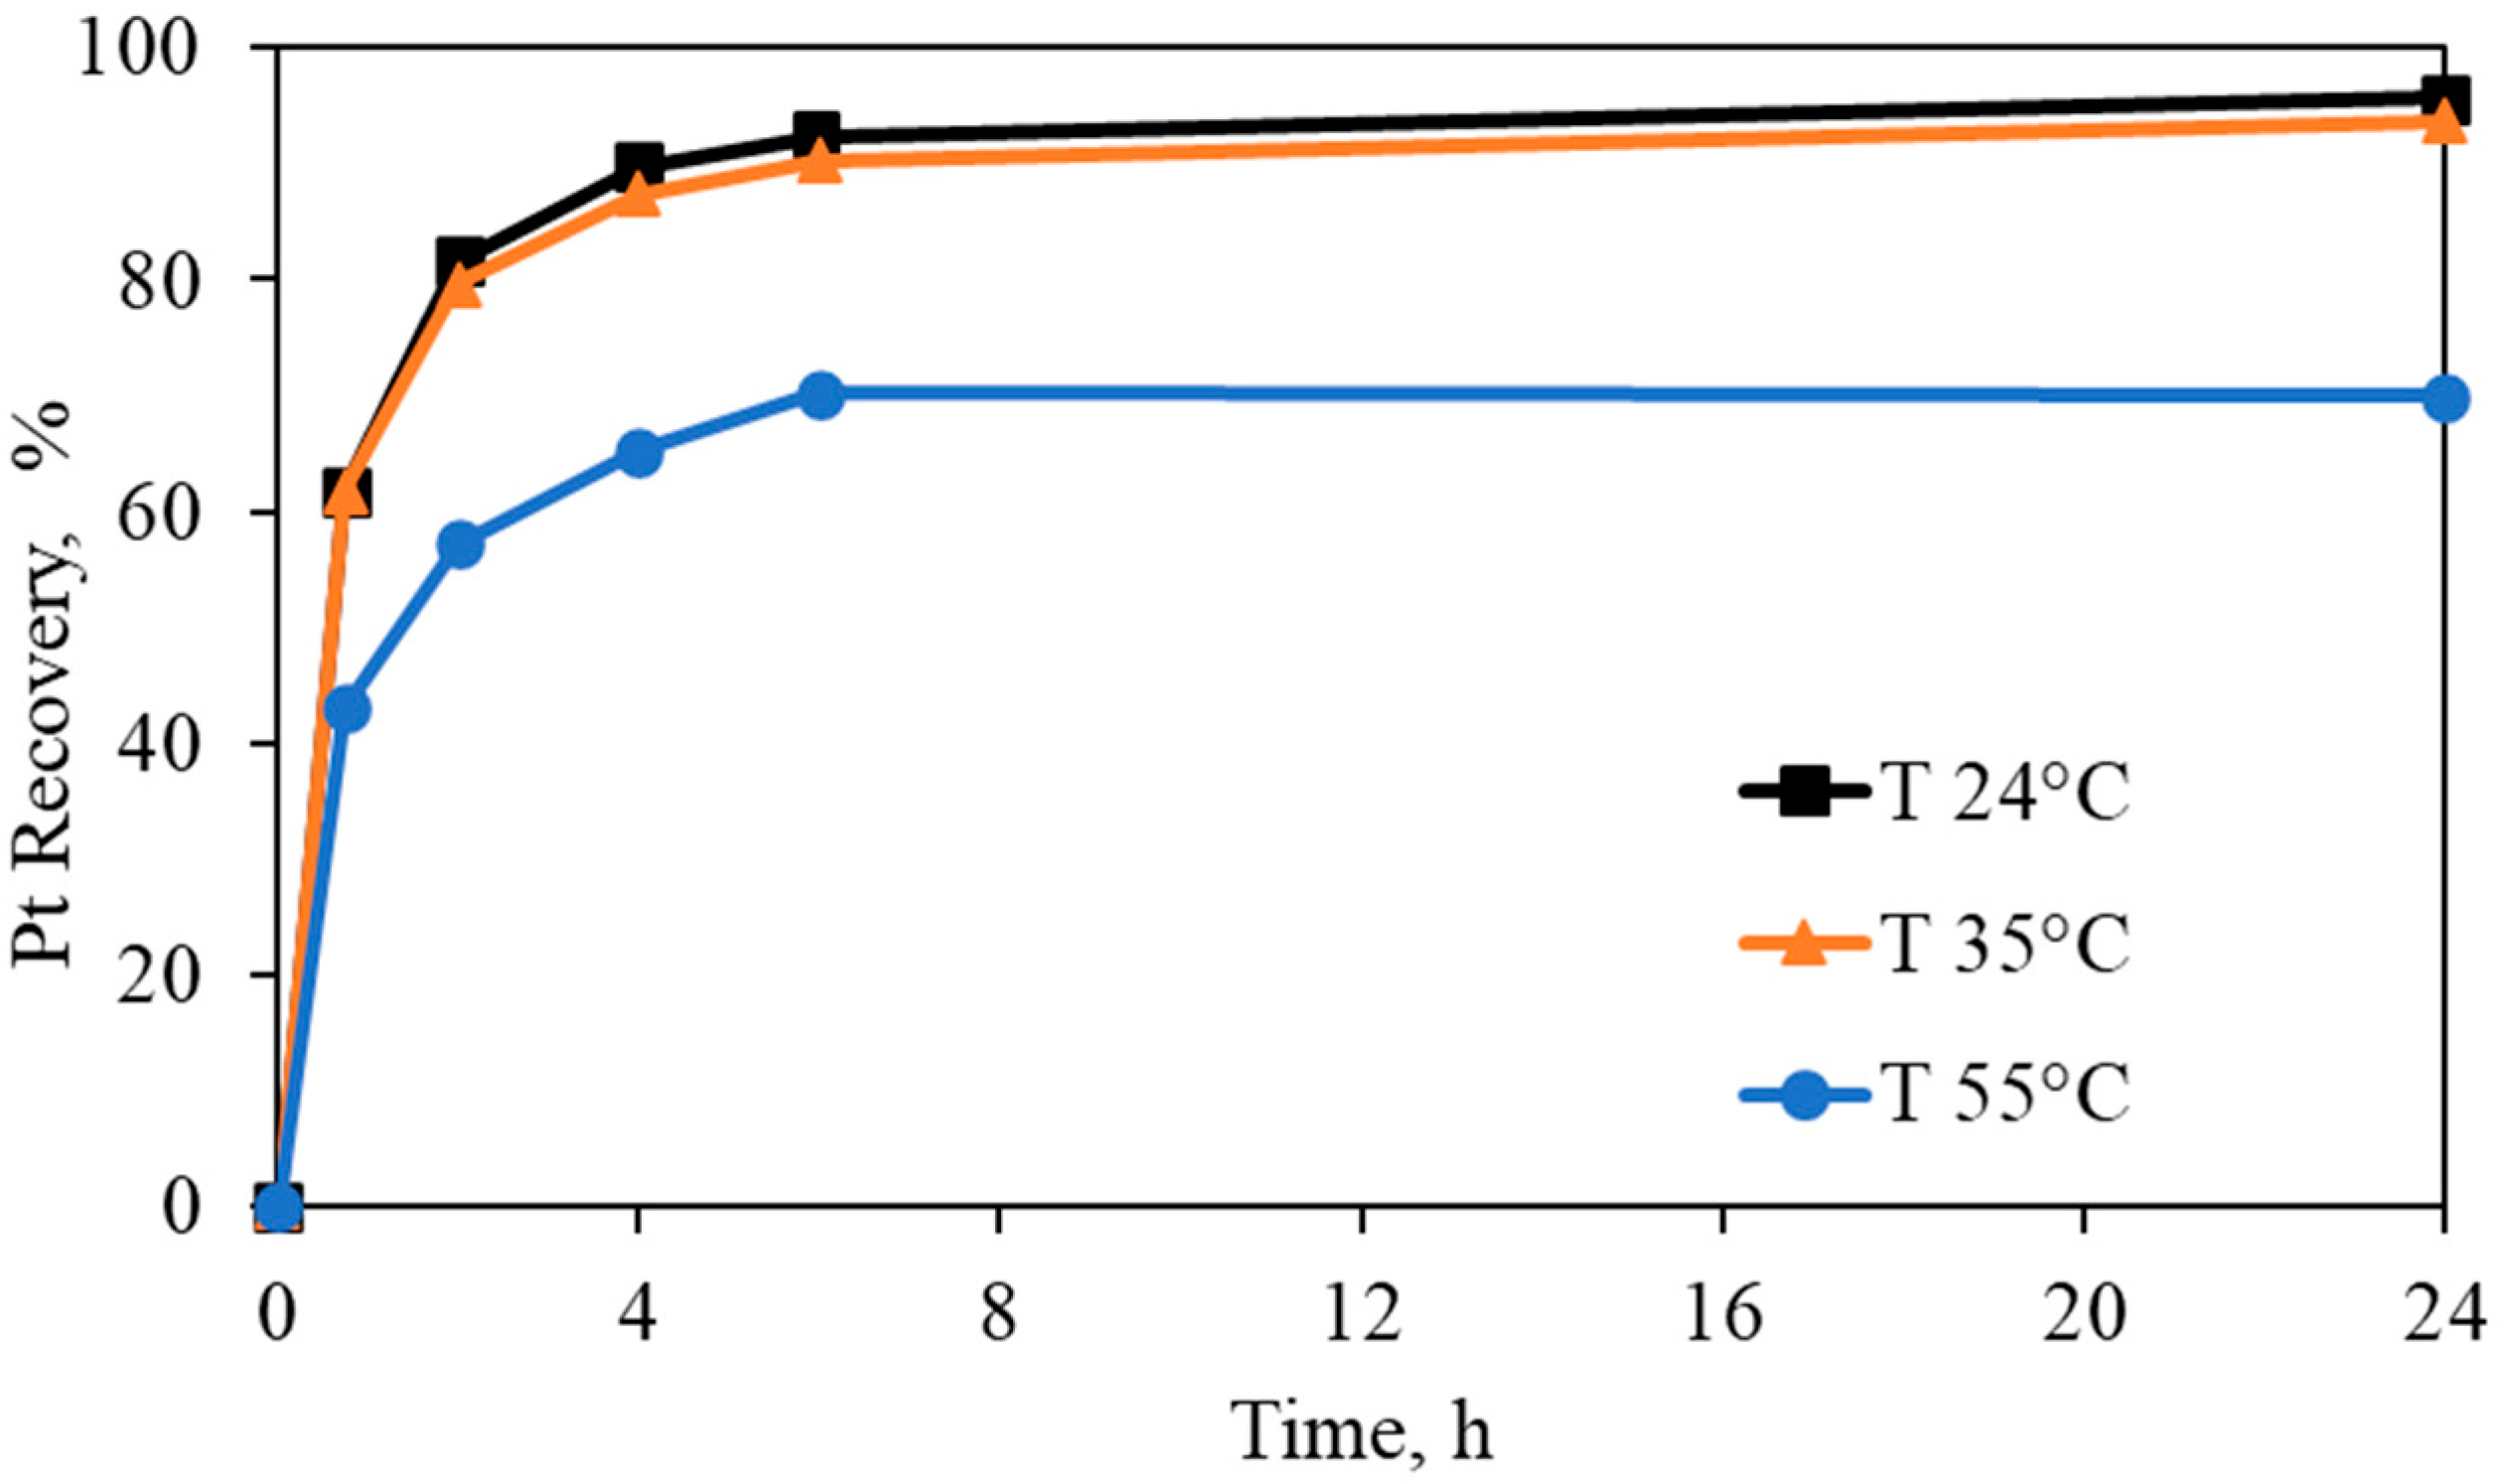
Figure 5.
Effect on Pt recovery at different temperatures (Pt-pure solution over carbon). Experimental conditions: Pt = 5 mg/L, [CN] = 300 mg/L, [Gly] = 3000 mg/L, pH = 10.5, carbon dosage = 10 g/L, and temperature= 24–35–55 °C.
Figure 5.
Effect on Pt recovery at different temperatures (Pt-pure solution over carbon). Experimental conditions: Pt = 5 mg/L, [CN] = 300 mg/L, [Gly] = 3000 mg/L, pH = 10.5, carbon dosage = 10 g/L, and temperature= 24–35–55 °C.
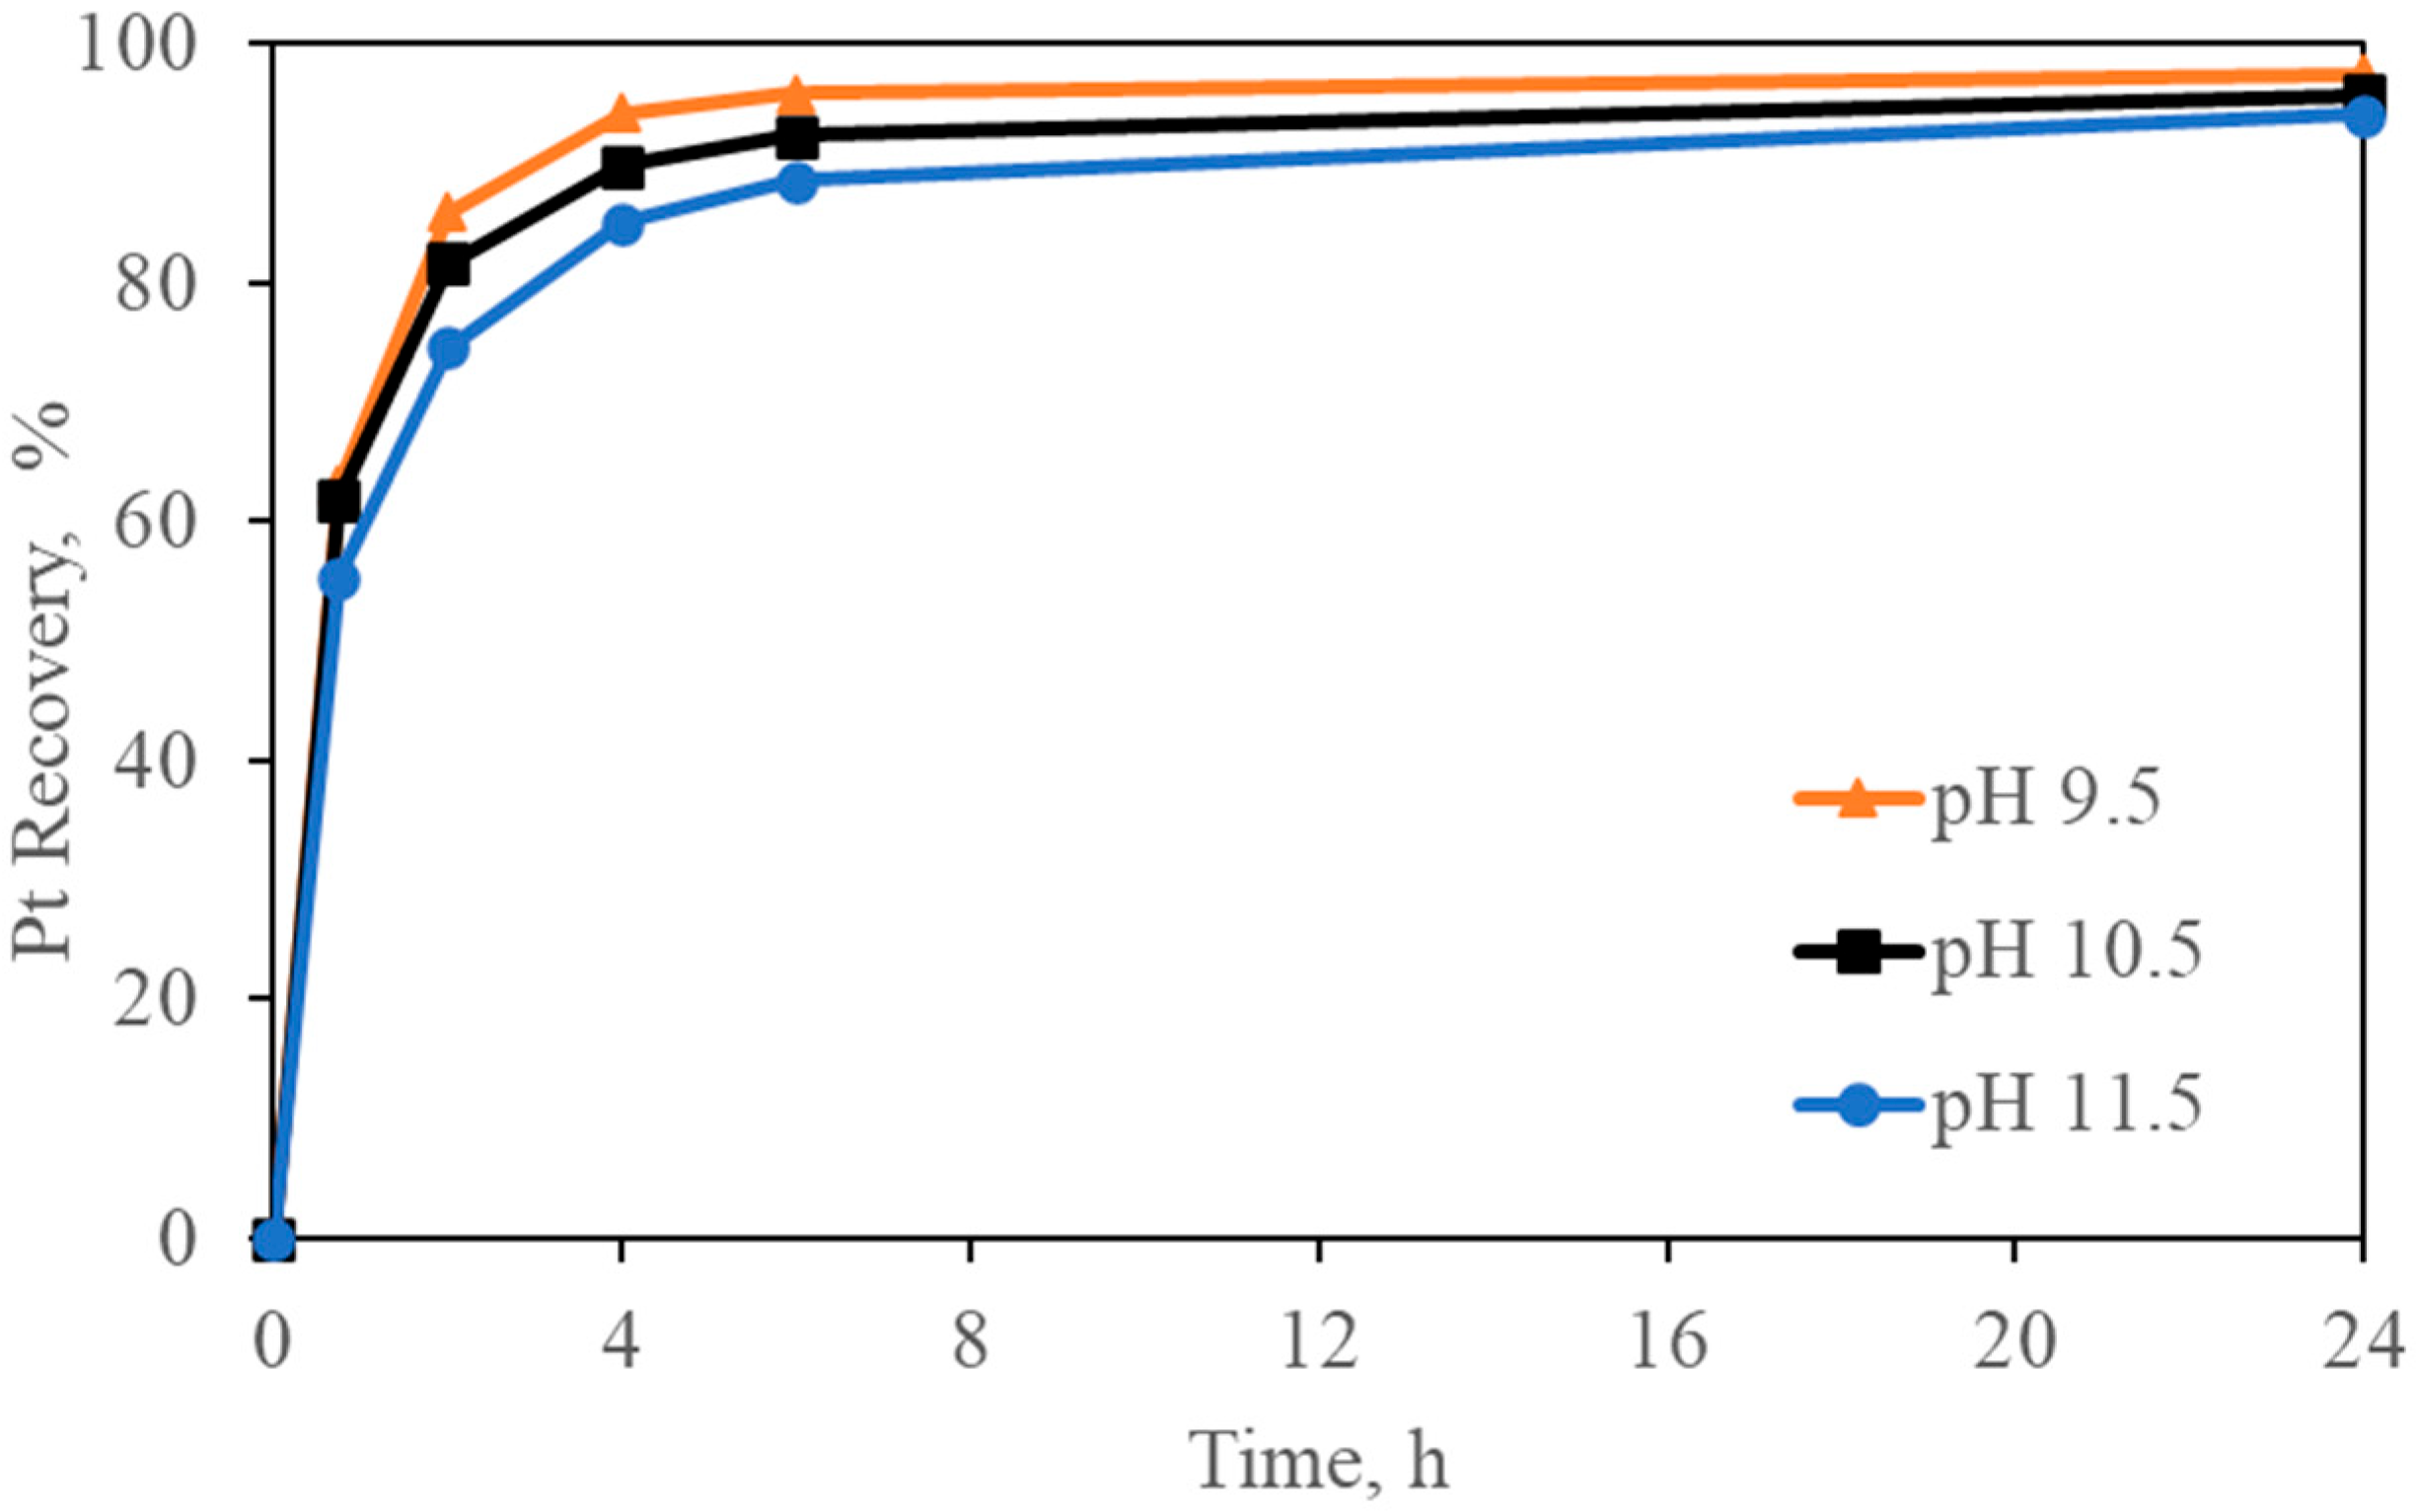
Figure 6.
Effect on Pt recovery at different initial pH (Pt-pure solution over carbon). Experimental conditions: Pt = 5 mg/L, [Gly] = 3000 mg/L, [CN] = 300 mg/L, pH = 9.5–10.5–11.5, carbon dosage = 10 g/L, and temperature = 24°.
Figure 6.
Effect on Pt recovery at different initial pH (Pt-pure solution over carbon). Experimental conditions: Pt = 5 mg/L, [Gly] = 3000 mg/L, [CN] = 300 mg/L, pH = 9.5–10.5–11.5, carbon dosage = 10 g/L, and temperature = 24°.
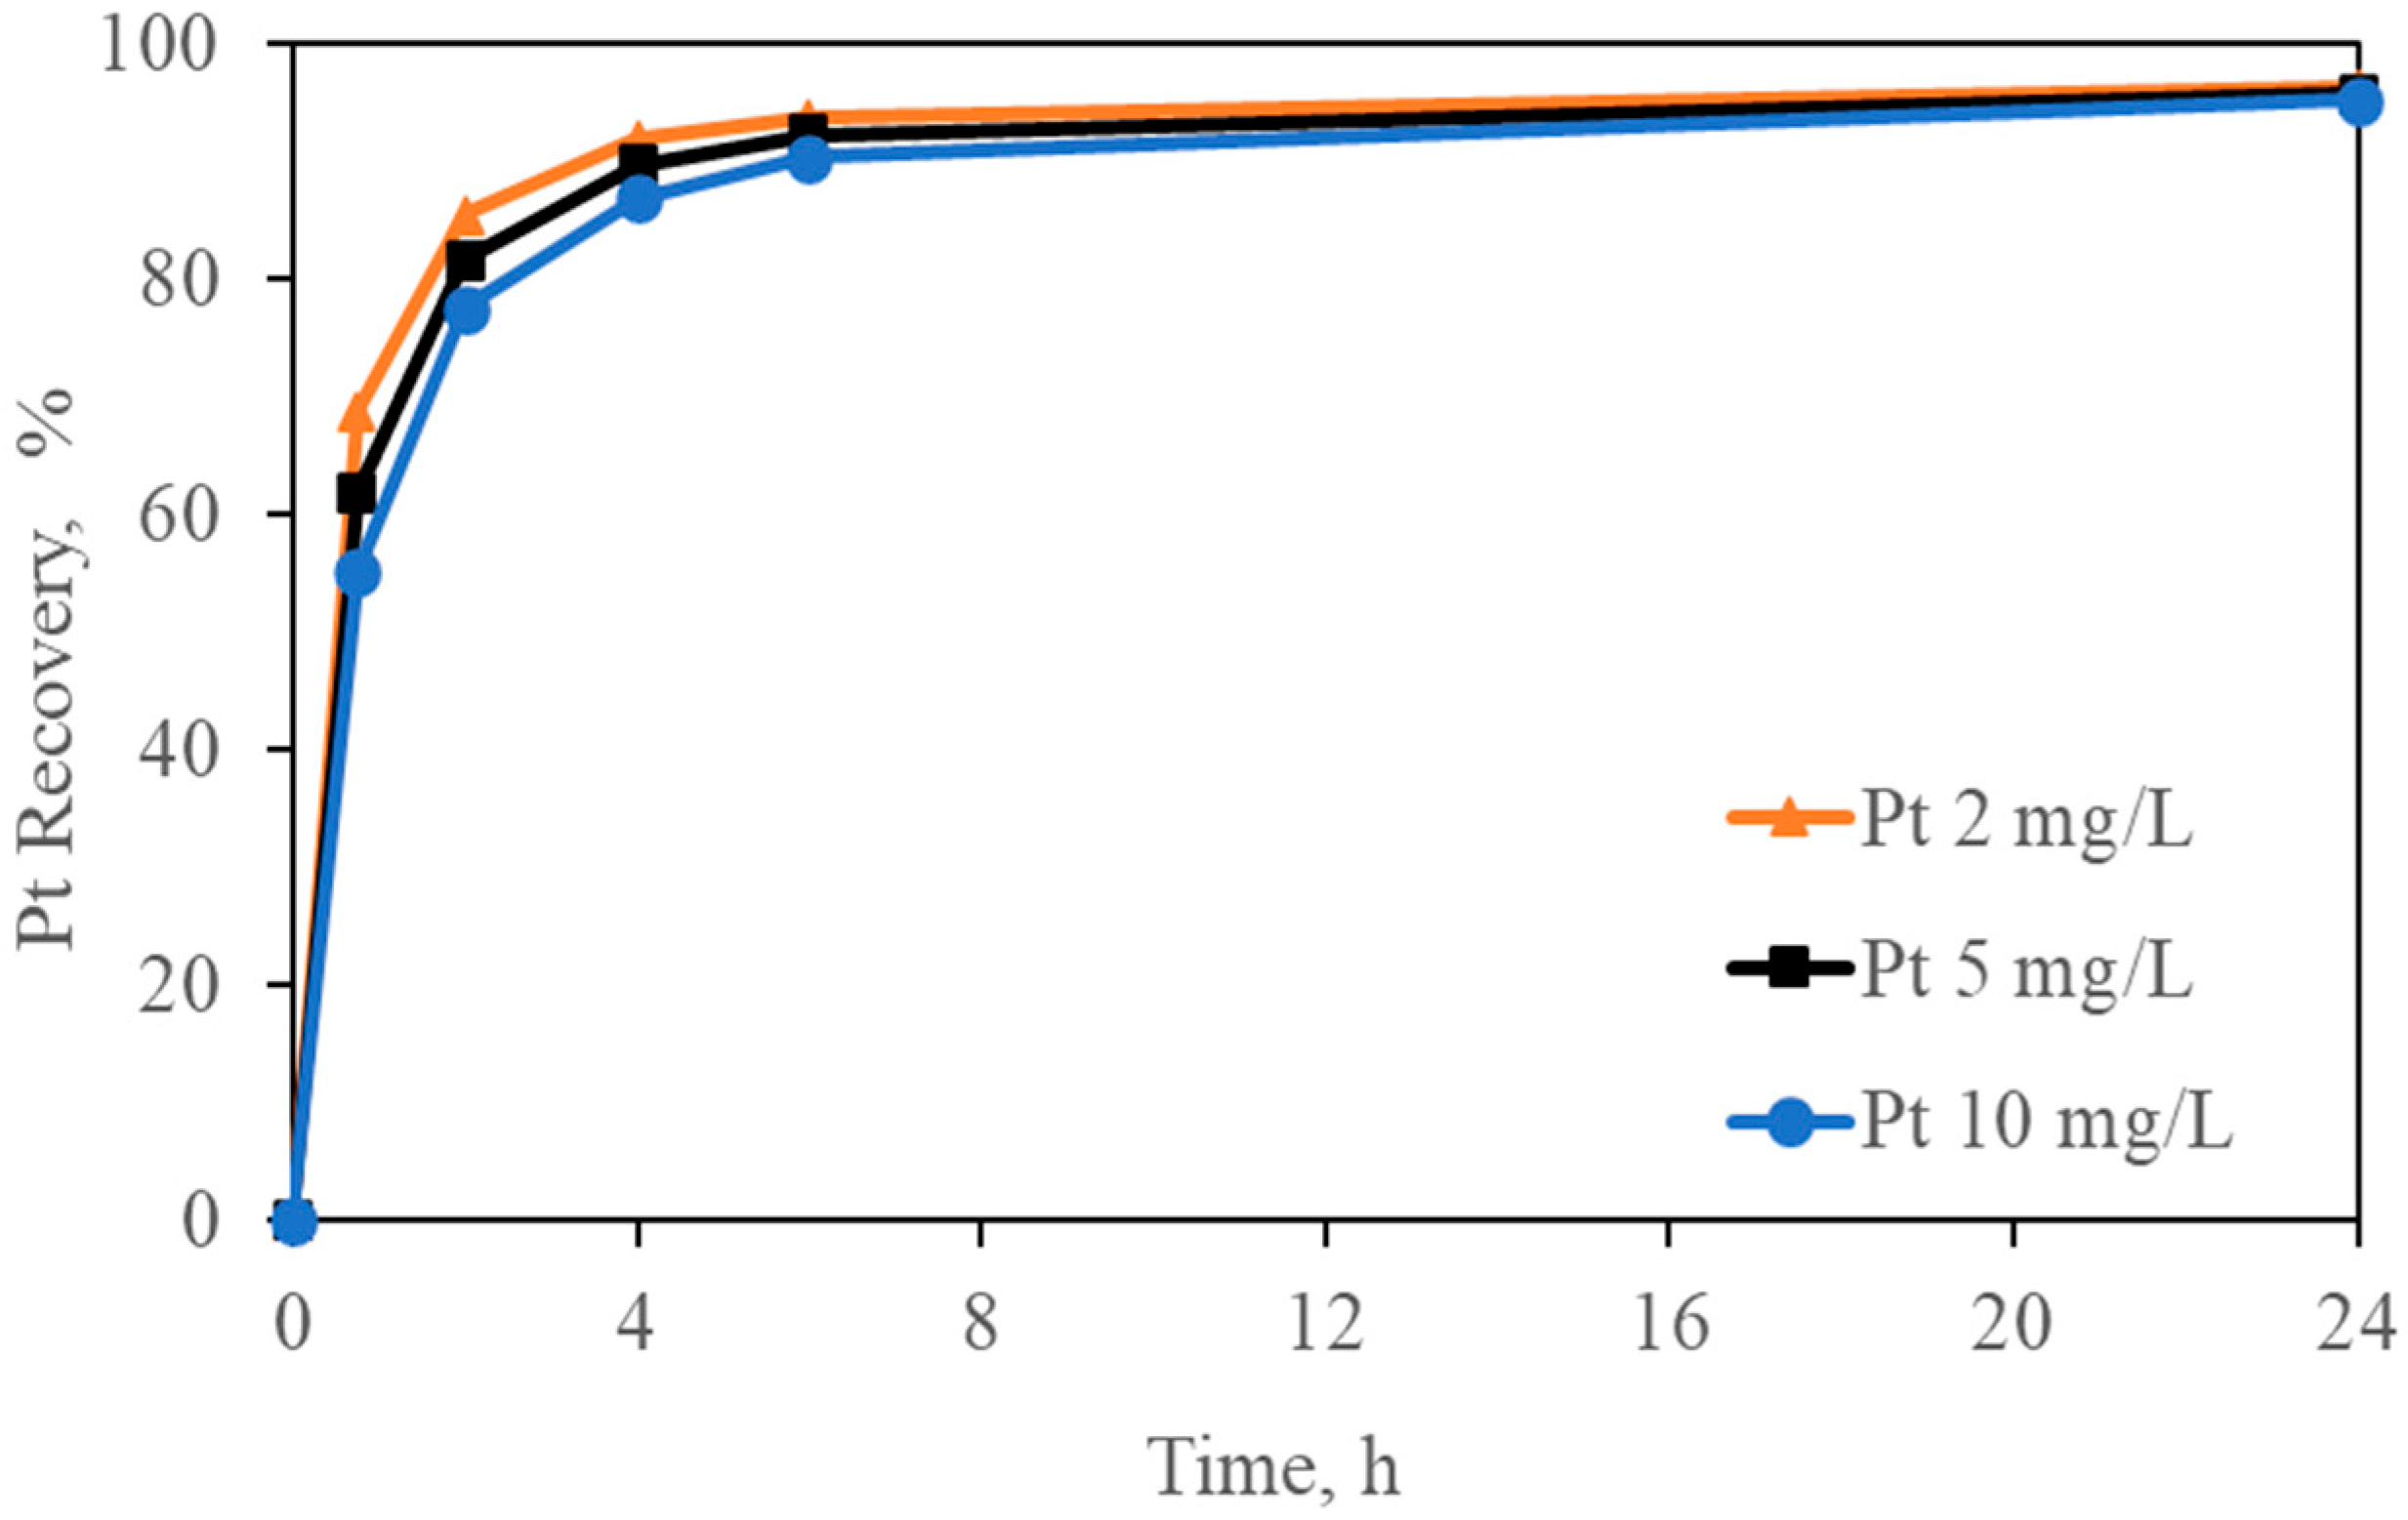
Figure 7.
Effect of different initial Pt concentrations on Pt adsorption (Pt-pure solution over carbon). Experimental conditions: Pt = 2–5–10 mg/L, [Gly] = 3000 mg/L, [CN] = 300 mg/L, pH = 10.5, carbon dosage = 10 g/L, and temperature = 24 °C.
Figure 7.
Effect of different initial Pt concentrations on Pt adsorption (Pt-pure solution over carbon). Experimental conditions: Pt = 2–5–10 mg/L, [Gly] = 3000 mg/L, [CN] = 300 mg/L, pH = 10.5, carbon dosage = 10 g/L, and temperature = 24 °C.
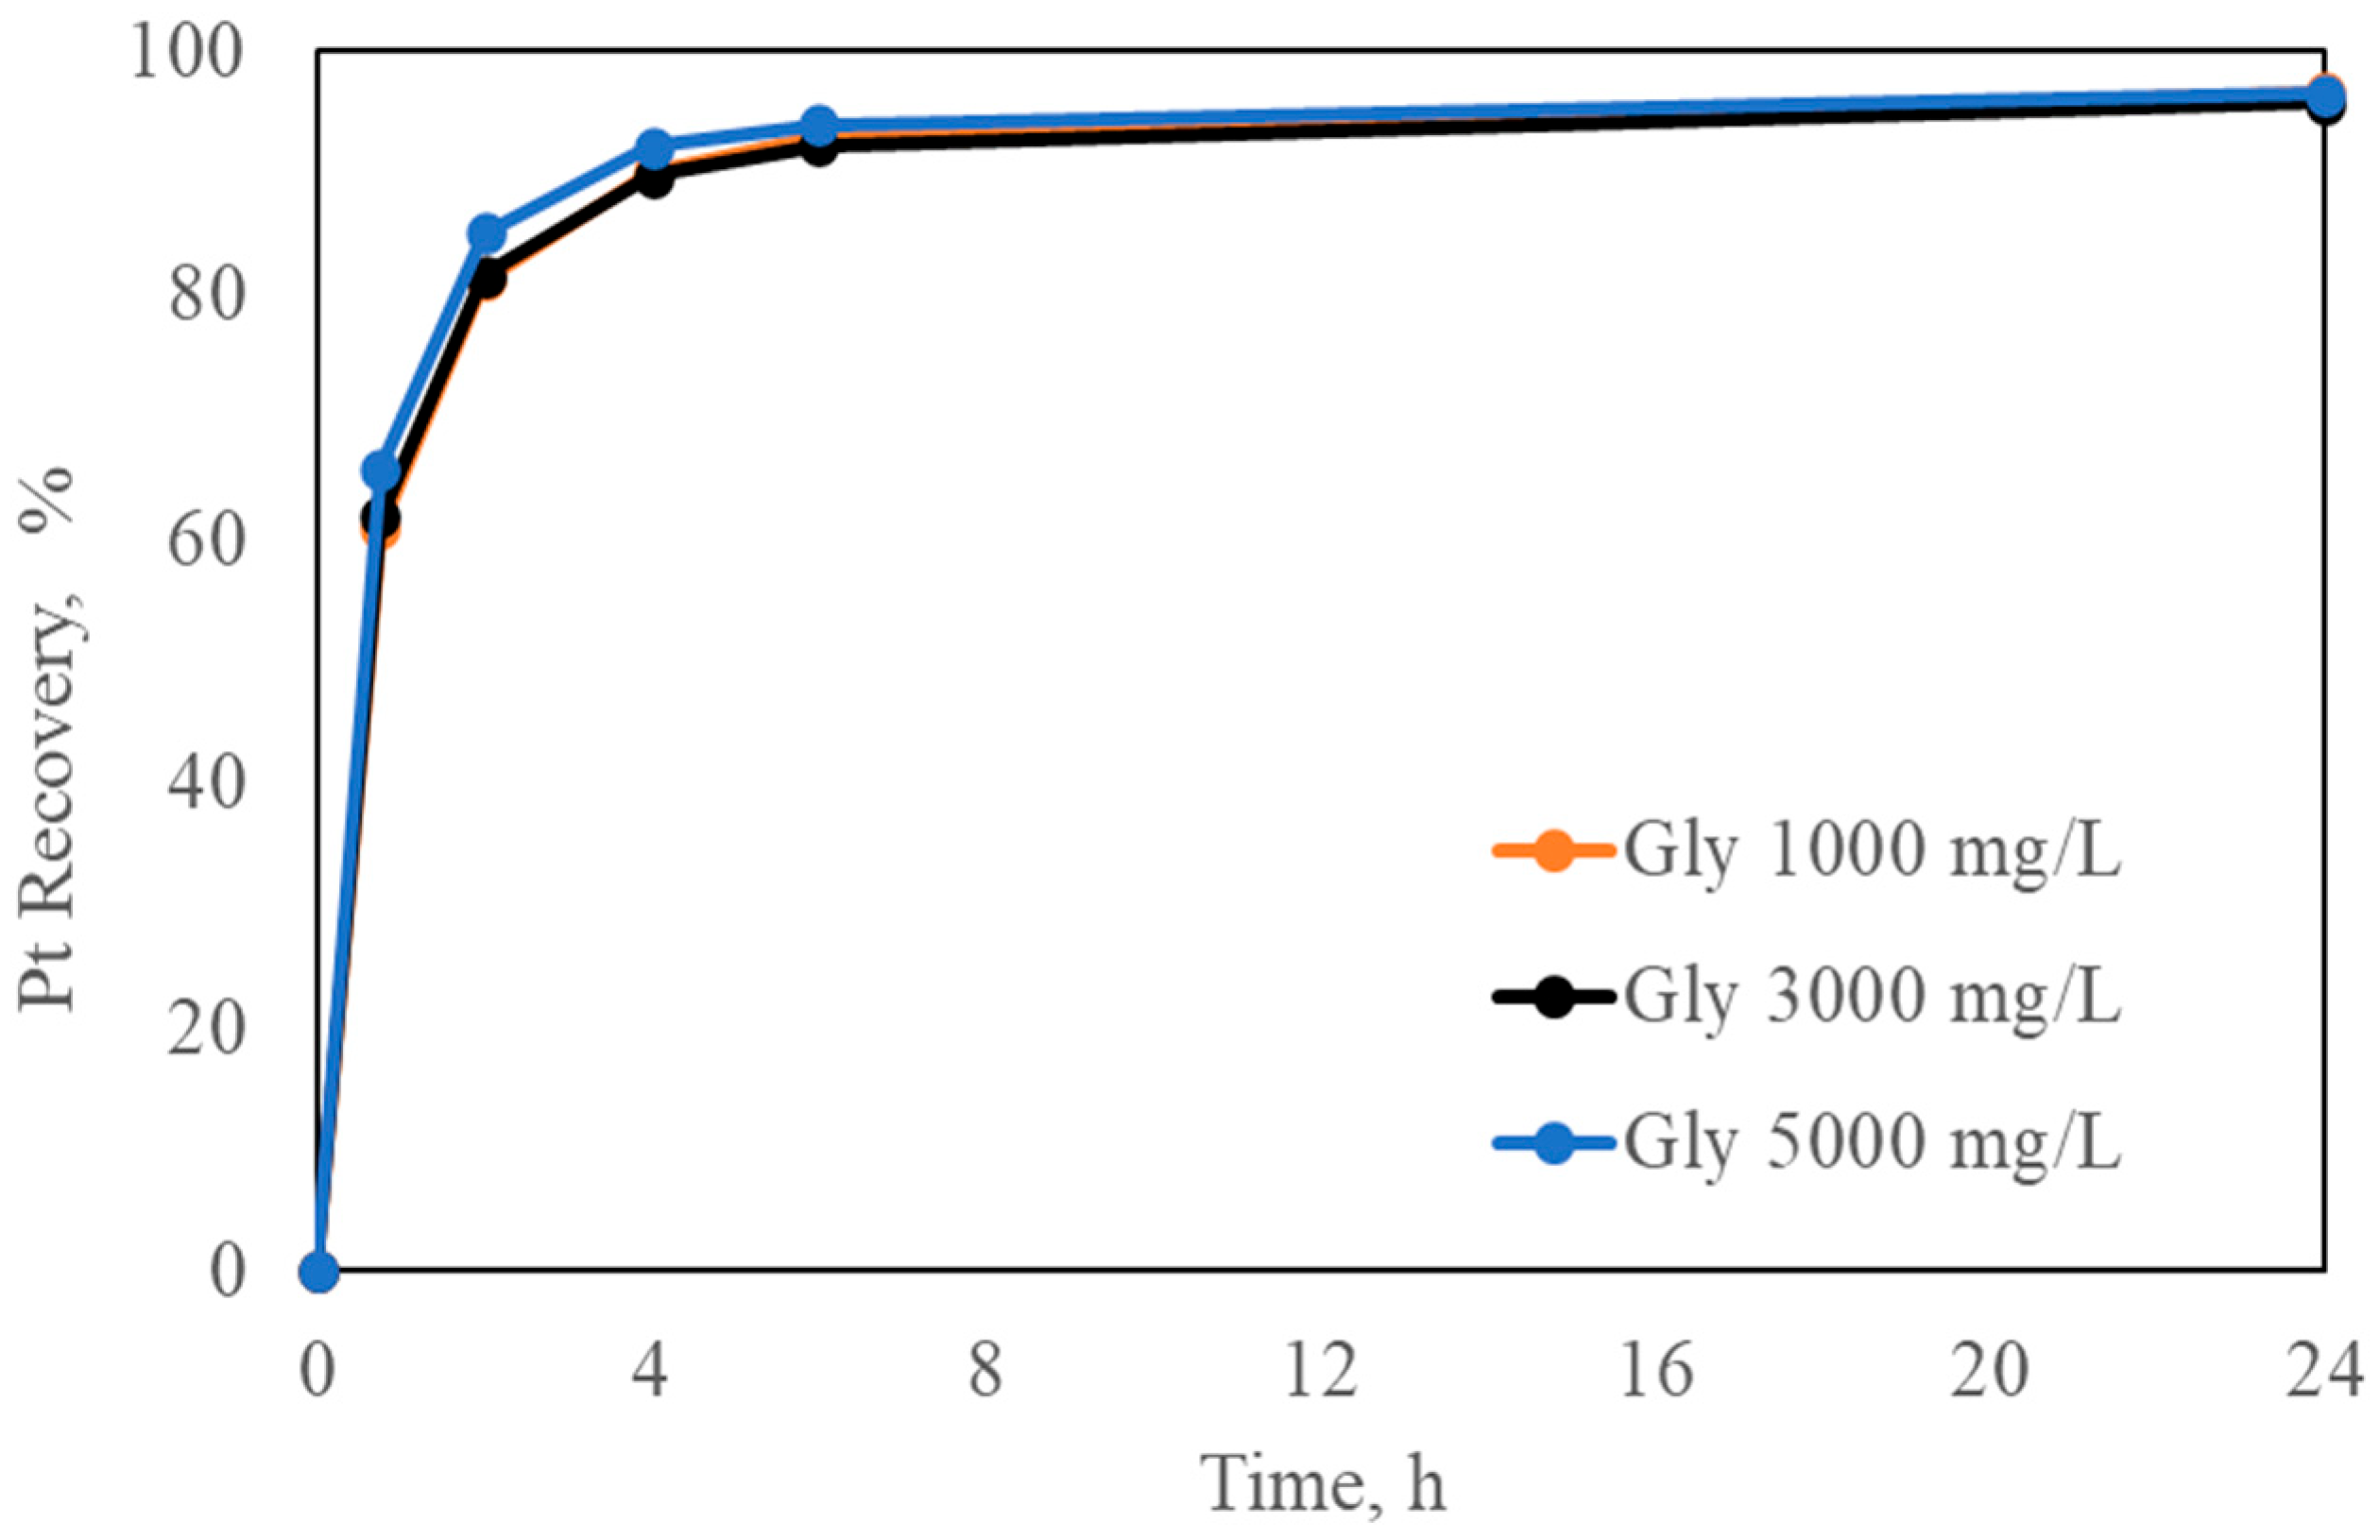
Figure 8.
Effect of different initial Gly on Pt recovery (Pt-pure solution over carbon). Experimental conditions: Pt = 5 mg/L, [Gly] = 1000–3000–5000 mg/L, [CN] = 300 mg/L, pH = 10.5, carbon dosage = 10 g/L, and temperature = 24 °C.
Figure 8.
Effect of different initial Gly on Pt recovery (Pt-pure solution over carbon). Experimental conditions: Pt = 5 mg/L, [Gly] = 1000–3000–5000 mg/L, [CN] = 300 mg/L, pH = 10.5, carbon dosage = 10 g/L, and temperature = 24 °C.
Figure 9.
Effect of different initial CN concentrations on Pt recovery (Pt-pure solution over carbon). Experimental conditions: Pt = 5 mg/L, [CN] = 100–300–500 mg/L, [Gly] = 3000 mg/L, pH = 10.5, carbon dosage = 10 g/L, and temperature = 24 °C.
Figure 9.
Effect of different initial CN concentrations on Pt recovery (Pt-pure solution over carbon). Experimental conditions: Pt = 5 mg/L, [CN] = 100–300–500 mg/L, [Gly] = 3000 mg/L, pH = 10.5, carbon dosage = 10 g/L, and temperature = 24 °C.
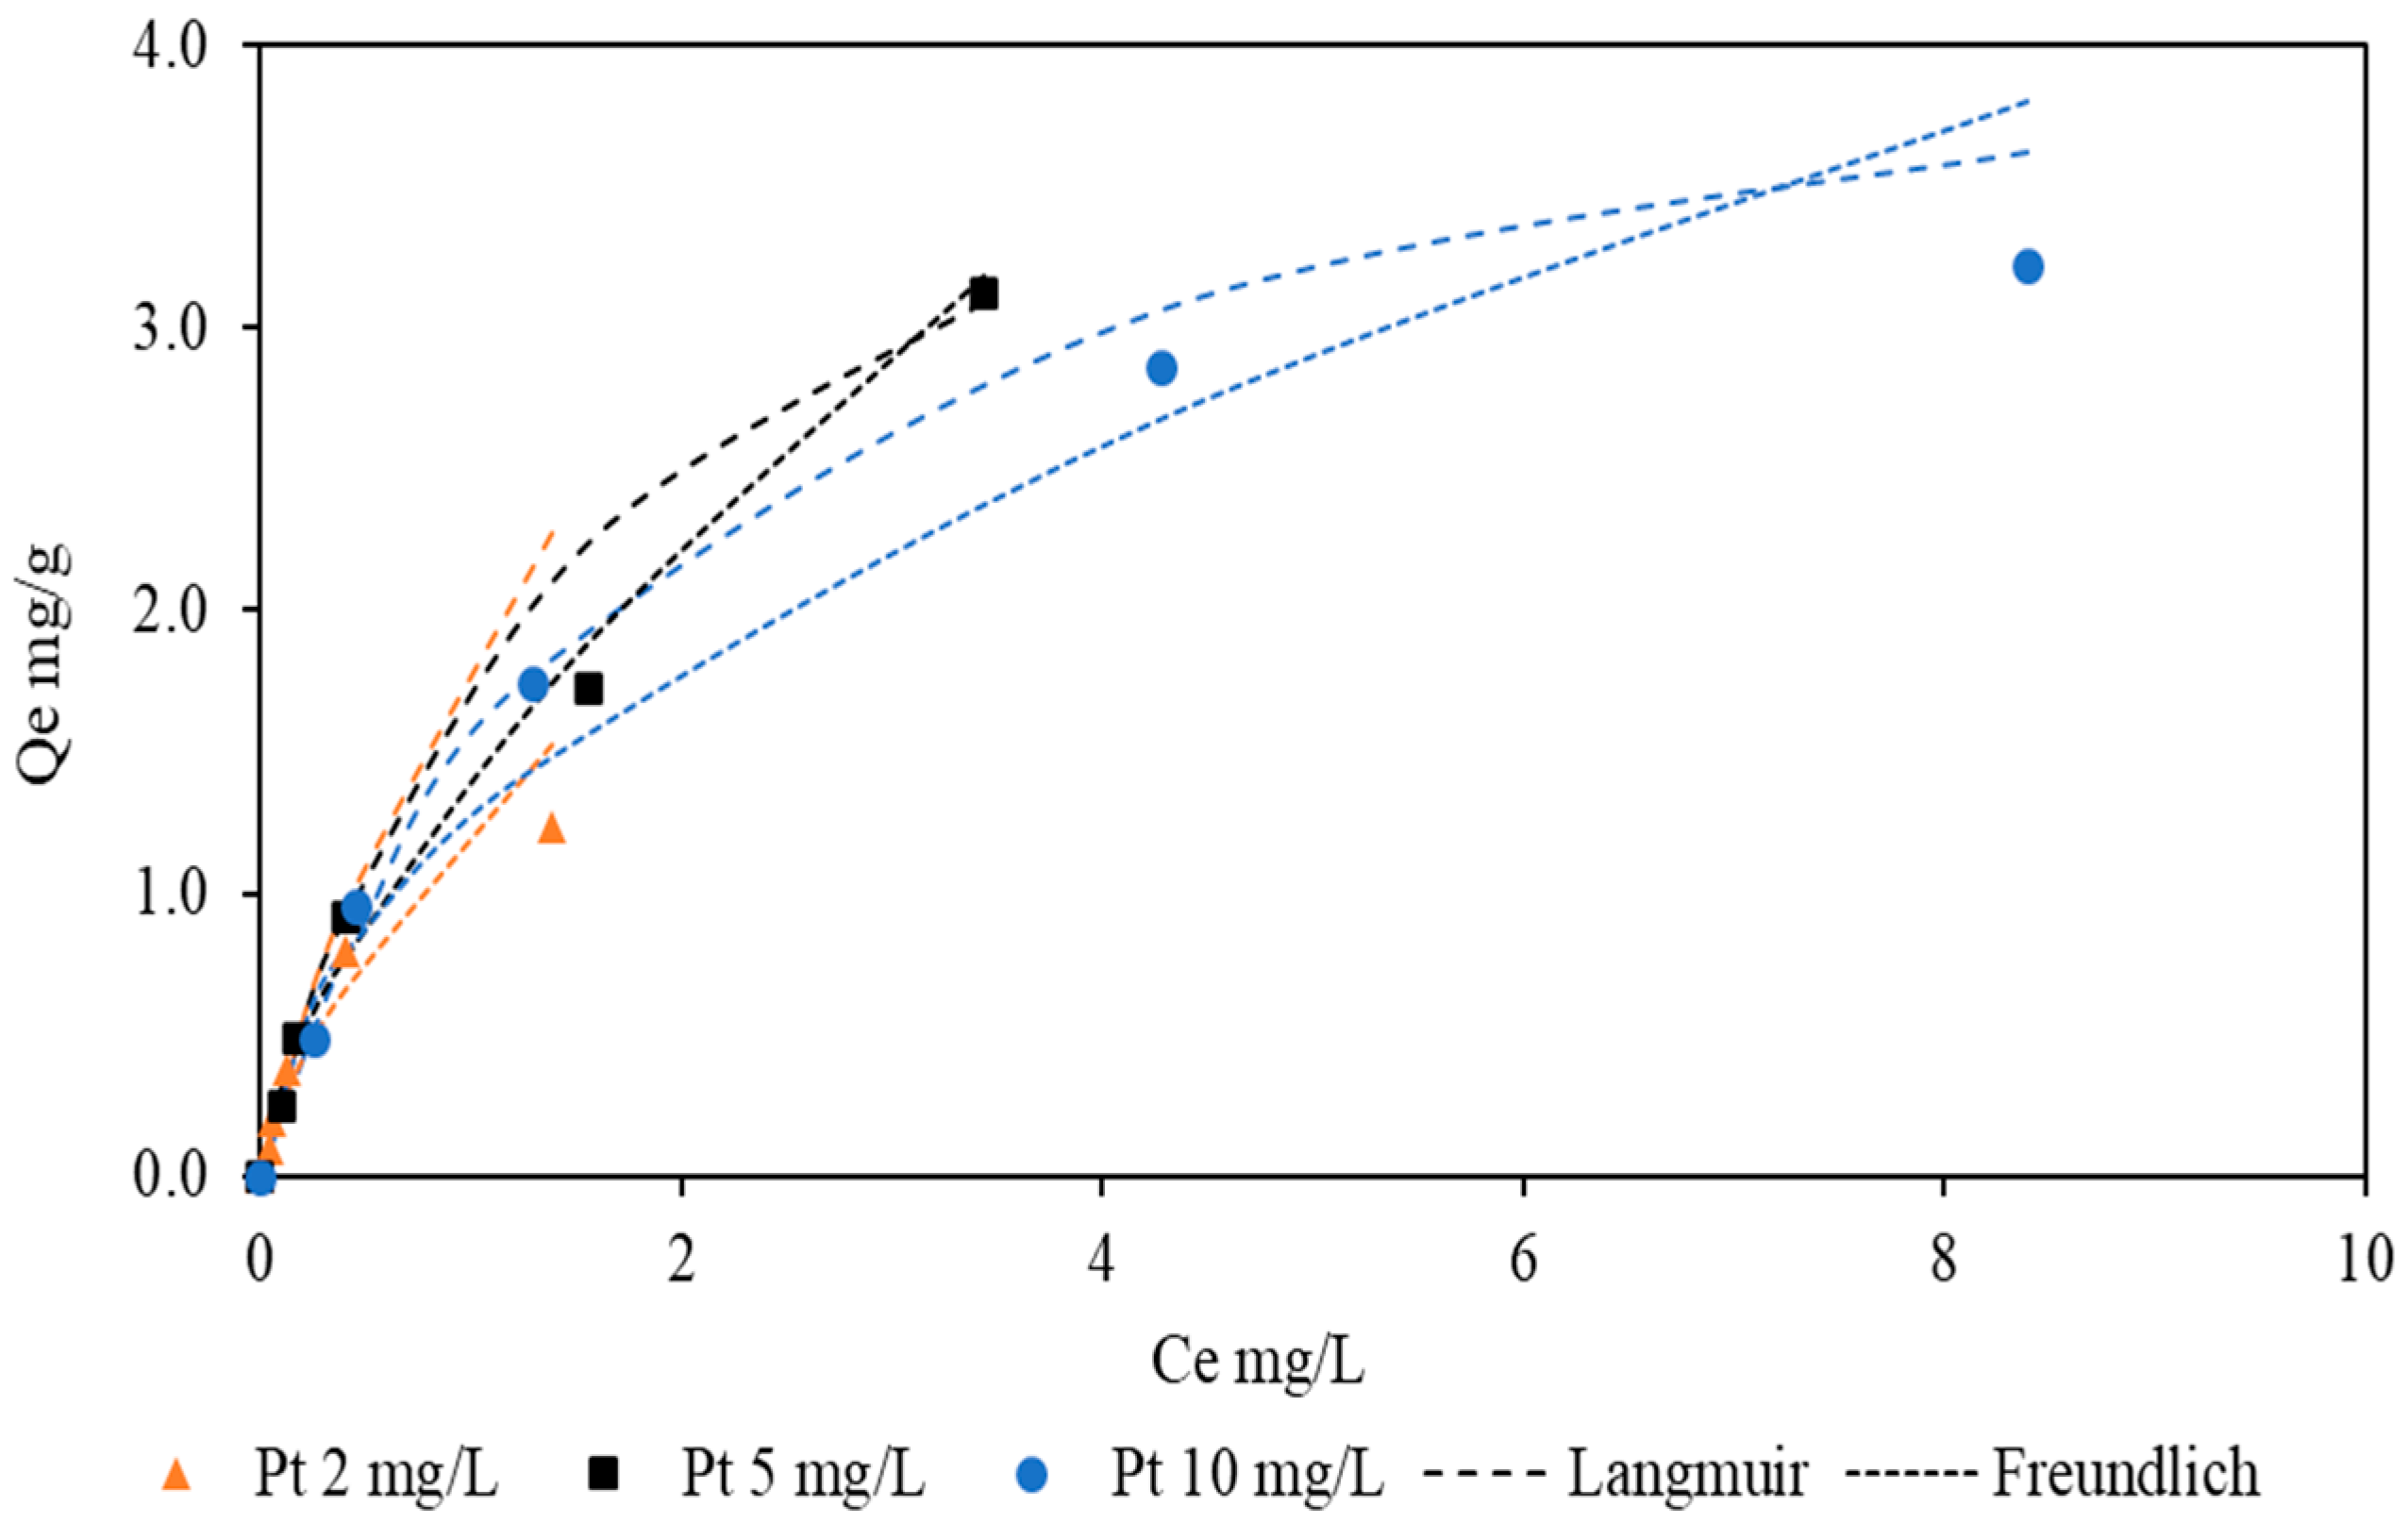
Figure 10.
Equilibrium adsorption isotherm fitted with Langmuir isotherm at different initial platinum concentrations. Experimental conditions: [Gly] = 3000 mg/L [CN] = 300 mg/L, pH = 10.5, and temperature = 24 °C.
Figure 10.
Equilibrium adsorption isotherm fitted with Langmuir isotherm at different initial platinum concentrations. Experimental conditions: [Gly] = 3000 mg/L [CN] = 300 mg/L, pH = 10.5, and temperature = 24 °C.
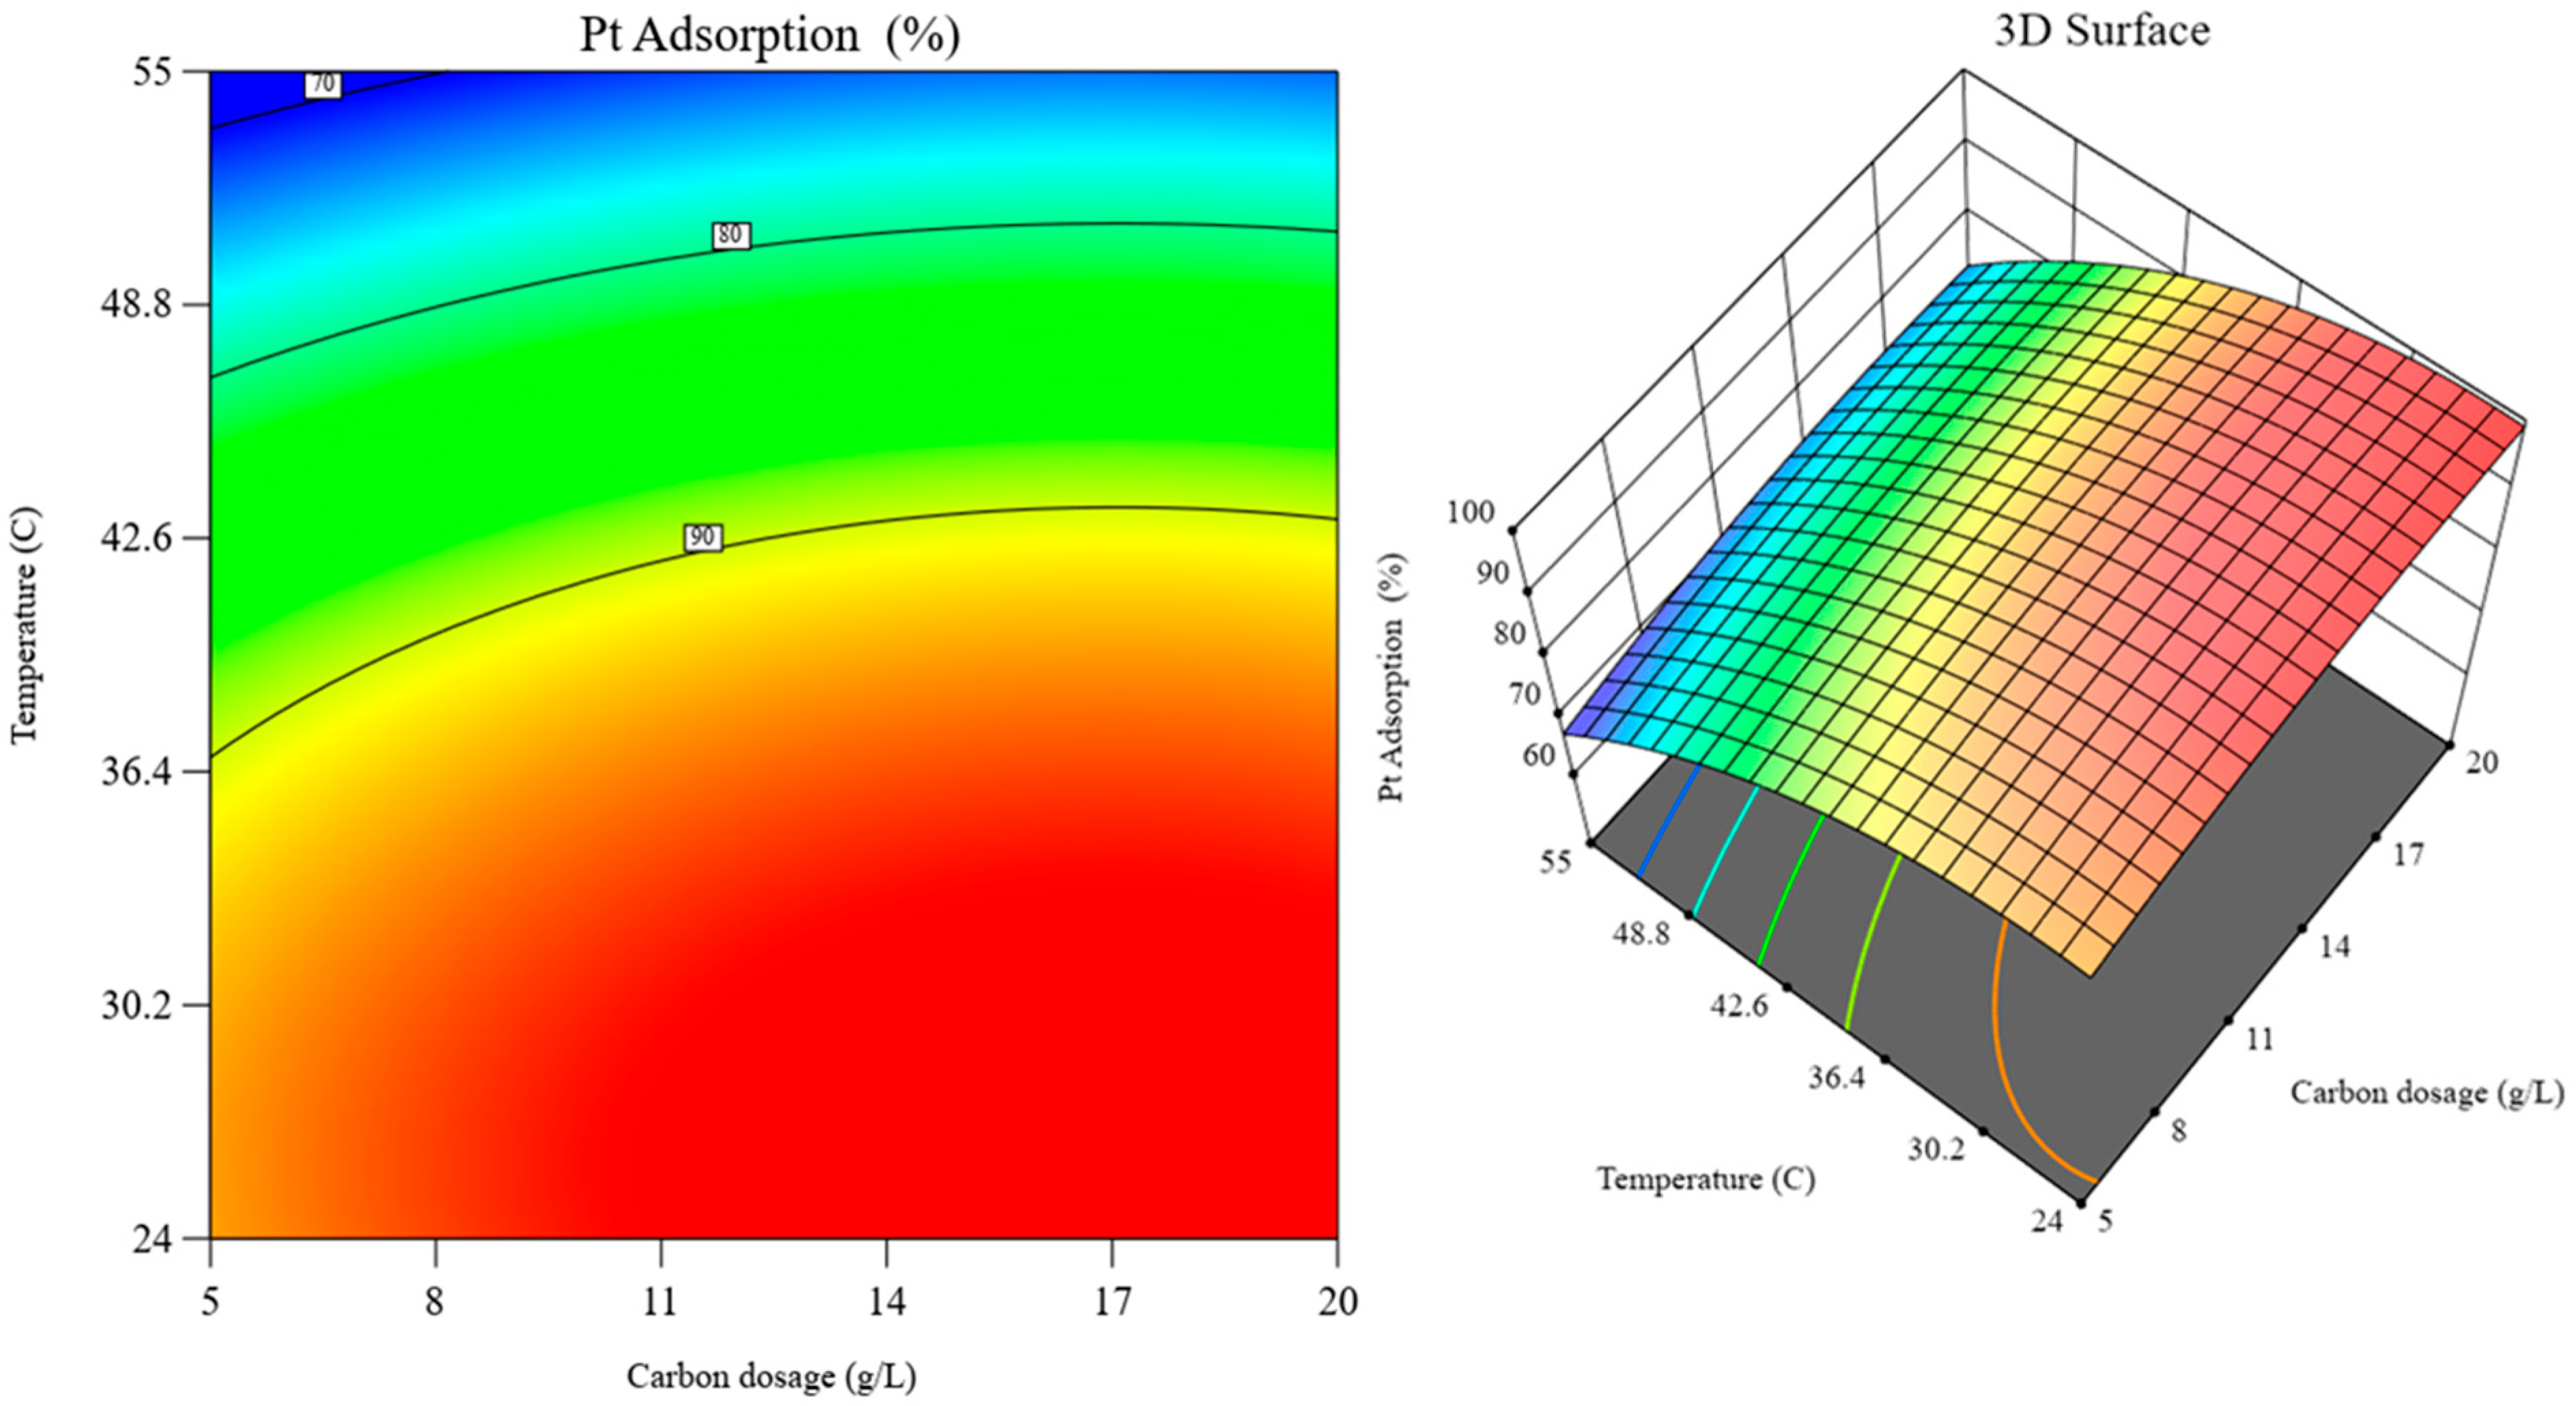
Figure 11.
RSM graphs: contour plot (left) and 3D surface (right) over the interaction of carbon dosage and temperature effects (at fixed pH 9.5).
Figure 11.
RSM graphs: contour plot (left) and 3D surface (right) over the interaction of carbon dosage and temperature effects (at fixed pH 9.5).
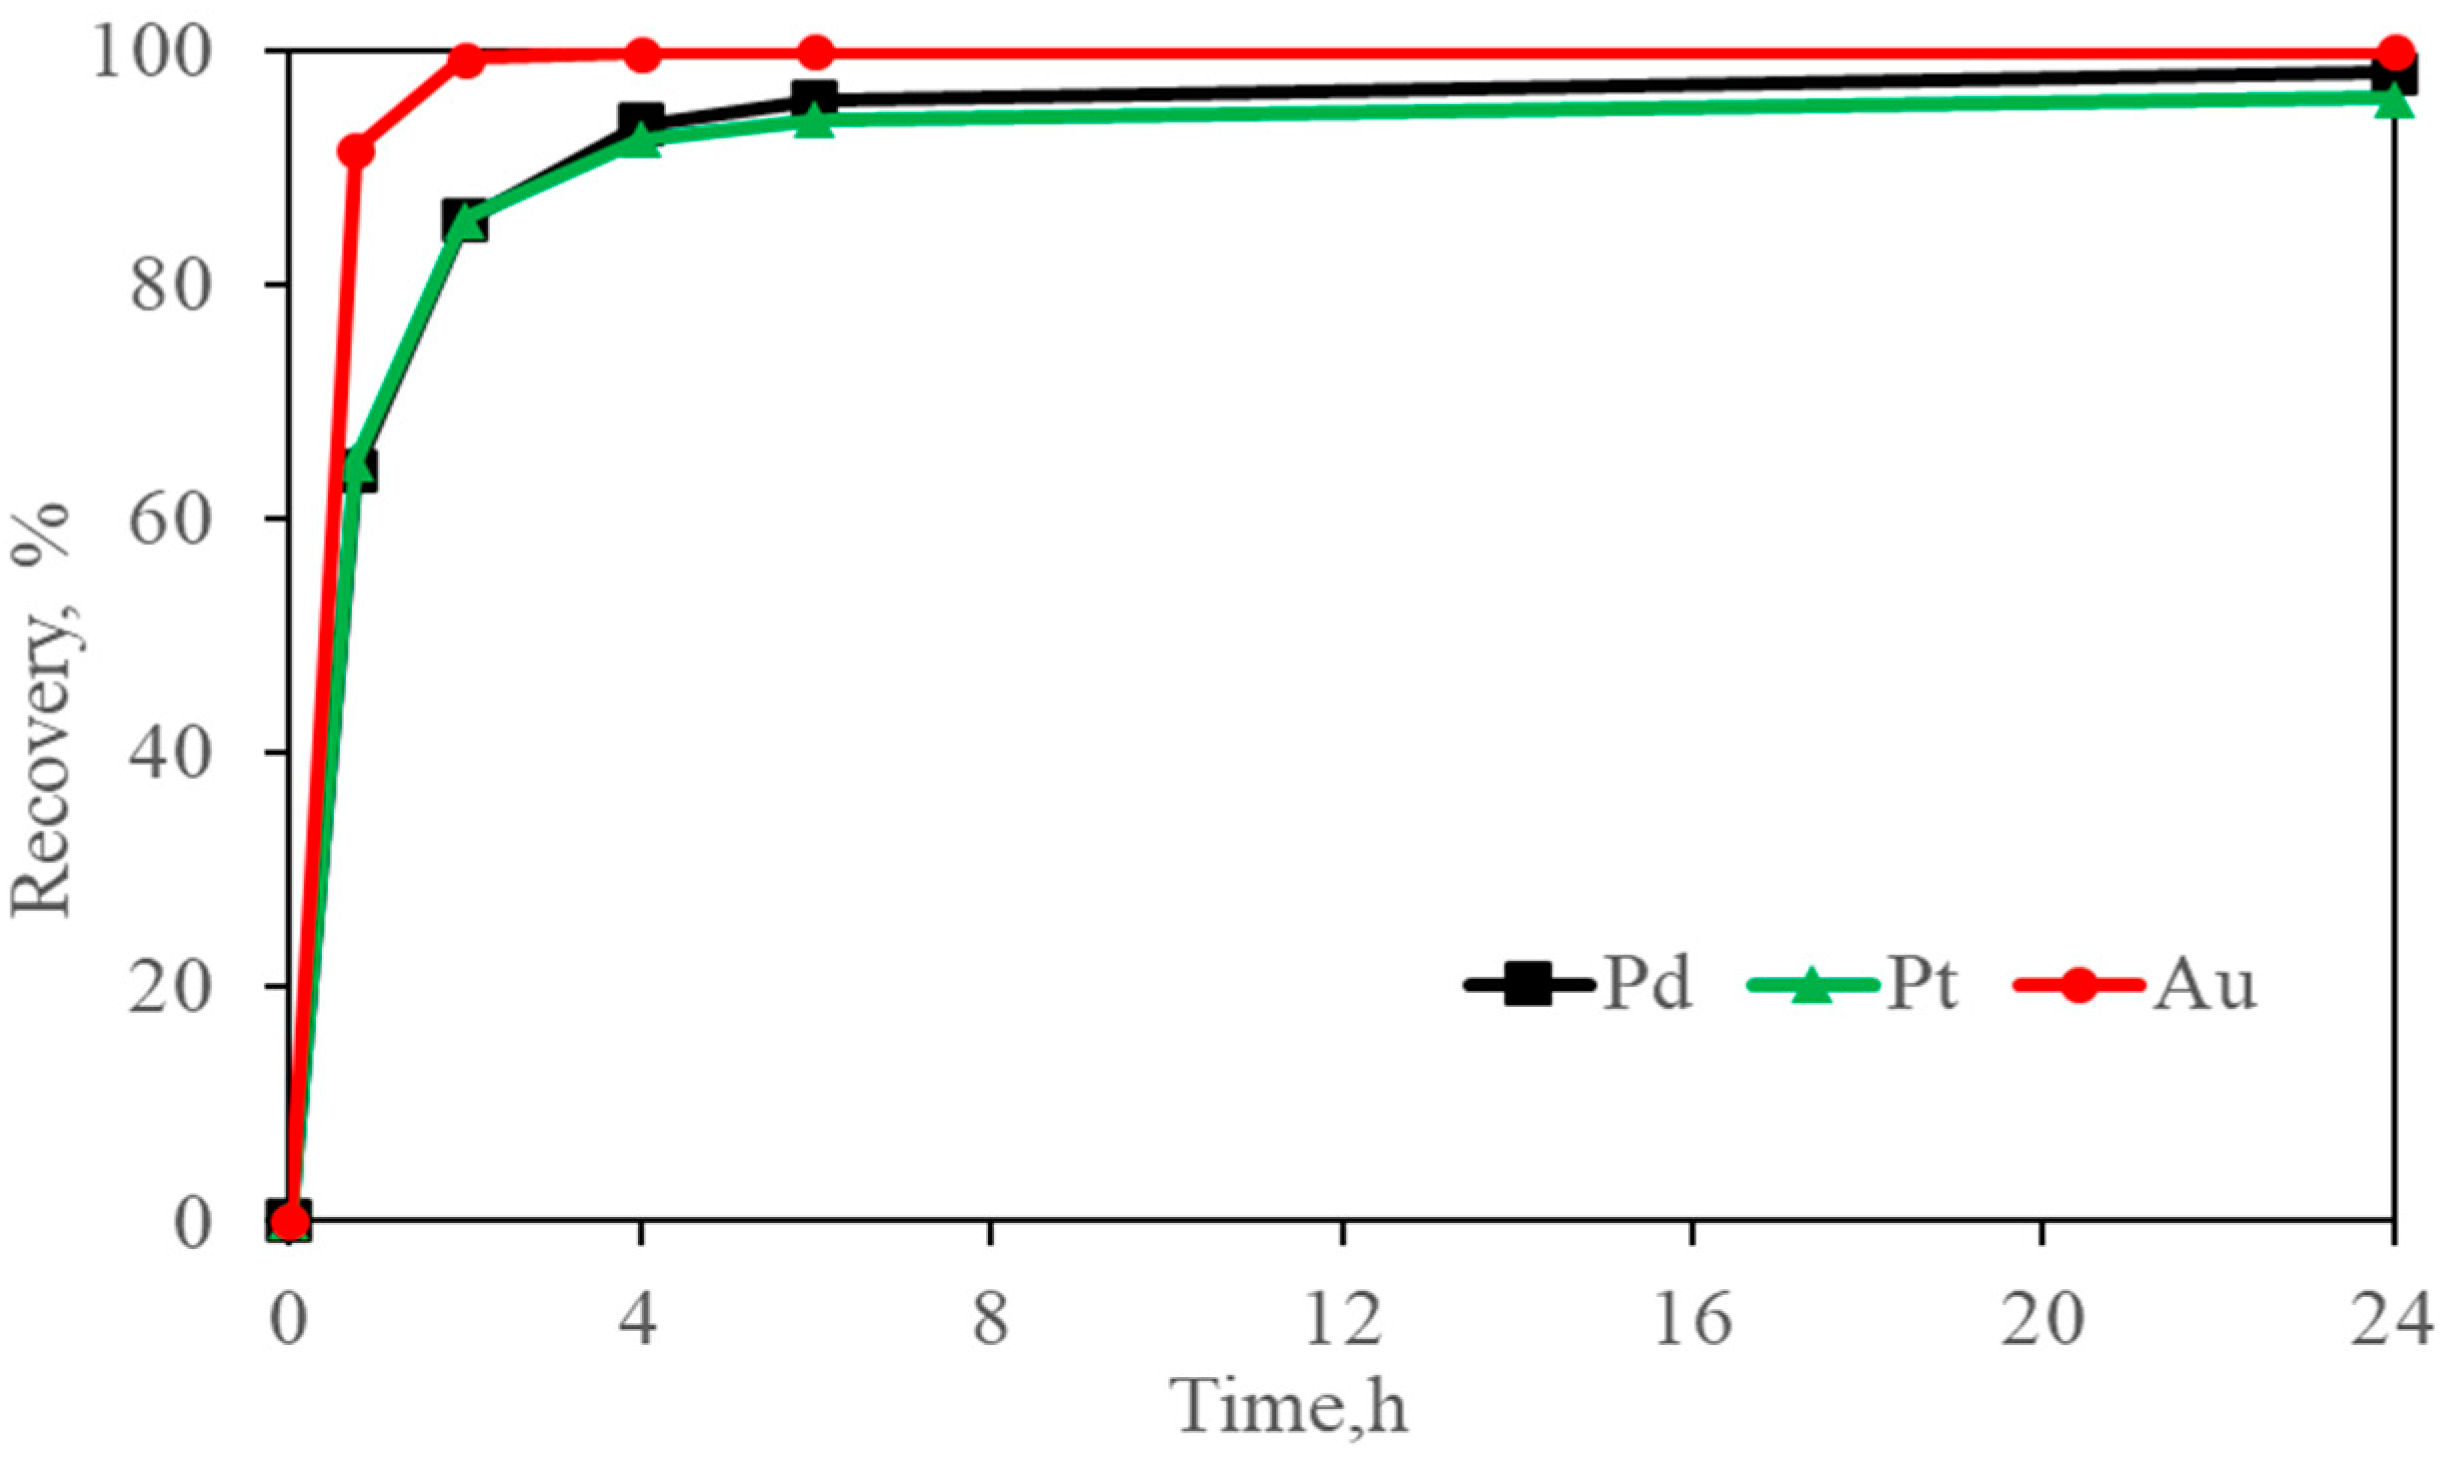
Figure 12.
Platinum, palladium, and gold adsorption using activated carbon from Gly-CN solutions. Standard Conditions: Pt = 2.5 mg/L, Pd = 5 mg/L, Au = 5.5 mg/L, [CN] = 300 mg/L, [Gly] = 3000 mg/L, pH = 10.5, carbon dosage = 10 g/L, and ambient temperature (24 °C).
Figure 12.
Platinum, palladium, and gold adsorption using activated carbon from Gly-CN solutions. Standard Conditions: Pt = 2.5 mg/L, Pd = 5 mg/L, Au = 5.5 mg/L, [CN] = 300 mg/L, [Gly] = 3000 mg/L, pH = 10.5, carbon dosage = 10 g/L, and ambient temperature (24 °C).
Table 1.
Granulometric specifications (particle size distribution) of the fresh activated carbon.
Table 1.
Granulometric specifications (particle size distribution) of the fresh activated carbon.
| Screen Aperture (mm) | +3.35 | +2.80 | +2.36 | +2.00 | +1.70 | +1.40 | +1.00 | −1.00 | Total | D50, mm |
|---|
| % weight retained (Haycarb YAO 60) | 2.4 | 22.6 | 41.0 | 27.2 | 6.2 | 0.4 | 0 | 0.1 | 100 | 2.6 |
Table 2.
Characterization of the synthetic 1 L glycine–cyanide stock solution.
Table 2.
Characterization of the synthetic 1 L glycine–cyanide stock solution.
| Parameters | Conditions | Unit |
|---|
| [Pt] | 241.5 | mg/L |
| pH | 10.5 | |
| [Gly] | 30,000 | mg/L |
| [CN] | 3000 | mg/L |
Table 3.
Summary of parameters and conditions to test Pt adsorption.
Table 3.
Summary of parameters and conditions to test Pt adsorption.
| Parameters | Conditions | Unit |
|---|
| Carbon dosage | 5–10 *–20 | g/L |
| Temperature | 24 *–35–55 | °C |
| pH | 9.5–10.5 *–11.5 | |
| [Pt] | 2–5 *–10 | mg/L |
| [Gly] | 1000–3000 *–5000 | mg/L |
| [CN] | 100–300 *–500 | mg/L |
Table 4.
Kinetic model parameters determined at varying carbon dosages.
Table 4.
Kinetic model parameters determined at varying carbon dosages.
| Kinetic Model | Parameters | Carbon Dosage (g/L) |
|---|
| 10 | 20 |
|---|
| Pseudo-first order | Qe, Cal (mg/g) | 0.14 | 0.03 |
| | K1, (h−1) | 0.18 | 0.24 |
| | R2 | 0.82 | 0.63 |
| Pseudo-second order | Qe, Exp (mg/g) | 0.48 | 0.25 |
| | Qe, Cal (mg/g) | 0.48 | 0.25 |
| | K2 (g/mg×h) | 7.82 | 55.02 |
| | R2 | 0.99 | 0.99 |
Table 5.
Kinetic model parameters determined at various temperatures.
Table 5.
Kinetic model parameters determined at various temperatures.
| Kinetic Model | Parameters | T (°C) |
|---|
| 24 | 35 | 55 |
|---|
| Pseudo-first order | Qe, Cal (mg/g) | 0.14 | 0.10 | 0.17 |
| | K1, (h−1) | 0.18 | 0.22 | 0.12 |
| | R2 | 0.82 | 0.88 | 0.50 |
| Pseudo-second order | Qe, Exp (mg/g) | 0.48 | 0.47 | 0.36 |
| | Qe, Cal (mg/g) | 0.48 | 0.47 | 0.35 |
| | K2, (g/mg×h) | 7.82 | 7.77 | 7.61 |
| | R2 | 0.99 | 0.99 | 0.99 |
Table 6.
Kinetic model parameters determined at different pHs.
Table 6.
Kinetic model parameters determined at different pHs.
| Kinetic Model | Parameters | pH |
|---|
| 9.5 | 10.5 | 11.5 |
|---|
| Pseudo-first order | Qe, Cal (mg/g) | 0.12 | 0.14 | 0.17 |
| | K1, (h−1) | 0.11 | 0.18 | 0.13 |
| | R2 | 0.52 | 0.82 | 0.77 |
| Pseudo-second order | Qe, Exp (mg/g) | 0.50 | 0.48 | 0.48 |
| | Qe, Cal (mg/g) | 0.49 | 0.48 | 0.48 |
| | K2, (g/mg×h) | 9.49 | 7.82 | 5.14 |
| | R2 | 0.99 | 0.99 | 0.99 |
Table 7.
Kinetic model parameters determined at different Pt concentrations.
Table 7.
Kinetic model parameters determined at different Pt concentrations.
| Kinetic Model | Parameters | Pt (mg/L), t = 0 |
|---|
| 2 | 5 | 10 |
|---|
| Pseudo-first order | Qe, Cal (mg/g) | 0.05 | 0.14 | 0.33 |
| | K1, (h−1) | 0.10 | 0.18 | 0.13 |
| | R2 | 0.52 | 0.82 | 0.75 |
| Pseudo-second order | Qe, Exp (mg/g) | 0.20 | 0.48 | 0.97 |
| | Qe, Cal (mg/g) | 0.19 | 0.48 | 0.97 |
| | K2, (g/mg×h) | 24.26 | 7.82 | 2.74 |
| | R2 | 0.99 | 0.99 | 0.99 |
Table 8.
Kinetic model parameters determined at different glycine (Gly) concentrations.
Table 8.
Kinetic model parameters determined at different glycine (Gly) concentrations.
| Kinetic Model | Parameters | Gly (mg/L) |
|---|
| 1000 | 3000 | 5000 |
|---|
| Pseudo-first order | Qe, Cal (mg/g) | 0.15 | 0.14 | 0.12 |
| | K1, (h−1) | 1.40 | 0.18 | 0.13 |
| | R2 | 0.71 | 0.82 | 0.62 |
| Pseudo-second order | Qe, Exp (mg/g) | 0.49 | 0.48 | 0.49 |
| | Qe, Cal (mg/g) | 0.49 | 0.48 | 0.49 |
| | K2, (g/mg×h) | 6.89 | 7.82 | 9.48 |
| | R2 | 1.00 | 1.00 | 1.00 |
Table 9.
Kinetic model parameters determined at different cyanide concentrations.
Table 9.
Kinetic model parameters determined at different cyanide concentrations.
| Kinetic Model | Parameters | Gly (mg/L) |
|---|
| 1000 | 3000 | 5000 |
|---|
| Pseudo-first order | Qe, Cal (mg/g) | 0.12 | 0.14 | 0.13 |
| | K1, (h−1) | 0.16 | 0.18 | 0.12 |
| | R2 | 0.72 | 0.82 | 0.63 |
| Pseudo-second order | Qe, Exp (mg/g) | 0.49 | 0.48 | 0.49 |
| | Qe, Cal (mg/g) | 0.49 | 0.48 | 0.48 |
| | K2, (g/mg×h) | 9.23 | 7.82 | 8.89 |
| | R2 | 0.99 | 0.99 | 0.99 |
Table 10.
Isotherm parameters for Pt adsorption at different initial Pt concentrations.
Table 10.
Isotherm parameters for Pt adsorption at different initial Pt concentrations.
| | Langmuir Parameters | Freundlich Parameters |
|---|
| [Pt] | KL | RL | Qm | R2 | Kf | n | R2 |
|---|
| (mg/L), t = 0 | (L/mg) | (mg/g) | (mg/g)/(mg/L)1/n |
|---|
| 2 | 0.54 | 0.01 | 5.31 | 0.96 | 1.23 | 1.47 | 0.95 |
| 5 | 0.63 | 0.01 | 4.52 | 0.99 | 1.41 | 1.51 | 0.98 |
| 10 | 0.51 | 0.01 | 4.47 | 0.99 | 1.26 | 1.92 | 0.94 |
Table 11.
Anova analysis of experimental data (kinetic test).
Table 11.
Anova analysis of experimental data (kinetic test).
| Source | Sum of Squares | df | Mean Square | F-Value | p-Value | |
|---|
| Model | 4965.58 | 12 | 413.80 | 4633.54 | <0.0001 | Significant |
| Glycine | 0.04 | 1 | 0.0367 | 0.41 | 0.52 | Not significant |
| Cyanide | 1.78 | 1 | 1.78 | 19.97 | <0.0001 | Significant |
| pH | 35.18 | 1 | 35.18 | 393.96 | <0.0001 | Significant |
| Initial Pt conc. | 1.06 | 1 | 1.06 | 11.82 | 0.0010 | Significant |
| Carbon dosage | 115.13 | 1 | 115.13 | 1289.15 | <0.0001 | Significant |
| Temperature | 2603.27 | 1 | 2603.27 | 29,150.30 | <0.0001 | Significant |
| Residual | 5.89 | 66 | 0.09 | | | |
| Lack of fit | 0.05 | 1 | 0.05 | 0.54 | 0.47 | Not significant |
| Pure error | 5.85 | 65 | 0.09 | | | |
| R-squared | | | | | | 0.99 |
