Article

Vapor Liquid Equilibrium Measurement and Distillation Simulation for Azeotropic Distillation Separation of H2O/EM Azeotrope

1
National-Local Joint Engineering Laboratory for Energy Conservation in Chemical Process Integration and Resources Utilization, School of Chemical Engineering and Technology, Hebei University of Technology, Tianjin 300130, China
2
College of Basic Science, Tianjin Agricultural University, Tianjin 300392, China
*
Authors to whom correspondence should be addressed.
Separations 2025, 12(10), 273; https://doi.org/10.3390/separations12100273
Submission received: 8 September 2025 / Revised: 27 September 2025 / Accepted: 6 October 2025 / Published: 8 October 2025
(This article belongs to the Special Issue Green Separation and Purification Technology)

Abstract

Since H2O and Ethylene Glycol Monomethyl Ether (EM) form a minimum-boiling azeotrope, 1-pentanol, 1-hexanol, and 1-heptanol are selected as entrainers to separate the azeotropic mixture (H2O/EM) using azeotropic distillation. The binary vapor liquid equilibrium (VLE) data were determined at 101.3 kPa, including H2O/EM, EM/1-pentanol, EM/1-hexanol, EM/1-heptanol, H2O/1-pentanol, H2O/1-hexanol and H2O/1-heptanol. Meanwhile, the Herington area test was used to validate the thermodynamic consistency of the experimental binary data. The VLE data for the experimental binary system were analyzed using the NRTL, UNIQUAC, and Wilson activity coefficient models, showing excellent agreement between predictions and measurements. Finally, molecular simulations were employed to calculate interaction energies between components, providing insights into the VLE behavior. The azeotropic distillation process was simulated using Aspen Plus to evaluate the separation performance and determine the optimal operating parameters. Therefore, this study provides guidance and a foundational basis for the separation of H2O/EM systems at 101.3 kPa.

1. Introduction

EM, also known as methyl cellosolve, is an important chemical raw material [1], Due to the presence of both hydrophobic and hydrophilic functional groups in this compound, it is widely utilized in diverse industrial and commercial applications, including household products, paints, inks [2], coatings, cleaning solutions and biochemical applications [1,3]. Since the H2O/EM system forms a completely miscible binary azeotrope, specialized distillation methods must be employed for separation, including extractive distillation [4,5], azeotropic distillation [6,7], and salting-out distillation [8]. In this study, 1-pentanol, 1-hexanol, and 1-heptanol were selected as azeotropic agents to separate the H2O/EM azeotropic mixture. The advantages of azeotropic distillation in this separation process lie in its ability to break azeotropic limitations, technological maturity, and high purity of the final product. Compared to alternative technologies such as extraction and membrane separation, azeotropic distillation demonstrates strong competitiveness due to its reliability and high product purity.
Currently, there are no experimental reports on VLE data for entrainer screening in the H2O/EM azeotropic system. To separate the azeotropic mixture using azeotropic distillation and selected entrainers, binary isobaric VLE data for the systems are required (H2O/EM, EM/1-pentanol, EM/1-hexanol, EM/1-heptanol, H2O/1-pentanol, H2O/1-hexanol and H2O/1-heptanol). Numerous studies have reported binary VLE data for the H2O/EM azeotropic system. Bejarano [9] studied the system under varying pressures (74.5 kPa, 101.3 kPa, and 134.0 kPa). Ochi K [10] reported data for the H2O/1-hexanol system under the 101.3 kPa, Krishnaiah reported the vapor liquid equilibrium data for EM/1-pentanol at 40 kPa and 95 kPa [11], and in NIST, there are binary VLE data for H2O/1-pentanol at 101.3 kPa. Notably, the NIST database currently lacks data for the following binary systems at 101.3 kPa (EM/1-pentanol, EM/1-hexanol, EM/1-heptanol, and H2O/1-heptanol).
In this work, binary VLE data were measured at 101.3 kPa for the following systems (H2O/EM, EM/1-pentanol, EM/1-hexanol, EM/1-heptanol, H2O/1-pentanol, H2O/1-hexanol and H2O/1-heptanol). The measured binary VLE data were validated for thermodynamic consistency using the Herington area test [12]. The experimental data were correlated with the Non-Random Two-Liquid (NRTL) [13], Universal Quasi-Chemical (UNIQUAC) [14], and Wilson activity coefficient models [15,16]. The azeotropic distillation process was simulated using Aspen Plus to evaluate the separation performance and determine the optimal operating parameters.

2. Experiment

2.1. Chemicals

A summary of the data for these chemicals is given in Table 1. All chemicals used in this study were used without further purification.

2.2. Apparatus and Experimental Procedure for VLE Data Collection

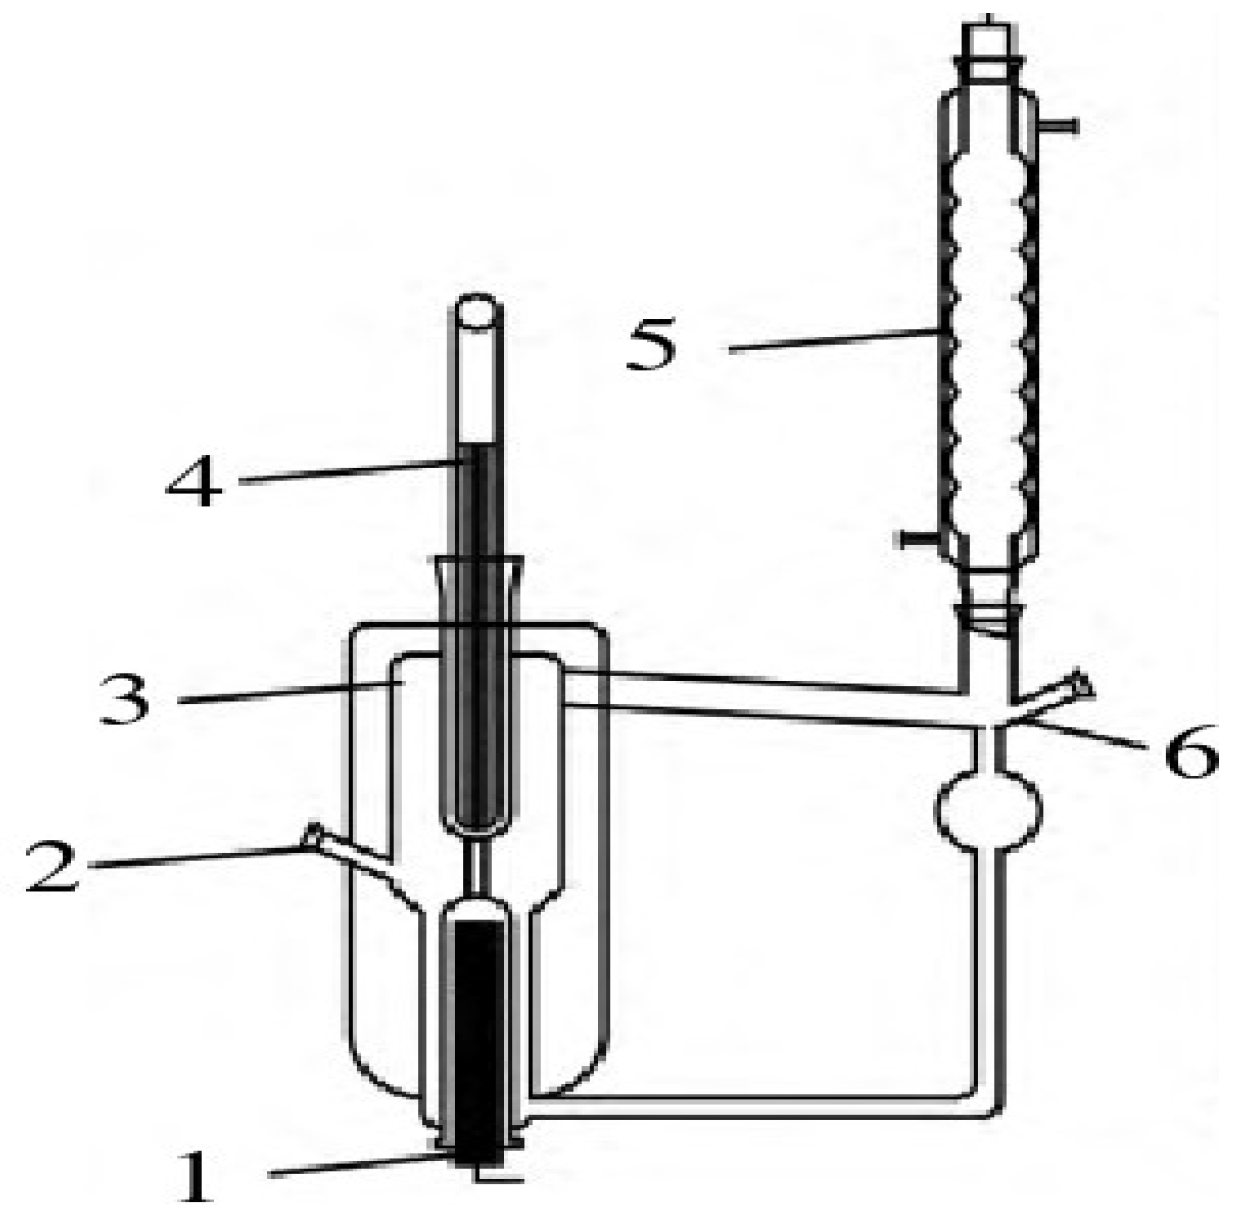
The binary VLE data were determined using a modified Othmer distill [17,18], As shown in Figure 1. The effectiveness of the entire experimental setup was validated through previously conducted and published studies [19]. Prior to the experiments, the temperature and pressure measurement system of the Othmer boiling point apparatus was calibrated using a standard substance (H2O). Subsequently, standard samples of known concentration were prepared, and a GC analytical calibration curve was established. VLE experiments were then conducted for verification to ensure the reliability of the experimental setup. As seen in Figure 2, the experimental data show good agreement with literature values [9] under comparable conditions, providing an independent validation of existing data. The experimental data will be further fitted in the following sections.
During measurements, temperature fluctuations of the mixture remained within 0.10 K over approximately 100 min, confirming the attainment of equilibrium. In the procedure, the mixture in the equilibrium still was heated at the bottom to generate vapor, which was then condensed in a spherical condenser. The condensed liquid flowed back into the still, where it was reheated to boiling, cycling repeatedly until equilibrium was achieved. After the system stabilized at equilibrium, liquid-phase and vapor-phase samples were extracted using microsyringes for chromatographic analysis.

2.3. Experimental Procedures

The vapor-phase and liquid-phase samples were analyzed by gas chromatography (GC), with an injection volume of 0.4 μL for each analysis. The gas chromatographic analytical conditions are listed in Table 2.

2.4. Molecular Simulation Methods

As a pivotal computational method, molecular simulation uncovers the fundamental properties and dynamic processes of substances at the atomic level, providing crucial insights into mechanisms that underpin material behavior and complementing experimental observations. Its essence lies in reconstructing the dynamic processes of the microscopic world through mathematical models and algorithms. Molecular modeling facilitates the simulation of experimentally inaccessible information, including inter-molecular interactions and molecular dynamics trajectories. This method has been applied to studies of adsorption processes [20,21], crystallization processes [22,23], and phase equilibrium processes [24,25]. Interaction energies among system components can be quantified using molecular simulations that employ density functional theory.
The theoretical quantum chemical calculations were performed using the Gaussian 16 software package. Geometry optimization and subsequent vibrational frequency calculations for the studied complexes were performed at the B3LYP-D3BJ/TZVP level. The optimized geometries were established as local minima on the potential energy surface (PES) through vibrational frequency analysis, which confirmed the absence of imaginary frequencies, thereby excluding saddle points or transition states. The B3LYP-D3BJ/TZVP [26] level of theory has been widely validated as a reliable approach for predicting molecular electrostatic potentials and solvation surface charge distributions. All quantum chemical calculations in this study were performed under gas-phase conditions. While this method efficiently provides molecular electronic structures and optimized geometries, it is crucial to emphasize its inherent limitation: it does not account for solvation effects in liquid-phase environments. The interaction energy (denoted as Einter), a fundamental measure of binding affinity in the optimized complexes, was evaluated according to the standard definition [25]. It is calculated as the energy difference between the complex and its constituent monomers at their optimized geometries within the complex (Equation (1)) [26]:
E i n t e r   =   E A B     E A     E B   .
Among them, EAB, EA, and EB represent the total energies of the complex (A+B), monomer A, and monomer B, respectively. The energy mixing (ΔE) is related to the overheating enthalpy, which can be defined as the difference between the interaction energy of mixed molecules and the interaction energy of pure components. To model the energetic consequences of intermolecular interactions upon mixing, Equation (2) provides the fundamental framework for computing the system’s energy perturbation:
Δ E   =   2 E A B     E A A     E B B .
If the calculated value of ΔE is zero, the system is considered athermal (ideal mixing). If there is a significant deviation from zero, it indicates a greater deviation from ideality.

3. Experimental Results and Discussion

3.1. VLE Data of Binary Systems

Under low-pressure or medium-pressure conditions, the expressions for VLE [27,28] are as follows:
γ i = P y i P i s x i .
Among them, xi and yi represent the mole fractions of component i in the liquid and vapor phases, respectively, P denotes the system pressure, and Pis is the saturation vapor pressure of pure component i, which can be calculated using the Extended Antoine Equation [29] from Aspen V12 Plus. Compared to the standard Antoine equation [30], the additional parameters introduced in the Extended Antoine Equation enhance its flexibility and allow it to describe the entire vapor pressure curve. Table 3 lists the Antoine parameters for C1 to C9. Extended Antoine Equation Calculation:
l n p i = C 1 i + C 2 i T + C 3 i + C 4 i + C 5 i l n T + C 6 i T C 7 i f o r   C 8 i T C 9 i .
Among them, T (K) represents the system temperature, and P (kPa) denotes the system pressure. Based on the calculations using the above formulas and parameters, Table 4, Table 5, Table 6, Table 7, Table 8, Table 9 and Table 10 present the experimentally obtained binary VLE data and activity coefficients (γi). As observed in Table 8, Table 9 and Table 10, activity coefficients (γ) exhibit abnormally high values in some cases. This can be attributed to the significant difference between the strong hydrogen bonding among H2O molecules and the pronounced hydrophobicity of the long alkyl chain of alcohol molecules. This leads directly to highly non-ideal behavior in the liquid phase and a strong tendency for liquid-phase splitting (partial miscibility). In dilute aqueous solutions, alcohol molecules exhibit extremely high fugacity, indicating a substantial tendency to “escape” from the liquid phase, which is reflected as activity coefficients γ >> 1.

3.2. Thermodynamic Consistency Test for the Experimental Data (Herington Integral Method)

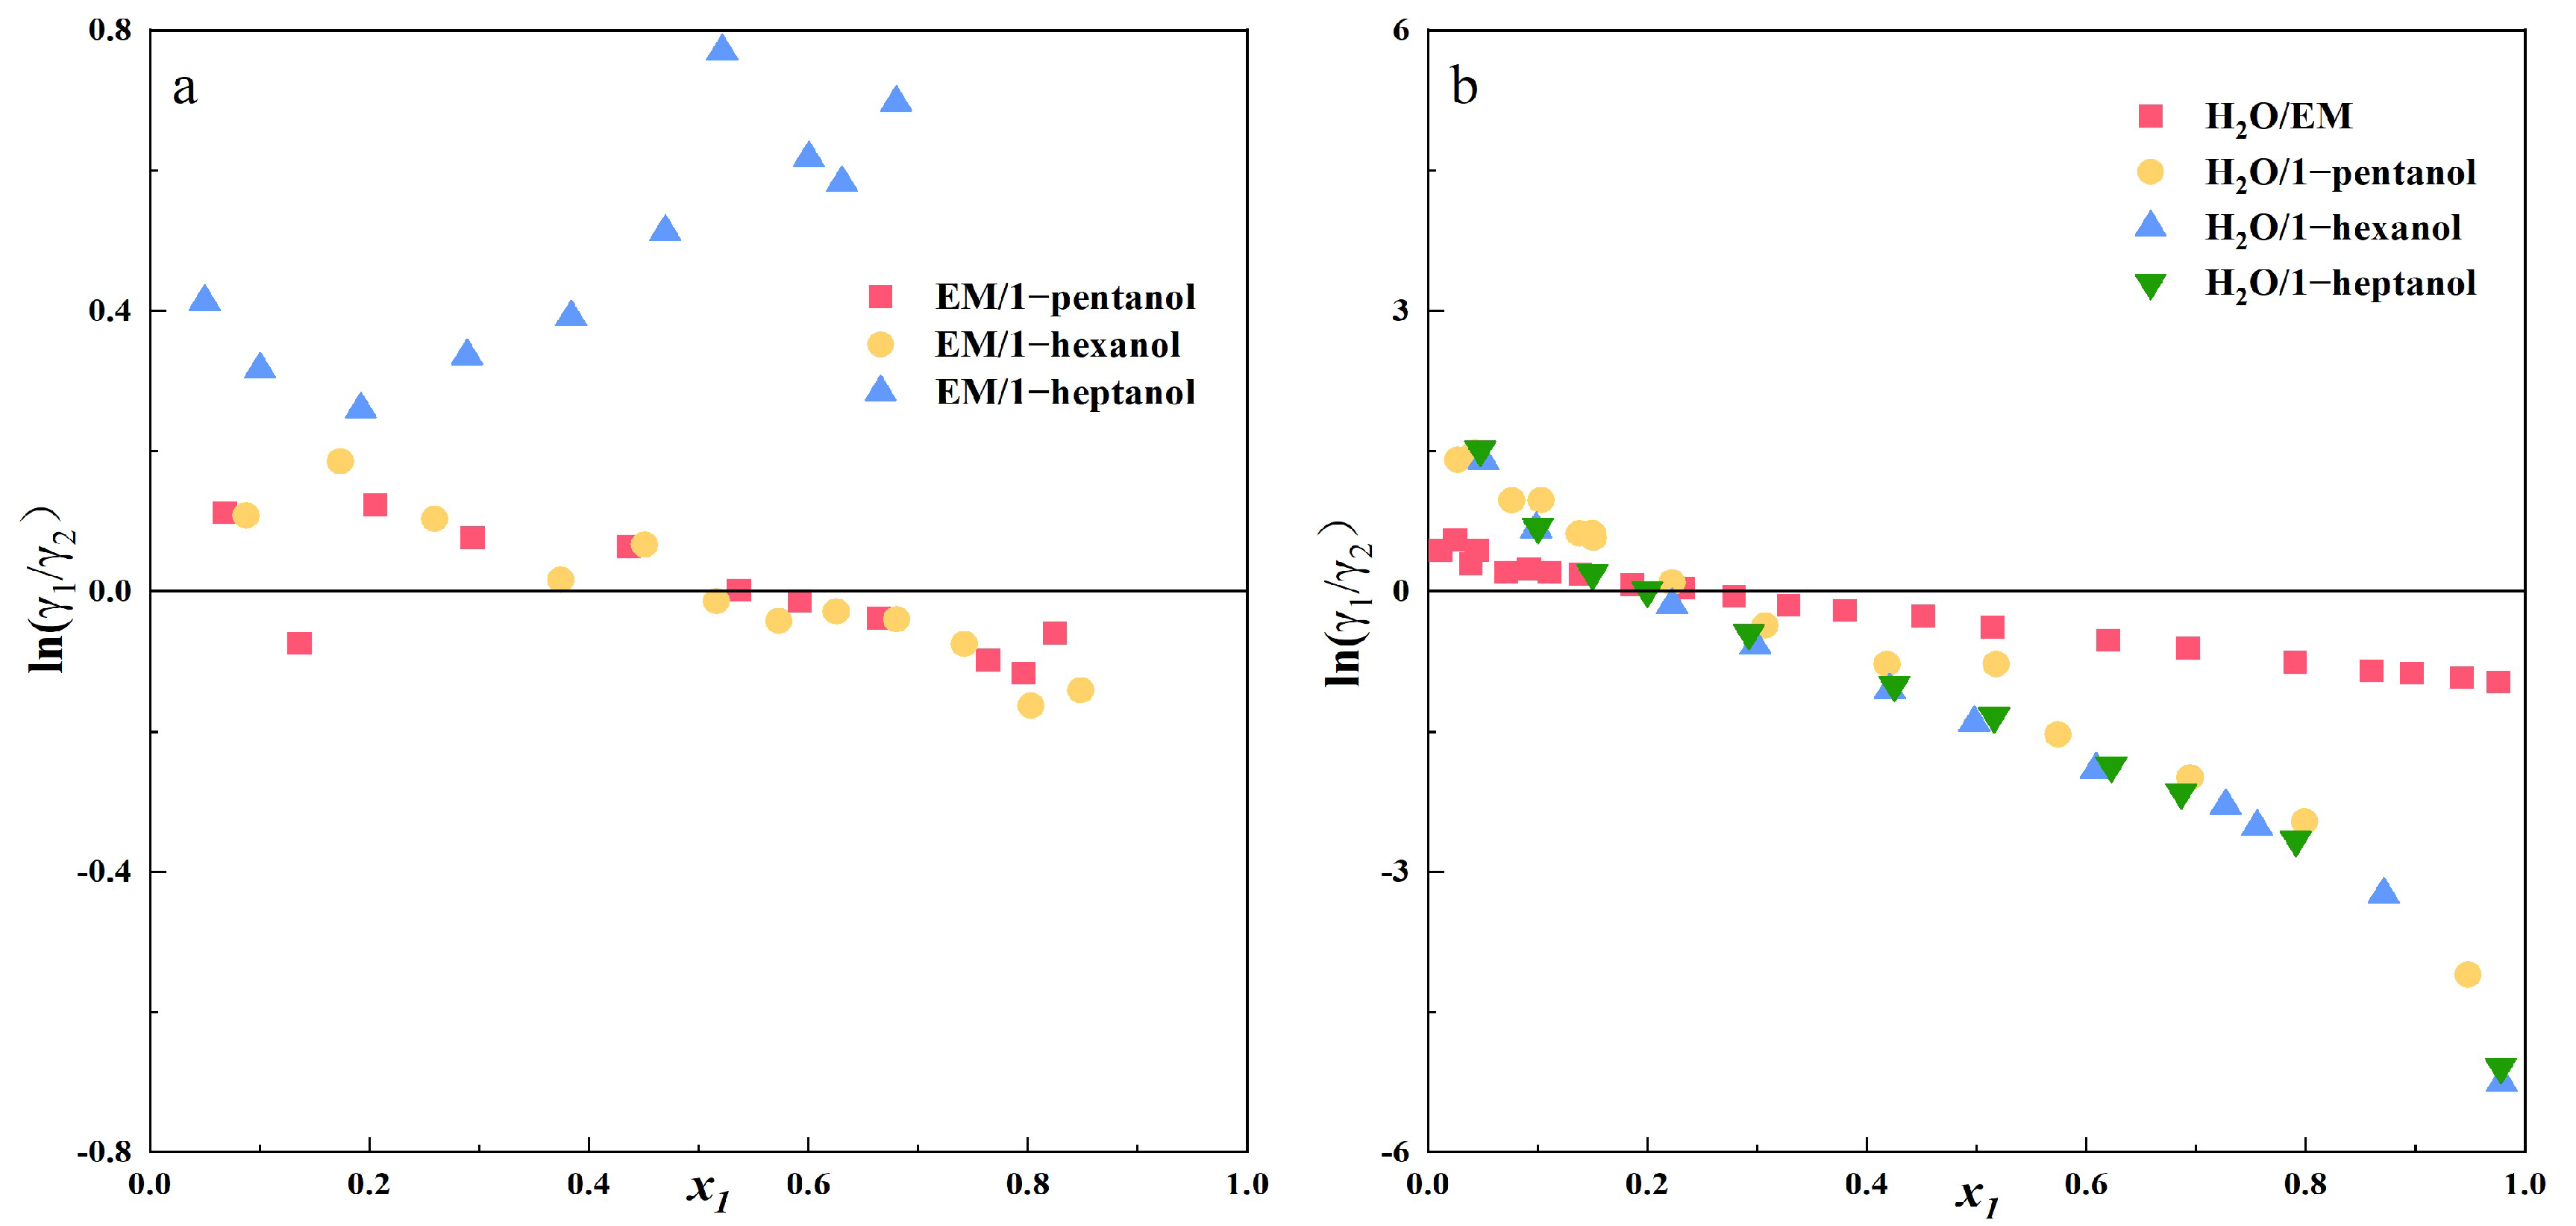
To ensure the accuracy and reliability of the measured VLE data, thermodynamic consistency tests must be performed on the experimental data. Common methods include the integral test, differential test, and slope method. To assess adherence to the Gibbs-Duhem equation, the thermodynamic consistency of the experimental phase equilibrium data was rigorously evaluated via Herington area test [31]. The Herington method is a semi-empirical approach that involves plotting x1 against ln(γ1/γ2) (as shown in Figure 3) and defining and examining the relationship between D and J. The specific steps are as follows:
D = x i = 0 x i = 1 l n γ 2 γ 1 d x i x i = 0 x i = 1 l n γ 2 γ 1 d x i × 100 ,
J = 150 × T m a x T m i n T m i n .
Among them, Tmax (K) corresponds to the maximum temperature of the system. Tmin (K) corresponds to the minimum temperature of the system.
The calculation results are presented in Table 11DJ represents the criterion for evaluating thermodynamic consistency using the Herington integral test method. If |DJ| < 10, the data exhibits reasonable reliability. As shown in Table 11, the measured VLE data for the binary system demonstrate reliable consistency.

3.3. Correlation of Binary VLE Data

To validate experimental data, the VLE data obtained from experiments were correlated using the NRTL, UNIQUAC, and Wilson activity coefficient models, which appear in Equations (7)–(9). The calculated correlated binary interaction parameters are listed in Table 12, and a comparison between experimental and predicted data is shown in Figure 4. To quantify model prediction fidelity, root mean square deviations (RMSD) of vapor-phase mole fractions and equilibrium temperatures were computed via Equations (10) and (11), serving as key metrics for thermodynamic model validity.
NRTL:
l n γ i = j = 1 n x j i G j i x j k = 1 n G k i x k + j = 1 n x j G i j k = 1 n G k j x k τ i j l = 1 n τ l j G l j x l k = 1 n G k j x k ,
where τ i j = a i j + b i j T ; G i j = e x p ( α i j τ i j ) .
UNIQUAC:
l n γ i = l n ϕ i x i + z 2 q i l n θ i ϕ i + l i + ϕ i x i j = 1 n x j l j + q i t 1 l n t i t j = 1 n θ j τ i j t j t ,
where τ i j = e x p a i j + b i j T .
Wilson:
l n γ i = 1 l n j = 1 n A i j x j k = 1 n x k A k i j = 1 n A k j x j ,
where A i j = a i j + b i j T .
RMSD y i = i N y i , exp y i , cal 2 N  
RMSD ( T i ) = i N T i , exp T i , cal 2 N  
The experimental results indicate that the investigated H2O–long-chain alcohol system exhibits highly non-ideal behavior. During the correlation process, although the NRTL model demonstrated the best correlation accuracy within the experimental data range, the optimized binary interaction parameters exhibited abnormally large absolute values. This clearly reveals the inherent mathematical limitations of local composition models in describing such extremely non-ideal systems characterized by strong asymmetry and a tendency for liquid-phase splitting. These abnormal parameters likely result from over-parameterization, where the model forces a perfect fit to a limited dataset, leading to physically meaningless values. Consequently, the obtained model parameters should be used strictly for interpolation within the experimental data range. Extrapolation for predictions is strongly discouraged, as it would yield unreliable results.
As indicated by the binary correlated interaction parameters and root mean square deviations (RMSD) listed in the table, all three activity coefficient models can satisfactorily correlate the H2O/EM system. The figure demonstrates that each model is capable of describing this thermodynamic system with reasonable accuracy. Moreover, 1-pentanol, 1-hexanol, and 1-heptanol are all able to break the azeotropic system of H2O/EM. Data indicate that the mass fractions of H2O in their azeotropes with water are approximately 56%, 68%, and 83%, respectively.
From the experimental data, the azeotropic temperature of H2O and EM is 99.9 °C, and the boiling point of the new azeotrope formed by the azeotrope and H2O should be lower than that of the original azeotrope, while the temperature difference between the new azeotrope formed by 1-hexanol and 1-heptanol and H2O is too small compared with the original azeotropic temperature, which will cause separation difficulties. Secondly, the larger the proportion of H2O in the azeotropic composition, the less azeotropic dose required to remove the H2O from the system, that is, the less separation load, which is more conducive to reducing the energy consumption of the subsequent distillation column. It can be seen from Table 13 that the azeotropic composition of the three azeotropic agents accounts for a large proportion of H2O. In summary, 1-pentanol is the best choice among the three azeotropes.

3.4. Molecular Interaction Simulation

Molecular interaction energy simulations depicted in Figure 5 enabled the calculation of ΔE via Equation (2), yielding values of −6.348 kJ/mol for H2O/EM, 3.058 kJ/mol for EM/1-pentanol, 3.115 kJ/mol for EM/1-hexanol, 3.162 kJ/mol for EM/1-heptanol, −4.691 kJ/mol for H2O/1-pentanol, −4.701 kJ/mol for H2O/1-hexanol, and −4.694 kJ/mol for H2O/1-heptanol. Systems exhibiting negative deviations (H2O/EM, H2O/1-pentanol, H2O/1-hexanol, and H2O-1-heptanol; all ΔE < 0) corresponded to minimum H2O activity coefficients of 0.9962, 0.6867, 0.7580. Conversely, systems showing positive deviations (EM/1-pentanol, EM/1-hexanol, and EM/1-heptanol; all ΔE > 0) displayed maximum EM activity coefficients of 1.1857, 1.2116. Critically, these molecular simulation outcomes demonstrate quantitative consistency with experimental VLE data across all investigated systems.

4. Separation of H2O/EM via Azeotropic Distillation

4.1. Process Flow

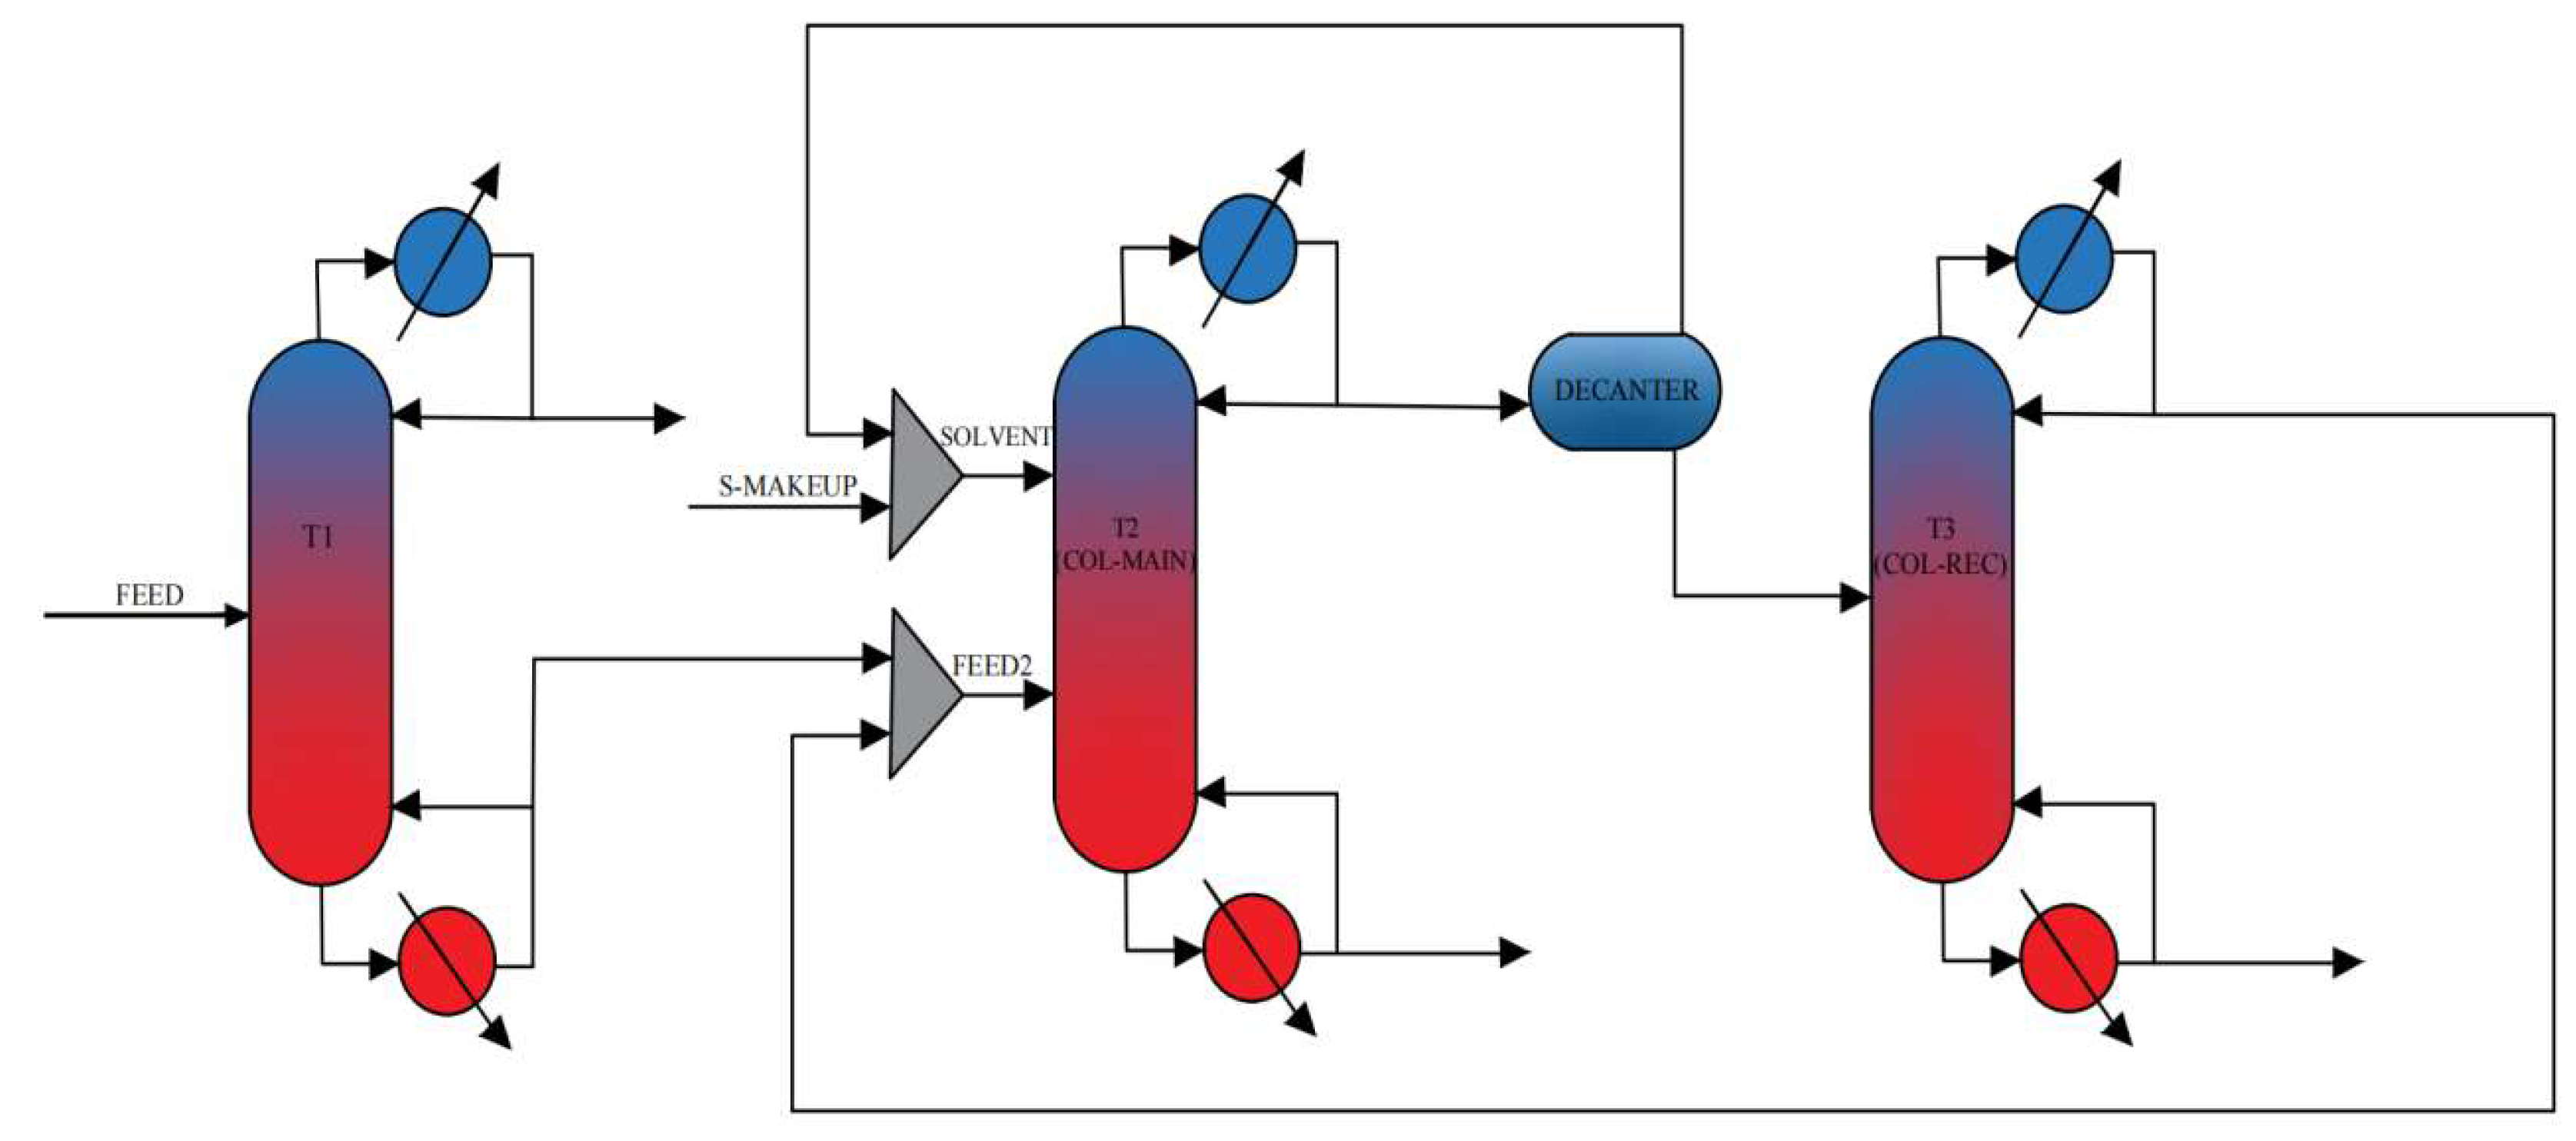
To verify the feasibility of the selected entrainer for the separation, a process flow simulation was conducted. The wastewater from a pesticide plant contains 88 wt% H2O, 10 wt% methyl cellosolve, and 2 wt% methanol. The simulated process flow is shown in Figure 6. With a feed flow rate of 1000 kg/h, the stream first enters T1, the light-ends removal column. The primary objective of T1 is to remove the light component (methanol) from the feedstock, with the distillate obtaining the light component at a mass fraction ≥ 0.999. The bottom mixture then proceeds to T2, the azeotropic distillation column (COL-MAIN). Here, under the influence of the entrainer 1-pentanol, H2O is entrained and carried overhead. This overhead vapor is condensed and separated in a decanter (DECANTER). The upper organic phase, primarily consisting of n-pentanol, is returned to the azeotropic distillation column, with any lost entrainer being replenished. The lower aqueous phase enters the solvent recovery column (COL-REC). The bottom product from COL-REC is methyl cellosolve with a mass fraction ≥ 0.999. Simultaneously, the bottom stream of the solvent recovery column (COL-REC) produces H2O with a mass fraction ≥ 0.999, while its distillate is an azeotropic mixture of H2O and the entrainer. This distillate is subsequently recycled back to the azeotropic distillation column (COL-MAIN) for reuse.

4.2. Process Parameter Optimization

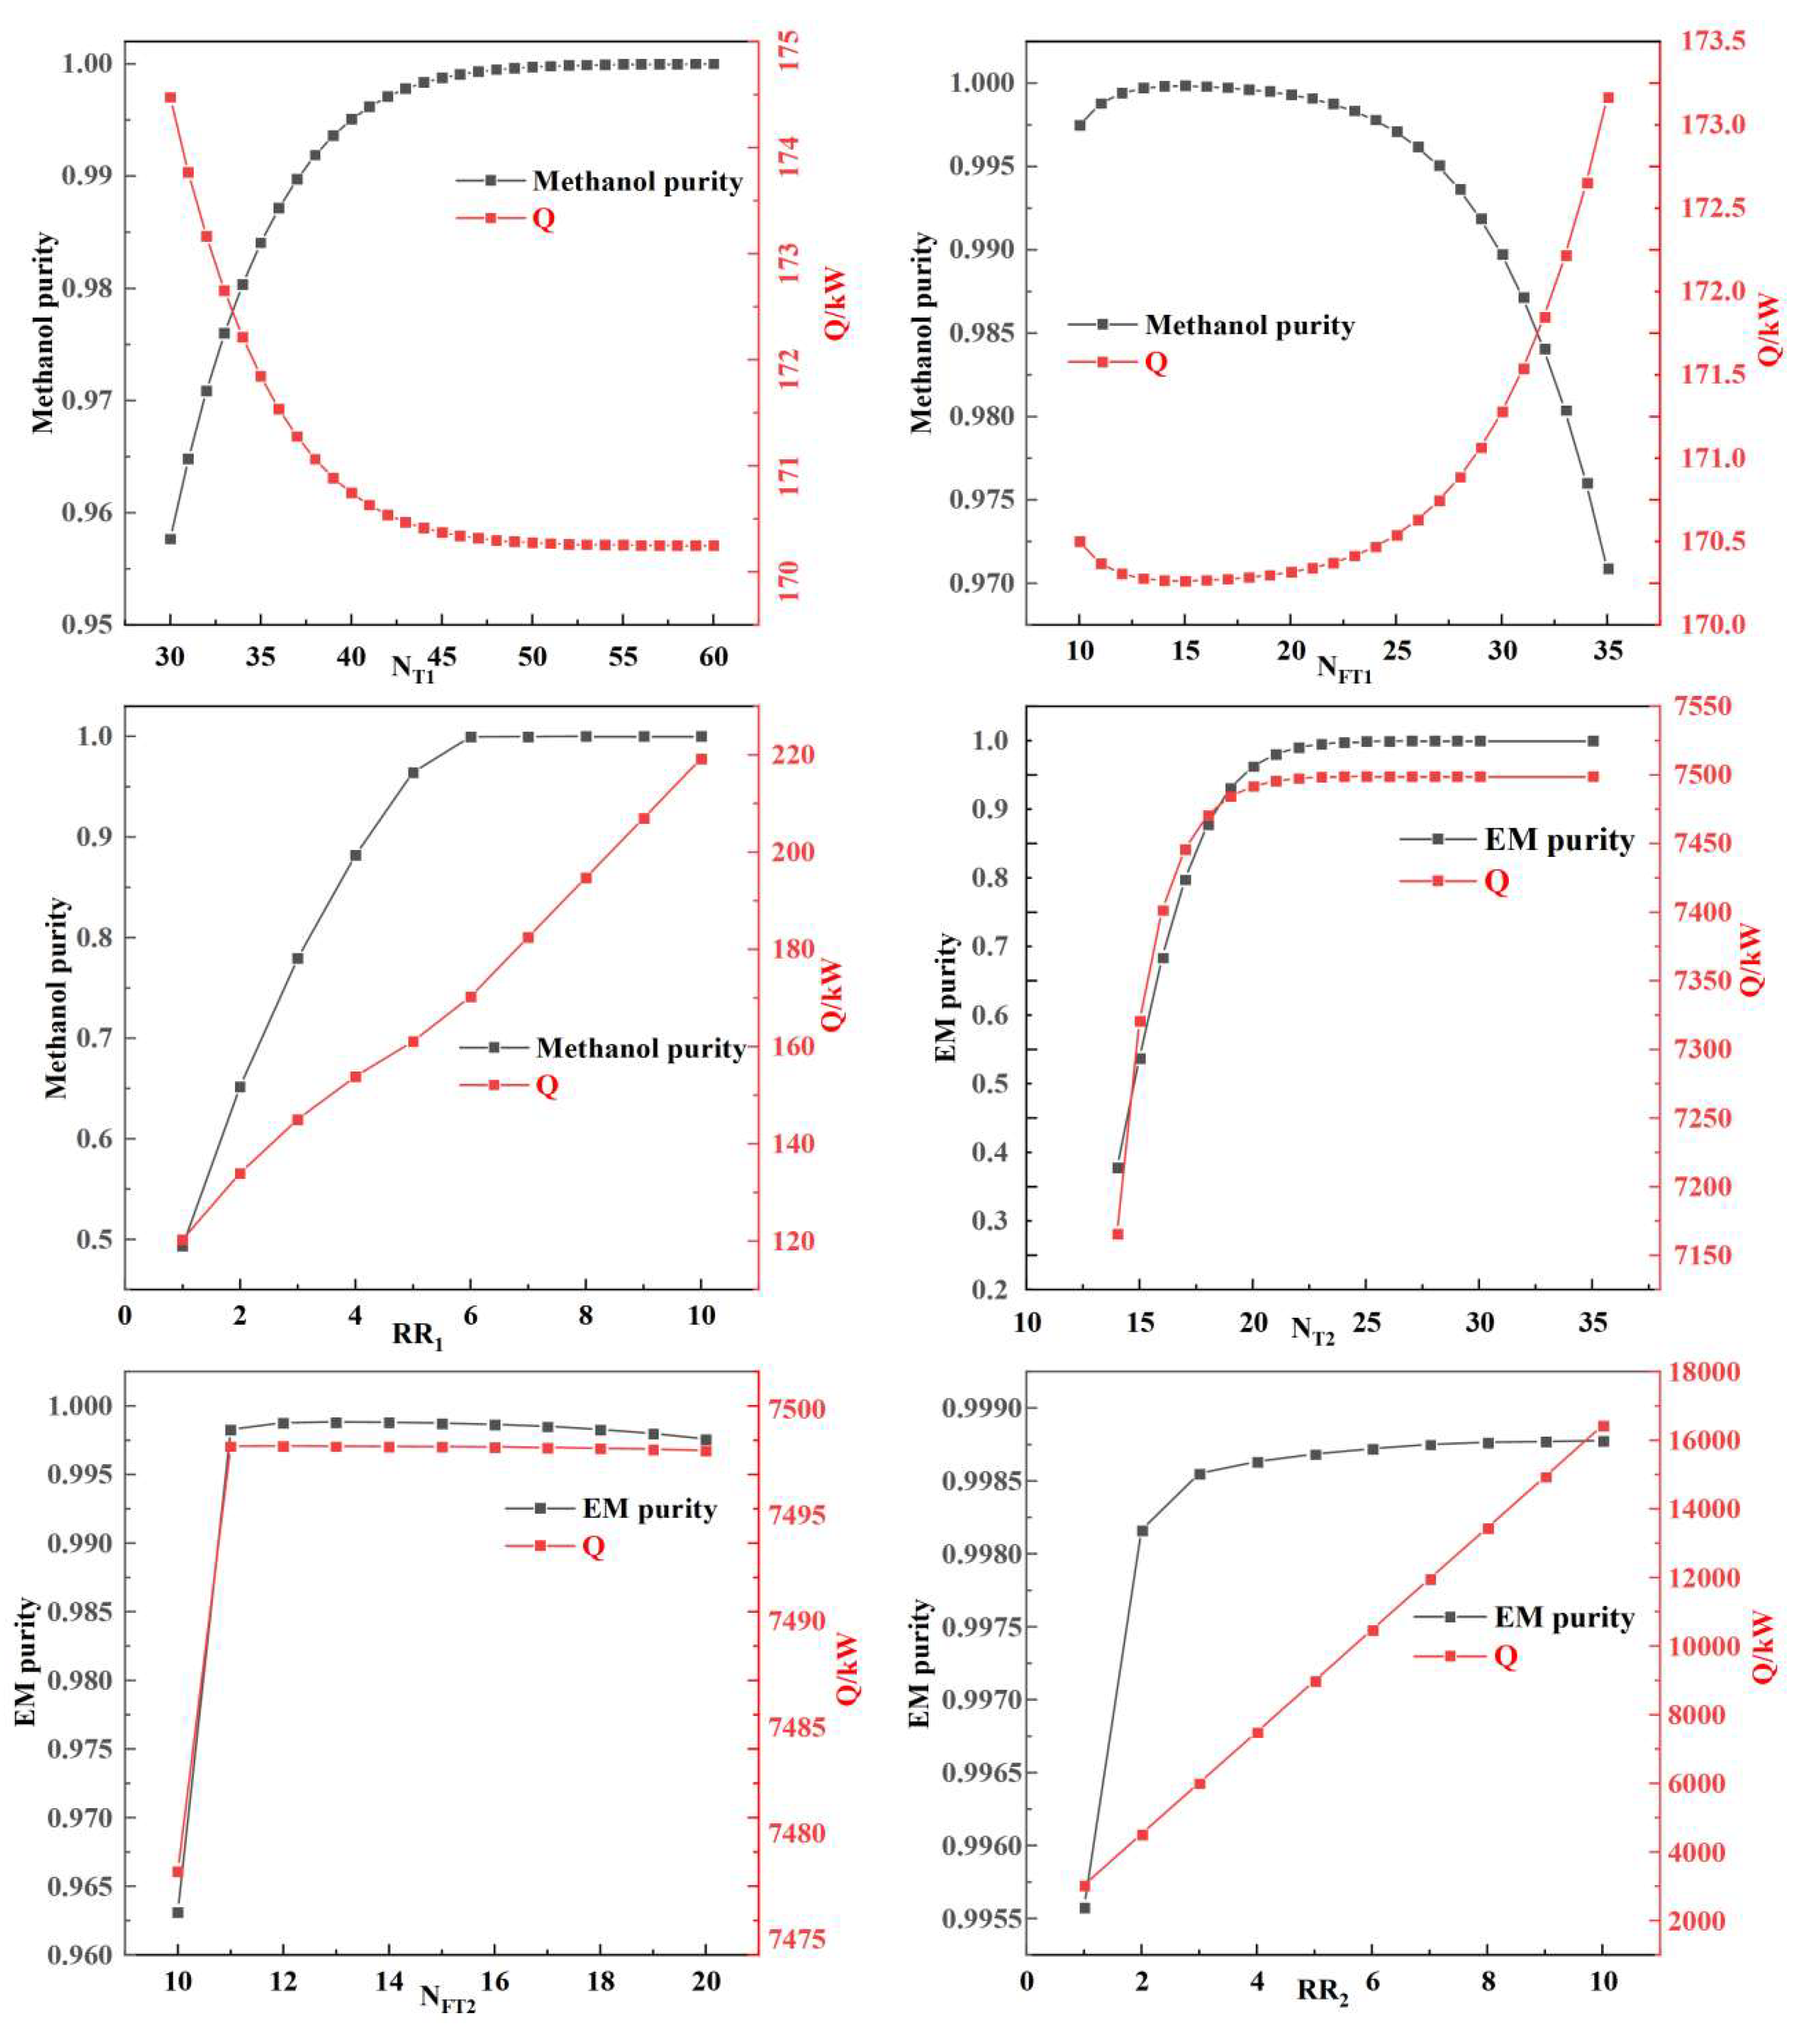
In the distillation process, key process parameters such as the feed flow rate of the entrainer, the number of theoretical stages, the feed stage location of the feedstock, and the reflux ratio have a crucial impact on the separation efficiency. Column T3, the solvent recovery column, is relatively straightforward to optimize; therefore, the primary focus was on optimizing columns T1 and T2. Sensitivity analysis on the process parameters related to columns T1 and T2 was conducted using Aspen Plus. The process was optimized by minimizing the estimated reboiler duty (Q), the thermal energy consumption. However, this represents only a preliminary stage of process evaluation. The results are shown in Figure 6 and Figure 7.
As shown in Figure 7, the optimal dosage of the entrainer is 805.3 kg/h, at which point the separation target (i.e., an EM purity of 0.999) is achieved.
As can be seen from Figure 8, by integrating the optimization results of both the light-ends removal column T1 and the azeotropic distillation column T2 systems, the optimal process parameters for this azeotropic distillation system can be determined, as summarized in Table 14.

5. Conclusions

VLE data for seven binary systems were measured at atmospheric pressure using a modified Othmer still, filling a significant data gap. All experimental data passed the thermodynamic consistency test via Herington’s area method. Using the Aspen Plus process simulation software, the parameters for the NRTL, UNIQUAC, and Wilson activity coefficient models were regressed, yielding parameter sets applicable at atmospheric pressure. The results indicate that all three activity coefficient models can satisfactorily correlate the H2O/EM system. Molecular interaction energy simulations agreed with the experimental VLE data, confirming the reliability of the data provided in this work. The analysis shows that 1-pentanol is the optimal choice among the three evaluated entrainers.
Subsequently, the azeotropic distillation process was simulated using Aspen Plus to evaluate the separation performance and identify the optimal operating parameters. This simulation provided the foundation for conceptual process design and preliminary thermodynamic assessment. Upon finalizing the conceptual design, addressing operational challenges such as emulsion formation and entrainer loss will become critical obstacles to overcome during subsequent detailed engineering design and pilot-scale scaling. These issues represent key focus areas for future work.
Author Contributions

Writing—review and editing, C.L.; writing—original draft preparation, J.Z.; software, J.R.; methodology, K.S.; validation, Y.S.; supervision, W.L.; project administration, J.L. All authors have read and agreed to the published version of the manuscript.

Funding

This work was financially supported by the National Natural Science Foundation of China (No. 22408082), the China Postdoctoral Science Foundation (No. 2023M740969), the Natural Science Foundation of Tianjin (No. 23JCQNJC00370), and the Tianjin Education Commission Scientific Research Project (No. 2023KJ293).

Data Availability Statement

The original contributions presented in this study are included in the article. Further inquiries can be directed to the corresponding author(s).

Conflicts of Interest

The authors declare no conflict of interest.

References

  1. Carr, C.; Riddick, J.A. Physical Properties of Methanol-Water System. Ind. Eng. Chem. 1951, 43, 692–696. [Google Scholar] [CrossRef]
  2. Vaghela, K.C.; Vankar, H.P.; Shah, K.N.; Rana, V.A. Dielectric and refractive index analysis of ethylene glycol monomethyl ether-methanol mixtures: Molecular interactions and machine learning based predictions. J. Mol. Liq. 2025, 430, 127756. [Google Scholar] [CrossRef]
  3. Joshi, Y.S.; Kumbharkhane, A.C. Study of heterogeneous interaction in binary mixtures of 2-methoxyethanol-water using dielectric relaxation spectroscopy. J. Mol. Liq. 2011, 161, 120–124. [Google Scholar] [CrossRef]
  4. Dong, Y.; Xu, F.; Xia, Y.; Yang, Q. Efficient separation of methanol, acetonitrile, and benzene ternary azeotropic mixture using ionic liquid in extractive distillation. Sep. Purif. Technol. 2025, 360, 131018. [Google Scholar] [CrossRef]
  5. Gomes, J.P.; Silva, R.; Nunes, C.P.; Barbosa, D. An Alternative Green Solvent for 1,3-Butadiene Extraction. Sustainability 2025, 17, 3124. [Google Scholar] [CrossRef]
  6. Waltermann, T.; Grueters, T.; Muenchrath, D.; Skiborowski, M. Efficient optimization-based design of energy-integrated azeotropic distillation processes. Comput. Chem. Eng. 2020, 133, 106676. [Google Scholar] [CrossRef]
  7. Qi, J.; Li, Y.; Xue, J.; Qiao, R.; Zhang, Z.; Li, Q. Comparison of heterogeneous azeotropic distillation and energy-saving extractive distillation for separating the acetonitrile-water mixtures. Sep. Purif. Technol. 2020, 238, 116487. [Google Scholar] [CrossRef]
  8. Torres Cantero, C.A.; Pérez Zúñiga, R.; Martínez García, M.; Ramos Cabral, S.; Calixto-Rodriguez, M.; Valdez Martínez, J.S.; Mena Enriquez, M.G.; Pérez Estrada, A.J.; Ortiz Torres, G.; Sorcia Vázquez, F.d.J.; et al. Design and Control Applied to an Extractive Distillation Column with Salt for the Production of Bioethanol. Processes 2022, 10, 1792. [Google Scholar] [CrossRef]
  9. Bejarano, A.; de la Fuente, J.C. Isobaric (vapor +liquid) equilibria for the binary systems (1-methoxy-2-propanol+2-methoxyethanol), (2-butanone+2-methoxyethanol) and (water+2-methoxyethanol) at pressures of (74.5, 101.3, and 134.0) kPa. J. Chem. Thermodyn. 2015, 87, 88–95. [Google Scholar] [CrossRef]
  10. Ochi, K.; Kojima, K. A measurement of vapor-liquid equilibria at extreme dilution. J. Chem. Eng. Jpn. 1987, 20, 6–10. [Google Scholar] [CrossRef]
  11. Krishnaiah, A.; Reddy, K.V.R.; Devarajulu, T.; Ramakrishna, M. Isobaric vapour–liquid equilibria of methyl cellosolve–aliphatic alcohol systems. Fluid Phase Equilibria 1999, 165, 59–66. [Google Scholar] [CrossRef]
  12. Havasi, D.; Mizsey, P.; Mika, L.T. Vapor–Liquid Equilibrium Study of the Gamma-Valerolactone–Water Binary System. J. Chem. Eng. Data 2016, 61, 1502–1508. [Google Scholar] [CrossRef]
  13. Li, W.; Du, Y.; Li, J.; Chen, X.; Guo, S.; Zhang, T. Isobaric vapor-liquid equilibrium for acetone + methanol system containing different ionic liquids at 101.3 kPa. Fluid Phase Equilibria 2018, 459, 10–17. [Google Scholar] [CrossRef]
  14. Korotkova, T.G. Parameters of the UNIQUAC Model for Describing the Vapor–Liquid Phase Equilibrium of the Isotope Mixtures of Hydrogen H2–D2, H2–HD, HD–D2. Russ. J. Phys. Chem. A 2024, 98, 92–105. [Google Scholar] [CrossRef]
  15. Fenglian, L.; Lei, Y.; Muhammad, N. A new fractal transform for the approximate solution of DRINFELD–SOKOLOV–WILSON model with fractal derivatives. Fractals 2023, 31, 1–9. [Google Scholar]
  16. Foute, A.J.; Ekosso, M.C.; Fotsin, H.; Fai, L.C. Effects of Gaussian thermal fluctuations on the thermodynamic of microtubules in Landau-Ginzburg-Wilson model. Chin. J. Phys. 2021, 73, 349–359. [Google Scholar] [CrossRef]
  17. Cao, J.; Yu, G.; Chen, X.; Abdeltawab, A.A.; Al-Enizi, A.M. Determination of Vapor–Liquid Equilibrium of Methyl Acetate + Methanol + 1-Alkyl-3-methylimidazolium Dialkylphosphates at 101.3 kPa. J. Chem. Eng. Data 2017, 62, 816–824. [Google Scholar] [CrossRef]
  18. Tang, G.; Ding, H.; Hou, J.; Xu, S. Isobaric vapor–liquid equilibrium for binary system of ethyl myristate + ethyl palmitate at 0.5, 1.0 and 1.5kPa. Fluid Phase Equilibria 2013, 347, 8–14. [Google Scholar] [CrossRef]
  19. Liu, Y.; Liu, Y.; Wang, H. Vapor-liquid equilibrium and topological analysis of ethyl propionate synthesized by reaction distillation. J. Chem. Thermodyn. 2022, 171, 106810. [Google Scholar] [CrossRef]
  20. Malloum, A.; Conradie, J. Molecular simulations of the adsorption of aniline from waste-water. J. Mol. Graph. Model. 2022, 117, 108287. [Google Scholar] [CrossRef]
  21. Li, J.; Huang, Q.; Wang, G.; Wang, E.; Ju, S.; Qin, C. Experimental study of effect of slickwater fracturing on coal pore structure and methane adsorption. Energy 2022, 239, 122421. [Google Scholar] [CrossRef]
  22. Bauer, G.; Gross, J. Phase Equilibria of Solid and Fluid Phases from Molecular Dynamics Simulations with Equilibrium and Nonequilibrium Free Energy Methods. J. Chem. Theory Comput. 2019, 15, 3778–3792. [Google Scholar] [CrossRef] [PubMed]
  23. Sirirak, K.; Vao-soongnern, V. Molecular simulation for the effect of chain stiffness on polymer crystallization from the melts. J. Mol. Liq. 2023, 387, 122650. [Google Scholar] [CrossRef]
  24. Sun, R.; He, H.; Yuan, L.; Wan, Y.; Sha, J.; Li, L.; Jiang, G.; Li, Y.; Li, T.; Ren, B. Thermodynamic analysis and molecular simulation of solid–liquid phase equilibrium of isoprenaline hydrochloride in eleven pure solvents at saturation. J. Chem. Thermodyn. 2021, 160, 106411. [Google Scholar] [CrossRef]
  25. Wang, J.; Sun, J.; Shang, M.; Huang, C.; Rui, X. Isobaric vapour-liquid equilibrium for systems of propionic acid, butanoic acid and 1,4-butyrolactone at 15.0 kPa. J. Chem. Thermodyn. 2023, 186, 107143. [Google Scholar] [CrossRef]
  26. Shi, K.; Zheng, H.; Sun, Y.; Wang, H.; Fang, J.; Li, C.; Liu, J. Vapor-liquid equilibrium for 1,4-butanediol, ethylene glycol and 3-methyl-1,5-pentanediol systems under different vacuum conditions. Vacuum 2024, 230, 113752. [Google Scholar] [CrossRef]
  27. Zhai, X.; Wu, Y.; Tian, B.; Yao, Y.; Wu, B.; Chen, K.; Ji, L. Isobaric Vapor–Liquid Equilibrium for the Binary System of Cumene + Acetophenone at 101.3, 30.0, and 10.0 kPa. J. Chem. Eng. Data 2022, 67, 669–675. [Google Scholar] [CrossRef]
  28. Han, X.; Wang, Y.; Wang, Y.; Zhao, H.; Li, Q. Vapor–Liquid Equilibrium Experiment and Process Simulation for Methanol and Ethyl Formate at 101.3 kPa. J. Chem. Eng. Data 2021, 66, 1929–1938. [Google Scholar] [CrossRef]
  29. Rodrigues, V.H.S.; Almeida, R.N.; Vargas, R.M.F.; Cassel, E. Vapor pressure and vapor-liquid equilibrium data for eugenol/caryophyllene binary system at low pressures by experimental and predictive methods. J. Chem. Thermodyn. 2022, 168, 106725. [Google Scholar] [CrossRef]
  30. Li, F.; Li, M.; Guo, J.; Hu, X.; Zhu, J.; Li, Q.; Zhao, H. Isobaric Vapor–Liquid Equilibrium Experiment of N-Propanol and N-Propyl Acetate at 101.3 kPa. J. Chem. Eng. Data 2023, 68, 358–365. [Google Scholar] [CrossRef]
  31. Shi, Y.; Wu, H.; Xu, J. Studies on Vapor–Liquid Equilibrium of Binary Systems Containing the MMA Component under Normal Atmospheric Pressure. J. Chem. Eng. Data 2022, 67, 3650–3660. [Google Scholar] [CrossRef]
Figure 1. Schematic diagram of the modified Othmer distill experimental setup. 1: heating rod; 2: liquid-phase sampling point; 3: equilibrium chamber; 4: thermometer; 5: condenser; 6: vapor-phase sampling point.
Separations 12 00273 g001
Figure 2. Vapor liquid equilibrium phase diagram and experimental data of H2O/EM system.
Separations 12 00273 g002
Figure 3. ln (γ12) ~ x1 diagram. (a): EM/1-pentanol; EM/1-hexanol; EM/1-heptanol; (b): H2O/EM; H2O/1-pentanol; H2O/1-hexanol; H2O/1-heptanol.
Separations 12 00273 g003
Figure 4. Experimental and calculated T-x1-y1 diagram. (a): H2O/EM; (b): EM/1-pentanol; (c): EM/1-hexanol; (d): EM/1-heptanol; (e): H2O/1-pentanol; (f): H2O/1-hexanol; (g): H2O/1-heptanol) Experimental y1-x1 diagram (h,i).
Separations 12 00273 g004
Figure 5. Molecular interaction simulation results of these components.
Separations 12 00273 g005
Figure 6. Process Flow Simulation.
Separations 12 00273 g006
Figure 7. Effect of Azeotroping Agent dosage on Separation Efficiency.
Separations 12 00273 g007
Figure 8. Effects of Process Parameters on Separation Efficiency.
Separations 12 00273 g008
Table 1. Details of the chemicals.
ChemicalMolecular FormulaCAS No.Mass FractionPurification MethodSourceAnalysis Method
ethylene glycol monomethyl etherC3H8O2109-86-4>0.995noneShandong Keyuan Biochemical Co., Ltd. (Heze, China)GC
1-pentanolC5H12O71-41-0>0.990noneShandong Keyuan Biochemical Co., Ltd.GC
1-hexanolC6H14O111-27-3>0.990noneShanghai Meryer Co., Ltd. (Shanghai, China)GC
1-heptanolC7H16O111-70-6>0.990noneShanghai Meryer Co., Ltd.GC
waterH2O7732-18-5>0.990noneHangzhou Wahaha Group Co., Ltd. (Hangzhou, China)GC
Table 2. Details of GC.
ProjectCharacteristicDescription
ColumnTypePacking column
SpecificationPorapak Q (3 mm × 2 m)
Carrier gasSpecificationH2 (99.999%, mass fraction)
Flow rate40 cm3/min
DetectorTypeThermal conductivity detector (TCD)
Temperature523 K
InjectorTemperature523 K
ColumnTemperature503 K
Table 3. Parameters for the extended Antoine equation.
ComponentC1iC2iC3C4iC5iC6iC7iC8iC9i
EM62.6982−7444.700−6.5818.883 × 10−186188.15597.6
1-pentanol107.842−10,64300−12.8581.249 × 10−176195.56588.1
1-hexanol128.512−12,28800−15.7321.270 × 10−176228.55611.3
1-heptanol140.5020−13,46600−17.3531.128 × 10−176239.15632.3
H2O66.7412−7258.200−7.3044.165 × 10−62273.16647.1
Table 4. Binary VLE data for H2O (1)/EM (2).
T/Kx1y1γ1γ2
373.151.00001.00001.0025-
373.150.97590.97190.99852.6402
373.150.94260.93670.99622.5050
373.150.89690.89140.99632.3911
373.150.86020.85640.99802.3319
373.250.79060.79991.01072.1606
373.250.69300.73481.05911.9538
373.350.62020.68621.10141.8616
373.750.51480.62061.18311.7366
373.950.45140.58701.26721.6599
374.250.38000.53151.34861.6482
375.250.32860.48841.38321.6036
375.850.27910.45481.48451.5581
376.550.23230.41421.58561.5333
377.850.18660.35761.62861.5158
379.650.13930.30371.74111.4582
381.150.11100.25631.75231.4316
382.650.09250.22571.76041.3870
384.650.07160.17531.65201.3494
387.250.04440.14011.95131.2535
388.850.03910.10971.64921.2242
390.950.02470.08971.99571.1517
393.850.01170.03951.68711.0928
397.150.00000.0000-1.0134
Table 5. Binary VLE data for EM (1)/1-pentanol (2).
T/Kx1y1γ1γ2
410.650.00000.0000-1.0101
408.450.06830.10991.16091.0374
406.950.13630.18151.00381.0818
405.350.20530.30821.18571.0488
404.150.29420.40811.13571.0524
402.050.43640.56071.12021.0516
400.850.53710.64381.08391.0823
400.250.59240.69091.07421.0891
399.850.66410.74821.05051.0918
398.950.76390.82151.03071.1370
398.750.79620.84521.02371.1505
398.150.82490.87491.04201.1055
397.151.00001.00001.0134-
Table 6. Binary VLE data for EM (1)/1-hexanol (2).
T/Kx1y1γ1γ2
430.150.00000.0000-0.9936
424.650.08740.21521.13211.0164
419.750.17320.40011.21161.0065
414.550.25940.51481.20201.0839
411.050.37420.62951.12531.1069
407.950.45080.71471.15991.0850
406.350.51610.75221.11771.1335
405.050.57300.78941.09791.1450
403.850.62560.82681.09151.1232
402.950.68050.85831.07011.1138
401.650.74220.88861.05661.1390
400.650.80290.91241.03381.2169
399.750.84830.93631.03231.1888
397.151.00001.00001.0134-
Table 7. Binary VLE data for EM (1)/1-heptanol (2).
T/Kx1y1γ1γ2
448.150.00000.0000-1.0153
438.150.04970.25071.64231.0869
431.950.10030.40401.53101.1158
423.750.19210.59301.45331.1212
417.150.28900.73991.44231.0310
412.150.38390.82841.39860.9461
408.150.46950.88951.37800.8254
406.250.52150.92891.37010.6344
403.650.60050.94081.30190.7020
402.850.63070.94621.27680.7131
401.650.68010.95171.23500.6153
397.151.00001.00001.0134-
Table 8. Binary VLE data for H2O (1)/1-pentanol (2).
T/Kx1y1γ1γ2
411.150.00000.0000-0.9937
381.550.02720.30648.43292.0641
379.550.04300.43758.15401.8444
374.150.07640.47015.95152.2514
371.950.10320.55695.64432.1293
369.250.13810.55534.64022.4990
369.150.14990.57984.47902.4050
369.150.15080.56904.36862.4696
369.150.22260.56962.96392.6933
369.150.30740.56412.12533.0622
368.750.41830.58231.63583.5559
368.750.51800.57721.63583.5559
368.750.57430.55171.12915.2140
368.750.69480.56730.95977.0187
369.050.79910.58800.855410.0224
369.050.94800.56000.686741.3464
373.151.00001.00001.0025-
Table 9. Binary VLE data for H2O (1)/1-hexanol (2).
T/Kx1y1γ1γ2
429.650.00000.0000-1.0092
382.150.05070.63019.11742.2674
373.350.09880.65006.54723.3602
371.850.22260.68623.23713.7465
370.850.29850.68052.48194.4326
370.750.42110.69331.79915.1807
370.750.49810.68501.50276.1370
370.750.60910.67501.21108.1298
370.850.72710.70591.057010.4880
370.750.75580.69040.998112.3998
370.750.87130.70320.882022.5461
370.950.97900.68400.7580145.7353
373.151.00001.00001.0025-
Table 10. Binary VLE data for H2O (1)/1-heptanol (2).
T/Kx1y1γ1γ2
448.150.00000.0000-1.0153
377.450.04790.802014.42343.1665
374.650.10020.80347.62393.8227
372.250.14990.80325.54864.5727
372.050.20010.82854.31684.2776
372.050.29260.83522.97604.6481
371.850.42530.83922.07255.6389
372.150.51620.84291.69656.4471
371.950.62300.83101.39608.9871
372.150.68680.83011.256010.7639
371.950.79110.83591.105815.7493
372.150.97800.84000.8924144.3722
373.151.00001.00001.0025-
Table 11. Result of Herrington integral test.
Binary System |DJ|
H2O/EM5.9450
EM/1-pentanol6.6655
EM/1-hexanol2.8024
EM/1-heptanol2.4528
H2O/1-pentanol8.0924
H2O/1-hexanol8.8198
H2O/1-heptanol8.1581
Table 12. The correlated binary interaction parameters (aij; aji; bij; bji), standard deviations of vapor compositions (δy1) and temperatures (δT).
SystemModelCorrelation ParamentersRMSD
aijajibij/Kbji/Kδy1δT
H2O/EMNRTL−13.75006.30875804.2600−2612.26450.00760.3232
UNIQUAC1.16610.1903−141.1685−619.46640.00670.3062
WILSON−3.38999.41011387.1798−4020.35890.00670.3117
EM/1-pentanolNRTL2.9908−0.1247−916.6271−100.23450.00970.2624
UNIQUAC−1.55650.5743470.7308−125.32320.00970.2610
WILSON0.01484−2.6222159.0824742.30430.00970.2623
EM/1-hexanolNRTL11.9088−8.4514−4512.73733221.05690.01120.3033
UNIQUAC−4.46274.78221812.4600−1970.32480.01160.3105
WILSON7.07436−9.9947−2752.04343841.72630.01140.3072
EM/1-heptanolNRTL29.554813.9507−10,000.0000−6383.21850.01040.1710
UNIQUAC−25.5473−1.650549051.56201090.37800.01700.3527
WILSON−4.5029−15.81532264.3243−7550.60660.02900.2730
H2O/1-pentanolNRTL24.061116.9207−7482.0249−6082.73470.04030.6400
UNIQUAC−2.7402−9.6022818.28673461.79290.04080.6558
WILSON−0.3626−48.9978−148.4263−10,000.00000.03750.7109
H2O/1-hexanolNRTL27.41051.2408−8543.0889−417.71510.08031.0454
UNIQUAC−2.0196−0.6236621.469270.42860.79940.9868
WILSON16.5498−80.0000−6504.2841−10,000.00000.03510.4534
H2O/1-heptanolNRTL633.944562.9729−147,929.7011
147,929.70110
−9545.92760.03080.7138
UNIQUAC−27.0665−27.347010,000.000010,000.00000.02890.7988
WILSON−27.4899−80.000010,000.0000−10,000.00000.02740.3687
Table 13. Physical properties of azeotropes in H2O and different substances (P = 101.325 kPa).
Azeotropic Substances1-Pentanol1-Hexanol1-Heptanol
Boiling point/°C138157176
Azeotropic temperature/°C95.997.999.2
Azeotropic Composition (H2O)/wt%566883
Table 14. Results of Process Parameter Optimization.
Optimization ResultsLight-Ends Removal Column T1Azeotropic Distillation Column T2Solvent Recovery Column T3
Number of Theoretical Stages49246
Feed Stage Location1413 (FEED2)3
Reflux Ratio641
Total Duty/kW170.277498.98105.65
Column Pressure/kPa101.325101.325101.325
Entrainer Feed Rate/(kg/h)/805.3/
Disclaimer/Publisher’s Note: The statements, opinions and data contained in all publications are solely those of the individual author(s) and contributor(s) and not of MDPI and/or the editor(s). MDPI and/or the editor(s) disclaim responsibility for any injury to people or property resulting from any ideas, methods, instructions or products referred to in the content.