Article

Development of an Efficient HPLC-MS/MS Method for the Detection of a Broad Spectrum of Hydrophilic and Lipophilic Contaminants in Marine Waters: An Experimental Design Approach

Department of Chemistry and Industrial Chemistry, University of Genoa, 16146 Genoa, Italy
*
Author to whom correspondence should be addressed.
Separations 2025, 12(10), 257; https://doi.org/10.3390/separations12100257
Submission received: 31 July 2025 / Revised: 5 September 2025 / Accepted: 16 September 2025 / Published: 23 September 2025

Abstract

The present study develops and optimizes a targeted chromatographic method coupled with mass spectrometry, employing design of experiments, for the determination of several emerging contaminants in environmental waters. Their widespread presence poses environmental and health risks due to their pseudo-persistence and unknown long-term effects. Therefore, sensitive and selective analytical methods are essential for their reliable environmental monitoring. This work focuses on 40 organic micro-contaminants with a wide range of polarities, including drugs, pesticides and UV-filters. Chromatographic separation was performed on a pentafluorophenyl column, and a Face-Centered Design was applied for multivariate optimization. Mobile phase flow and temperature were chosen as the study factors, and retention time and peak width as the responses, as indicators of analytical performance. Two optimized runs (for positive and negative electrospray ionization modes) were obtained, enabling the analysis of all 40 analytes in a total of 29 min. The final method was successfully applied to seawater samples from different sites of the Genoa harbor area. Several analytes were detected and quantified, down to the ng L−1 level, with tracers and pharmaceuticals showing the highest concentrations. The method demonstrated satisfactory accuracy, precision and specificity and is suitable for routine monitoring of a broad range of emerging contaminants in seawater.

1. Introduction

Emerging contaminants (ECs) are a broad class of substances of natural and synthetic origin. These molecules can be classified into several categories, based on either their chemical structure and their intended use, and include pesticides, industrial and food additives, pharmaceuticals, personal care products, UV filters, etc. [1,2,3,4].
For many years, it was assumed that these compounds did not pose an environmental risk; as a result, their extensive use, discharge and release into the environment together with those of their transformation products were not initially regulated or controlled. In addition, conventional wastewater treatment plants generally lack specific processes for the removal of ECs. For these reasons, these compounds are commonly detected in different aqueous matrices at trace (µg L−1) or ultra-trace (ng L−1) levels.
Some of these microcontaminants are known or suspect “endocrine disruptors”. This class of substances was formally and officially defined by the World Health Organisation (WHO) in 2002 as “a substance or mixture of substances that disrupts the functions of the endocrine system and consequently has adverse effects on the health of healthy organisms, their offspring or subpopulations” [5,6].
From a regulatory perspective, ECs are not yet subject to binding legislation, but some have been included in the “Watch Lists” of contaminants to be monitored by both the US Environmental Protection Agency (USEPA) and the European Union [7].
Currently, two main approaches are used for assessing ECs in water: spot and passive sampling. Spot sampling is typically performed at a specific time point: water is collected in suitable bottles and is subsequently subjected to sample treatment, most commonly via solid-phase extraction (SPE), as widely reported [8,9,10,11,12,13,14]. Passive sampling, on the other hand, employs different devices, depending on the contaminants of interest. For compounds with medium hydrophilicity, Polar Organic Chemical Integrative Samplers (POCISs) represent one of the most suitable options. A classical POCIS consists of a Hydrophilic-Lipophilic-Balanced (HLB) sorbent, enclosed between two microporous polyethersulfone (PES) membranes and held together via stainless steel rings [15]. After deployment for several days to a few weeks, analytes are recovered from the receiving phase using an appropriate elution protocol [16].
The ECs investigated in this work differ in their physico-chemical properties, polarity and pKa. Table S1 in the Supplementary Materials reports the LogD values at neutral pH [17] and the pKa values of the 40 analytes studied. The analytes exhibit a broad polarity range and also different acid–base properties, including apolar substances (such as, for example, the UV-filter class), polar substances (such as most tracers or drugs), basic substances (such as, for example, clenbuterol) and acidic substances (such as non-steroidal anti-inflammatory drugs (NSAIDs)). These analytes were selected to cover the most relevant classes of emerging contaminants and because they are frequently detected in aqueous environmental samples. This broad spectrum of polarities represents a significant analytical challenge for chromatographic separation and subsequent quantitation. In addition, EC analysis is complicated by their typically low environmental concentrations and by matrix effects, which can interfere with their determination. Therefore, highly sensitive and selective instrumental methods are required.
In the literature, liquid chromatography coupled to mass spectrometry (LC-MS) using different stationary phases and mass analyzers is most commonly used [18,19]. In particular, reversed-phase chromatography is the most employed separation mechanism for this type of analysis, although it is often inadequate for more polar compounds.
In HPLC-MS/MS analysis of ECs, several parameters can be optimized, such as analysis efficiency, resolution and sensitivity. To improve the chromatographic analysis, factors such as flow rate and column temperature are frequently investigated [20,21,22,23]. Over the years, many studies in the literature employed the “one variable at a time” (OVAT) approach [24,25,26], where factors are examined independently. This strategy limits the ability to achieve truly optimal conditions, because chromatographic variables are usually interdependent and can possibly produce unexpected combined effects.
A more effective strategy is the use of experimental design, or design of experiments (DoE). In this chemometric approach, all factors are varied together within a specific experimental domain. The resulting data are then processed to build a response surface, which shows the relation between the selected response and the parameters considered and their interactions [27].
Optimized chromatographic methods for the simultaneous analysis of a large number of organic microcontaminants with a broad polarity spectrum are relatively scarce in the literature. Generally, chromatographic methods are optimized for specific classes of analytes with similar polarity characteristics [28,29,30,31,32]. Consequently, the development of a robust and selective chromatographic method capable of effectively separating and quantifying a large and chemically diverse set of ECs, as in the case of the 40 analytes considered in this study, remains a significant challenge.
To this aim, a core–shell pentafluoro-phenyl column (PFP) was used. This stationary phase, characterized by exposed aromatic pentafluorophenyl rings, provides multiple interaction mechanisms, including enhanced retention of halogen-containing analytes [33]. The objective of this study was the development and optimization of targeted chromatographic methods coupled to mass spectrometry, applying the DoE approach to achieve a rapid and efficient instrumental method suitable for a wide range of ECs. The optimized method was subsequently applied to the analysis of seawater samples obtained from both spot samplings and POCIS deployment, allowing the detection and quantitation of the selected organic microcontaminants.

2. Materials and Methods

2.1. Chemicals and Reagents

The solvents used during sample preparation and analysis were of HPLC-MS grade. Milli-Q water (H2O) was obtained by using the Millipore (Watford, UK) Milli-Q system. Acetonitrile (ACN), ethanol (EtOH), methanol (MeOH), isopropanol (IPA) and acetone were purchased from VWR (Radnor, PA, USA), while dichloromethane (DCM) was purchased from LabScan Analytical (Gliwice, Poland).
Analytical standards, all of ≥98% purity, were purchased from different suppliers: acesulfame K (ACS), atenolol (ATN), benzophenone-3 (BP-3), carbamazepine (CBZ), clenbuterol (CLBT), metoprolol (MTPL), furosemide (FRSM), paraxanthine (PRX), theophylline (TFL), taurine (TRN), terbutaline (TRBT), octyl dimethyl-p-aminobenzoic acid (OD-PABA), ethylhexyl methoxycinamate (EHMC), ethylhexyl salicylate (EHS), octocrylene (OC), ofloxacin (OFLO), tetracycline (TETRA), perfluorooctanoic acid (PFOA), perfluorooctanesulphonic acid (PFOS), sucralose (SCL), nicotine (NCT), bisphenol A (BPA), estrone (E1), ibuprofen (IBU), gemfibrozil (GEM) cocaine (COCA), omethoate (OMT), daminozide (DMNZ), 2,4-dichlorophenoxyacetic acid (2,4-D), chloramphenicol (CMPH), metformin (MTF), hydrochlorothiazide (HCTZ), chlormequat (CMQ), mepiquat (MPQ) and triclosan (TCS) were purchased from Sigma-Aldrich (St. Louis, MO, USA); caffeine (CAFF), diclofenac (DCF), ketoprofen (KETO) and naproxen (NAPR) were purchased from Fluka Analytical (Saint Gallen, Switzerland), while salbutamol (SLBT) was purchased from Alfa Aesar (Haverhill, MA, USA). Standard solutions containing the analytes at different concentrations were prepared by dissolving or diluting the pure standards and certified grade solutions in MeOH or in MeOH:H2O mixtures (depending on the different polarity characteristics). Acetic acid (AA) and formic acid (FA), purchased from Sigma Aldrich (St. Louis, MO, USA), were used as mobile phase additives. Commercial POCIS with polyethersulphone (PES) membranes were purchased from E&H Services A.S. (Prague, Czech Republic).

2.2. Instrumental Analysis

Instrumental analyses were performed using an HPLC-ESI-MS/MS by Agilent Technologies (Santa Clara, CA, USA). The HPLC system (1200 series) is equipped with a dual head reciprocating pump, a vacuum degassing system, an automatic liquid sampler (ALS) and a thermostatically controlled column compartment.
The mass spectrometer (model 6430, Agilent Technologies, Santa Clara, CA, USA) is a triple quadrupole equipped with an electrospray ionization (ESI) source. The following values were set for the ESI source for both positive and negative polarities: drying gas (N2) set at a temperature and flow of 300 °C and 11 L min−1, respectively, and a nebulizer pressure of 15 psi. The capillary voltage was set at 4000 V. The dynamic multiple reaction monitoring (d-MRM) mode was used to maximize sensitivity. Details of the chromatographic separations and the MRM transition are reported in the Supplementary Materials (Table S2).
Agilent MassHunter software (version 10.0) was used for data acquisition and quantitative and qualitative analysis.
The column used for the chromatographic separation was a Kinetex® PFP (100 mm × 2.1 mm, 2.6 um particle size, 100 Å pore size, from Phenomenex (Torrance, CA, USA)) characterized by silica core–shell particles functionalized with pentafluoro-phenyl aromatic rings. Compared to traditional alkyl phases, fluorinated stationary phases provide more interaction types, such as π-π interactions, hydrophobic interactions, dipole–dipole interactions and hydrogen bonding. In addition, the pentafluoro-phenyl functional group offers the possibility of higher retention of halogenated analytes.
Two methods were obtained after optimization (Table 1): a first method dedicated to the analysis of positive ionization analytes (9 min run) and a second for negative ionization analytes (12 min run). The first method used a gradient elution with H2O and ACN containing 0.1% formic acid, while the second used neutral H2O and ACN with no additive. In both cases, the injection volume was 10 µL.

2.3. Design of Experiments: Face-Centered Design

After selecting the most promising gradient conditions in preliminary tests, the best chromatographic parameters were determined via DoE optimization; this approach allowed the identification of the experimental conditions that provided the best balance between chromatographic efficiency and analysis time within the studied domain. The chosen quadratic design was the Face-Centered Design, belonging to the Central Composite Design (CCD) class, which investigates factors at the coded levels −1, 0, +1 [27].
The experimental matrix, as shown in Figure 1, is characterized by three different “types” of experimental points: factorial points (blue circles), axial points (orange stars on the sides of the square) and central points (orange star at the centre of the square), which together allow uniform coverage of the experimental domain.
Table 2 shows the studied factors, selected experimental domain and responses. The flow values in negative-mode analysis were set slightly higher than in positive-mode analysis, based on some preliminary tests which suggested this range as more suitable to speed up the chromatographic runs.
The model to be computed is the one shown in Equation (1):
Y = b0 + b1X1 + b2X2 + b11X12 + b22X22 + b12X1X2
where Y is the response, bi and bii are the coefficients of the linear terms and of the quadratic terms, respectively, and b12 represents the interaction term. Following the selected response surface design, a total of 11 experiments were performed, as shown in Table 3.
The first four experiments correspond to the factorial points, representing all possible combinations of the extreme levels of the domain. Experiments 5 to 8 represent the axial points, while the final three experiments are replicates of the central point. The central point replicates allow one to estimate the experimental variance and allows assessment of model curvature. If curvature is present but a linear model is inappropriately applied, the system may be misrepresented, leading to erroneous predictions and hindering the identification of the optimal conditions.
All experiments were performed in duplicate for both positive and negative ionization analytes, to assess repeatability and increase the number of degrees of freedom associated with model computation. In addition, they were performed in random order, to minimize potential biases associated with the sequence of execution.
All models and related graphs were obtained using the open source software, CAT (Chemometric Agile Tool, developed in the R environment version 3.1.2) [34].
The elution gradient used for all the experiments was set by performing some preliminary tests at a flow of 0.2 mL min−1, with the injection of a standard solution at a concentration of 50 µg L−1. Once the best gradient conditions at a flow rate of 0.2 mL min−1 were defined, the gradient was adapted in the experiments at different flow rates (details are given in the Tables S3 and S4 of the Supplementary Materials).

2.4. Real Samples’ Processing and Sampling Sites

The optimized method was applied to two different sampling campaigns in the port area of Genoa (Liguria, Italy). Strategic sampling points were chosen, either close to the touristic marina, or next to the mouth of the Bisagno and Polcevera rivers. In the first campaign, performed in December 2023, passive samplers were used to screen the presence of emerging contaminants over a prolonged exposure. Indeed, POCISs were deployed at two sampling sites, for a period of two weeks, providing in situ preconcentration of the analytes. The second sampling took place in February and March 2024 and involved the collection of 8 spot samples; for each sample, a volume of 500 mL was taken using dark glass bottles, filtered and subsequently processed via solid-phase extraction (SPE), using Hydrophilic Lipophilic Balance (HLB) cartridges. Details of the sampling sites and sampling periods are provided in the Supplementary Materials (Table S5).
The SPE protocol involved cartridge conditioning with 3 mL of methanol followed by 5 mL of Milli-Q water. Each 500 mL sample was then loaded, and the cartridge washed with 5 mL of Milli-Q water to remove the most polar interferents. Elution was performed using 20 mL of methanol, followed by a 5 mL mixture of dichloromethane and isopropanol (80:20 v/v). The eluate was evaporated using a Rotavapor, and the residue was reconstituted in 1 mL of methanol. Samples were then filtered through a 0.2 µm polytetrafluoroethylene syringe filter, diluted ten-fold in a H2O/MeOH mixture (50:50 v/v) and analyzed.
For passive samplers, POCISs were retrieved, rinsed externally with milli-Q water and stored at −20 °C until processing. After thawing, they were dried overnight, disassembled, and the sorbent phase was transferred into an empty glass SPE cartridge. Elution followed the same protocol as the spot samples [35]. A procedural blank sample was processed together with each sample batch, included in the analysis sessions and, where necessary, concentration data were corrected.

2.5. Method Performances

The instrumental method was assessed in terms of limit of detection (LOD), limit of quantitation (LOQ), linearity range, specificity and precision. Details of the figures of merit of the sample processing procedures are reported in previous works [35,36]. In order to verify the trueness for the specific samples analyzed, matrix effects were assessed.
In the context of mass spectrometry, matrix effect (ME) indicates the positive or negative effect of matrix components on the analytical signal, causing its suppression or intensification. To assess this effect, the sample is divided into two different aliquots. One constitutes the non-spiked sample (NS), while the other is spiked with a known concentration of the analytes after processing, immediately before instrumental analysis (spk-post). Thus, the matrix effect can be calculated using the following Equation (2).
ME % = S sample   spk - post     S sampleNS S standard 100
where Ssample spk-post is the analyte signal in the sample with a post-treatment spike, SsampleNS is the signal in the non-spiked sample, and Sstandard is the signal in a standard solution with an equivalent concentration to the post-treatment spike. When ME is close to 100%, it indicates the absence of a matrix effect. Values below 100 indicate signal suppression, whereas higher values suggest an intensification of the signal, known as enhancement.
The limits of detection (LOD) and quantification (LOQ) were determined as 3 and 10 times the signal-to-noise ratio (S/N), respectively [32].
External calibration curves were constructed by analyzing standard solutions in H2O/MeOH, (50:50 v/v)at six different concentrations, from 0.1 to 20 µg L−1, to investigate the linearity range. Specificity was evaluated by verifying the analytes’ RT and by calculating the ratios between the quantifier and qualifier MRM transitions of each compound (see Table S2). Instrumental precision was assessed by repeated injections of a standard solution at an intermediate concentration of 5 µg L−1, within the same analytical batch.

3. Results and Discussion

3.1. Multivariate Optimization of Chromatographic Separation

To optimize the chromatographic analysis with the PFP column in terms of resolution and analysis time, two preliminary non-optimized methods were selected as starting points for the analyte separation. Even when mass spectrometry is used as the detector, achieving efficient chromatographic separation with well-shaped peaks is of fundamental importance for maximizing sensitivity and minimizing potential interference in real samples. As the optimal conditions for maximizing chromatographic efficiency depend on several interrelated factors, the one-variable-at-a-time (OVAT) strategy was considered inadequate. Therefore, a Face-Centered Design (FCD) was applied, choosing mobile phase flow and temperature as study factors, and RT and peak W as responses.
The choice of the most influential factors was based on previous knowledge [37,38]. An increase in the mobile phase flow (X1) generally leads to a shorter chromatographic run time, but it may also result in excessive peak overlap and consequent decreased resolution. Furthermore, high mobile phase flow rates are incompatible with the ESI source. The column temperature can affect both analyte–stationary phase weak interactions and mobile phase viscosity. Still, excessively high temperatures may reduce column longevity and promote partial degradation of specific analytes. Therefore, optimization required balancing these variables to achieve the aims of this work. Other influential variables such as mobile phase composition and gradient were not included in the experimental design but were defined through preliminary tests, to avoid a disproportionate increase in the experimental effort.
Regarding the selected responses, RT is a crucial parameter to monitor analyte interaction with the stationary phase, while W is directly related to chromatographic efficiency. Optimal RT values varied depending on the analyte, while the optimum W condition always corresponded to the minimum value, irrespective of the analyte, since a narrower peak results in greater efficiency of the chromatographic analysis. By simultaneously optimizing both responses, higher resolution between critical analyte pairs could be achieved.

Modeling and Final Method Development

The RT and W values obtained for the positive (ESI+) and negative (ESI−) ionization analytes were used to construct the quadratic models (Equation (1)) and identify the ideal conditions for the variables in terms of chromatographic efficiency. The optimum for each individual response was identified using the plots obtained from the CAT software, particularly the coefficients plot and the response surface [27]. Based on logD values, more hydrophilic analytes were targeted for RT maximization, to enhance retention, improve peak shape and reduce interference from compounds eluting near the dead volume. Conversely, more hydrophobic analytes were optimized for shorter RTs, promoting faster elution and balancing separation efficiency with overall analysis time.
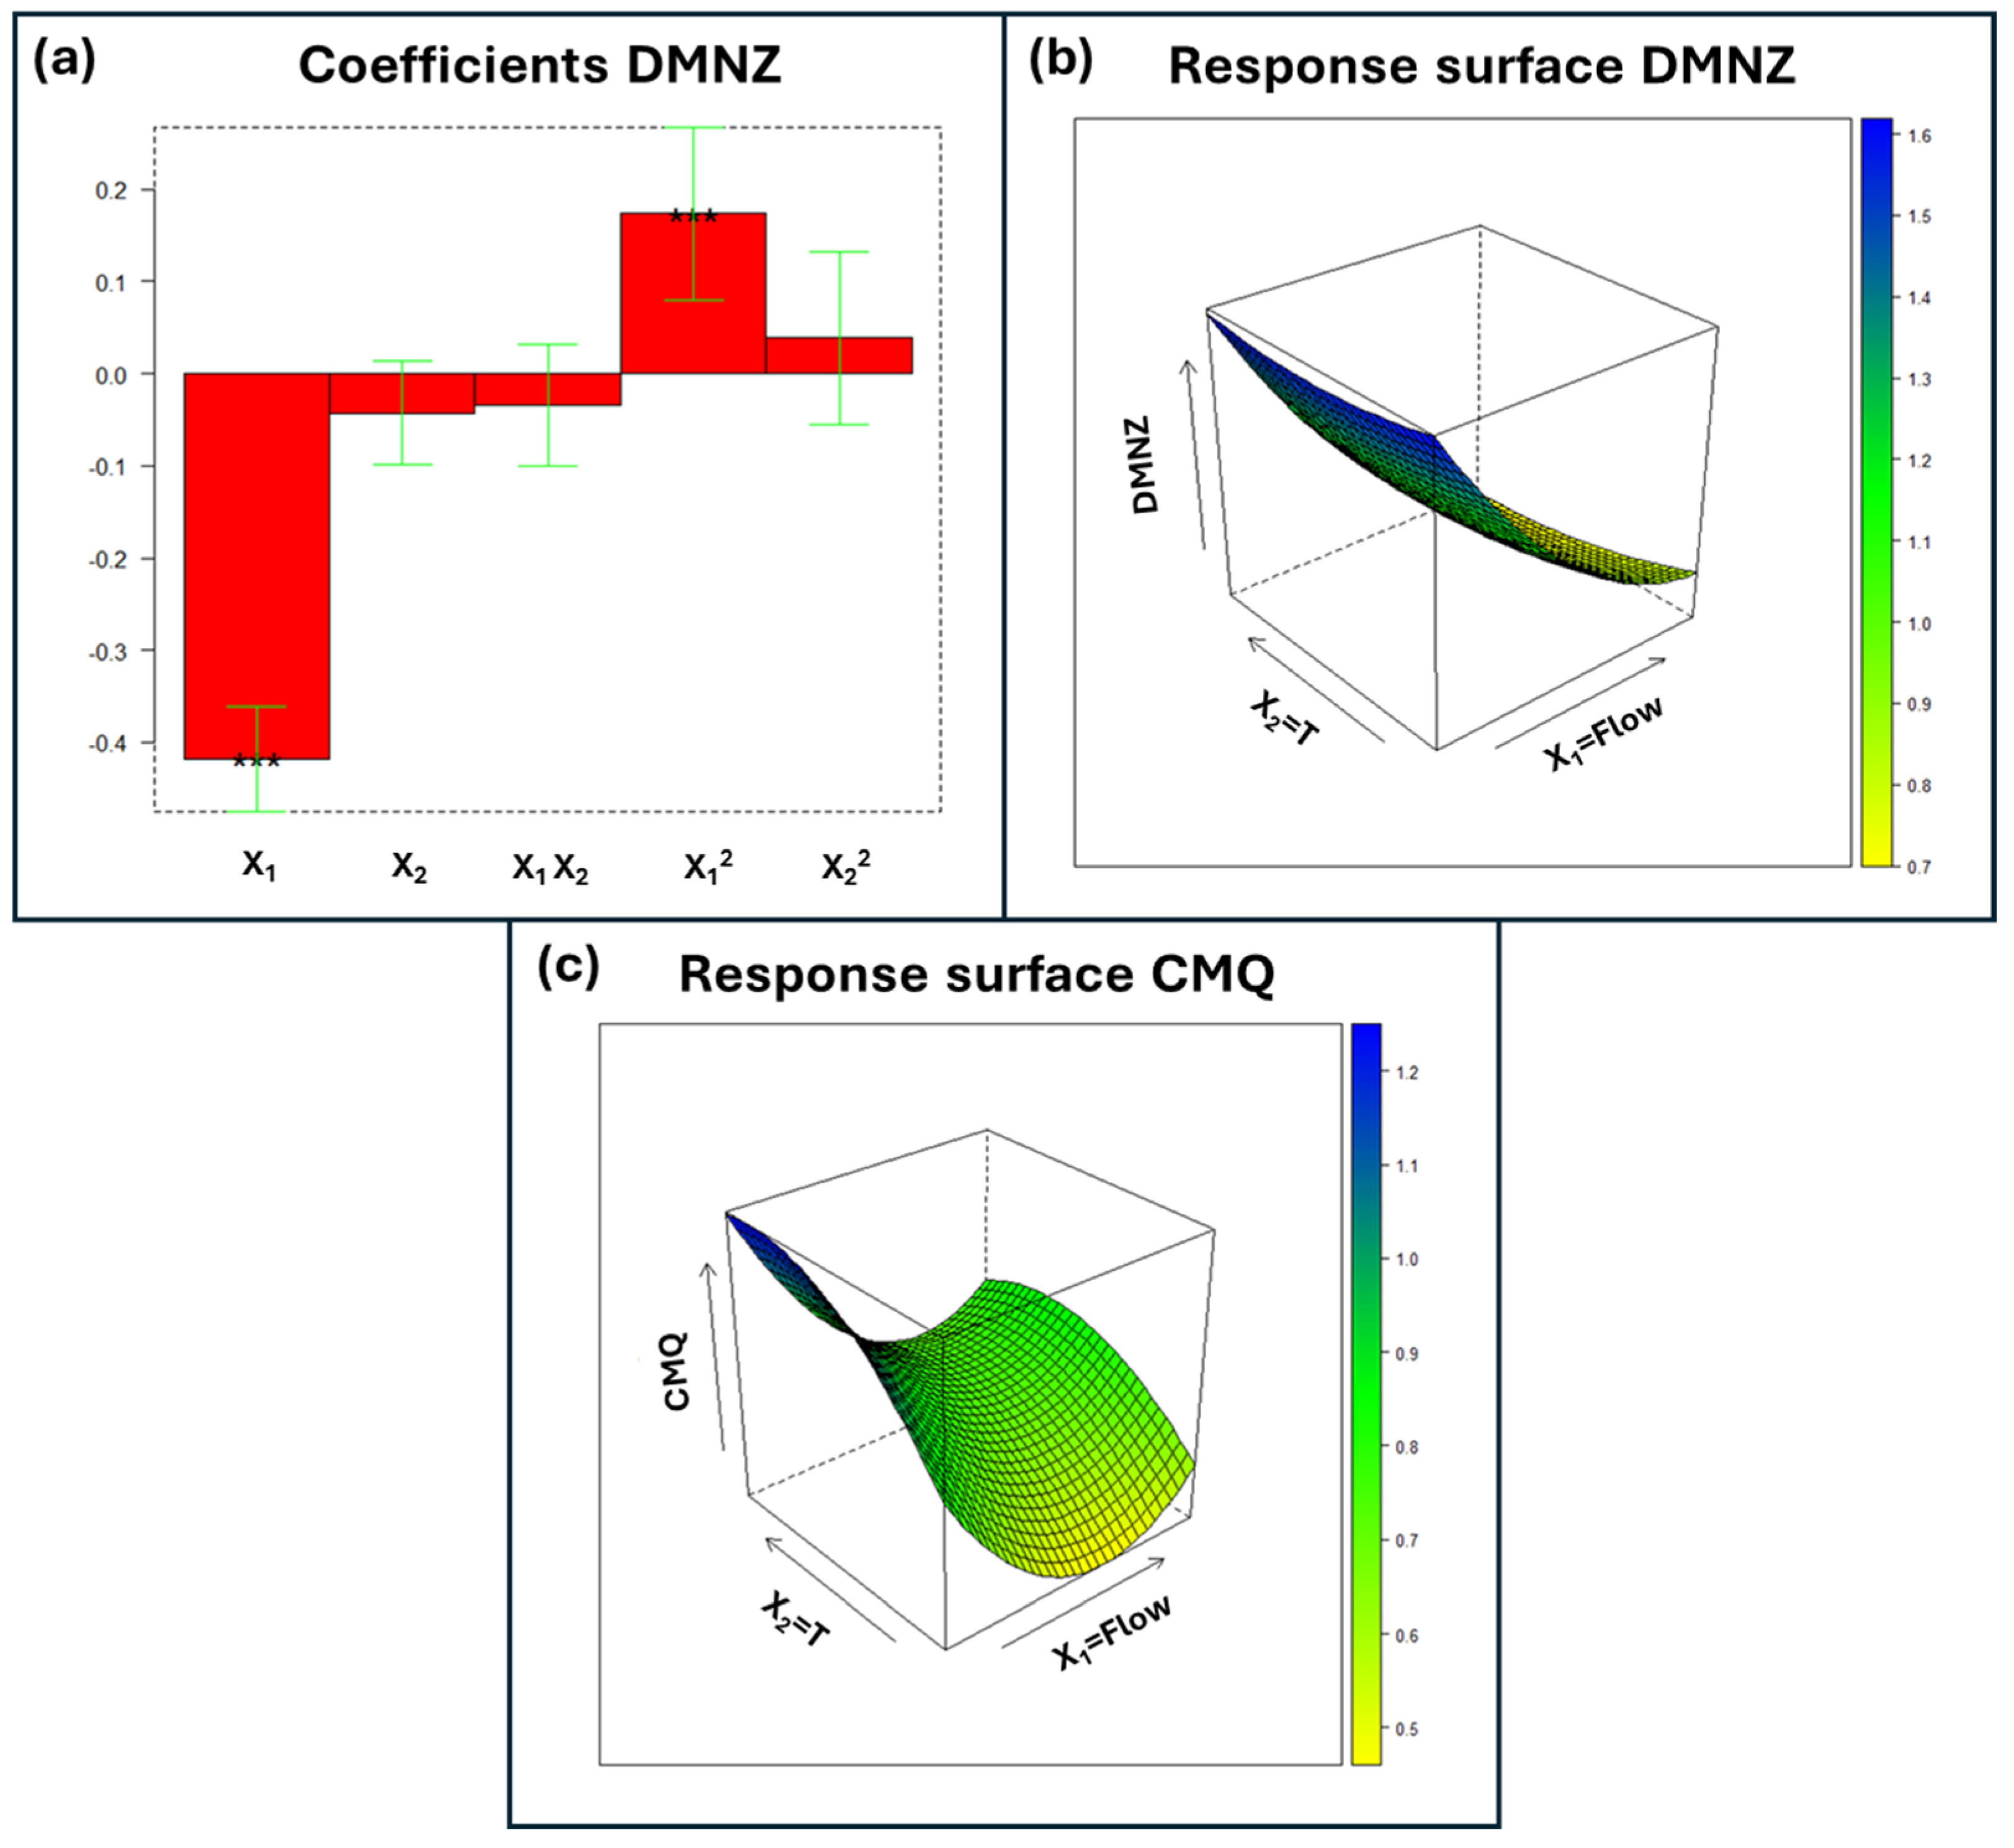
Examination of the RT models revealed nine different types of functions, with six groups and three single analytes showing specific behaviors, as shown in Table 4. The identification of common model types allowed the optimization results obtained for one analyte to be extended to other analytes within the same group. Instead, for the W response, no common group was identified, since each substance exhibited unique response surfaces that were evaluated individually. Two representative models are shown in Figure 2: one for RT and one for W.
As shown in Figure 2a, both variables X1 (flow) and X2 (temperature) were significant at the 99.9% confidence level, with negative coefficients, even though the effect of X2 had a definitely lower impact. Additionally, the quadratic term X12 (flow) was significant with a positive sign. The significance of the quadratic term confirmed that a quadratic model was appropriate to describe the response variable as a function of the independent variables. As DMNZ is a highly polar molecule (LogD = −3.81), the optimum is located in the region of the response surface where RT is maximized, corresponding to low flow and temperature values. This area is represented by the intense blue region in Figure 2b, specifically at coded levels X1 = −1 and X2 = −1.
In the second example, Figure 2c, which illustrates CMQ peak width, the optimum (minimum W) is located at the edge of the experimental domain, but at an intermediate flow value. Such an optimum could not have been detected using a linear model, which produces a flat response surface.
Table 4 summarizes the explained variance of the models and the significance of the coefficients for the RT response of all the analytes.
As for the W response, a similar table is provided in the Supplementary Materials (Tables S6). For most analytes (27 out of 40), the coefficient related to flow (b1) was significant with a negative sign, reflecting the inverse relationship between flow and peak width: higher flow leads to lower diffusion and narrower peaks. In contrast, the other coefficients showed both positive and negative signs, depending on the analytes.
Once the optimal conditions for each analyte had been identified in terms of RT and W, a balance was sought to define the two final optimized methods (for analytes in ESI+ and in ESI− mode). To achieve the best compromise, the first step was to identify the optimal common conditions for the majority of analytes.
Then, for the analytes with different optimum conditions, it was assessed whether the RT and W values remained acceptable at the optimum conditions identified for most analytes. Approaches such as the desirability function or Pareto front [39,40] were not suitable in this case, since selecting “intermediate” or “acceptable” values would not result in optimal conditions for all responses [41].
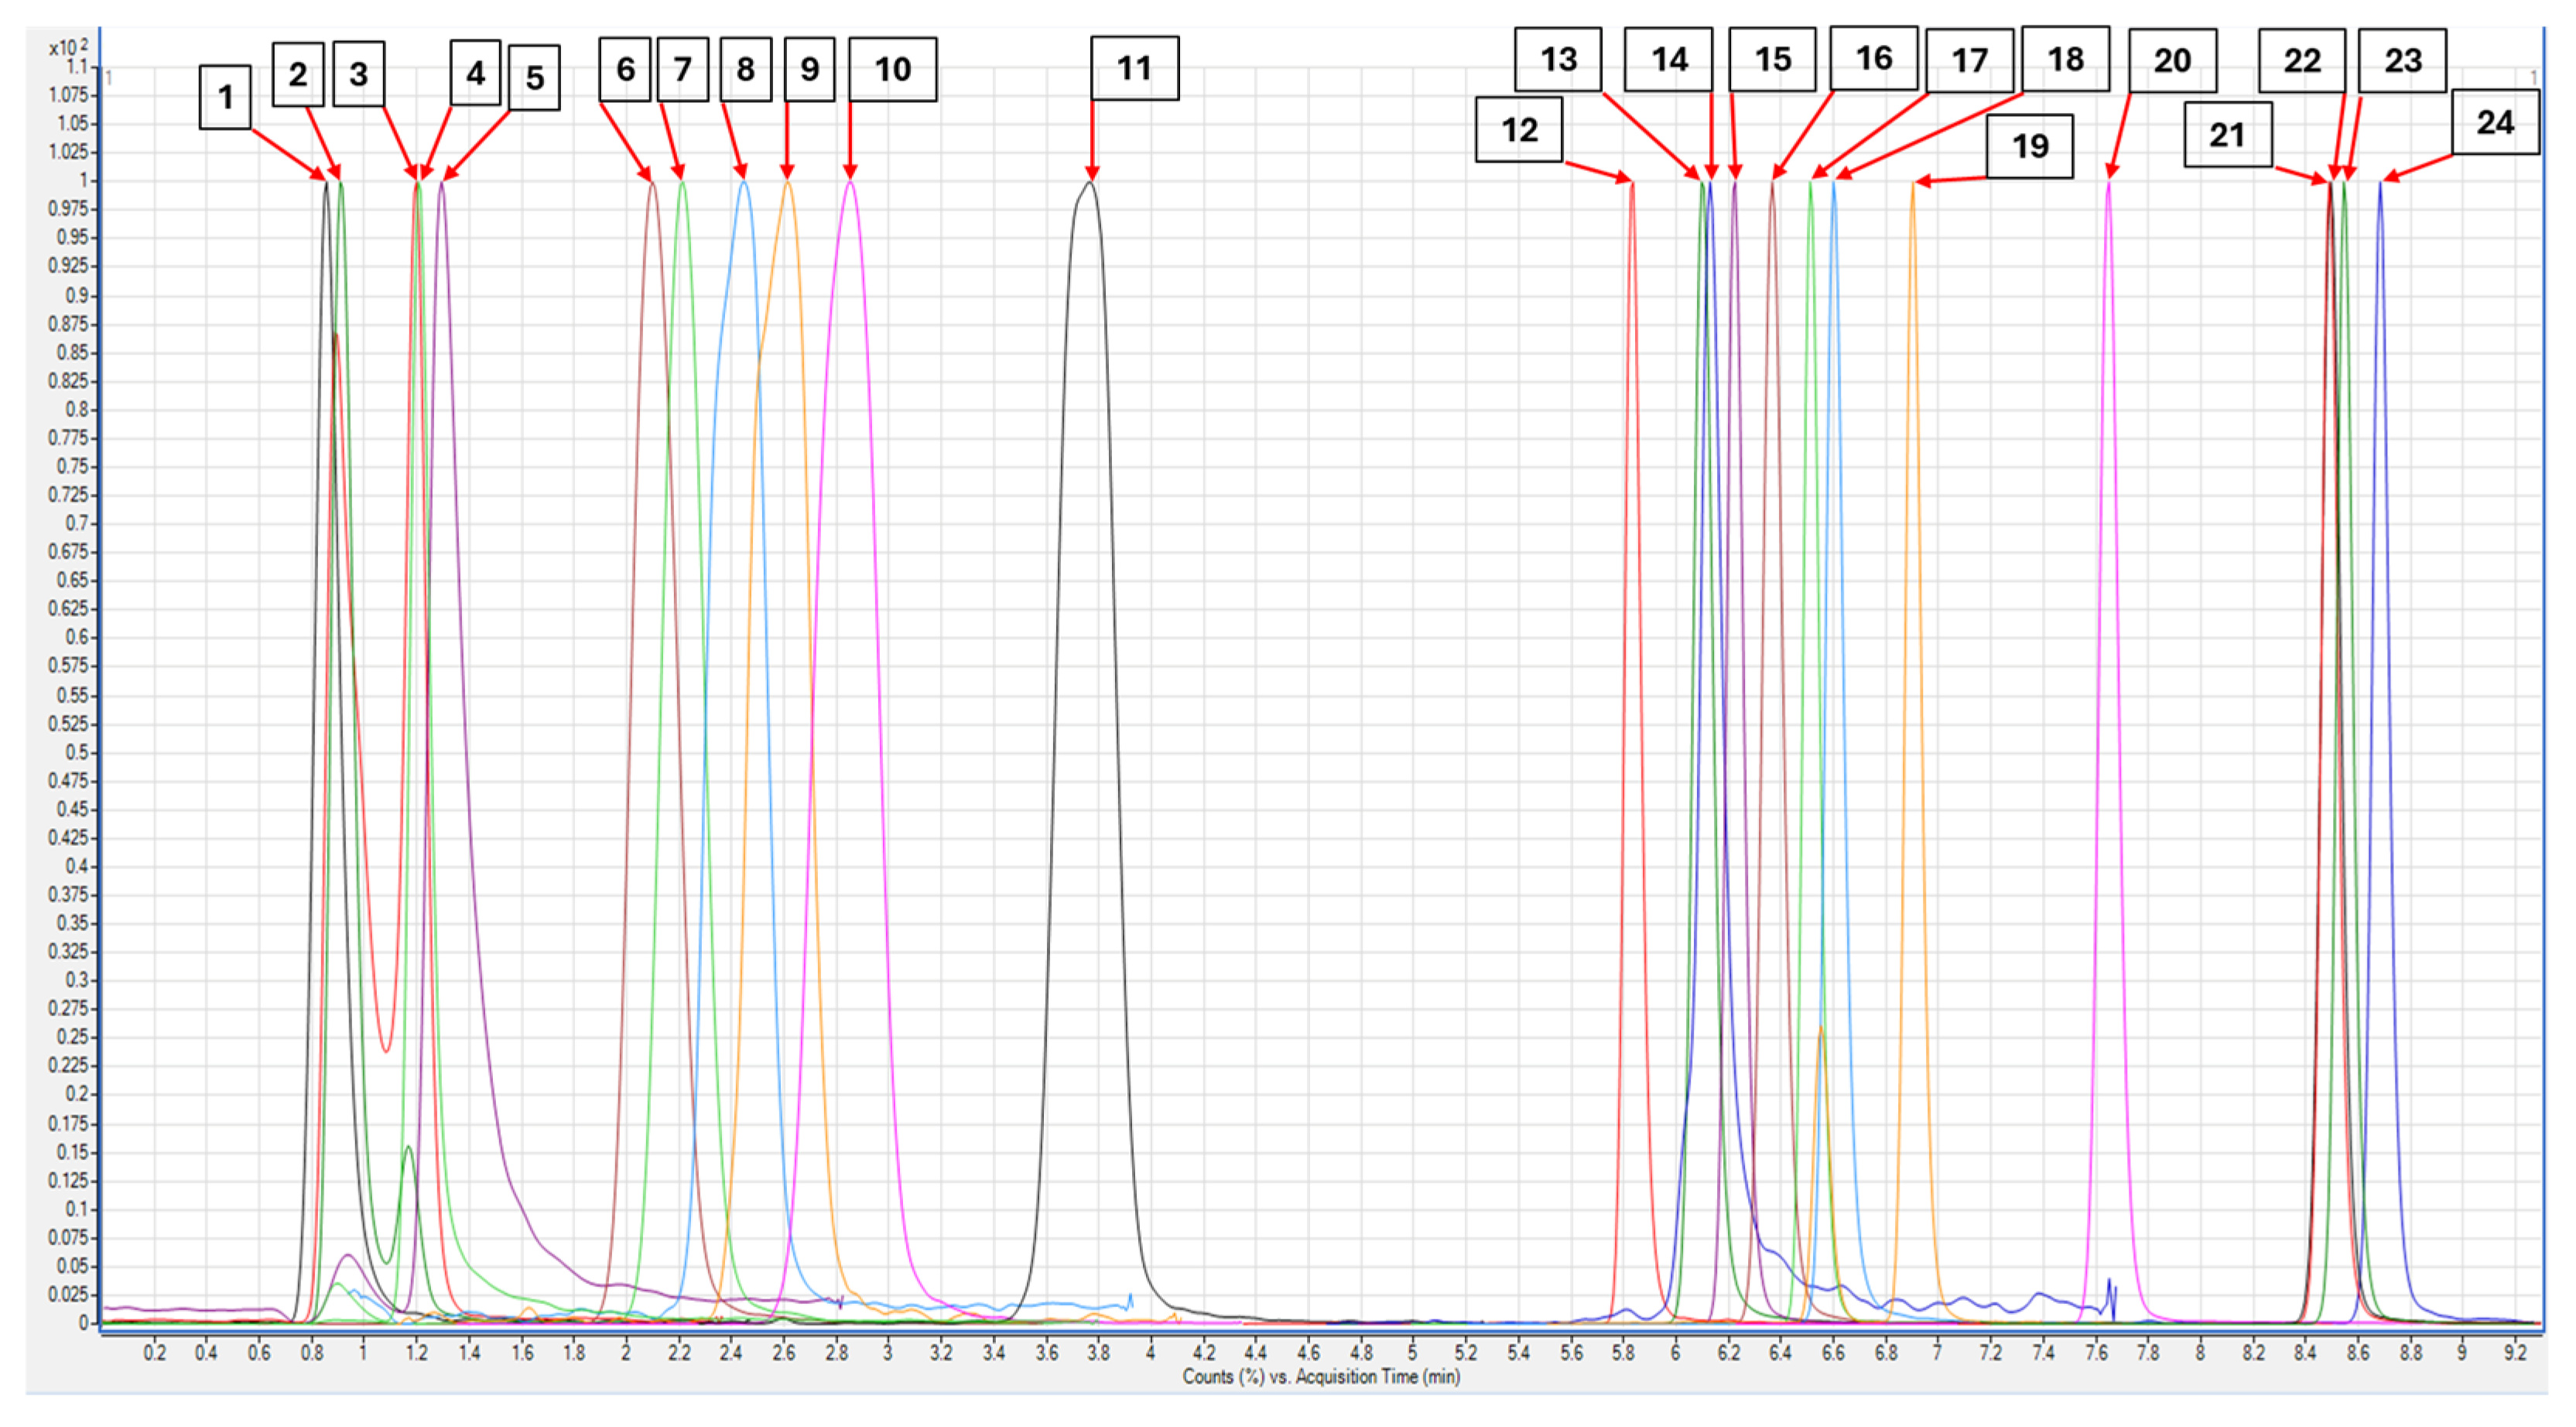
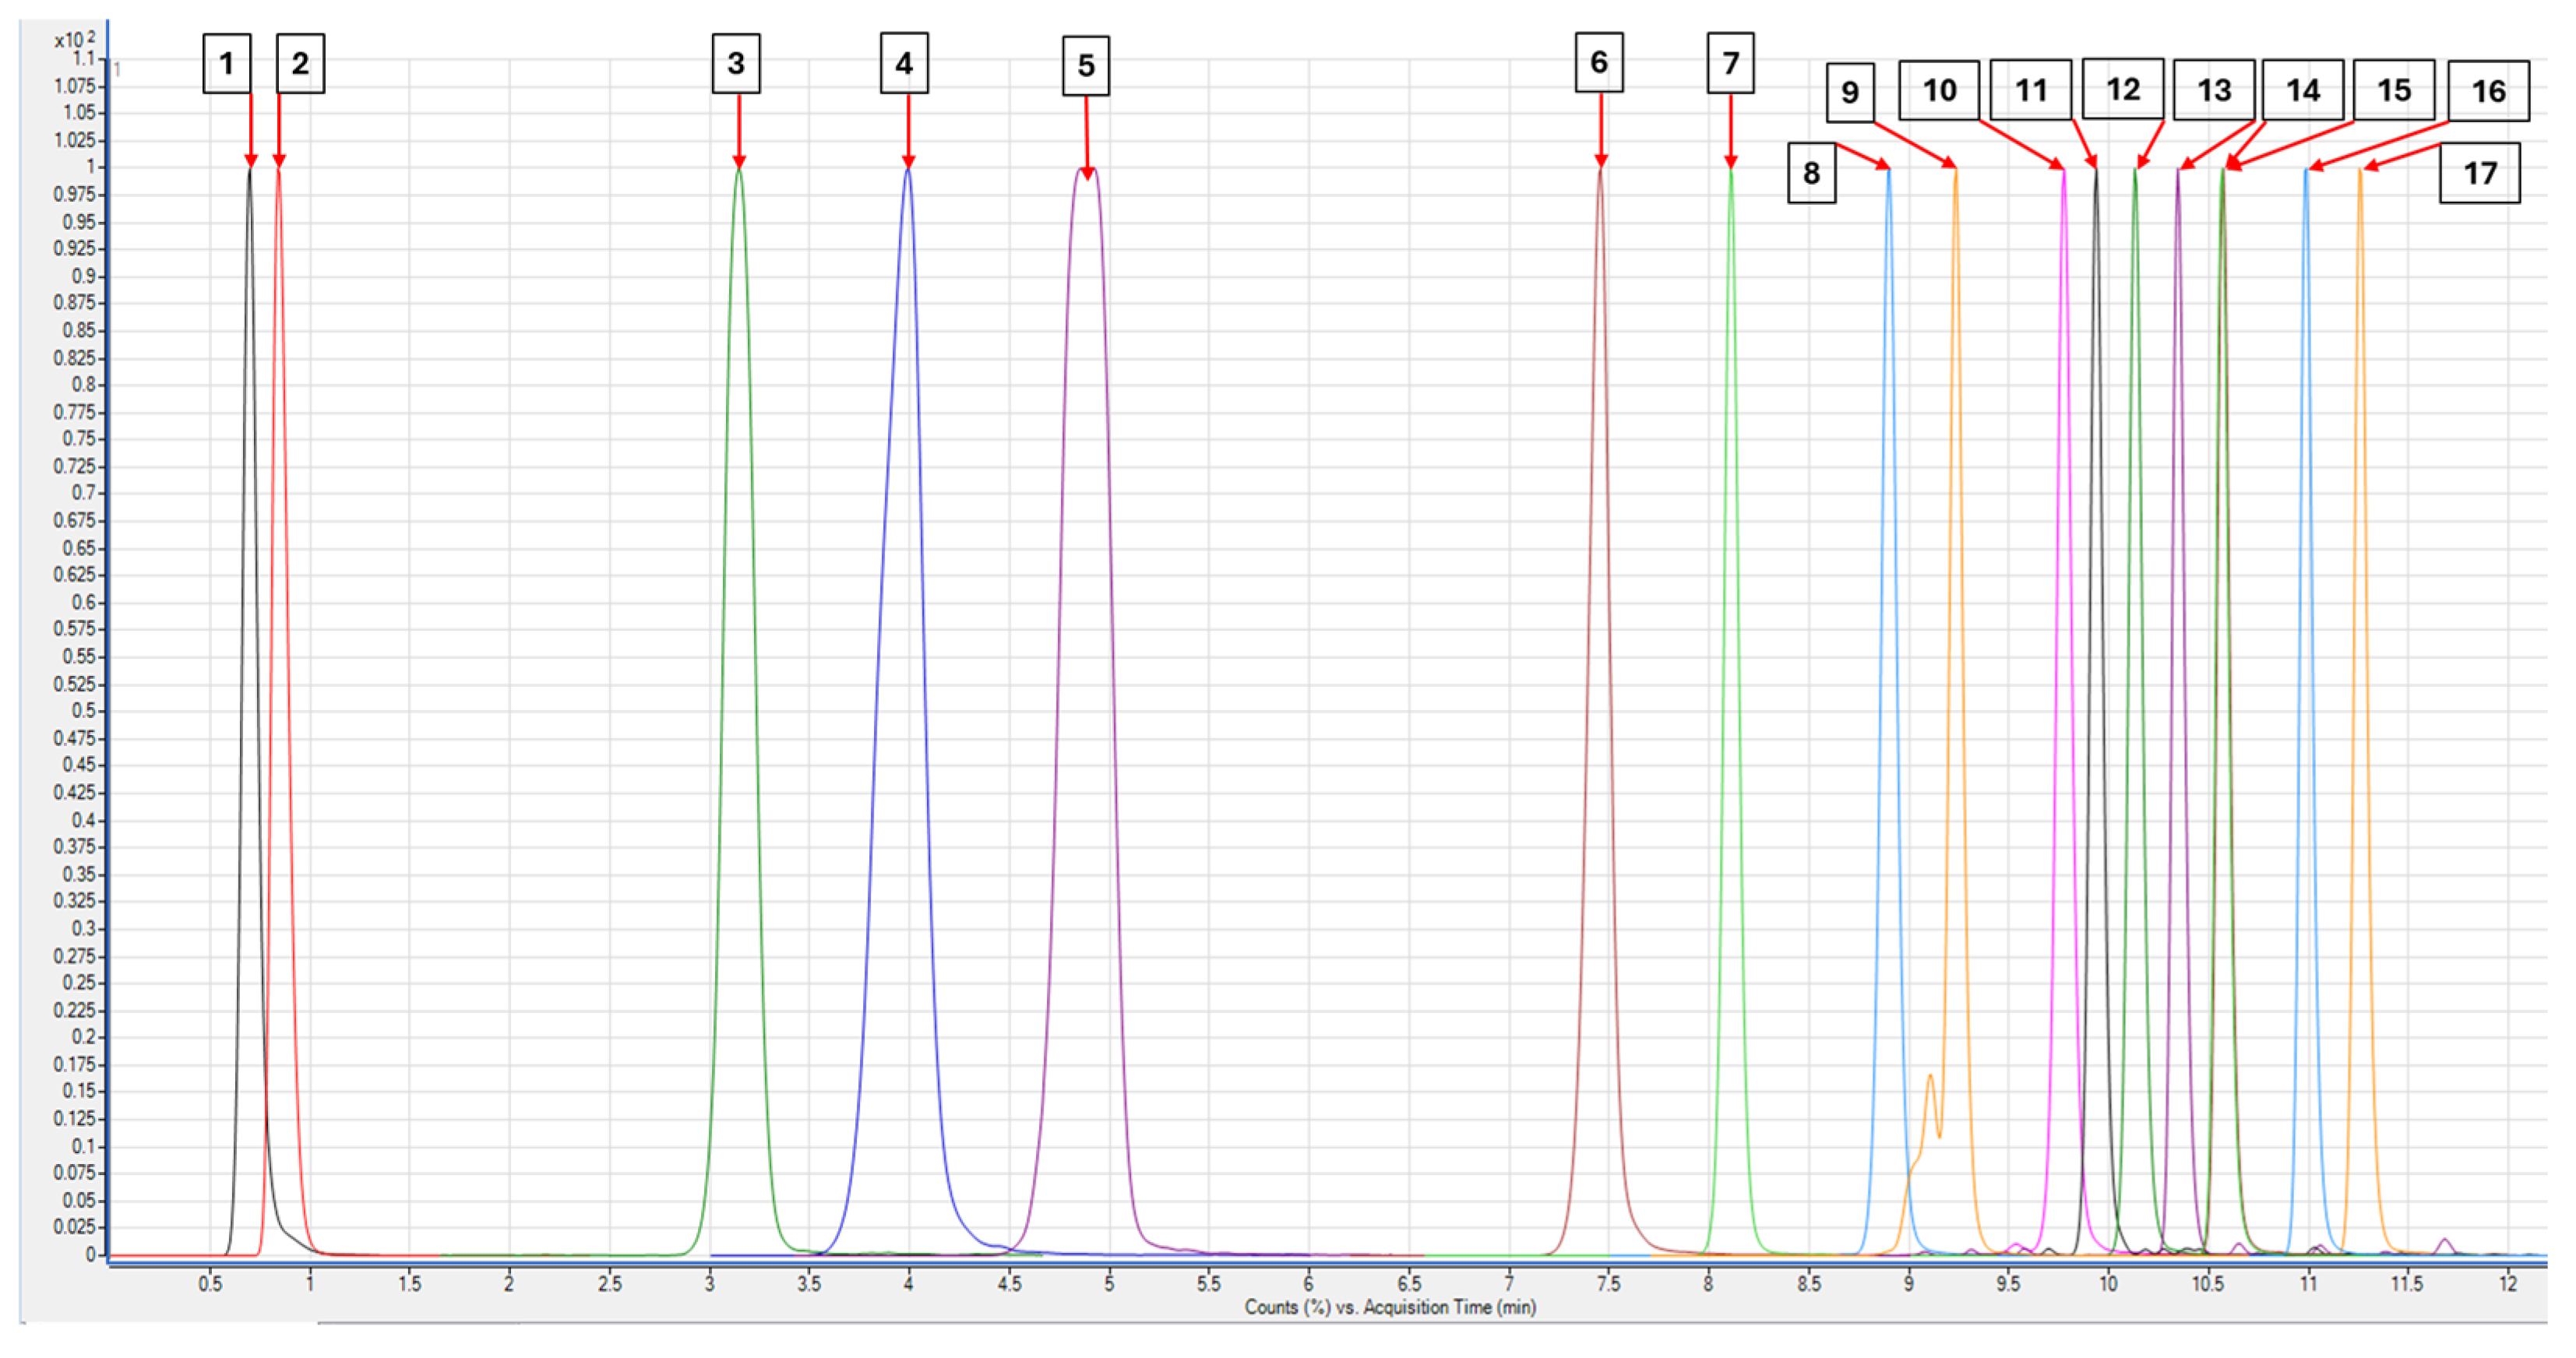
Particular emphasis was placed on the W response, since its optimization improves the resolution and reduces the overall analysis time. Using this approach, the two final optimized methods were outlined; Figure 3 and Figure 4 show the corresponding chromatograms obtained using these optimal conditions. Despite the optimization, coelution persisted for some pairs of analytes; however, this issue was overcome thanks to the mass spectrometry MRM detection. The only remaining problem was the PRX and TFL pair: as the two analytes share the same MRM transition, they were quantified together.

3.2. Method Performances: Results

The overall instrumental method performances are summarized in Table 5. In previous works, the accuracy and precision of the SPE and POCIS processing procedures were determined in terms of recovery and inter-day RSD%, mainly in the ranges 70–130% and 0.5–20%, respectively [35,36]. External calibration curves showed good linearity for most analytes, with R2 values between 0.9902 and 0.9980. The linearity range extended from the respective LOQs of each analyte up to 20 µg L−1. Appropriate sample dilutions were carried out to minimize the matrix effect and ensure that the analytical concentrations fell within the defined linearity range. Regarding specificity evaluation, the ratios of the MRM signal transition (qualifier and quantifier) were calculated in all samples and confirmed to deviate by no more than 30% from the reference standard. Instrumental LODs and LOQs were below 0.5 and 1 µg L−1, respectively, with the exception of IBU (0.774 and 2.554 µg L−1); the lowest values were observed for OD-PABA and TRN, with LODs reaching a few ng L−1 (see Table 5). The optimized methods demonstrated satisfactory precision, with RSD values below 10% for most analytes, with only five exceptions.
A critical comparison between the method presented in this work and those in the literature is challenging, given the broad range of analytes with varying polarities and physico-chemical properties. In any case, a comparison can be made with the method reported by Benedetti et al. [42] employing a Kinetex® C18 Polar column by Phenomenex. The chromatographic method presented in the paper required slightly longer runs and did not provide good retention for many polar analytes (ten analytes eluted within 1.5 min). Furthermore, the minimum instrumental LOD and LOQ values reported were 0.018 µg L−1 and 0.059 µg L−1, respectively, which are higher than those obtained with the optimized method presented (0.002 µg L−1 and 0.008 µg L−1, respectively).

3.3. Matrix Effect in the Analyzed Samples

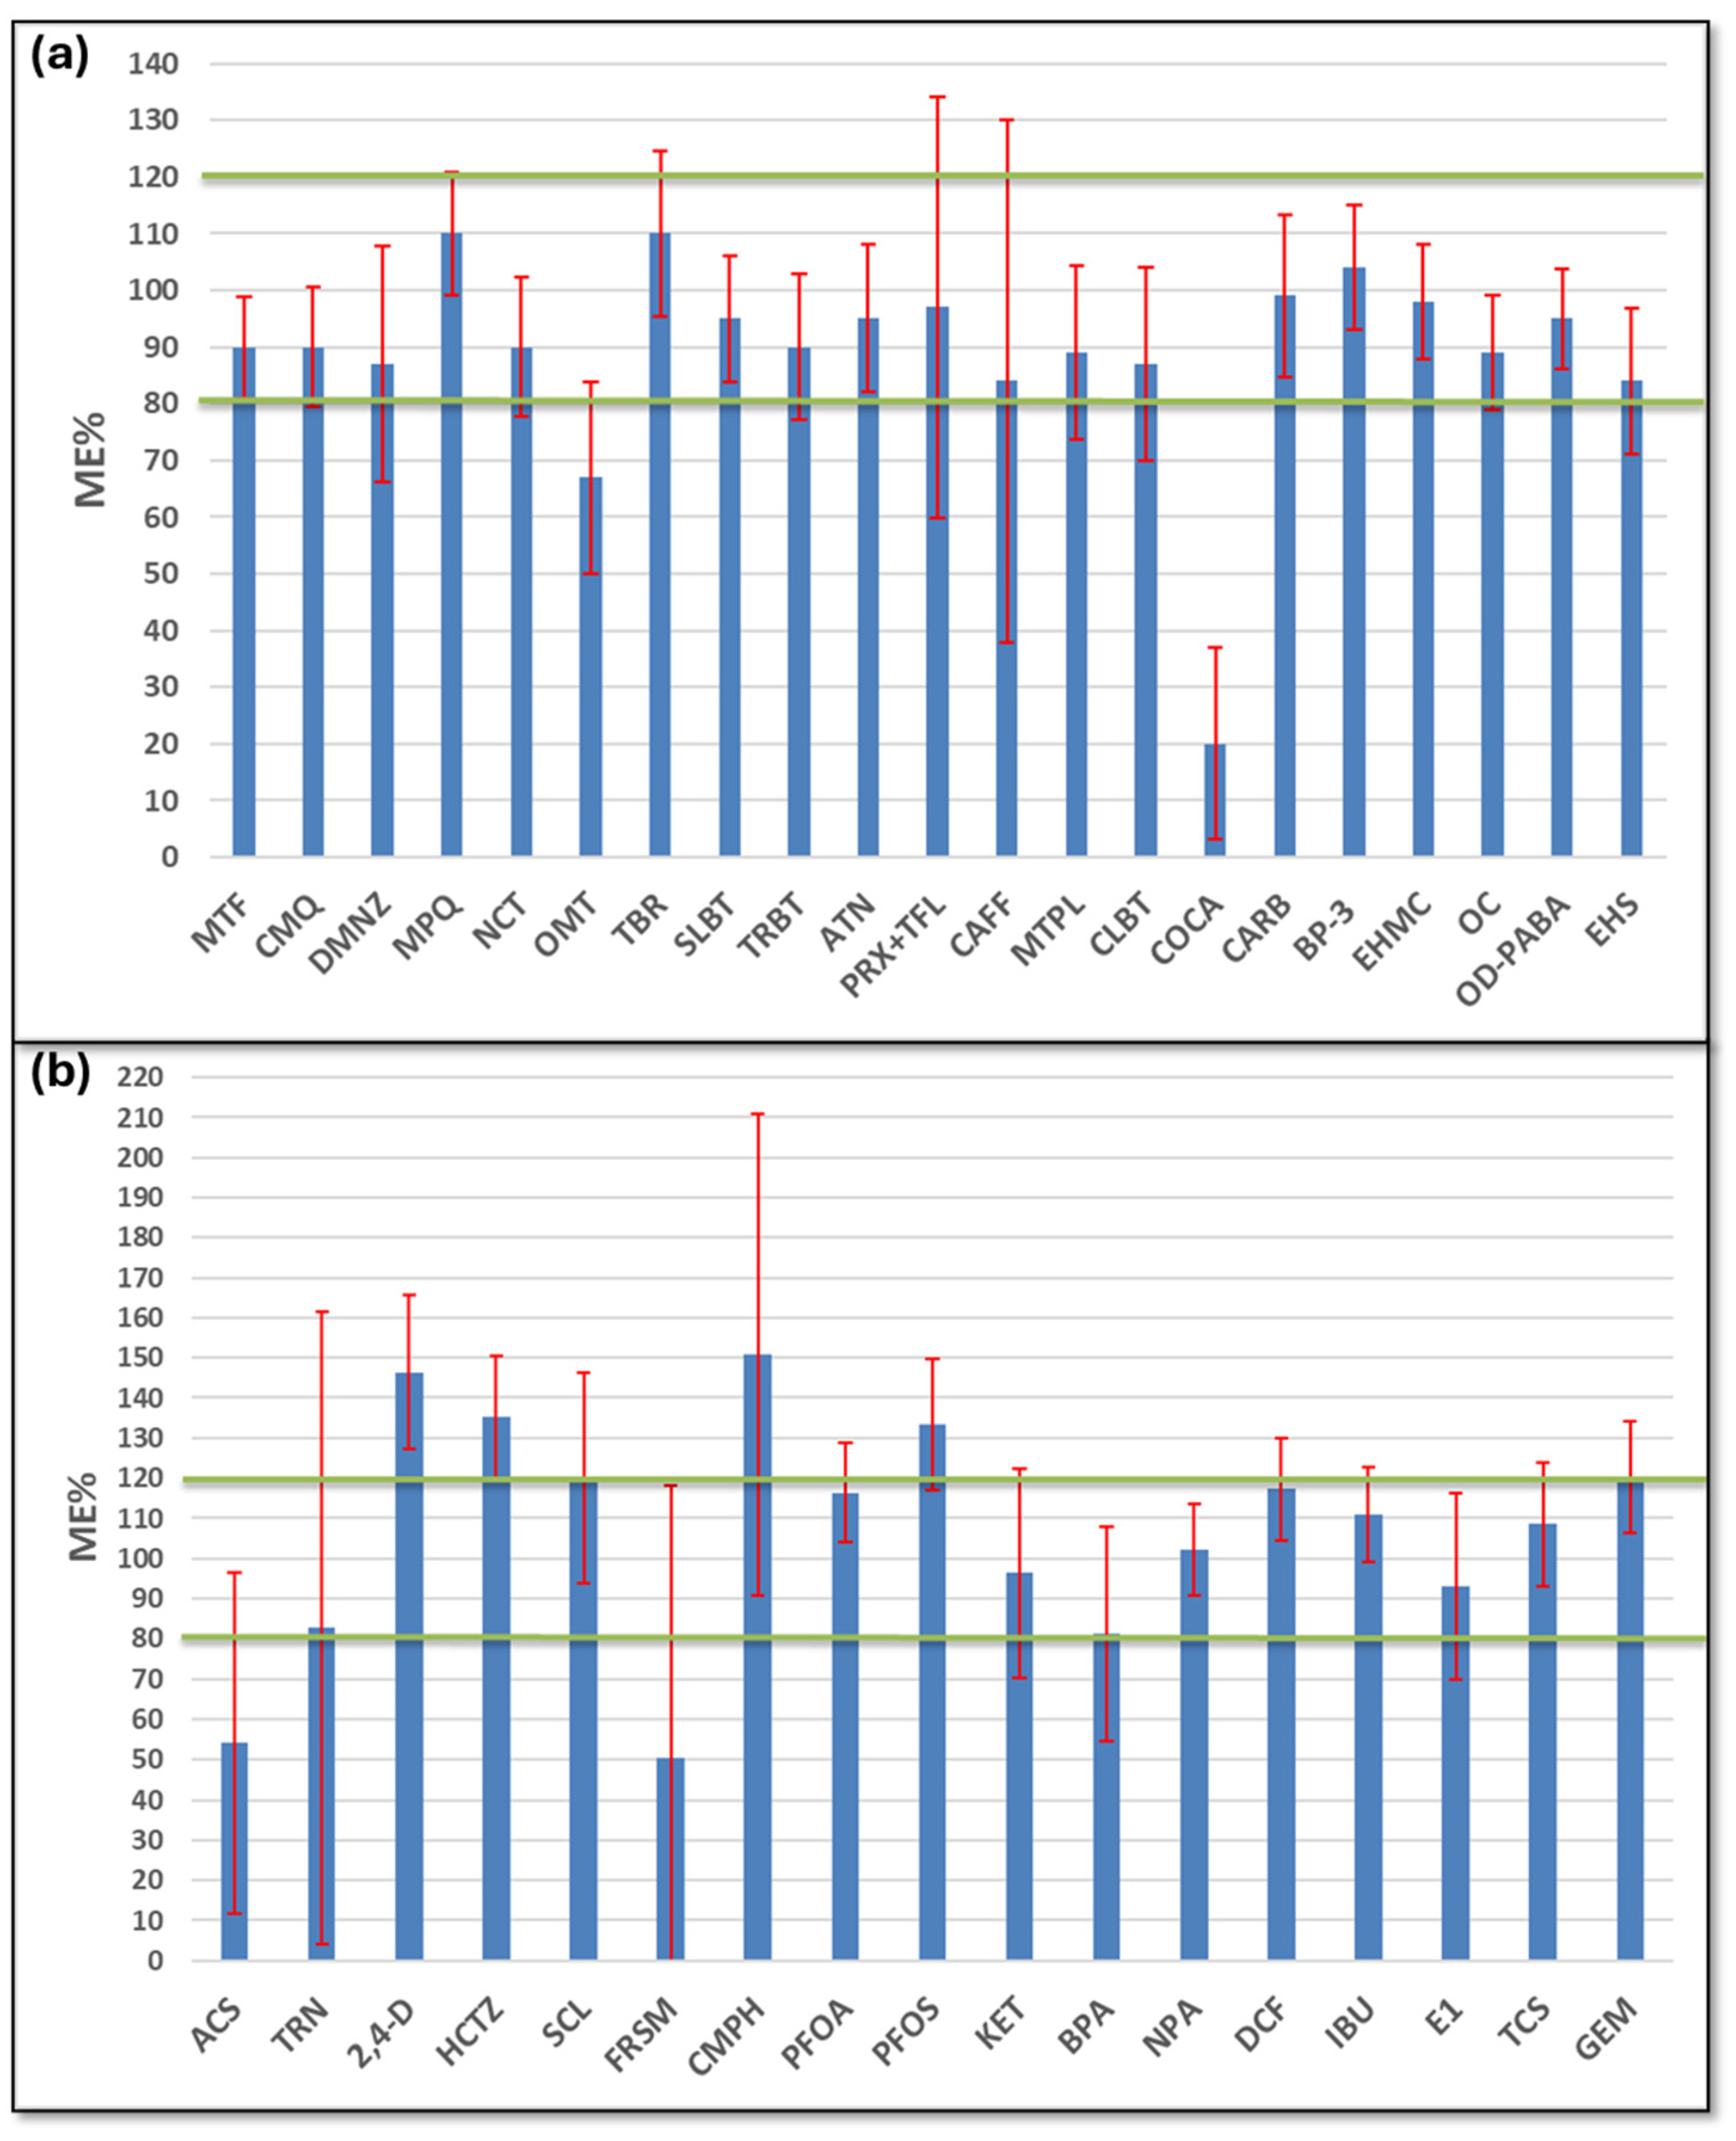
Before quantitation of the studied analytes in real samples, matrix effect evaluation was performed as described in Section 2.5 (Materials and Methods). Matrix effects have been demonstrated to affect the reliability of HPLC-ESI-MS/MS analyses in terms of both accuracy and precision. Furthermore, ion suppression can negatively impact the limit of detection [43,44]. A matrix effect within the range 80–120% is generally considered acceptable for adequate analytical accuracy [45,46].
Figure 4 shows the matrix effect results for all analytes, averaged over all the samples, along with the associated standard deviation. Regarding the positive ionization analytes, the results were satisfactory: 17 out of 21 analytes resulted within the acceptable range, both in terms of ME and variability. It should be pointed out that these values are averaged over the whole sample set, indicating mostly consistent matrix effects, regardless of the sampling site and strategy (spot or passive sampling). However, in four cases (OMT, PRX + TFL, CAFF and COCA), values fell outside this range or exhibited significant variation from sample to sample.
OFLO and TETRA are not shown in Figure 5a due to unacceptable matrix effect values. Indeed, OFLO exhibited strong ion enhancement, while TETRA was mostly suppressed (with ME below 20%), both showing large fluctuations across samples. If these compounds were present in real samples, reliable quantitation could not be guaranteed, due to significant matrix interference.
Regarding the negative ionization analytes, shown in Figure 5b, 10 out of the 17 analytes showed matrix effects within the acceptable range. ACS, TRN, 2,4-D, HCTZ, FRSM, CMPH and PFOS showed unsatisfactory matrix effect values in different samples, also with large variability. ACS and FRSM showed the greatest signal suppression (around 50%); therefore, any detected concentrations should be considered semi-quantitative.
Considering both ionization modes, almost all analytes with unacceptable ME values were rather polar, with less retained in the PFP column. They probably co-elute with polar matrix interferents that contribute to significant signal suppression.

3.4. Method Application to Real Samples

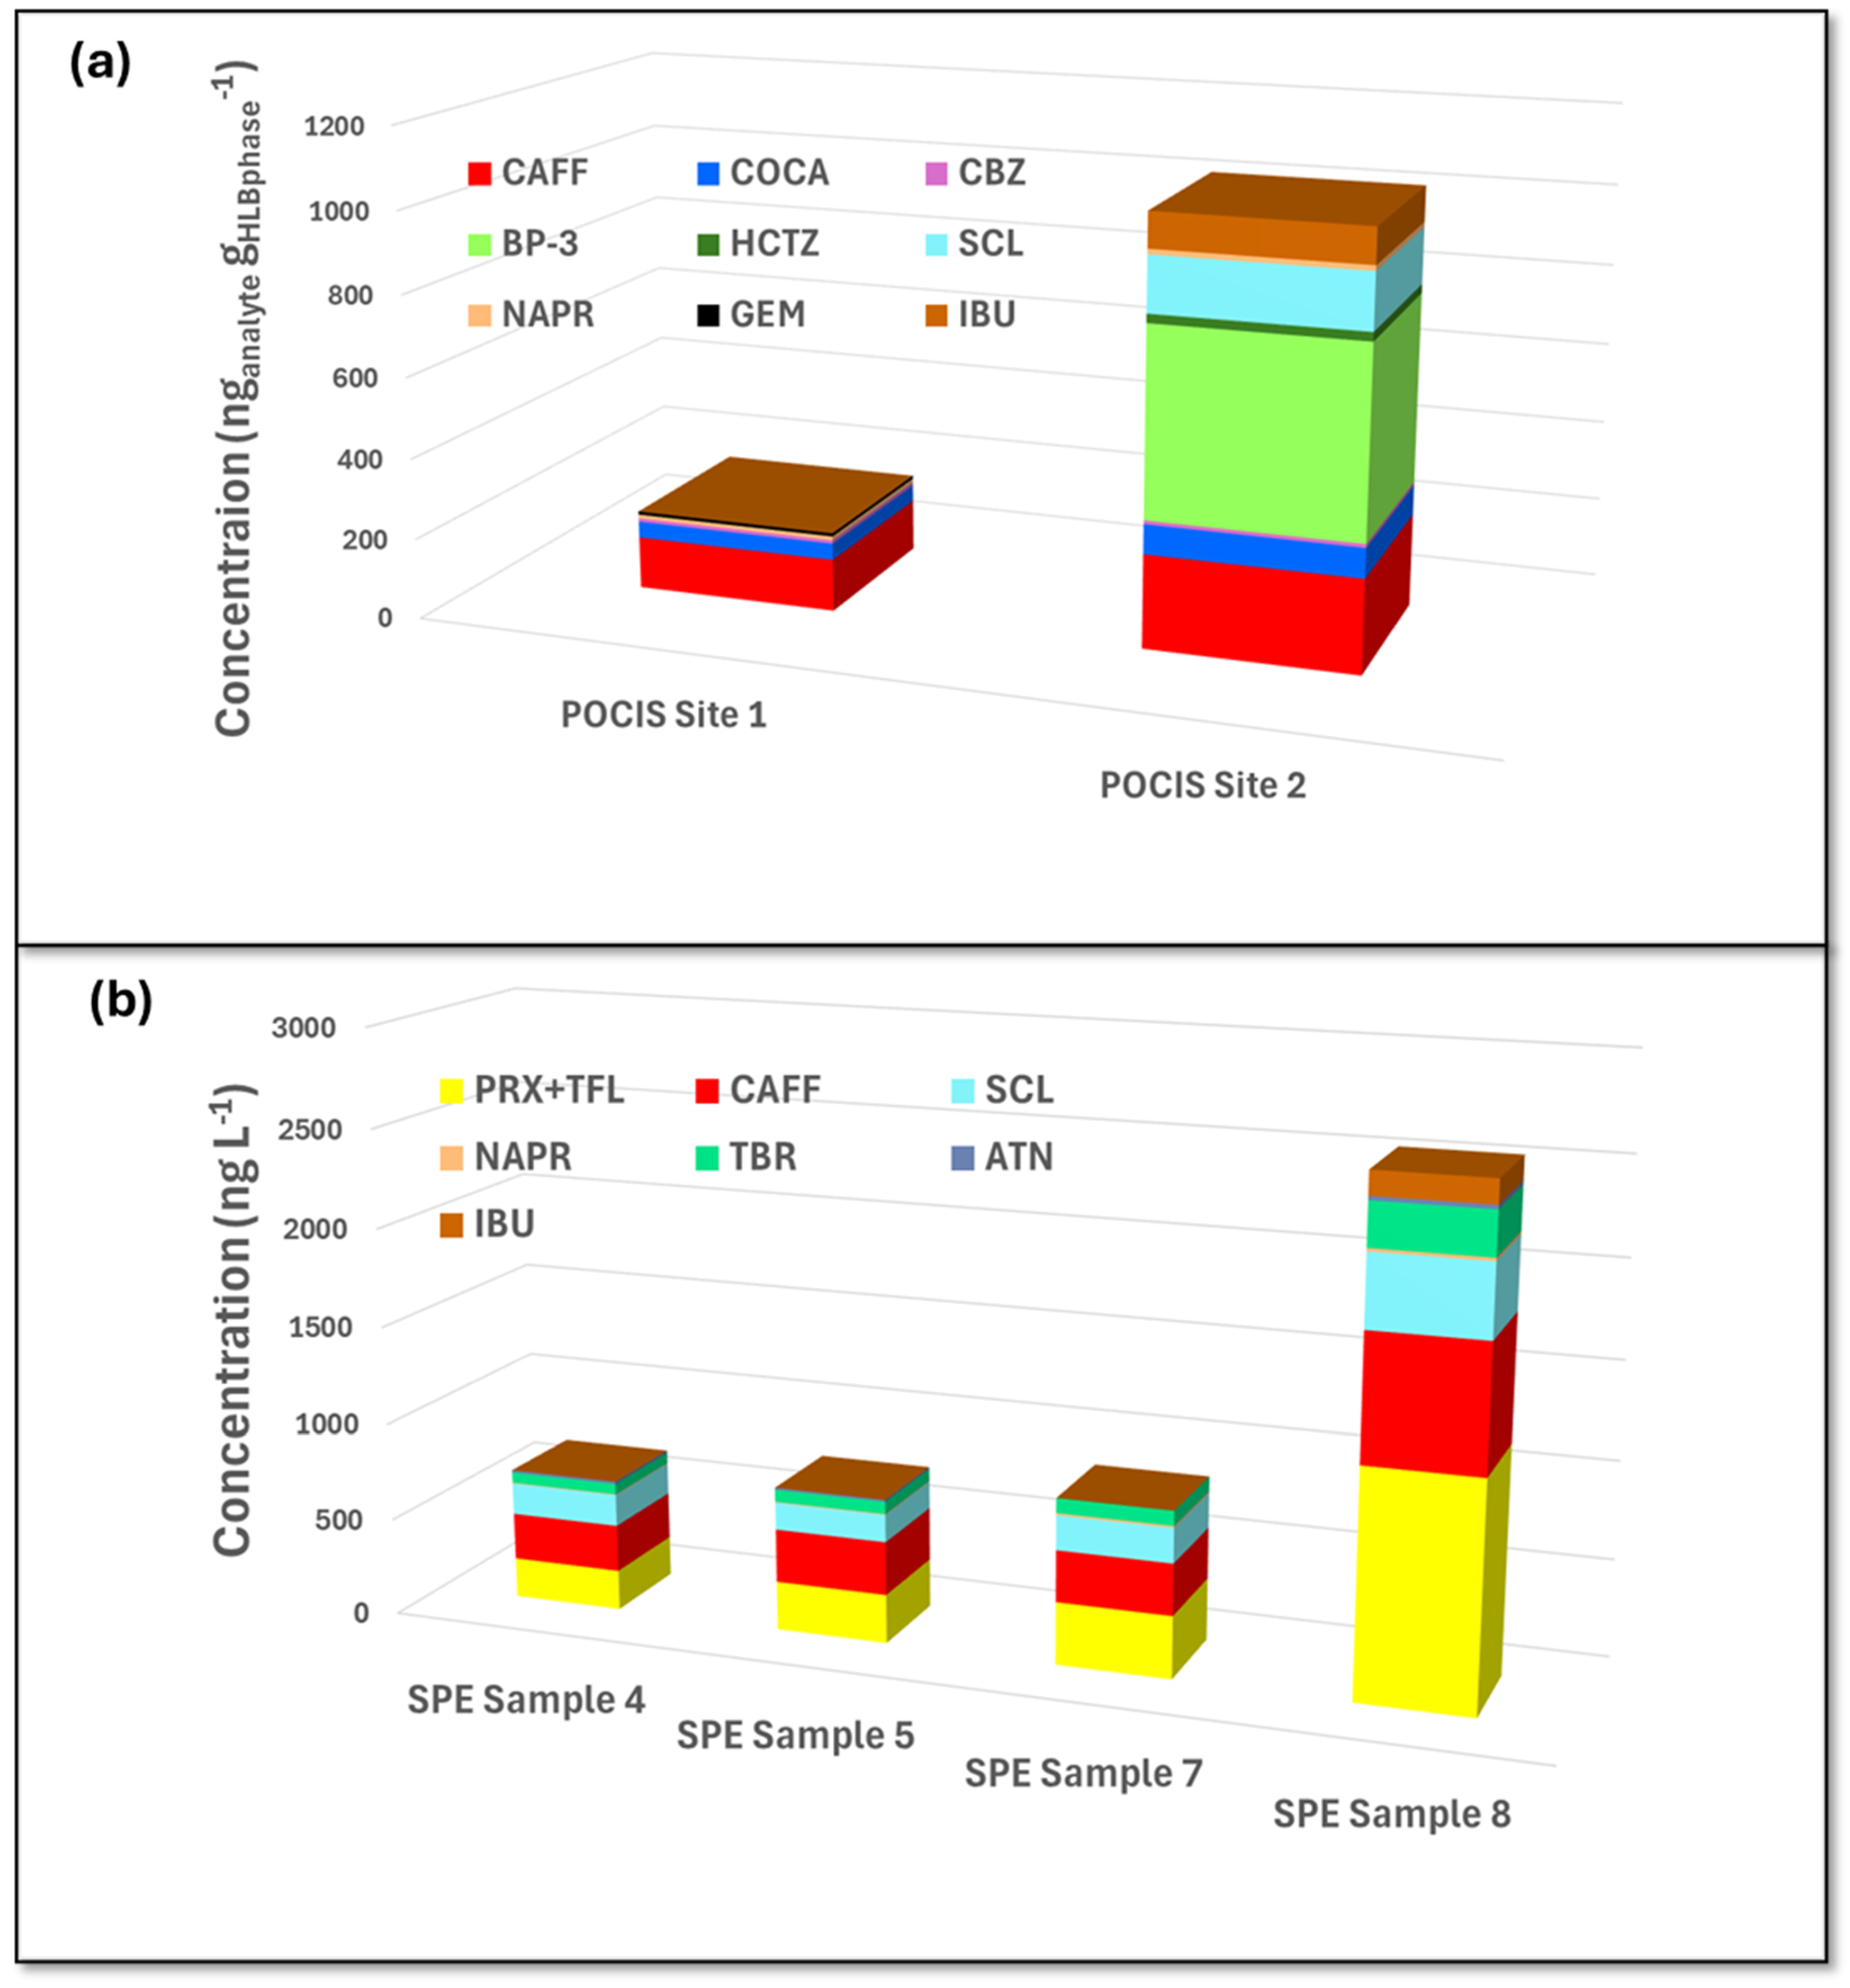
Quantitative data were obtained from external calibration curves, since matrix effects were negligible for most detected compounds. Normalization for ME was necessary in a few cases. The complete dataset is reported in Table S7, while data for quantified analytes are shown in Figure 6.
Regarding passive sampling, compound concentrations are expressed as nganalyte gHLBphase−1 (taking into account the mass of the POCIS phase) and are shown in Figure 5a. Careful POCIS calibration would be necessary to determine the Time-Weighted Average Concentration in water, which is beyond the scope of this work. Nevertheless, the semiquantitative data obtained allowed the comparison of the different sites over a prolonged deployment, thus providing more information than a simple snapshot and potentially capturing episodic contamination, while achieving lower detection limits. Site 2, located closer to the touristic marina, generally exhibited higher contaminations. The most concentrated analytes in both samples were CAFF, SCL, IBU and BP-3, with the highest concentration observed for BP-3 in POCIS site 2 (468 ± 5 ng g HLB−1). Despite sampling during winter, this analyte has been previously reported as the most frequently detected UV-filter in seawater, including harbor areas [47].
Regarding spot sampling, concentrations are expressed as ng L−1 analyte in water and are shown in Figure 5b. The tracers TBR, PRX, TFL, CAFF and SCL were the most abundant, with the highest reported concentration of approximately 1100 ng L−1 for PRX + TFL in SPE Sample 8. Pharmaceuticals were generally detected at lower levels, with GEM consistently close to the LOQ, analogously to the POCIS samples.
Out of a total of 40 analytes, 10 were quantified via POCIS sampling and 11 in the spot samples. Direct comparison between seawater concentrations obtained via spot sampling and the concentrations in the POCIS HLB sorbent is not possible. Nevertheless, several common analytes were detected, highlighting the most relevant contaminants at the considered sites (tracers and pharmaceuticals), in agreement with previous studies in the area [36,48]. The presence of these analytes could be related to a general contamination of seawater sites close to river mouths, not far from discharges of urban treated wastewater. It is worth noting that in the only sample collected at the mouth of the Bisagno river (SPE sample 6), no analytes were above the detection limit, indicating a less impacted site.
Overall, these results demonstrate the applicability of the method for further investigation into the presence and distribution of these ECs in surface waters.

4. Conclusions

In this work, two chromatographic methods coupled to mass spectrometry, in positive and negative ionization modes, were developed for several target analytes applying the DoE approach.
Optimization was achieved with a limited number of rationally planned experiments (n = 11), simultaneously considering two chromatographic variables and a large number of responses (80 in total, including both RT and W responses). The methods obtained are rapid (9 and 12 min analysis time, excluding post time), sensitive and accurate, allowing the determination of 40 analytes of different polarities with the same chromatographic column. The LC-MS/MS methods show LODs ranging from 0.002 to 0.357 µg L−1, good linearity, specificity and repeatability (RSD < 15%).
Application of these methods to seawater samples from the Genoa port area, collected using both spot and passive sampling techniques, allowed successful detection and quantitation of the target analytes, demonstrating the suitability of the methods.
In the future, the optimized methods could be applied to additional surface water samples to further support environmental monitoring, taking advantage of the efficiency and sensitivity of the instrumental approach.

Supplementary Materials

The following supporting information can be downloaded at: https://www.mdpi.com/article/10.3390/separations12100257/s1, Table S1: Target analytes studied; Table S2: Details of the mass detection of all considered analytes in ESI+ and ESI− modes, including the parameters of the MRM detection; Table S3. Gradients used during DoE for flows of 0.1, 0.2 and 0.3 ml min−1 for positive ionized analytes (ESI+); Table S4: Gradients used for flows of 0.2, 0.25 and 0.3 ml min−1 for negative ionized analytes (ESI−); Table S5: Details of real samples and sampling sites. Polcevera and Bisagno are local rivers, while Puntavagno is a delimited port area; Table S6: Explained variance and significance of coefficients for W models; Table S7: Concentration results in seawater samples.

Author Contributions

Conceptualization, M.D.C. and B.B.; methodology, B.B.; validation, B.B.; formal analysis, D.B.; investigation, D.B.; resources, E.M. and B.B.; data curation, D.B. and B.B.; writing—original draft preparation, D.B.; writing—review and editing, M.D.C. and B.B.; visualization, D.B.; supervision, M.D.C. and B.B.; project administration, E.M.; funding acquisition, E.M. All authors have read and agreed to the published version of the manuscript.

Funding

This research received no external funding.

Data Availability Statement

Data is contained within the article or Supplementary Material. Further inquiries can be directed to the corresponding author.

Acknowledgments

The authors acknowledge Marco Capello and Laura Cutroneo (University of Genoa), for their valuable assistance in providing real samples for this study.

Conflicts of Interest

The authors declare no conflicts of interest.

References

  1. Verlicchi, P.; Al Aukidy, M.; Zambello, E. Occurrence of Pharmaceutical Compounds in Urban Wastewater: Removal, Mass Load and Environmental Risk after a Secondary Treatment—A Review. Sci. Total Environ. 2012, 429, 123–155. [Google Scholar] [CrossRef]
  2. Li, X.; Shen, X.; Jiang, W.; Xi, Y.; Li, S. Comprehensive Review of Emerging Contaminants: Detection Technologies, Environmental Impact, and Management Strategies. Ecotoxicol. Environ. Saf. 2024, 278, 116420. [Google Scholar] [CrossRef]
  3. Lozano, I.; Pérez-Guzmán, C.J.; Mora, A.; Mahlknecht, J.; Aguilar, C.L.; Cervantes-Avilés, P. Pharmaceuticals and Personal Care Products in Water Streams: Occurrence, Detection, and Removal by Electrochemical Advanced Oxidation Processes. Sci. Total Environ. 2022, 827, 154348. [Google Scholar] [CrossRef]
  4. Méndez-Catalán, J.; Socas-Hernández, C.; Jiménez-Skrzypek, G.; Hernández-Borges, J.; González-Sálamo, J. Evaluation of the Presence of Emerging Contaminants in Wastewater and Seawater Using Automated Solid-Phase Extraction and Ultra-High-Performance Liquid Chromatography Coupled to Tandem Mass Spectrometry. J. Chromatogr. Open 2024, 6, 100178. [Google Scholar] [CrossRef]
  5. Robin, J.; Lefeuvre, S.; Guihenneuc, J.; Cambien, G.; Dupuis, A.; Venisse, N. Analytical Methods and Biomonitoring Results in Hair for the Assessment of Exposure to Endocrine-Disrupting Chemicals: A Literature Review. Chemosphere 2024, 353, 141523. [Google Scholar] [CrossRef]
  6. Bergman, A.; Heindel, J.; Jobling, S.; Kidd, K.; Zoeller, R.T. State-of-the-Science of Endocrine Disrupting Chemicals, 2012. Toxicol. Lett. 2012, 211, S3. [Google Scholar] [CrossRef]
  7. Colzani, L.; Forni, C.; Clerici, L.; Barreca, S.; Dellavedova, P. Determination of Pollutants, Antibiotics, and Drugs in Surface Water in Italy as Required by the Third EU Water Framework Directive Watch List: Method Development, Validation, and Assessment. Environ. Sci. Pollut. Res. 2024, 31, 14791–14803. [Google Scholar] [CrossRef] [PubMed]
  8. Xie, D.; Wu, Y.; Wang, Z.; Ma, X. Detection of Trace Estrogens in Environmental Water by Multi-Template Molecularly Imprinted Polymers Based Magnetic Solid Phase Extraction Coupled Solidified Floating Organic Drop Microextraction and HPLC. Microchem. J. 2025, 213, 113875. [Google Scholar] [CrossRef]
  9. Mahdavijalal, M.; Petio, C.; Staffilano, G.; Mandrioli, R.; Protti, M. Innovative Solid-Phase Extraction Strategies for Improving the Advanced Chromatographic Determination of Drugs in Challenging Biological Samples. Molecules 2024, 29, 2278. [Google Scholar] [CrossRef] [PubMed]
  10. Guo, Y. Recent Progress in the Fundamental Understanding of Hydrophilic Interaction Chromatography (HILIC). Analyst 2015, 140, 6452–6466. [Google Scholar] [CrossRef]
  11. Fernández-Fernández, V.; Ramil, M.; Cela, R.; Rodríguez, I. Solid-Phase Extraction and Fractionation of Multiclass Pollutants from Wastewater Followed by Liquid Chromatography Tandem-Mass Spectrometry Analysis. Anal. Bioanal. Chem. 2022, 414, 4149–4165. [Google Scholar] [CrossRef]
  12. Mirzaei, R.; Yunesian, M.; Nasseri, S.; Gholami, M.; Jalilzadeh, E.; Shoeibi, S.; Bidshahi, H.S.; Mesdaghinia, A. An Optimized SPE-LC-MS/MS Method for Antibiotics Residue Analysis in Ground, Surface and Treated Water Samples by Response Surface Methodology- Central Composite Design. J. Environ. Health Sci. Eng. 2017, 15, 21. [Google Scholar] [CrossRef]
  13. Gros, M.; Rodríguez-Mozaz, S.; Barceló, D. Rapid Analysis of Multiclass Antibiotic Residues and Some of Their Metabolites in Hospital, Urban Wastewater and River Water by Ultra-High-Performance Liquid Chromatography Coupled to Quadrupole-Linear Ion Trap Tandem Mass Spectrometry. J. Chromatogr. A 2013, 1292, 173–188. [Google Scholar] [CrossRef]
  14. Ramadan, L.; Ozturk-Ufuk, I.; Yuksel, E.; Topuz, E. Development of LC–MS/MS Method for the Simultaneous Detection of Emerging Contaminants in Aquatic Matrices. Water Air Soil Pollut. 2024, 235, 537. [Google Scholar] [CrossRef]
  15. Alvarez, D.A.; Petty, J.D.; Huckins, J.N.; Jones-Lepp, T.L.; Getting, D.T.; Goddard, J.P.; Manahan, S.E. Development of a Passive, in Situ, Integrative Sampler for Hydrophilic Organic Contaminants in Aquatic Environments. Environ. Toxicol. Chem. 2004, 23, 1640–1648. [Google Scholar] [CrossRef] [PubMed]
  16. MacKeown, H.; Magi, E.; Di Carro, M.; Benedetti, B. Unravelling the Role of Membrane Pore Size in Polar Organic Chemical Integrative Samplers (POCIS) to Broaden the Polarity Range of Sampled Analytes. Anal. Bioanal. Chem. 2022, 414, 1963–1972. [Google Scholar] [CrossRef] [PubMed]
  17. Krishnamoorthy, G.; Alluvada, P.; Alemayehu, E.; Sherieff, S.H.M.; Addi, W.A.; Kwa, T.; Krishnamoorthy, J. Log D Analysis Using Dynamic Approach. Biochem. Biophys. Rep. 2018, 16, 1–11. [Google Scholar] [CrossRef]
  18. Metcalfe, C.D.; Bayen, S.; Desrosiers, M.; Muñoz, G.; Sauvé, S.; Yargeau, V. Methods for the Analysis of Endocrine Disrupting Chemicals in Selected Environmental Matrixes. Environ. Res. 2022, 206, 112616. [Google Scholar] [CrossRef]
  19. Meher, A.K.; Zarouri, A. Environmental Applications of Mass Spectrometry for Emerging Contaminants. Molecules 2025, 30, 364. [Google Scholar] [CrossRef] [PubMed]
  20. Heidorn, M. The Role of Temperature and Column Thermostatting in Liquid Chromatography; Thermo Fisher Scientific: Germering, Germany, 2016. [Google Scholar]
  21. Vanhoenacker, G.; Sandra, P. High Temperature and Temperature Programmed HPLC: Possibilities and Limitations. Anal. Bioanal. Chem. 2008, 390, 245–248. [Google Scholar] [CrossRef]
  22. Carr, P.; Wang, X.; Stoll, D. A Simple Approach to Performance Optimization in HPLC and Its Application in Ultrafast Separation Development. LCGC N. Am. 2010, 28, 932–942. [Google Scholar]
  23. Lakka, N.S.; Kuppan, C.; Lakka, N.S.; Kuppan, C. Principles of Chromatography Method Development. In Biochemical Analysis Tools—Methods for Bio-Molecules Studies; IntechOpen: London, UK, 2019; ISBN 978-1-78984-857-1. [Google Scholar]
  24. Saad, M.N.; Essam, H.M.; Elzanfaly, E.S.; Amer, S.M. A Two-Step Optimization Approach: Validated RP-HPLC Method for Determination of Gatifloxacin and Dexamethasone in Ophthalmic Formulation. J. Chromatogr. Sci. 2020, 58, 504–510. [Google Scholar] [CrossRef]
  25. Vilkickyte, G.; Raudone, L. Optimization, Validation and Application of HPLC-PDA Methods for Quantification of Triterpenoids in Vaccinium Vitis-Idaea L. Molecules 2021, 26, 1645. [Google Scholar] [CrossRef]
  26. Paun, I.; Pascu, L.F.; Iancu, V.I.; Pirvu, F.; Galaon, T.; Chiriac, F.L. Simultaneous Determination of 17 Phenolic Compounds in Surface Water and Wastewater Matrices Using an HPLC-DAD Method. Environments 2024, 11, 117. [Google Scholar] [CrossRef]
  27. Benedetti, B.; Caponigro, V.; Ardini, F. Experimental Design Step by Step: A Practical Guide for Beginners. Crit. Rev. Anal. Chem. 2022, 52, 1015–1028. [Google Scholar] [CrossRef] [PubMed]
  28. Nunes, M.J.; Paz, V.; Cordas, C.M.; Noronha, J.P.; Branco, L.C. LC-MS/MS Methodology Development and Validation for the Screening and Quantification of Five Antibiotics in Water. Anal. Methods 2022, 14, 935–948. [Google Scholar] [CrossRef] [PubMed]
  29. Carve, M.; Singh, N.; Askeland, M.; Allinson, G.; Shimeta, J. Salting-out Assisted Liquid–Liquid Extraction Combined with LC–MS/MS for the Simultaneous Determination of Seven Organic UV Filters in Environmental Water Samples: Method Development and Application. Environ. Sci. Pollut. Res. 2023, 30, 104870–104885. [Google Scholar] [CrossRef]
  30. Martin, P.J.; He, K.; Blaney, L.; Hobbs, S.R. Advanced Liquid Chromatography with Tandem Mass Spectrometry Method for Quantifying Glyphosate, Glufosinate, and Aminomethylphosphonic Acid Using Pre-Column Derivatization. ACS EST Water 2023, 3, 2407–2414. [Google Scholar] [CrossRef] [PubMed]
  31. Ikizoglu, B. PFOA and PFOS Pollution in Surface Waters and Surface Water Fish. Water 2024, 16, 2342. [Google Scholar] [CrossRef]
  32. Baglietto, M.; Benedetti, B.; Di Carro, M.; Magi, E. Polar Licit and Illicit Ingredients in Dietary Supplements: Chemometric Optimization of Extraction and HILIC-MS/MS Analysis. Anal. Bioanal. Chem. 2024, 416, 1679–1695. [Google Scholar] [CrossRef]
  33. Santasania, C.T.; Bell, D.S. Mechanisms of Interaction Responsible for Alternative Selectivity of Fluorinated Stationary Phases. LCGC Eur. 2016, 34, 86–92. [Google Scholar]
  34. Leardi, R.; Melzi, C.; Polotti, G. CAT (Chemometric Agile Tool), R version 3.1.2. 2023. Available online: https://gruppochemiometria.it/index.php/software (accessed on 2 January 2025).
  35. Baglietto, M.; MacKeown, H.; Benedetti, B.; Di Carro, M.; Magi, E. Increasing Chemical Coverage, Accuracy, and Reproducibility of the Processing Method for Polar Organic Chemical Integrative Samplers. Anal. Bioanal. Chem. 2025, 417, 1567–1580. [Google Scholar] [CrossRef]
  36. Benedetti, B.; Baglietto, M.; MacKeown, H.; Scapuzzi, C.; Di Carro, M.; Magi, E. An Optimized Processing Method for Polar Organic Chemical Integrative Samplers Deployed in Seawater: Toward a Maximization of the Analysis Accuracy for Trace Emerging Contaminants. J. Chromatogr. A 2022, 1677, 463309. [Google Scholar] [CrossRef] [PubMed]
  37. Dolan, J. Flow-Rate Adjustment and System Suitability. LCGC Eur. 2008, 21, 196–199. [Google Scholar]
  38. Linford, M.; Clark, J.; Teutenberg, T. Elevated Temperatures in Liquid Chromatography, Part I: Benefits and Practical Considerations. LCGC Eur. 2013, 2, 78–85. [Google Scholar]
  39. Ortiz, M.C.; Sarabia, L.A.; Sánchez, M.S.; Arroyo, D. Improving the Visualization of the Pareto-Optimal Front for the Multi-Response Optimization of Chromatographic Determinations. Anal. Chim. Acta 2011, 687, 129–136. [Google Scholar] [CrossRef]
  40. Sánchez, M.S.; Ortiz, M.C.; Sarabia, L.A.; Lletí, R. On Pareto-Optimal Fronts for Deciding about Sensitivity and Specificity in Class-Modelling Problems. Anal. Chim. Acta 2005, 544, 236–245. [Google Scholar] [CrossRef]
  41. Benedetti, B.; del Pulgar, J.S.; Di Lena, G.; Lombardi-Boccia, G. Simultaneous Analysis of 21 Bioactive Compounds in Biorefinery Oil: Multivariate Optimization of a Method Based on Liquid Chromatography, Atmospheric Pressure Chemical Ionization and Tandem Mass Spectrometry. Microchem. J. 2021, 170, 106761. [Google Scholar] [CrossRef]
  42. Benedetti, B.; Ceccardi, E.; MacKeown, H.; Di Carro, M.; Magi, E. Exploring the Potentialities of a Biodegradable Polymeric Film in Sample Preparation: An Optimized “White” Protocol to Extract and Quantify Emerging Contaminants in Water. Anal. Chim. Acta 2024, 1311, 342725. [Google Scholar] [CrossRef]
  43. Matuszewski, B.K.; Constanzer, M.L.; Chavez-Eng, C.M. Matrix Effect in Quantitative LC/MS/MS Analyses of Biological Fluids:  A Method for Determination of Finasteride in Human Plasma at Picogram Per Milliliter Concentrations. Anal. Chem. 1998, 70, 882–889. [Google Scholar] [CrossRef] [PubMed]
  44. Matuszewski, B.K.; Constanzer, M.L.; Chavez-Eng, C.M. Strategies for the Assessment of Matrix Effect in Quantitative Bioanalytical Methods Based on HPLC−MS/MS. Anal. Chem. 2003, 75, 3019–3030. [Google Scholar] [CrossRef] [PubMed]
  45. European Commission. Analytical Quality Control and Method Validation Procedures for Pesticides Residues Analysis in Food and Feedm, SANTE 11312/2021 V2, Implemented by 01/01/2024. 2021. Available online: https://food.ec.europa.eu/system/files/2023-11/pesticides_mrl_guidelines_wrkdoc_2021-11312.pdf (accessed on 11 June 2025).
  46. Kruve, A.; Rebane, R.; Kipper, K.; Oldekop, M.-L.; Evard, H.; Herodes, K.; Ravio, P.; Leito, I. Tutorial Review on Validation of Liquid Chromatography–Mass Spectrometry Methods: Part II. Anal. Chim. Acta 2015, 870, 8–28. [Google Scholar] [CrossRef]
  47. Cadena-Aizaga, M.I.; Montesdeoca-Esponda, S.; Torres-Padrón, M.E.; Sosa-Ferrera, Z.; Santana-Rodríguez, J.J. Organic UV Filters in Marine Environments: An Update of Analytical Methodologies, Occurrence and Distribution. Trends Environ. Anal. Chem. 2020, 25, e00079. [Google Scholar] [CrossRef]
  48. Scapuzzi, C.; Benedetti, B.; Di Carro, M.; Chiesa, E.; Pussini, N.; Magi, E. Passive Sampling of Organic Contaminants as a Novel Approach to Monitor Seawater Quality in Aquarium Ocean Tanks. Appl. Sci. 2022, 12, 2951. [Google Scholar] [CrossRef]
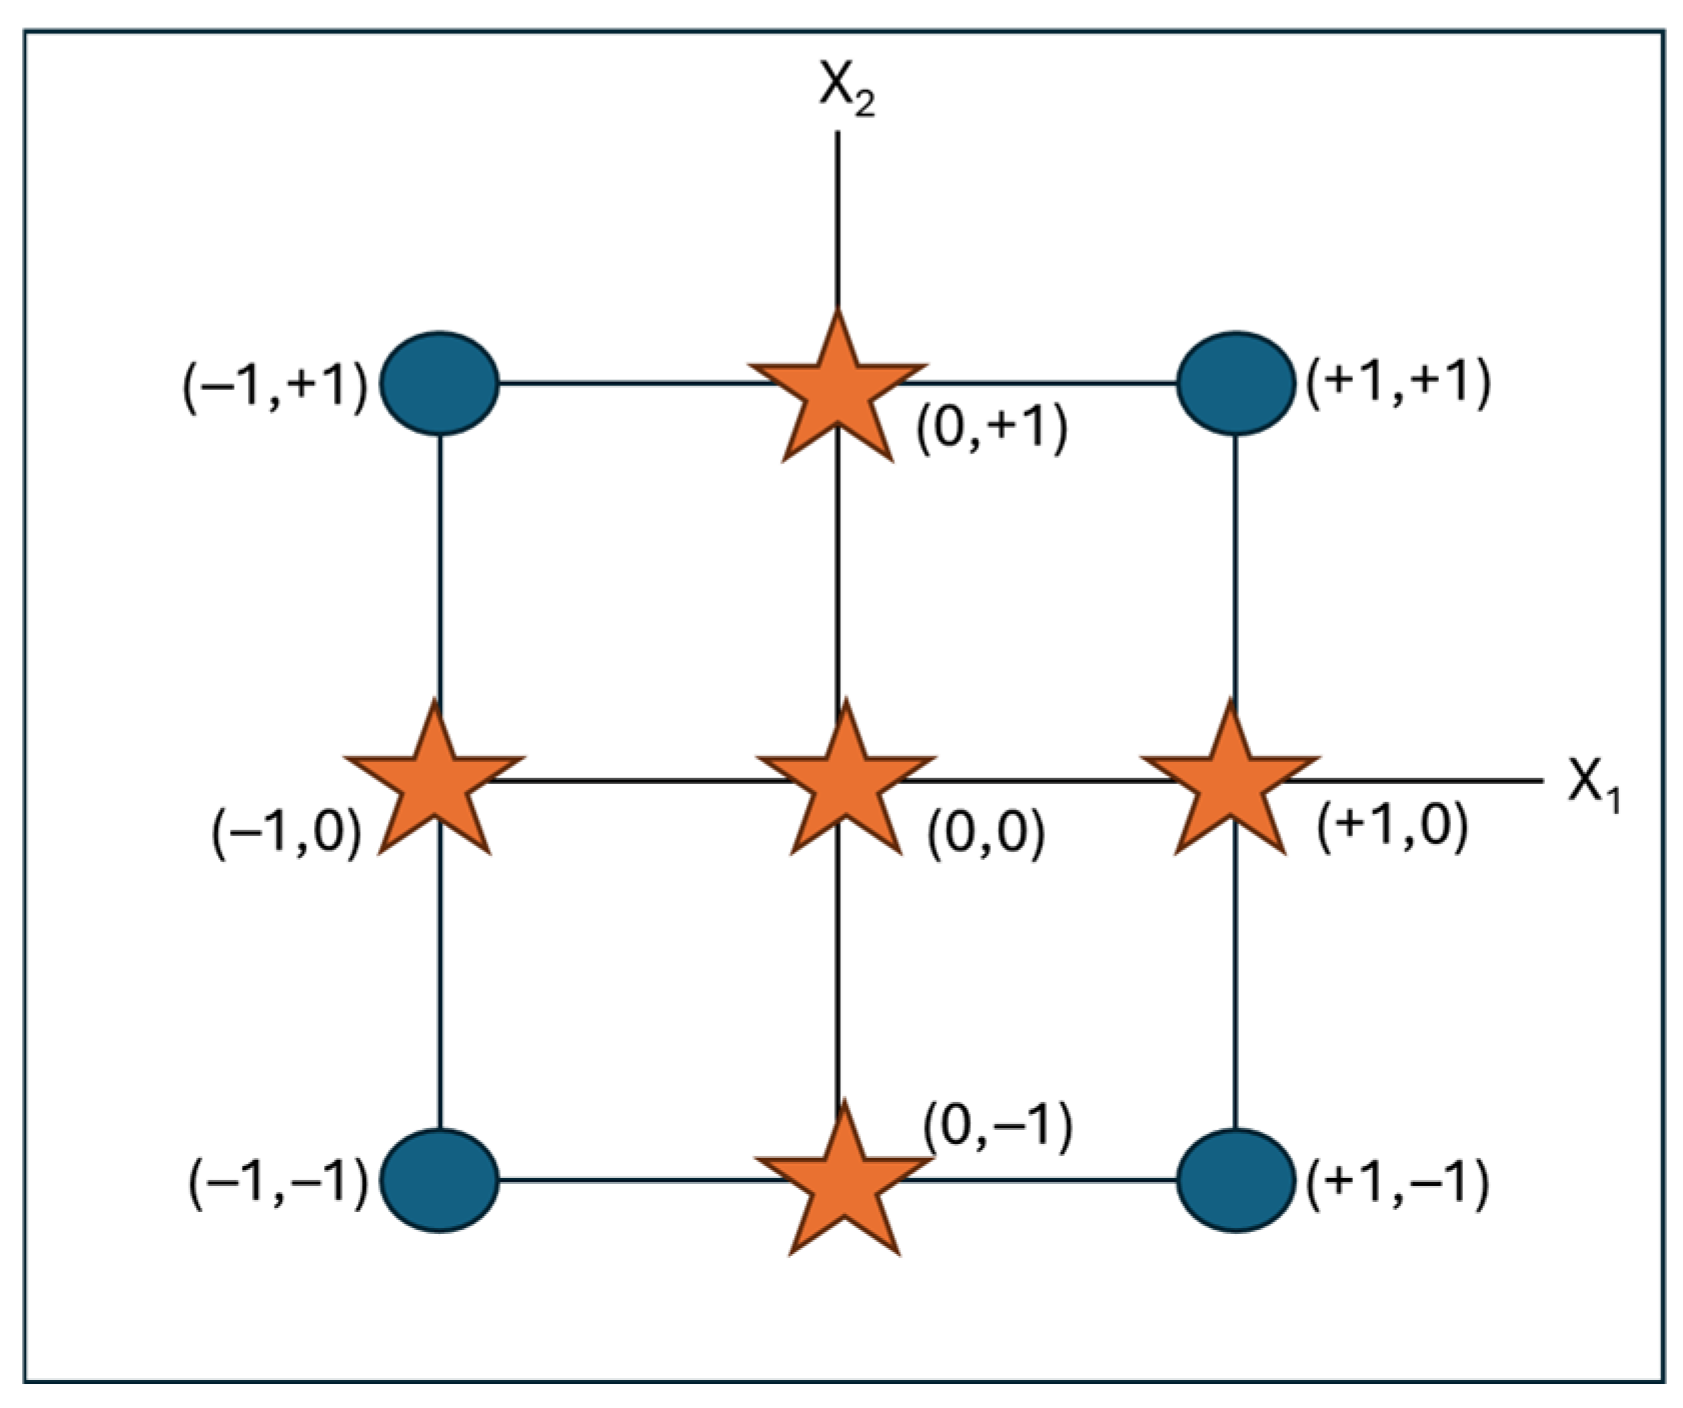
Figure 1. Face-centered design experimental matrix. Blue circles: factorial points; orange stars on the sides of the square: axial points; orange star at the centre of the square: central points.
Separations 12 00257 g001
Figure 2. (a) Coefficient graph for DMNZ (response: RT); (b) response surface for DMNZ (response RT); (c) response surface for CMQ (response W). Legend for the coefficient graph (a): *** = significant coefficient with p-value < 0.001.
Separations 12 00257 g002
Figure 3. Optimized chromatogram for positive ionization analysis (ESI+). 1. Metformin (MTF); 2. Clormequat (CMQ); 3. Daminozide (DMNZ); 4. Nicotine (NCT); 5. Mepiquat (MPQ); 6. Terbutaline (TRBT); 7. Salbutamol (SLBT); 8. Omethoate (OMT); 9. Theobromine (TBR); 10. Atenolol (ATN); 11. Paraxanthine + Theophylline (PRX + TFL); 12. Caffeine (CAFF); 13. Ofloxacin (OFLO); 14. Tetracycline (TETRA); 15. Metoprolol (MTPL); 16. Clenbuterol (CLBT); 17. Carbamazepine (CBZ); 18. Cocaine (COCA); 19. Ketoprofen (KETO); 20. Benzophenone-3 (BP-3); 21. Ethyl Hexyl Methoxycinammate (EHMC); 22. OctylDimetylaminobenzoato (OD-PABA); 23. Octocrylene (OC); 24. Ethyl Hexyl Salycilate (EHS).
Separations 12 00257 g003
Figure 4. Optimized chromatogram for negative ionization analysis (ESI−). 1. Acesulfame K (ACS); 2. Taurine (TRN); 3. Sucralose (SCL); 4. 2,4-DiChloroPhenoxyAcetic Acid (2,4-D); 5. HydroChloroThiazide (HCTZ); 6. Furosemide (FRSM); 7. Chloramphenicol (CMPH); 8. PerfluoroOctanoic Acid (PFOA); 9. PerfluoroOctane Sulfonate (PFOS); 10. Ketoprofen (KETO); 11. BisPhenol A (BPA); 12. Naproxen (NAPR); 13. Estrone (E1); 14. Ibuprofen (IBU); 15. Diclofenac (MTPL); 16. Gemfibrozil (GEM); 17. Triclosan (TCS).
Separations 12 00257 g004
Figure 5. Average matrix effect in the analyzed real samples: (a) ESI+ analytes and (b) ESI− analytes.
Separations 12 00257 g005
Figure 6. POCIS (a) and SPE (b) real sample concentrations. Figure 6b does not show the analytes GEM, HCTZ, CBZ, PFOS as they were quantified at low concentrations and were therefore not clearly visible in the histograms. Complete concentration data can be found in Table S7 of the Supplementary Material.
Separations 12 00257 g006
Table 1. Optimized methods for positive (ESI+) and negative ionization (ESI−) analytes.
ESI+ESI−
Flow (mL min−1)Temperature (°C)Flow (mL min−1)Temperature (°C)
0.337.50.325
GradientGradient
Time (min)H2O %ACN %Time (min)H2O %ACN %
095509010
295519010
2.7455575050
6158581585
81585129010
9.3955
Post-run4.7 min Post-run3 min
Table 2. Selected variables, experimental domain and responses.
ESI+ESI−
FactorsLevelsFactorsLevels
−1 *0+1 −10+1
X1 = Flow (mL min−1)0.10.20.3X1 = Flow (mL min−1)0.20.250.3
X2 = Temperature (°C)2537.550X2 = Temperature (°C)2537.550
Y (Responses): retention time (RT); width at the base of the peak (W).
* In italics the variable coded levels.
Table 3. Selected experiments following the FC design.
ExperimentCoded Values
Flow
(mL min−1)
Real Values
Flow
(mL min−1)
Coded Values
Temperature
(°C)
Real Values
Temperature
(°C)
110.3150
2−10.1150
310.3−125
4−10.1−125
500.2150
600.2−125
710.3037.5
8−10.1037.5
900.2037.5
1000.2037.5
1100.2037.5
Table 4. Explained variance and significance of coefficients for RT models. The coefficients bij in the table refer to Equation (1). NS stands for “not significant”.
Response: RT (ESI+)
AnalytesExplained variance % (min–max)b1b2b12b11b22
Group 1 199.22–99.99%*** (−)*** (−)NS*** (+)NS
Group 2 299.81–99.82%*** (−)*** (+)* (−)*** (+)* (−)
Group 3 389.96–99.98%*** (−)NSNS*** (+)NS
MPQ99.88%*** (−)NS*** (+)*** (+)** (−)
Response: RT (ESI−)
AnalytesExplained variance % (min–max)b1b2b12b11b2
Group 4 499.54–99.89%*** (−)*** (−)*** (+)*** (+)*** (+)
Group 5 599.78–99.99%*** (−)*** (−)*** (+)*** (+)*** (−)
Group 6 699.96–99.99%*** (−)*** (−)*** (+)*** (+)NS
ACS91.95%*** (−)*** (−)NS*** (+)NS
TRN60.23%*** (−)NSNSNSNS
Low explained variance: OFLO, TETRA. 1 Group 1: DMNZ, NCT, TRBT, TBR, PRX + TFL, CAFF, CLBT, COCA, CARB, BP-3, OD-PABA, OC, EHMC, EHS. 2 Group 2: CMQ and MTF. 3 Group 3: SLBT, OMT, ATN, MTPL. 4 Group 4: 2,4-D, SCL, HCTZ. 5 Group 5: FRSM and CMPH. 6 Group 6: PFOA, PFOS, KET, NAP, BPA, DCF, E1, IBU, GEM, TCS. Coefficients significance is expressed as follows: * = significant coefficient with p-value < 0.05; ** = significant coefficient with p-value < 0.01; *** = significant coefficient with p-value < 0.001.
Table 5. Instrumental method performances.
AnalyteLOD
(µg L−1)
LOQ
(µg L−1)
RSD%AnalyteLOD
(µg L−1)
LOQ
(µg L−1)
RSD%
MTF0.0980.3234EHS0.0510.1679
CMQ0.0150.0496ACS0.0130.0447
DMNZ0.3571.1798TRN0.0050.01610
MPQ0.020.06542,4-D0.0730.2427
NCT0.2690.8867HCTZ0.0130.04510
OMT0.0660.21815SCL0.2440.8068
TBR0.2060.6811FRSM0.0470.15414
SLBT0.0410.1365CMPH0.0130.0424
TRBT0.0630.2065PFOA0.0580.1915
ATN0.1000.3306PFOS0.0250.0835
OFLO0.0870.2873KETO0.0520.1738
PRX + TFL0.2190.7247BPA0.1450.47812
CAFF0.050.16510NAPR0.0220.0734
MTPL0.0410.1365DCF0.3121.0295
CLBT0.0250.0836IBU0.7742.5546
COCA0.0340.1139E10.0930.30614
CARB0.020.0677TCS0.1680.5546
TETRA0.0810.2672GEM0.0090.0313
BP-30.0160.0528
EHMC0.0220.0727
OC0.0080.0279
OD-PABA0.0020.0085
Disclaimer/Publisher’s Note: The statements, opinions and data contained in all publications are solely those of the individual author(s) and contributor(s) and not of MDPI and/or the editor(s). MDPI and/or the editor(s) disclaim responsibility for any injury to people or property resulting from any ideas, methods, instructions or products referred to in the content.